 Tatiana Merino-Benítez1
 Luis Antonio Bojórquez-Tapia1*
 Yosune Miquelajauregui1Eduardo Batllori-Sampedro2
- 1Laboratorio Nacional de Ciencias de la Sostenibilidad, Instituto de Ecología, Universidad Nacional Autónoma de México, Mexico City, Mexico
- 2Departamento de Ecología Humana, Centro de Investigación y Estudios Avanzados del IPN, Unidad Merida, Merida, Mexico
The consequences of climate change on different sectors of society are interrelated. The threats posed by rising global temperatures, intensifying extreme weather events, and shifting climatic patterns are becoming increasingly evident all around the world. Policymakers face the daunting task of assessing climate change risks, encompassing impacts and response strategies, to guide sustainability transformations. In this study, we introduce a four-step qualitative Decision Making Under Deep Uncertainty (DMDU) approach in the context of Climate Change Impact Assessments (CCIA). Our goal is to enhance the integration of CCIA into spatial planning, particularly in the Global South, using qualitative system dynamics simulation. Emphasizing the value of qualitative DMDU, we explore vulnerability and resilience through a lens of multi-sectoral and multi-scalar socio-ecological processes. We exemplify our approach by applying CCIA to the coastal zone of Yucatán, Mexico, accounting for social and environmental heterogeneity across the four Regions in which it is administered. Results identify the optimal allocation of climate change mitigation and adaptation policies to address specified resilience in each Region, all of which are required to achieve the overall resilience of the coastal zone. We argue that our qualitative DMDU approach provides an analytical platform to address the trade-offs inherent in the ranking of multiple vulnerabilities related to achieving general resilience.
1 Introduction
The need for understanding and addressing the impacts of climate change dates back to at least the 1800s. Nowadays, there is a clear need for awareness and predictions of the effects of climate change on coastal resilience (Wright and Nichols, 2019). As pointed out by the IPCC (2023), climate change has already caused widespread impacts and associated damage to socio-ecological systems, leading to changes in terrestrial, freshwater, and oceanic ecosystems worldwide. Predictions indicate that these effects will intensify on both natural and human systems, creating greater disparities among regions worldwide. For almost 20 years, international organizations (Dilley et al., 2005; Gallina et al., 2016; IPCC, 2023) have emphasized the importance of adopting a multi-risk approach in Climate Change Impact Assessments (CCIA) across various spatial scales (Jones, 2001; Wilby, 2005; Murali et al., 2020; Ha et al., 2021). In essence, CCIA can be understood as the process of identifying, evaluating, selecting, and designing actions to reduce risk to socio-ecological systems regarding the effects of climate change (Jones, 2001). However, developing climate change adaptation plans that take into account multi-risk at various levels can pose a difficult challenge (Anguelovski et al., 2014). Therefore, identifying key vulnerabilities at regional levels is crucial for creating effective adaptive strategies against climate change impacts. This will require transdisciplinary collaboration involving experts and professionals from academia, federal agencies, local and state governments, nongovernmental organizations, and the private sector to improve understanding and awareness of the various factors contributing to vulnerability in coastal zones (Wright and Nichols, 2019).
One prominent approach to creating effective adaptive strategies is Decision Making Under Deep Uncertainty (DMDU). DMDU encompasses various decision-making and risk management approaches tailored for complex and uncertain conditions (Marchau et al., 2019). DMDU leverages cutting-edge decision analytics, such as modeling massive computational experiments, to enhance decision-making and climate change adaptation planning (Raso et al., 2019; Bartholomew and Kwakkel, 2020; Elsawah et al., 2020; Moallemi et al., 2020). The underlying rationale of DMDU is that, given significant future uncertainties (Bojórquez-Tapia et al., 2022), planning tools should aim to reduce the multiple vulnerabilities of socio-ecological systems without being tied to a single, best-estimate prediction of the future which may turn out to be wrong (Malekpour et al., 2020). In the field of climate change, DMDU has been utilized to identify tipping points and intrinsic fragilities, as well as to design adaptation policies within the tourist and urban sectors (Lempert et al., 2021; Vaghefi et al., 2021; Mannucci and Morganti, 2022). In these matters, decision-making involves designing strategies considering projections toward a future time and committing to short-term actions (Mannucci and Morganti, 2022). The necessity of DMDU frameworks arises due to the socio-ecological system’s complexity in the face of various forms of uncertainties (Bojórquez-Tapia et al., 2022), such as Knightian, linguistic, epistemic, ontological, and deep uncertainty. Particularly, Knightian uncertainty (Knight, 1921) plays a key role in CCIA as the unpredictable and emerging unknown unknowns of the climate crises, which involve highly speculative elements for planning and decision-making. Consequently, there is a need for CCIA approaches that incorporate DMDU so that society can better navigate the complexities of uncertain future scenarios and enhance the resilience of socio-ecological systems.
CCIA involves dealing with four key concepts: vulnerability, resilience, robustness, and co-production of knowledge. Vulnerability refers to the condition of individuals or locations experiencing varying impacts from hazards (Eakin and Luers, 2006; Merino-Benítez et al., 2020). The responses to these hazards depend on a combination of social, institutional, and environmental factors (Eakin et al., 2011). Resilience refers to the capacity of socio-ecological systems to recover, maintain functionality, learn, and adapt after a hazard (Eakin and Luers, 2006). Robustness pertains to the assessment of system performance using different metrics (McPhail et al., 2018). These metrics focus on preventing catastrophic shifts when systems are exposed to hazards (Anderies et al., 2004, 2013). Co-production of knowledge involves the engagement of governments, researchers, and social actors in the planning and decision-making process (Ruiz-Mallén, 2020) to produce multiple outcomes, including new knowledge and innovative ways of integrating knowledge into actionable strategies for sustainability transformations (Wyborn et al., 2019; Barth et al., 2023). We contend that DMDU simplifies the systematic and rigorous examination of these concepts to identify optimal strategies for addressing the impacts of climate change, considering multi-sectoral and multi-scalar socio-ecological processes.
The adoption of conventional DMDU, nevertheless, can be more difficult when applied to CCIA in the Global South (United Nations, 2022, p. 4). The prevailing conditions in the Global South often preclude the application of quantitative simulation models to predict future scenarios to facilitate a rational delineation of public policies to address climate change at specific locations (Anguelovski et al., 2014; Campos et al., 2014). The lack of baseline data and the unavailability of scientific knowledge pose challenges to the development of detailed and accurate models needed for assessing the impacts of policy choices under various conditions or situations (Campos et al., 2014; Calliari et al., 2019; Escudero and Mendoza, 2021). In this setting, rigid reliance on advanced modeling often required by DMDU might not be feasible due to various obstacles, including constrained timeframes, financial limitations, and a deficiency in technical capabilities. Given the intricate nature of CCIA in the Global South, there is a clear call for the development and implementation of innovative and comprehensive approaches that are sensitive to and accommodating of the mentioned limitations (Gallina et al., 2016). These alternative approaches should be designed to offer a more customized and practical means of addressing the methodological hurdles inherent to the Global South’s circumstances.
In this paper, we introduce an approach to address the intricate context and distinctive challenges faced in the Global South regarding climate change adaptation in coastal areas. It addresses climate change as a wicked problem ─ multi-causal, technically complex, controversial, and contested problem that lacks definitive solutions (Rittel and Webber, 1973). Our approach involves implementing qualitative DMDU into CCIA for spatial planning. Our objective is to provide a DMDU option that applies to countries such as Mexico to facilitate long-term planning and policy-making. Our approach brings innovation to DMDU through the application of qualitative system dynamics modeling (Langsdale et al., 2009; Forbus, 2011; Harborne et al., 2017) to generate an array of what is technically called “future States of the World” (SOW) pertinent to a socio-ecological system (Herman et al., 2015; Marchau et al., 2019; Lempert and Turner, 2021). Results enable consensus building regarding adaptation and mitigation policies aimed to enhance resilience at regional scales.
While our approach can be used to analyze socio-ecological systems in any territory at local or regional scales, we demonstrate its effectiveness through the CCIA conducted in the coastal area of Yucatán, Mexico. Mexico is a Global South country exposed to a heightened risk of climate change due to environmental factors such as low, seasonal, and unpredictable rainfall patterns (Samaniego, 2009; Campos et al., 2014). This situation renders the region vulnerable both environmentally and economically (Gay et al., 2006; Ibarrarán et al., 2010; Sáenz-Romero et al., 2012). As emphasized by Campos et al. (2014), climate change represents only one facet of the challenges faced by Mexico. The country has witnessed substantial transformations in its agricultural sector driven by trade agreements, migration, and the adoption of new technologies (Eakin and Luers, 2006). Regarding Yucatán, Audefroy and Sánchez (2017) highlighted that the coastal population has been steadily increasing, coinciding with a rise in the frequency of Category 5 hurricanes in the Gulf of Mexico over the past four decades. These hurricanes are inflicting not only structural damage but also profound impacts on human settlements and livelihoods. Despite preventive initiatives by non-governmental organizations, communities have endured escalating financial losses (Saldana-Zorrilla, 2014). To acquire a comprehensive understanding of the potential implications of climate change in Yucatan’s coastal area, it is imperative to analyze it within the context of its diverse regional characteristics (Wisner et al., 2003; Moser, 2010; Campos et al., 2014).
In this paper, Section 2 provides a brief literature review of the key concepts of our CCIA. Section 3 presents the methodological strategy and gives an example of one specific climate change impact in the study area. Sections 4 to 6, present the results, discussion, and conclusions of the multi-sector and multi-scale analysis through qualitative DMDU.
2 Background
2.1 Vulnerability
The vulnerability or susceptibility of a socio-ecological system to damage depends on the system’s exposure and sensitivity to stress, as well as its capacity to absorb or cope with the stressors’ effects (Eakin and Luers, 2006).
Vulnerability is frequently used in specialized studies and public policy design (Frerks and Bender, 2004; Ruof, 2004). This concept implies different dimensions depending on the field of study in which it is used (Eakin and Luers, 2006; Audefroy and Sánchez, 2017), for example in sociology (social vulnerability) (Cutter et al., 2003; Flanagan et al., 2011; Fordham et al., 2013; Fatemi et al., 2017; Merino-Benítez et al., 2020), economics (financial vulnerability) (Trussel, 2002; Anderloni et al., 2012), architecture and construction (physical vulnerability) (Douglas, 2007; Kappes et al., 2012; Garuti et al., 2022), and anthropology (cultural and organizational vulnerability) (Cannon, 2008; Sabbioni et al., 2008; Gunaratnam, 2013). Nevertheless, disciplinary approaches often offer limited support in determining the relative vulnerability in specific locations, making it difficult to prioritize actions (Luers, 2005).
In DMDU, vulnerability is defined as the performance of decision-making strategies under various uncertain management-relevant timeframes (Brown, 2010). According to Marchau et al. (2019), the assessment starts with a database of runs where each run represents the performance of a strategy in a specific future scenario. Then, classification algorithms, such as the Patient Rule Induction Method (PRIM) (Friedman and Fisher, 1999) or Classification and Regression Trees (CART) (Breiman et al., 1984), along with principal component analysis (Dalal et al., 2013), are utilized to create clear and decision-relevant scenarios from complex strategy-stressing futures.
Our approach combines the DMDU and Luers et al. (2003) concepts of vulnerability. This combination enables the identification of relative vulnerabilities for prioritizing actions at local and regional levels and incorporating multi-vulnerability implications (Gallina et al., 2016) into policy and management decisions. Accordingly, we conceptualize vulnerability in terms of the system’s state relative to a threshold beyond which the system is assumed to be damaged regarding the behavior of climate change stressors (Luers et al., 2003; Luers, 2005; Eakin and Luers, 2006).
2.2 Resilience and robustness
Resilience is a systemic property that stands in opposition to vulnerability. It refers to a system’s capacity not only to recover and maintain its functions after a disturbance but also to learn and adapt, thus reducing future vulnerabilities (Eakin and Luers, 2006). Resilience can be categorized as either general or specified. General resilience relates to the entire system and its ability to withstand all types of shocks, while specified resilience pertains to identifiable systemic components and functions, associated with particular cause-effect mechanisms, and well-defined shocks (Folke et al., 2010).
In critical transition theory (Scheffer et al., 2012; Dakos and Bascompte, 2014), low resilience is linked to tipping points at which a system undergoes “catastrophic” or nonlinear, rapid, and potentially irreversible shift from one stable state to another in response to disturbances, even those caused by minor changes in forcing factors. When a system crosses a tipping point or catastrophic threshold, its functions are significantly compromised, often resulting in undesirable outcomes.
In accordance with catastrophe theory, minimal parameter shifts may cause abrupt changes in system states (Roopnarine, 2008). These catastrophic changes have been studied in economics in terms of overshooting related to short-run fluctuations in exchange rates following monetary shocks and in political science in terms of collapse of socio-political systems (Trainter, 1988). The common denominator is the loss of systemic complexity and heterogeneity. Similarly, it has long been understood that there are limits to the rate of change beyond which coastal landscapes cannot cope and degradation processes will prevail. Therefore, current research emphasizes the determination of critical tipping points under different circumstances for predicting and managing potential undesirable shifts in coastal systems (Wright and Nichols, 2019, p. 145).
Efforts to maintain resilient systems depend on society’s “adaptability,” which is the ability to steer a system within a sustainable trajectory, as well as “transformability,” which is the capacity to create a fundamentally new system when ecological, economic, or socio-political conditions become untenable (Walker et al., 2004). Nevertheless, adaptability and transformability are challenged by conflict and disagreement among social groups over the normative dimensions of natural resource use, individual and collective economic goals, as well as the elements and attributes that constitute an “ideal” or “desired” system. This means addressing climate change hazard vulnerability through the lens of socio-ecological planning and ongoing resource management at various spatial scales (Bojórquez-Tapia and Eakin, 2018), which in turn necessitates the collaborative generation or “co-production” of knowledge (see below).
Like resilience, robustness is concerned with maintaining systemic functions despite variations in forcing variables. Resilience helps define the decision-making context and centers on building long-term “safe-fail” strategies aimed at enhancing the overall adaptive capacity of systems to withstand, self-organize, and recover from disruptions and uncertainties. Yet, the focus of resilience on system adaptation might have limited practical use. In contrast, robustness links system dynamics to performance and trade-off metrics, providing specific measures to identify vulnerabilities in complex socio-ecological systems and guide sustainability policymaking. Robustness centers on proactive short- to medium-term “fail-safe” strategies aimed at preventing systems from undergoing catastrophic shifts when exposed to disturbances (Anderies et al., 2004, 2013). In DMDU, robustness usually aligns with Savage’s criterion of minimizing maximum regret (Lempert et al., 2021).
2.3 Co-production of knowledge
Within the context of climate change, the concept of co-production of knowledge is rooted in two distinct yet interconnected ideas (Ruiz-Mallén, 2020): descriptive or denotative, and normative or connotative. Descriptive co-production of knowledge adopts an analytical focus on the lack of neutrality in science and policy, emphasizing how social and cultural norms influence the generation of both scientific knowledge and planning decisions (Jasanoff, 2004). This type of knowledge co-production helps in understanding the power dynamics involving multi-level research and policy concerning climate change (Avelino, 2017, 2021).
Normative co-production of knowledge underscores the importance of involving communities in decision-making to improve the scientific basis of projects (Van Kerkhoff and Lebel, 2015). It is considered essential for strengthening the links between science, policy, and society, and is a key component in effectively addressing climate change (Bremer and Meisch, 2017; Wyborn et al., 2019). As highlighted by Ruiz-Mallén (2020), p. 3 co-production of knowledge in practice “implies the recognition by climate change experts and decision-makers of the crucial role that local knowledge, expertise, and preferences have for developing innovative and successful adaptation strategies and preventing from maladaptation practices.” In this regard, co-production processes should address issues such as culture and heritage protection, inclusion, health, and information access (Muudeni, 2023), within a safe space of collaboration (Clark and Holliday, 2006).
In DMDU, as pointed out in Bojórquez-Tapia et al. (2022), significant advancements have been achieved related to co-production of knowledge, including the inclusion of a broader array of stakeholders and the explicit consideration of multiple objectives and power dynamics in the way problems are being framed (Avelino et al., 2014; Moallemi et al., 2020; Jafino et al., 2021), the assessment of stakeholder interventions (Eriksen et al., 2021), and the development of collaborative methodologies to facilitate sustainability transformations (Wyborn et al., 2019). We argue here that integrating qualitative DMDU methods with contexts of knowledge co-production can be particularly constructive for CCIA. It is worth noting that another context where DMDU methods could provide analytical support to collaborative CCIA is public–private partnerships. In this context, co-production takes place as the process of “co-creating” green business models to address social and environmental problems (Wamsler, 2016; Ruiz-Mallén, 2020). In this way, DMDU may empower consumers to actively be involved in corporate decision-making that shapes and sustains urban development through CCIA (Lan et al., 2017; Ma et al., 2020).
3 Methods
3.1 Study area
Yucatán state, located in the northern part of the Yucatán Peninsula (Figure 1), is predominantly on a plain formed by the rise of an underwater platform. This platform is composed of Tertiary limestone rocks exhibiting a sequential distribution, with the older rocks in the south (Eocene-Paleocene) and the younger rocks in the north (Pliocene–Miocene). The Pliocene sediments form a karstic system characterized by deposits of dolomite and evaporites (Perry et al., 1995), which contribute to the development of an extensive and mature aquifer (Marín and Perry, 1994; Escolero et al., 2000; Bauer-Gottwein et al., 2011). This karstic system has high porosity and permeability, making it highly vulnerable to contamination (Marín and Perry, 1994). In the karstic system, “cenotes”—dolines or sinkholes found in karstic systems globally—are mainly concentrated in the eastern part of the state due to natural calcite dissolution. In the western region, these cenotes align along the edge of the Chicxulub crater formed by a meteorite impact during the Cretaceous period, approximately 64 million years ago (Pope et al., 1993; Perry et al., 1995; Pérez-Ceballos, 2011). Over the past two million years, the coastal zone has experienced notable variations in climate and geological features, particularly during the Pleistocene glaciations. The current coastline took shape during the Holocene transgression in the last ten thousand years. In the coastal region, there is an aquitard that confines the aquifer and exerts pressure on it, extending inland for approximately 20 km (Figure 1). This pressure results in a multitude of springs in marshy, estuarine, and marine areas (Canul-Macario et al., 2020). The depth of the aquifer and aquitard along the coast varies from a few meters to over 50 meters. The aquifer is at risk of overexploitation and saline intrusion due to excessive freshwater extraction in certain coastal areas.

Figure 1. Yucatán, Mexico.
Yucatán features a tropical climate marked by hot and humid conditions, distinct wet and dry seasons, and consistently high temperatures ranging from 25°C to 35°C throughout the year. The wet season typically spans from June to October, accounting for most of the annual rainfall, often with heavy and frequent rain accompanied by thunderstorms. Precipitation levels vary across the region, with a mean annual gradient of 200 to 400 mm in the central-northern coastal area and 1,000 to 1,200 mm toward the southeast (Orellana et al., 2009; SEDUMA, 2010). The dry season typically extends from November to May, characterized by lower humidity levels and reduced rainfall. Yucatán is susceptible to hurricanes, primarily during the late summer and early fall months, typically from August to October. Hurricanes and tropical storms can bring substantial rainfall, strong winds, and the potential for flooding to the region. Vegetation includes low deciduous forests in the semi-arid northern areas and sub-deciduous medium to tall jungles in the southern and southeastern Regions. In coastal wetlands, vegetation includes algae meadows and seagrass beds, whereas along the shoreline it includes dunes in sandy bars and beaches, mangroves associated with freshwater springs known as “petenes,” savannas, palm groves, reed beds, as well as floodable lowland jungles in the south (Casáres, 2006).
Yucatán is divided into seven administrative units known as “Regions” (Figure 1): I West, II Northeast, III Central, IV Central Coast, V Northeast, VI East, and VII South. Region II Northeast has the highest population, with 58% of the total population, including the cities of Mérida (890,000 inhabitants) and Kanasín (96,000 inhabitants), with a population density of 300 people per square kilometer. The coastal zone includes Regions I, II, IV, and V (from now on RI, RII, RIV, and RV, respectively).
Among the initial measures to address climate change in the state, the Special Program of Action for Climate Change (Programa Especial de Acción ante el Cambio Climático, PEACC) was developed (DOGEY, 2014). This program outlines the steps to promote adaptation and mitigation processes to climate change in the state. However, a limitation of the PEACC is the absence of prioritization regarding the actions and locations for implementing climate change adaptation measures. The research presented here contributes to identifying these priorities.
3.2 Methodology
Our qualitative DMDU approach draws from Herman et al. (2015) taxonomy of robustness framework and incorporates three of the four taxonomy Steps while adding a fourth one to create a comprehensive methodological framework consisting of four steps: Alternatives, States of the world, Robustness measures, and Integration (Figure 2). In response to the imperative of empowering social actors to guide sustainability transformations (Bojórquez-Tapia and Eakin, 2018), these four steps are tailored to the constraints prevalent throughout the Global South.
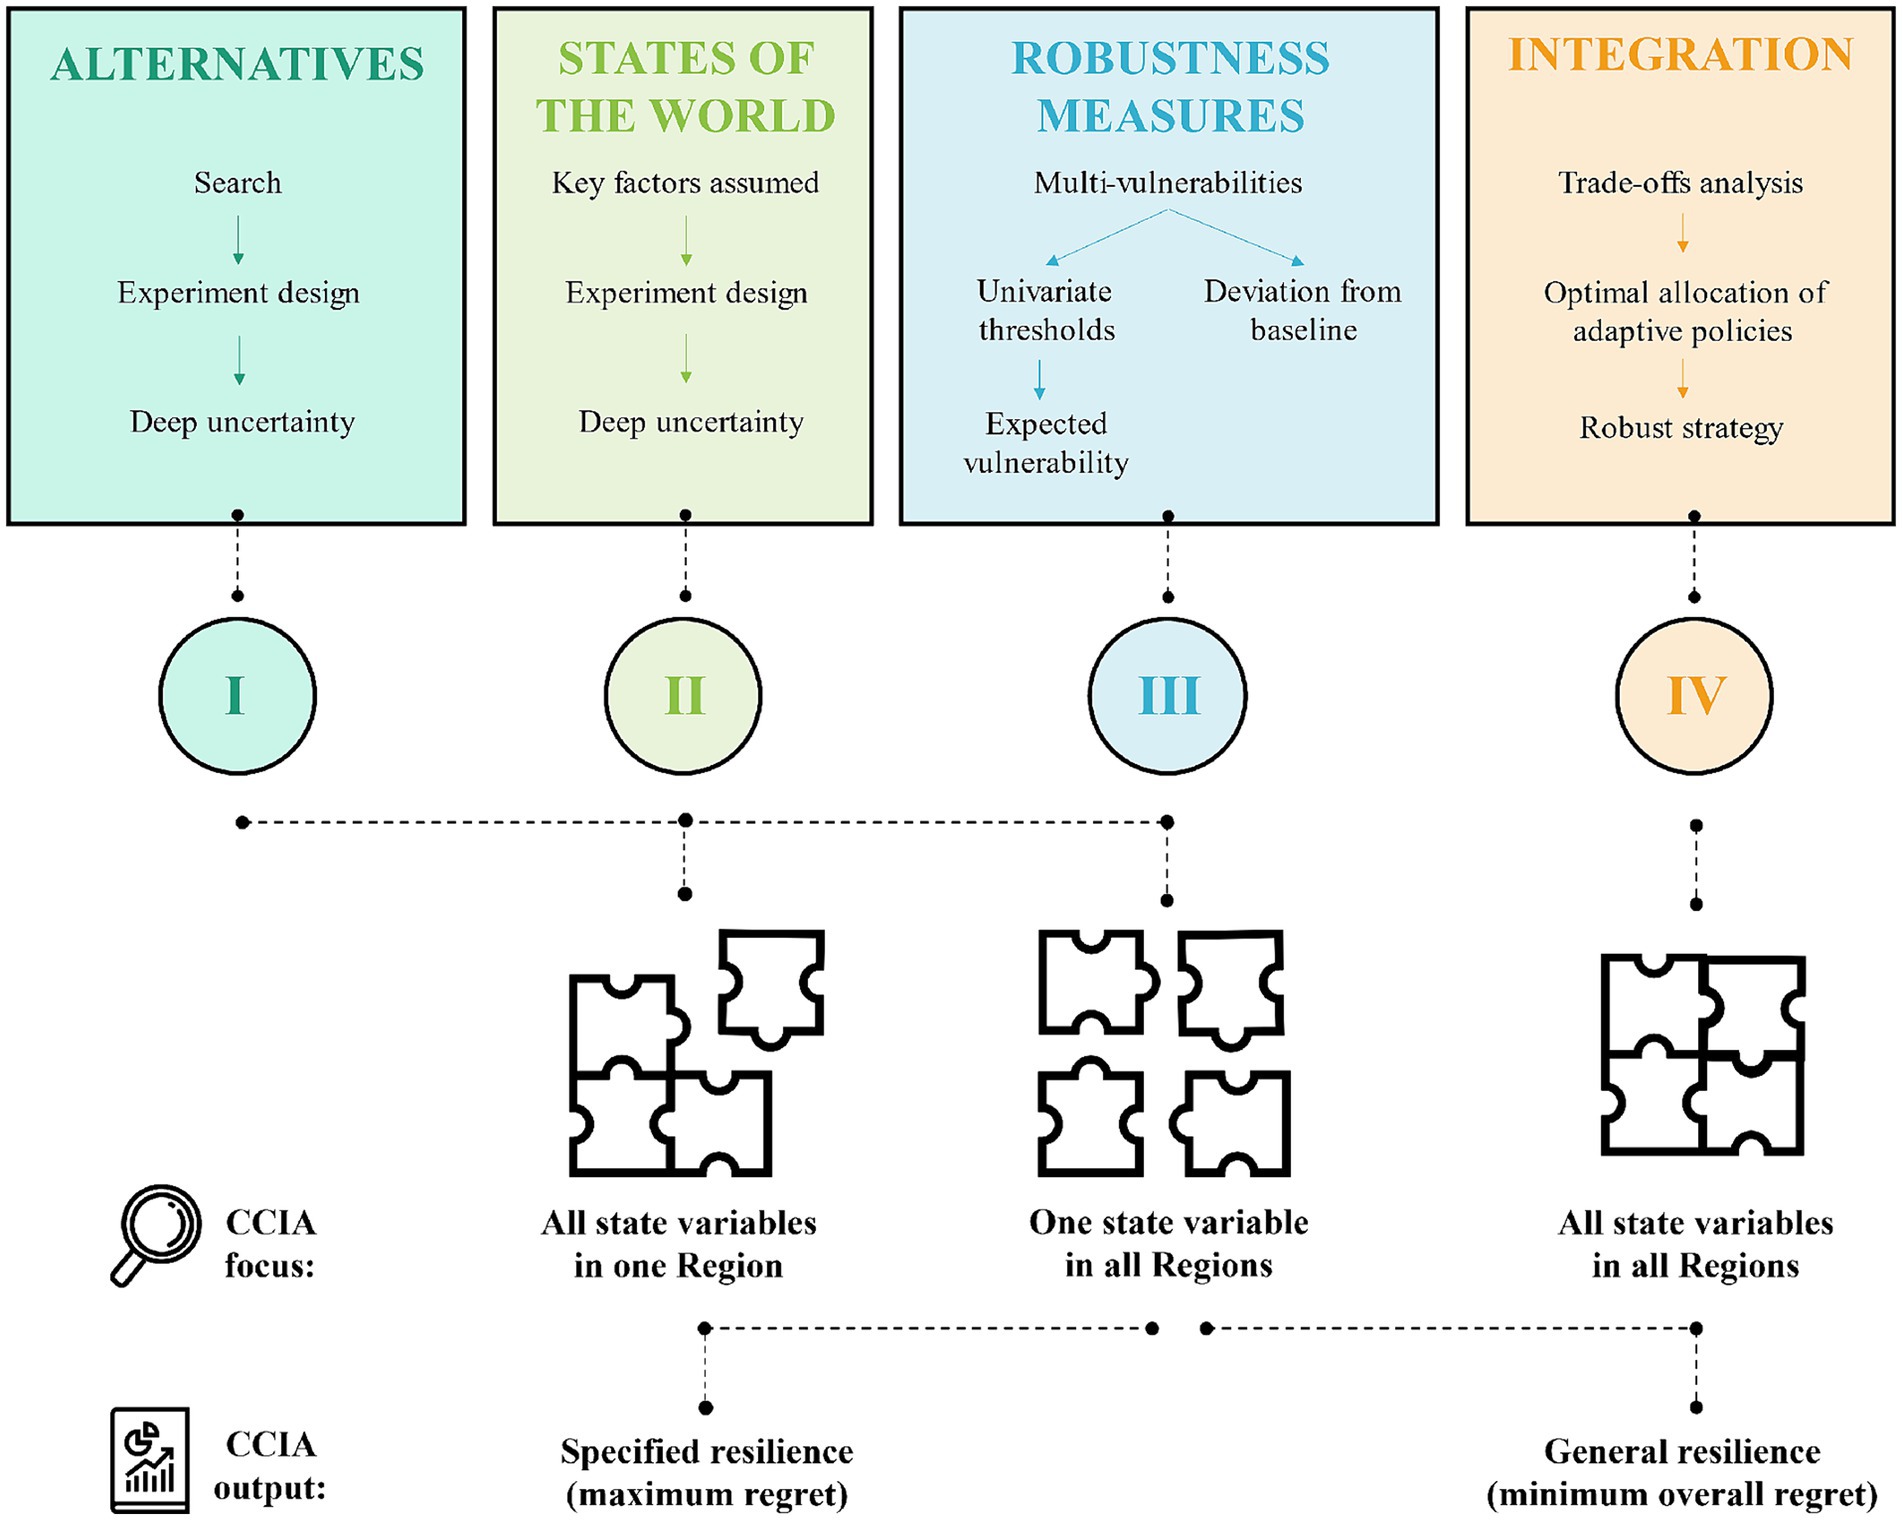
Figure 2. DMDU methodological strategy.
Essentially, our approach involves a stepwise application of Savage’s criterion of minimizing maximum regret to formulate a robust strategy to enhance general resilience. This strategy entails identifying and addressing the most critical risks in an order that minimizes the potential for undesirable outcomes. Since the worst SOW corresponds to the maximum risk of transitioning to a low-resilience state, minimizing maximum regret involves identifying the optimal order across Regions (minimum regret) for addressing the worst SOW (maximum regret) of each state variable.
Each Step (Figure 2) consists of various tasks conducted in parallel to a series of participatory workshops. Step I focuses on generating the socio-ecological system and conducting massive computation experiments to produce alternative SOW. Step II involves examining the specified resilience for each state variable in every Region and identifying the worst SOW based on the maximum regret criterion. Step III aims to identify the expected vulnerability of each variable in all Regions and determine the general resilience of the coastal zone. Step IV, the respective tasks aim to identify a robust strategy using the criterion of minimum overall regret. The details of these Steps are explained below.
One challenging aspect of qualitative DMDU is the validation of the simulation outputs regarding the alternative SOW. The key issue is whether the KSIM comprehensively captures the entire spectrum of relevant climate change vulnerabilities. The focus is on the capacity of the qualitative simulation in depicting the worst SOW, which, due to its undesirable and uncertain nature, should be prevented. Experts from diverse disciplines perform qualitative validation, assessing the model’s ability to capture key system dynamics, reviewing logic, causal relationships, and hypotheses. They provide feedback on conceptual validity and relevance in addressing climate change vulnerabilities. The experts then verify whether the simulation covers all dimensions of climate change vulnerabilities within the alternative system, ensuring reliable and representative outputs.
It is important to acknowledge that our approach enables the identification of vulnerabilities that require strategic attention from the standpoint of regional planning. It thus falls short in prescribing specific actions. Instead, the method is confined to pinpointing the areas where prioritization of such actions is deemed necessary.
3.2.1 Step I: alternatives
Step I involves the identification of the decision alternatives to be considered in our CCIA. It includes three tasks: search, experiment design, and deep uncertainty analysis (Figure 2). Search entails the definition of the composition, structure, causal mechanisms, and context of a social-ecological system (Bunge, 2004). The composition refers to the set of ecological and socioeconomic variables of a system. The structure, or architecture, refers to the collection of all the connections among these elements. The causal mechanisms refer to the processes that occur within a system and endow it with its behavior. Typically, these mechanisms involve a long sequence of phenomena that occur in an orderly fashion within a specific timeframe and interact with each other. The context refers to the set of external factors with which a system interacts. To gather the set of variables, causal mechanisms, and knowledge about system performance under uncertainty, seven participatory workshops are carried out focused on seven key forcing variables of systemic change, namely (1) urban and industrial sprawl, (2) agriculture, (3) cattle ranching, (4) swine and poultry plants, (5) tourism, (6) power generation, and (7) climate change. During these workshops, we followed Van den Belt’s (2004) approach to the implementation of mediated modeling to develop an influence diagram of the socio-ecological system model of Yucatán. Accordingly, seven influence diagrams are developed to establish a common language and understanding of the system dynamics with the participants. The goal is to address the challenges posed by the discursive interactions during the workshops, which ultimately include inaccurate expressions and polysemous terms concerning the causal mechanisms between the environment, socioeconomic activities, and climate change. The seven influence diagrams are merged into a single socio-ecological system model, comprised of 44 variables and 191 causal interactions, for each coastal administrative Region (RI, RII, RIV, and RV).
Experiment design involves the implementation of the K-Simulation (KSIM), a qualitative system dynamics algorithm (Kane, 1972; Kane et al., 1973; Black et al., 1994). The advantage of using the KSIM lies in its relative simplicity, which enables laypeople to achieve a rigorous and replicable representation of the socio-ecological system. The KSIM entails the development of two matrices, and , the former representing cumulative interactions, referred to as , and the latter representing instantaneous interactions, referred to as . Participants, drawing on their expertise, evaluate both and according to the interaction’s type and magnitude, using the influence diagram during the workshops. Regarding the type, participants evaluate an interaction as positive, when a change in the forcing variable led to a change in the state variable in the same direction, or as negative, when the change in the state variable occurred in the opposite direction. Regarding the magnitude, participants use a numerical-linguistic scale to estimate the values of and within the range :
With this scale, users have the flexibility to apply the linguistic scale expressions as they see fit. This linguistic scale is derived from stimulus–response relations and includes absolute numbers ranging from 1 to 9, in line with Weber-Fechner and Miller laws of psychophysics (Vargas, 1982; Saaty, 2001). These values approximate to the nearest integer the relative dominance of either allegation or plausibility relative to randomness. Miller’s Law provides a guideline for determining the suitable number of linguistic variables in a scale, asserting that people can effectively process and remember 7 ± 2 elements of information. This qualitative principle categorizes responses into high, medium, and low, with further subdivision yielding nine meaningful distinctions. Moving on, the Weber-Fechner law describes the logarithmic relationship between stimuli and perceived intensity.
The implementation of the KSIM involves solving for the following differential equation:
where is the derivative of with respect to time, , and are the values of the two interaction matrices .
The KSIM allows for the formulation of a mathematical model as a qualitative representation. Qualitative variables are depicted within closed intervals, , as continuous functions, , where is differentiable in , has a finite number of inflection points in , and exhibits limits and . This technique is versatile, enabling the integration of quantitative and qualitative data into a single, organized, and coherent analytical framework. Thus, a team of experts with diverse backgrounds can explore the socio-ecological system’s structure until they find a representation that is satisfactory and sufficient. In this way, the KSIM streamlines the application of dynamic simulation as a tool for capturing, integrating, and interpreting diverse perspectives that, due to their disciplinary nature, are always incomplete and contradictory.
Subsequently, two distinct contexts of external factors interacting with the social-ecological system are examined: business-as-usual (BA-context) and climate change (CC-context). The calibration of the BA entails using information gathered from participants’ expertise, distribution maps of socioeconomic activities, and statistical data on past regional behavior. The calibration process includes iterative adjustments of parameters and to optimize the agreement between the simulated and empirical data. In the case of the CC-context, the calibration process includes variations in temperature, precipitation, and evapotranspiration, as well as the intensity and magnitude of extreme hydrometeorological and salinization events, considering the Representative Concentration Pathway scenarios, RCP4.5 and RCP8.5, set up for the 5th IPCC Assessment Report (IPCC, 2014; INECC, 2016; Gerstengarbe et al., 2015 and Pedersen et al., 2022). A deep uncertainty analysis is conducted to account for the diverse viewpoints among participants regarding model parameterization and the significant impacts of climate change on ecological and socioeconomic variables. The deep uncertainty analysis includes a Monte Carlo simulation of 1,000 alternative outcomes, utilizing uniform probability distributions for , , and , utilizing the Crystal Ball® software.
3.2.2 Step II: states of the world
Step II involves the selection of the most adverse SOW. It includes three tasks: key factors, experiment design, and deep uncertainty (Figure 2). Key factors of climate change are identified by participants and are corroborated with a literature review. For example, in our illustrative example described below, the key factors encompassed, as forcing variables of climate change, the impact of hurricane-related vulnerability ), precipitation ), temperature ), aquifer quality ), and aquifer recharge ); and as state variables, coastal wetlands ), aquifer specific vulnerability ), beach-dune ecosystems ), urban zones , and the traditional milpa systems characteristic of Maya communities ).
Experiment design identifies the most vulnerable SOW using a commensurate scale for comparing multiple vulnerabilities in relation to the corresponding critical thresholds. Accordingly, the vulnerability condition of a state variable, , is estimated as follows (Luers et al., 2003; Luers, 2005):
where is the change in the state variable, is the change in the forcing variable, is the distance of the state variable to an undesirable condition threshold, is the predetermined threshold, and are the maximum and minimum values, respectively, and and are indices for state and forcing variables, respectively.
The numerator in depicts the relative effect of a driver on a state variable, whereas the denominator depicts how important the effect is in relation to a critical threshold of . By calculating the ratio , this step provides a standardized metric for comparing multiple vulnerabilities within the system. This allows decision-makers to prioritize actions based on a consistent measure that considers both the relative impact of drivers on state variables and their importance concerning critical thresholds. The goal is to focus on vulnerabilities that have a more substantial impact and are closer to or surpass critical thresholds, aiding in more effective decision-making and resource allocation at the local and regional levels.
Deep uncertainty analysis aims to account for the multiple possible outcomes of public policies related to mitigation and adaptation strategies in the four coastal Regions. To this end, the SOW that corresponded to the worst effects of climate change during the 25-year simulation period are identified. Scenario discovery is then performed through Classification and Regression Trees (CART) to partition the simulation database, , into orthogonal subsets, (Breiman et al., 1984; Hartshorn, 2016). The partition is based on , which determines the membership of the orthogonal subset from its vulnerability condition, , and the partition parameter, (either first quartile, median, mean, or third quartile):
is systematically varied in pursuit of a that satisfies two criteria: (1) the inclusion of a causal mechanism and (2) the creation of more homogeneous subsets based on the Gini coefficient (Lerman and Yitzhaki, 1989).
3.2.3 Step III: robustness measures
Step III consists of the evaluation of the climate-change-related effects over the state variables in all Regions to estimate maximum regret. It includes four elements: multi-vulnerabilities, univariate thresholds, deviation from baseline, and expected vulnerability (Figure 2). Robustness is a function of expected vulnerability (or projected susceptibility of a region to climate impacts) and deviation from baseline (or divergence of a CC-context from BA-context). From the output of Step II, subset is identified as the worst SOW considering the causal mechanism reflected in the CART branching cuts, a probability of occurrence threshold (e.g., > 0.05), and the Gini coefficient. The evaluation entails using expected vulnerability as the comparison of the system states at the initial () and the final () simulation times. This comparison of multi-vulnerabilities is visualized with parallel coordinates (Savoska and Loskovska, 2009; Johansson and Forsell, 2016). The expected vulnerability, , of the -th state variable in the -th region is obtained as follows:
where is is the change in the mean of state variable at initial and final simulation times, is the probability of occurrence.
Estimating maximum regret involves the use of two metrics: univariate/multivariate thresholds and deviation from baseline conditions. We implement univariate threshold and deviation from baseline metrics to evaluate the regret associated with the multi-vulnerabilities under both BA-context and CC-context. The univariate threshold metric involves establishing an undesirable condition threshold, , as a measure of univariate regret. This threshold represents the specific location within the decision space under either BA-context or CC-context, such that if an SOW exceeds this threshold, it is considered regrettable.
The deviation from baseline conditions metric involves using the Euclidean distance between CC-context from BA-context (or base line) as a measure of deviation from the baseline, , where the greater the deviation, the higher the level of regret, formally:
The interpretation of the deviation from baseline conditions depends on the relative proximity between the values in the Euclidean space. Relatively close values imply low climate change effect, while relatively farther values imply high climate change effect.
3.2.4 Step IV: integration
Step IV involves the design of a robust climate change adaptation strategy that synthesizes the robustness measures of expected vulnerability and deviation from baseline for all the state variables and Regions (Figure 2). This synthesis is accomplished through trade-off analysis to prioritize climate change risks. Trade-off analysis involves finding a balance between the expected vulnerability under the baseline (BA-context) and climate change (CC-context). The optimal allocation of adaptive policies involves the implementation of Savage’s decision criterion. This criterion focuses on minimizing the overall regret while enhancing general resilience across the entire coastal zone. Savage’s decision criterion is implemented through the implementation of Gower’s residuals (Gower, 1966; Digby and Kempton, 1987) that quantify the relative degree of regret across Regions and state variables. Accordingly, the deviation from the baseline results was arranged in a matrix , which was then adjusted by rows and columns through Gower’s double-centering procedure:
where is the Gower’s residual, is the deviation from the baseline, is the mean deviation from the baseline of the -th state variable, is the mean deviation from the baseline of the -th region, is the mean of the whole matrix.
The robust strategy is associated with prioritizing positive residuals, indicating stronger regret, over average (values close to zero) and negative ones, which suggest weaker regret. Because the Gower residuals are in a ratio scale, the magnitude of the value is meaningful, and in this context, it indicates the level of priority. As the magnitude of the Gower residual value increases, the level of priority also increases proportionally. Gowers’s residuals capture and quantify the variations between BA- and CC-contexts across all Regions simultaneously.
3.3 Example
In this section, we illustrate Steps I, II, and III of our approach (Figure 2) for obtaining the SOW for one state variable (aquifer vulnerability) in the BA-context for Region I West (RI).
3.3.1 Step I
Let us consider a causal mechanism identified during the search involving the impact of climate change of the aquifer formally:
where is climate change, is precipitation, is aquifer recharge, is aquifer volume, and is aquifer vulnerability.
Experiment design involving the KSIM simulated the causal mechanism using value ranges for parameters , , and (see Supplementary materials S2–S4) estimated by the stakeholders in the participatory workshops. Then, from the deep uncertainty analysis, 1,000 alternatives were depicted for the five variables involved in the mechanism. The output accounts for the diverse viewpoints among participants regarding the model parameterization and the 1,000 alternatives states of the five variables involved.
3.3.2 Step II
The vulnerability of the aquifer, , was estimated as the proportion of the change in vulnerability, , attributed to the change in recharge, , subject to the undesirable condition threshold, , corresponding to the maximum value, , at ; formally:
The choice of reflected the premise that the future state of the aquifer should not deteriorate beyond the worst vulnerability observed today. Results of scenario discovery (Figure 3) yielded that the worst state of the world for in RI was
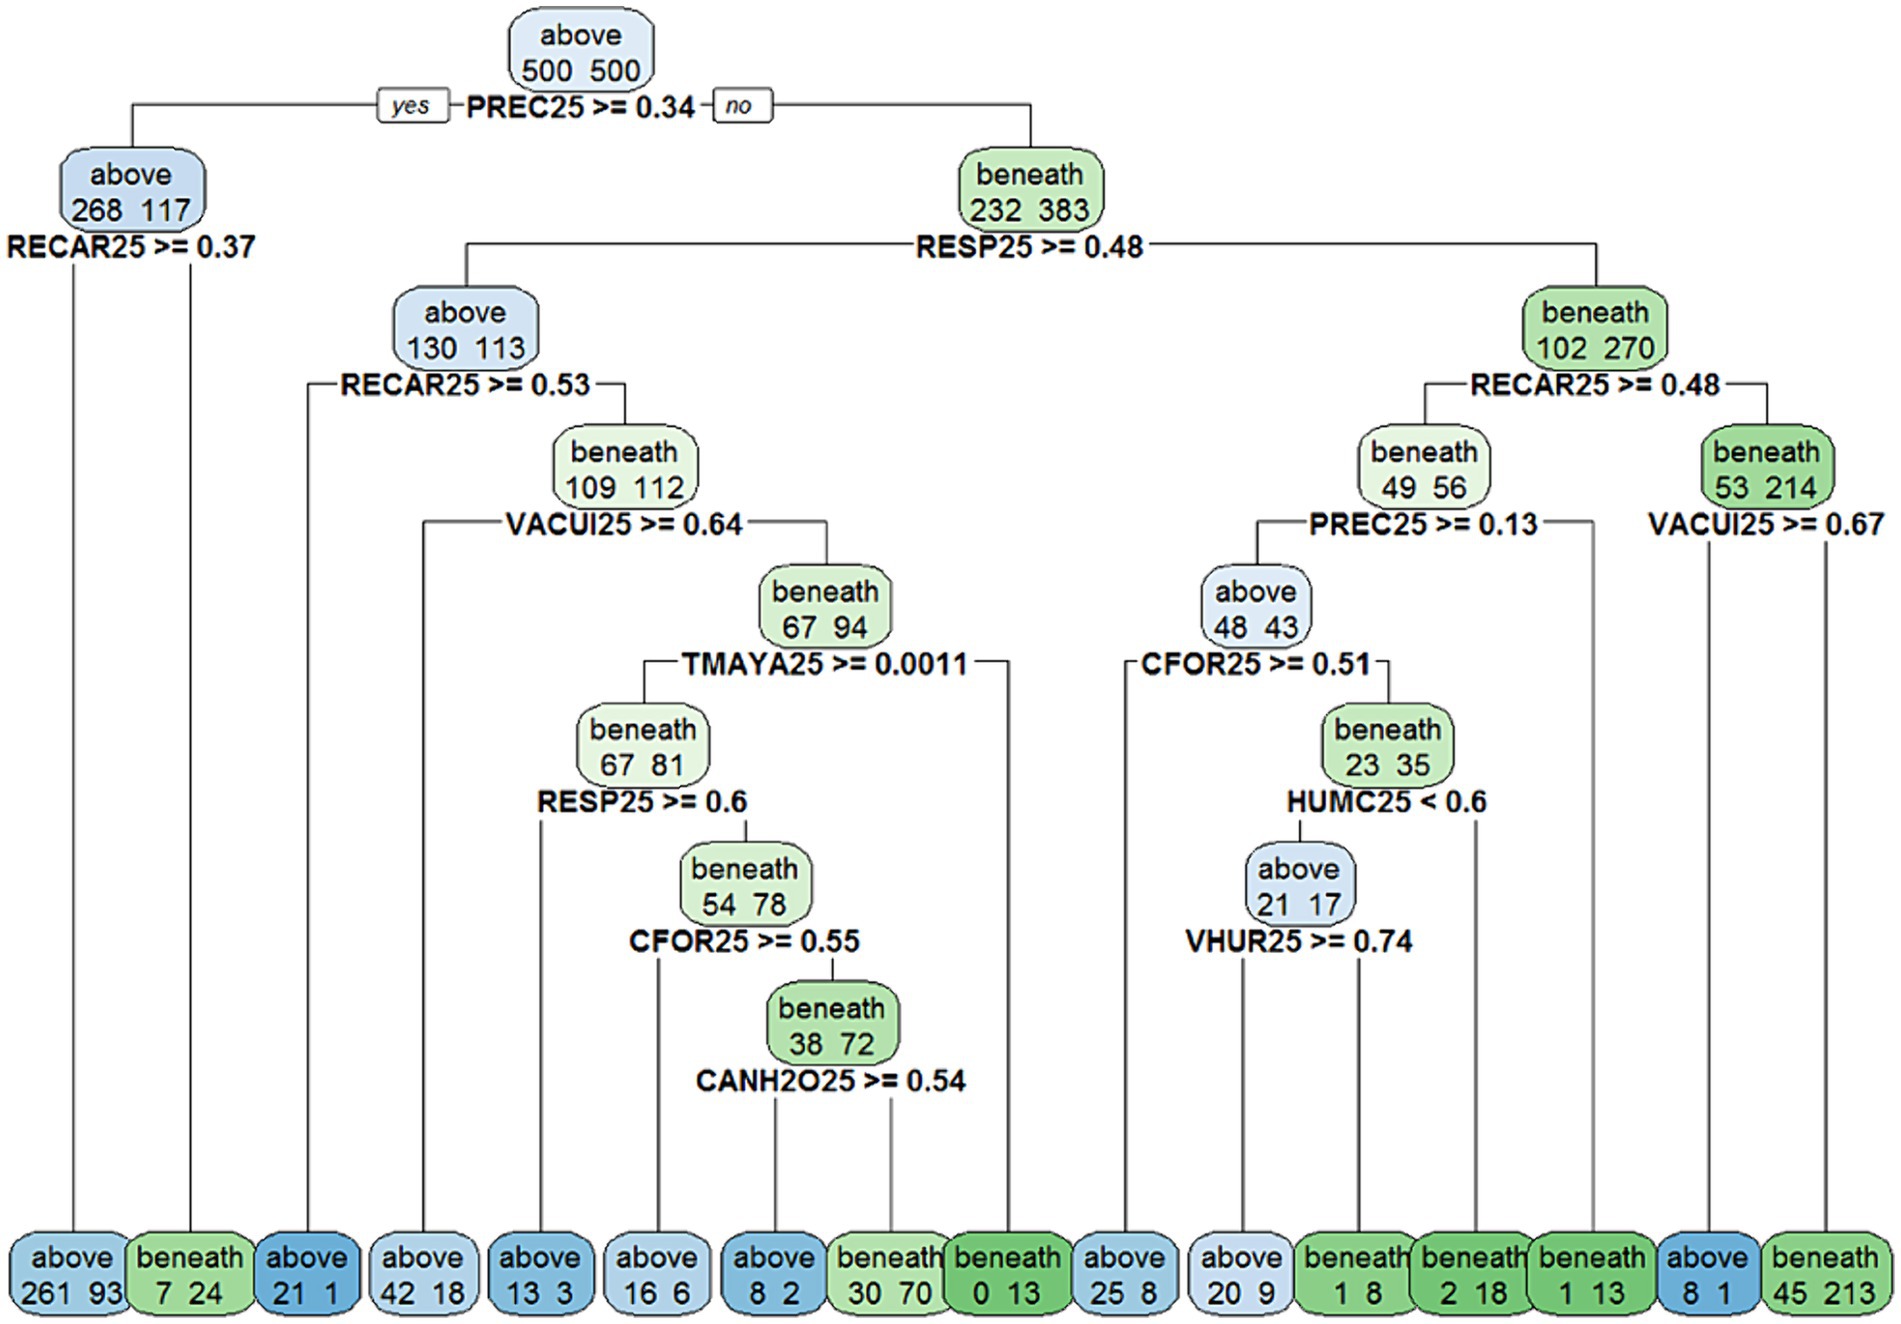
Figure 3. CART for RECAR → VACUI at final simulation time (t25), PREC25 (precipitation), RECAR2 (aquifer recharge), RESP25 (swine plant wastes), VACUI25 (aquifer vulnerability), TMAYA25 (Tren Maya megaproject), CFOR25 (forest cover), CANH2O25 (aquifer volume), HUMC25 (coastal wetlands), and VHUR25 (vulnerability to hurricanes).
Parallel coordinates (Figure 4) revealed that, as climate change on average increased during the simulation time , precipitation decreased , aquifer recharge decreased , aquifer volume decreased , and aquifer vulnerability increased .
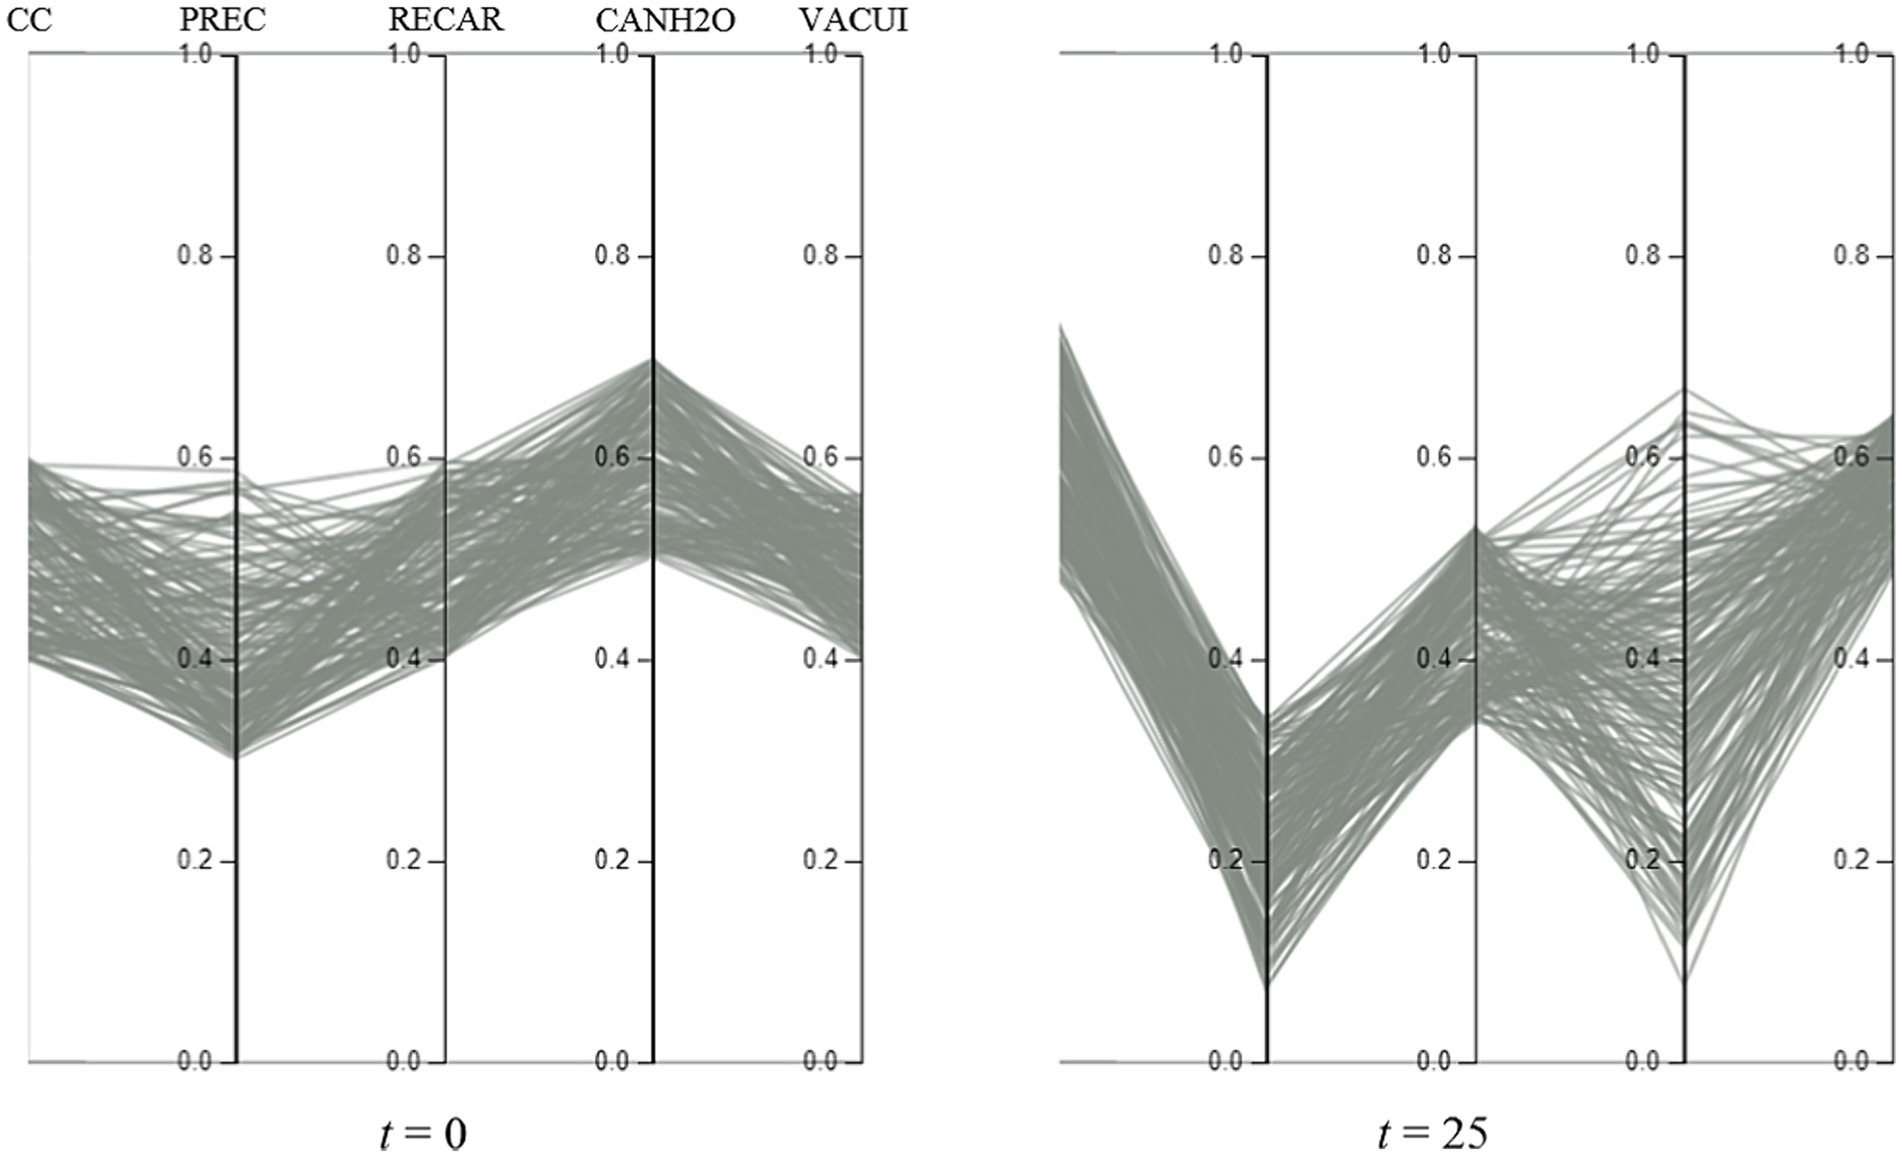
Figure 4. Parallel coordinates for the selected worst SOW involving CC (climate change), PREC (precipitation), RECAR (aquifer recharge), CANH2O (aquifer volume), and VACUI (aquifer vulnerability) under BA-context initial and final times (t).
3.3.3 Step III
The evaluation of the worst SOW showed that there is a 0.16 probability that the aquifer vulnerability will increase by 9% due to a 0.5% annual decrease in aquifer recharge, regarding a 0.8% annual increase in climate change. The corresponding expected vulnerability, , for and was then calculated as follows:
4 Results
The results are presented in Table 1 and are explained as follows: in Section 4.1, the analysis focuses on the results by row, corresponding to specified resilience, i.e., for all state variables within a Region (Figure 2). To illustrate the analytical procedure, the results for Region I West (RI) are presented. In Section 4.2, the analysis shifts to the results by column, corresponding to general resilience, i.e., for one state variable across all Regions (Figure 2). Finally, in Section 4.3, the aggregated results are examined, corresponding to integration, i.e., for all state variables across all regions (Figure 2).
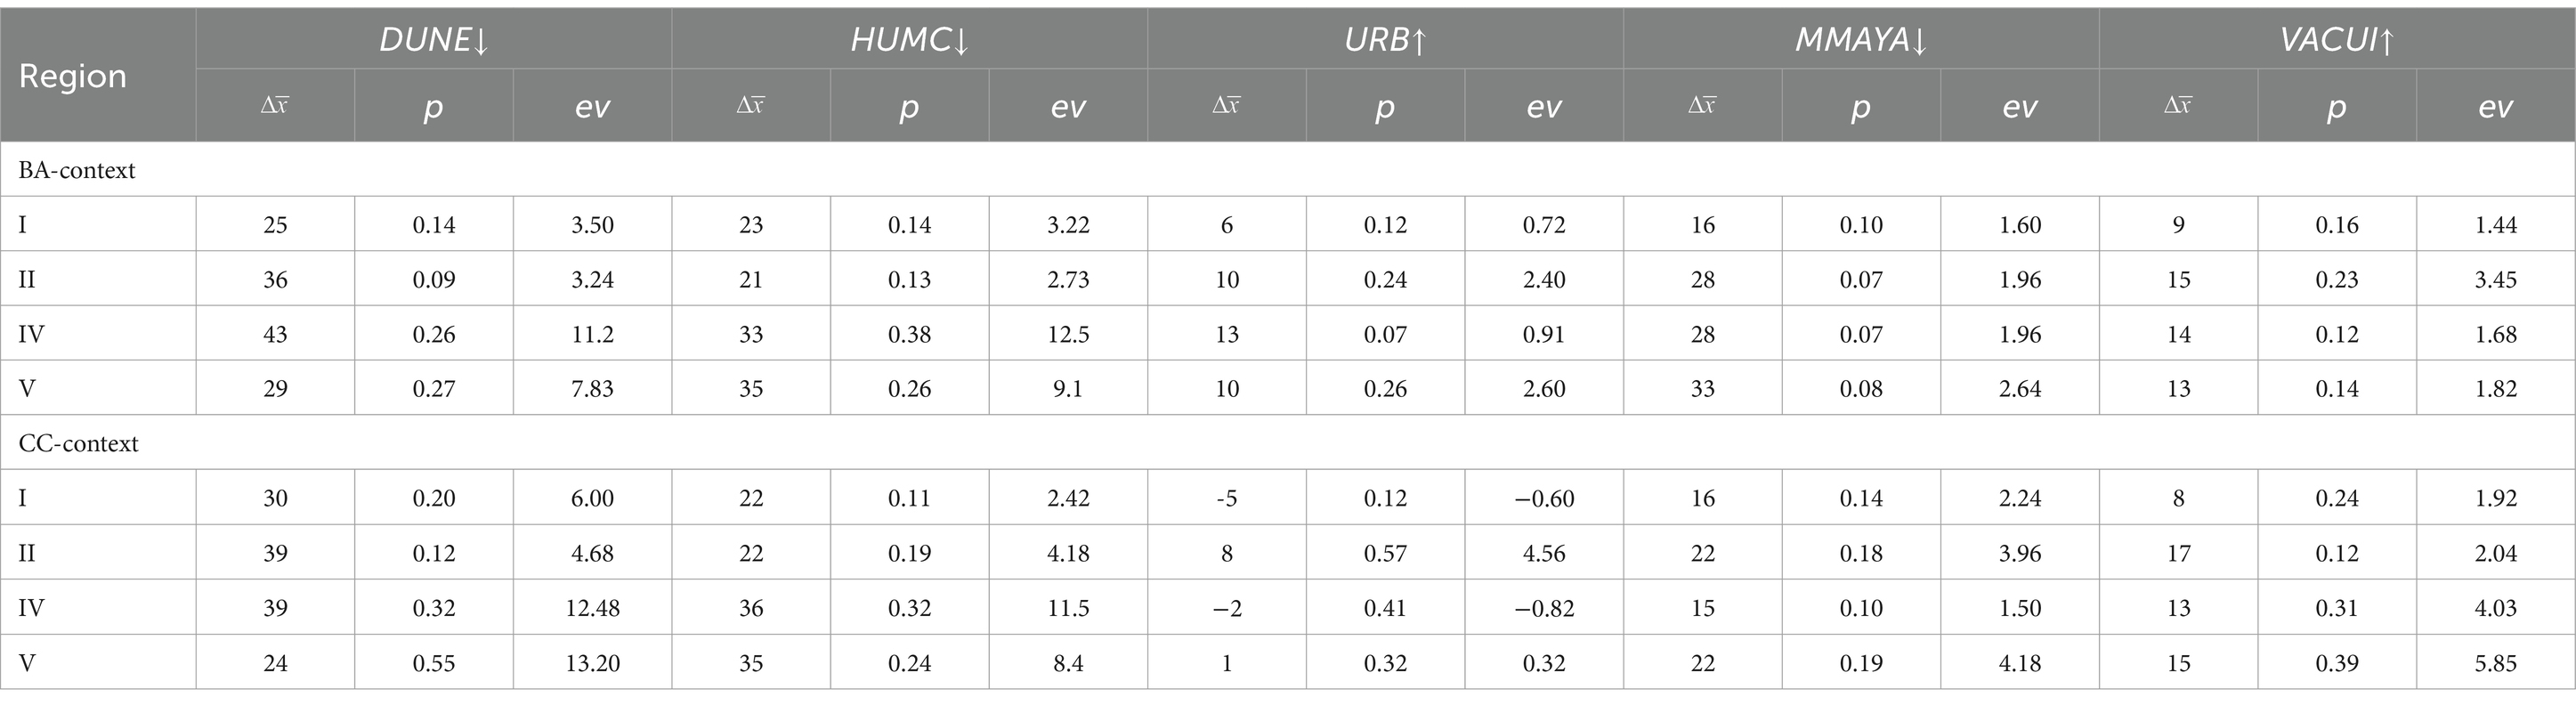
Table 1. Expected vulnerability of state variables beach-dune ecosystems (DUNE), coastal wetlands (HUMC), urbanization (URB), milpa Maya (MMAYA), and aquifer vulnerability (VACUI) in the four coastal Regions of Yucatán; ∆x ̅ is the change in mean value of the state variable during simulation time in percentage, p is probability of occurrence, ev is expected vulnerability, and arrows indicate growth (↑) or decline (↓) during the simulation time.
4.1 Specified resilience: Region I West
In this section, results related to specified resilience from Steps I, II, and III are presented, focusing specifically on RI as depicted in Figures 5–9. It is important to note that similar results were obtained for the remaining regions, but to avoid redundancy and maintain clarity, the presentation is restricted to the RI results in this section. This presentation encompasses the selected causal mechanism, a description of the effect each mechanism represents, 3D graphical depictions of the obtained alternatives, and visualization of the worst SOW using parallel coordinates, for BA-context and CC-context.
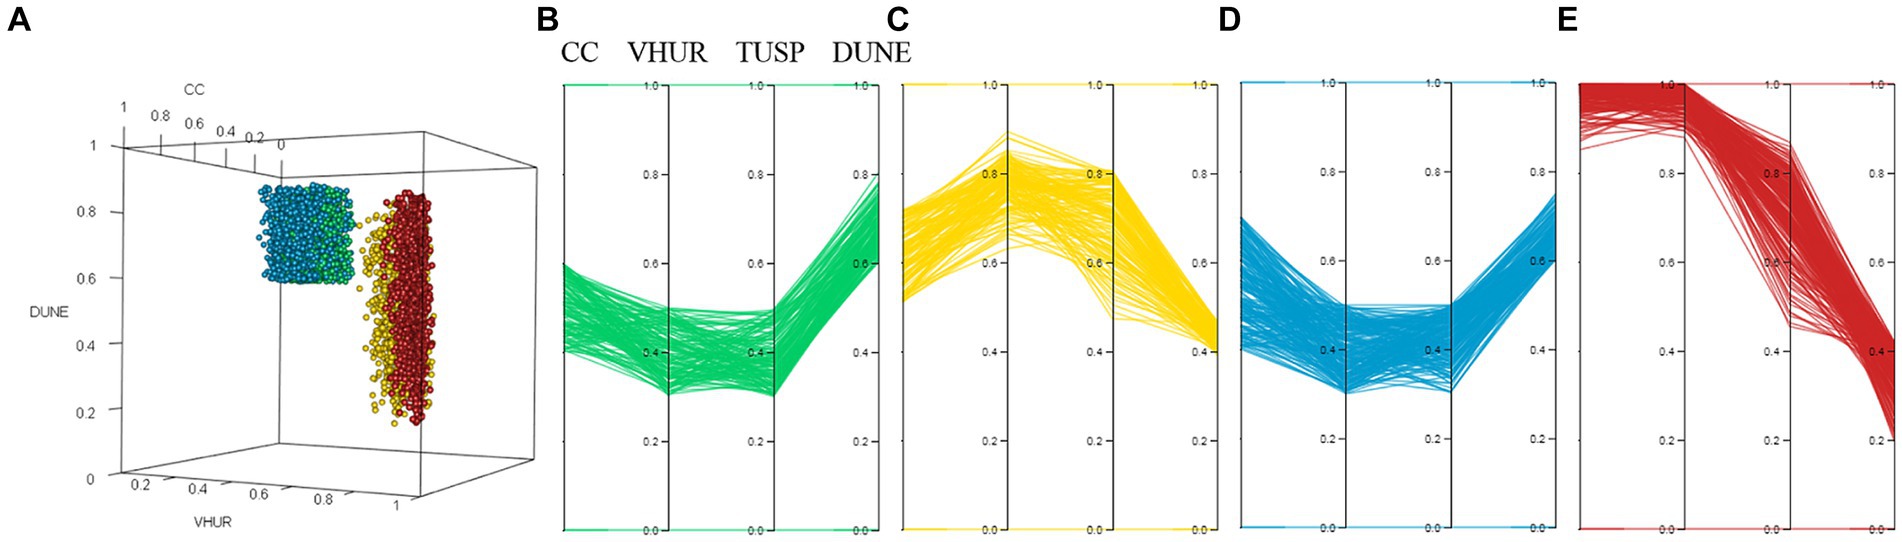
Figure 5. Simulation results for the effect on DUNE (functional integrity of beach-dune ecosystems) in relation to CC (climate change), VHUR (vulnerability to hurricanes) and TUSP (tourism). (A) initial conditions of BA-context (green dots) and CC-context (blue dots), and final conditions of BA-context (yellow dots) and CC-context (red dots); (B,C) initial and final conditions of worst SOW in BA-context; (D,E) initial and final conditions of worst SOW in CC-context.
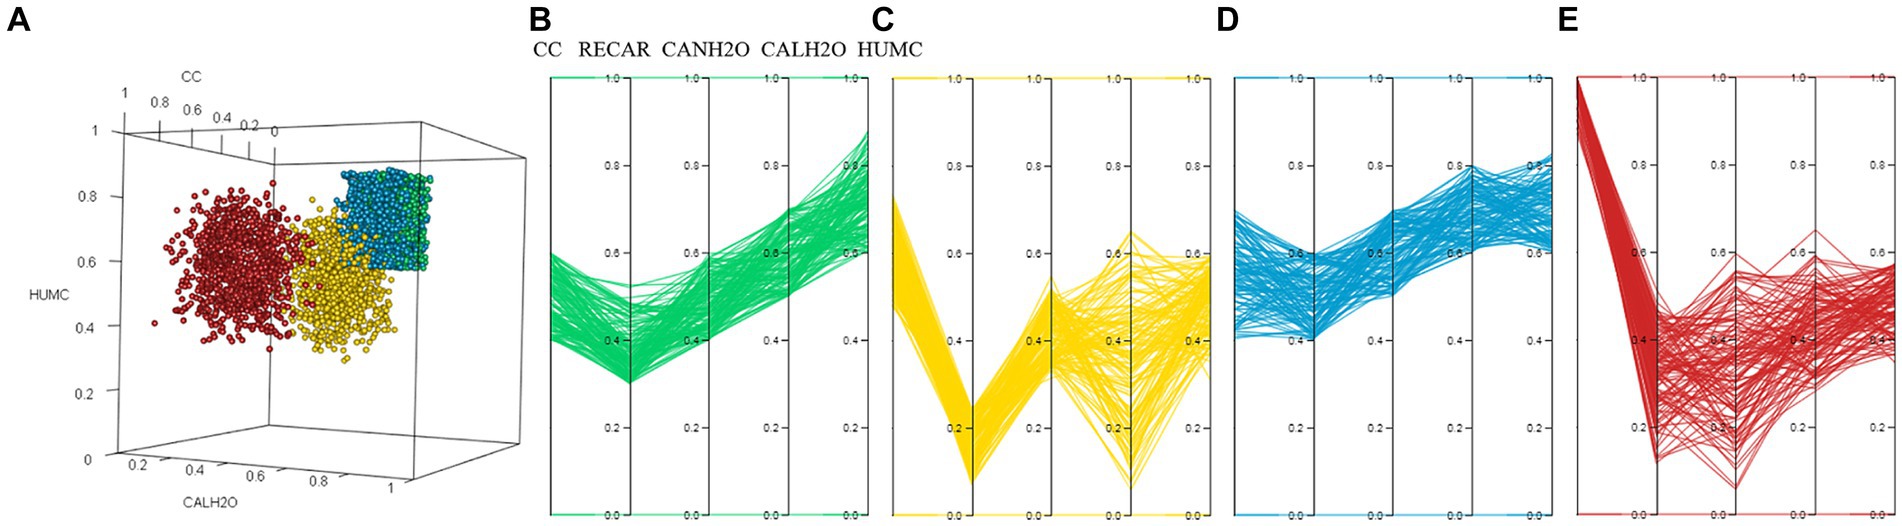
Figure 6. Simulation results for the effect on HUMC (functional integrity of coastal wetlands) in relation to CC (climate change), CALH2O (aquifer quality), RECAR (aquifer recharge), and CANH2O (aquifer volume). (A) initial conditions of BA-context (green dots) and CC-context (blue dots), and final conditions of BA-context (yellow dots) and CC-context (red dots); (B,C) initial and final conditions of worst SOW in BA-context; (D,E) initial and final conditions of worst SOW in CC-context.
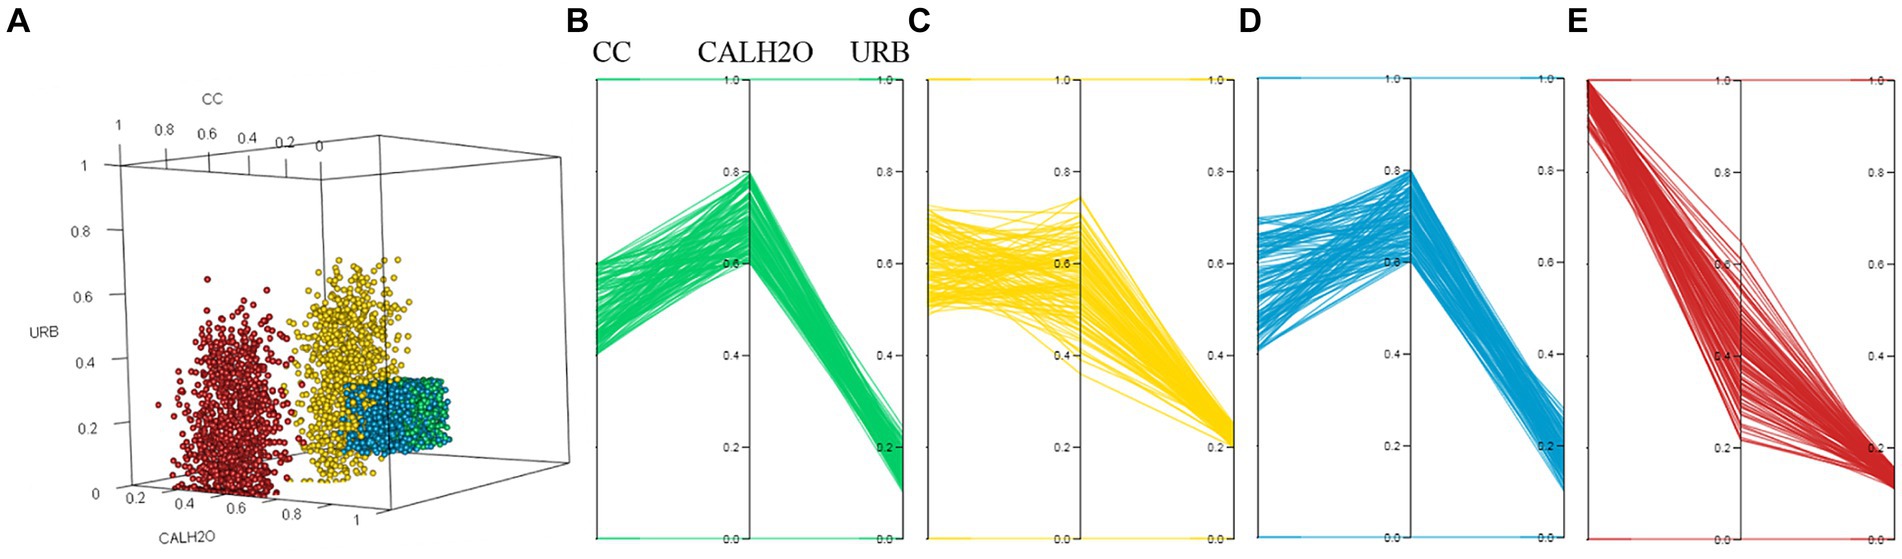
Figure 7. Simulation results for the effect on URB (urbanization) in relation to CC (climate change), and CALH2O (aquifer quality). (A) initial conditions of BA-context (green dots) and CC-hinons of BA-context (yellow dots) and CC-context (red dots); (B,C) initial and final conditions of worst SOW in BA-context; (D,E) initial and final conditions of worst SOW in CC-context.
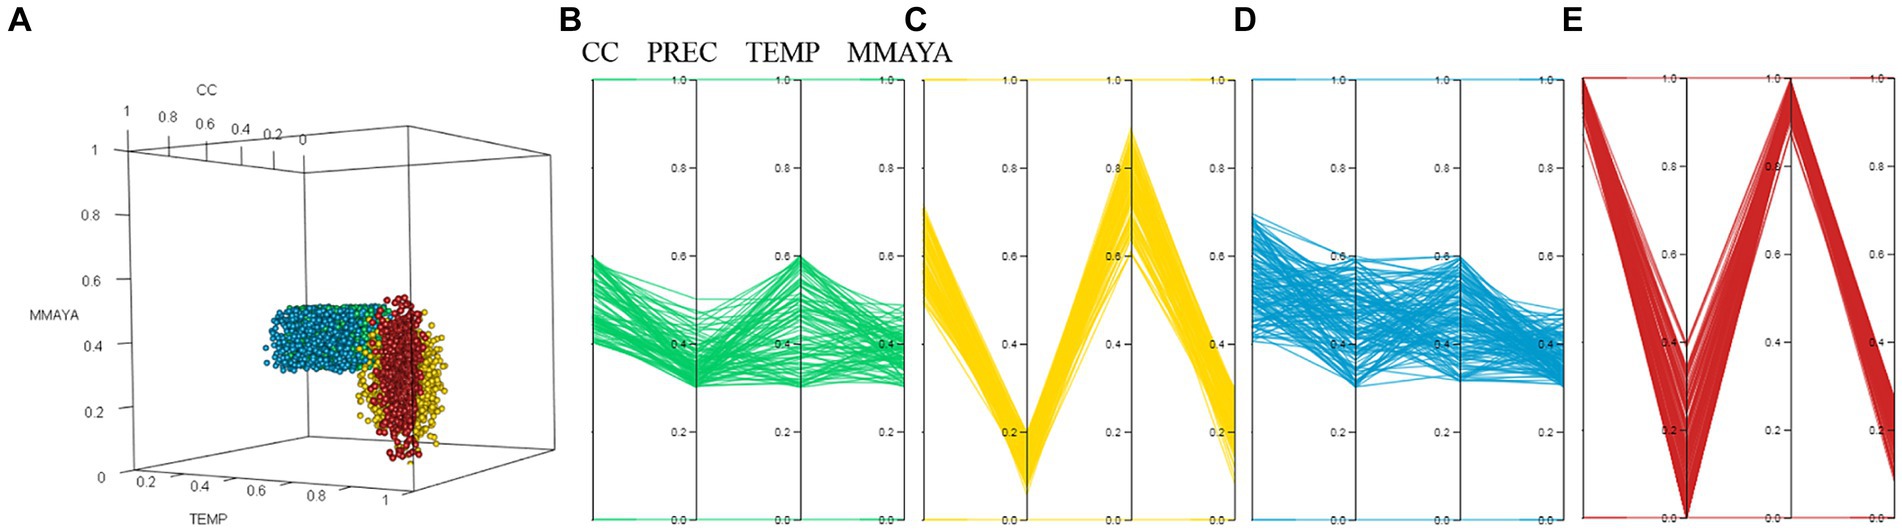
Figure 8. Simulation results for the effect on MMAYA (milpa Maya) in relation to CC (climate change), PREC (precipitation), and TEMP (temperature). (A) initial conditions of BA-context (green dots) and CC-context (blue dots), and final conditions of BA-context (yellow dots) and CC-context (red dots); (B,C) initial and final conditions of worst SOW in BA-context; (D,E) initial and final conditions of worst SOW in CC-context.
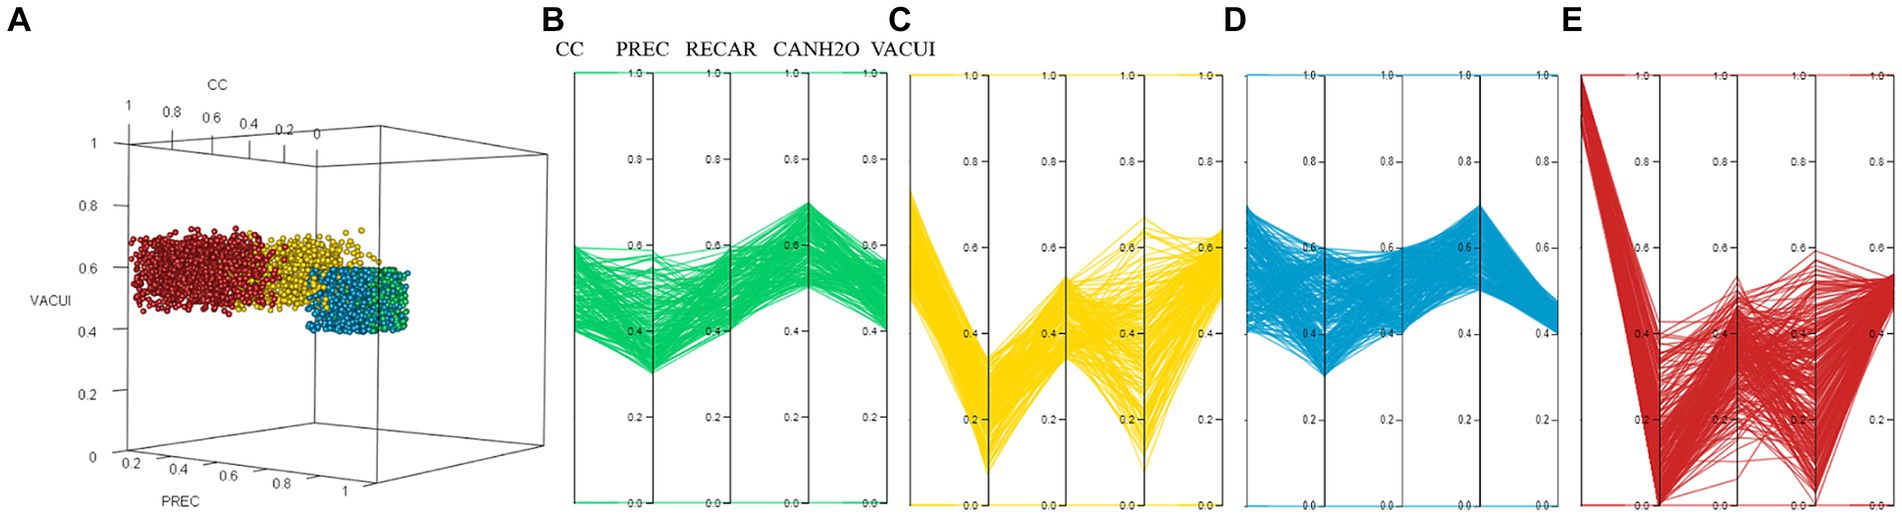
Figure 9. Simulation results for the effect on VACUI (aquifer vulnerability) in relation to CC (climate change), PREC (precipitation), RECAR (aquifer recharge), and CANH2O (aquifer volume). (A) initial conditions of BA-context (green dots) and CC-context (blue dots), and final conditions of BA-context (yellow dots) and CC-context (red dots); (B,C) initial and final conditions of worst SOW in BA-context; (D,E) initial and final conditions of worst SOW in CC-context.
4.1.1 Beach-dune ecosystems
Causal mechanism:
Climate change (CC) amplifies the intensity and frequency of extreme hydrometeorological events, especially hurricanes (VHUR). Consequently, this exacerbates the vulnerability of tourist areas (TUSP) and causes a degradation of beach-dune ecosystems (DUNE).
Step I: Alternatives (Figure 5A).- With increasing climate change, hurricanes, and extreme weather events, beach-dune ecosystems deteriorated below the threshold (minimum value at the initial simulation time: ) in approximately 60% of the future alternatives for both BA and CC contexts, with a more pronounced effect in the latter.
Step II: States of the World.- Initial conditions (Figures 5B,D): Average climate change was higher in CC-context compared to BA-context. This difference was not reflected in the averages for vulnerability to hydrometeorological events and tourist areas.
Final conditions (Figures 5C,E): Average climate change and hurricanes and extreme weather events were significantly higher in CC-context than in BA-context. This amplified the vulnerability of tourist areas to a greater extent in CC-context. Beach-dune ecosystems significantly declined in both BA and CC contexts, with over 90% SOW in CC-context degrading below the BA-context’s minimum.
Step III: Robustness measures (Table 1).- Expected vulnerability of beach-dune ecosystems in CC-context nearly doubled that of BA-context because of a higher percentage of change () and a higher probability.
4.1.2 Coastal wetlands
Causal mechanism:
Climate change modifies regional precipitation patterns (), leading to reduced groundwater recharge (). This, in turn, lowers aquifer volume and degrades groundwater quality due to increased salinity, ultimately affecting the functional integrity of coastal wetlands .
Step I: Alternatives (Figure 6A).- With increasing climate change and worsening groundwater quality, coastal wetlands deteriorated beyond the threshold (minimum value at the initial simulation time: ) in over half of the future alternatives for both BA and CC contexts.
Step II: States of the World.- Initial conditions (Figures 6B,D): Averages for groundwater recharge, volume, and quality were higher in CC-context compared to BA-context. Average coastal wetlands were practically identical in both BA and CC contexts.
Final conditions (Figures 6C,E): Average climate change was significantly higher in CC-context than in BA-context. This exacerbated the vulnerability of groundwater recharge, volume, and quality in both contexts, with amplified variation in groundwater quality in the BA-context and groundwater recharge and volume in the CC-context. The end condition of coastal wetlands was comparable in both contexts.
Step III: Robustness measures (Table 1).- Expected vulnerability of coastal wetlands was approximately one-third higher in BA-context than in CC-context due to a similar percentage of change () and higher probability of occurrence.
4.1.3 Urbanization
Causal mechanism:
Climate change amplifies the process through which the concentration of salts and minerals in groundwater increases, impairing their quality parameters . This, in turn, escalates the cost of water supply to future urbanization .
Step I: Alternatives (Figure 7A).- With increasing climate change and worsening groundwater quality, urbanization declined below the threshold (minimum value at the initial simulation time: ) in approximately one-twentieth and one-fifth of the future alternatives for BA and CC contexts, respectively.
Step II: States of the World.- Initial conditions (Figures 7B,D): Averages for climate change and aquifer quality were practically identical, whereas the average for urbanization was slightly higher in CC-context compared to BA-context.
Final conditions (Figures 7C,E): Average climate change was significantly higher in CC-context than in BA-context, leading to a more pronounced decline in aquifer quality in CC-context. During the simulation, urbanization increased in BA-context () and decreased in CC-context ().
Step III: Robustness measures (Table 1).- Expected vulnerability of urbanization in CC-context nearly doubled that of BA-context due to the negative percentage of change () of the latter (resulting from urbanization being lower at the end of the simulation than at the beginning: )
4.1.4 Milpa Maya
Causal mechanism:
Climate change reduces precipitation and raises temperature , leading to a decrease in the functional integrity of the milpa systems characteristic of Maya communities .
Step I: Alternatives (Figure 8A).- With increasing climate change and temperature, milpa Maya declined beyond the threshold (minimum value at the initial simulation time: ) in about 55% of future alternatives for both BA and CC contexts.
Step II: States of the World.- Initial conditions (Figures 8B,D): Average climate change was approximately 10% higher in CC-context than in BA-context. This difference was reflected in an increase in variation of precipitation, while temperature variation remained unchanged.
Final conditions (Figures 8C,E): Average climate change was significantly higher in CC-context than in BA-context, resulting in more pronounced changes in precipitation and temperature. However, these changes had an insignificant effect on milpa Maya. These findings suggest that the relative impact of other forcing variables such as including agricultural expansion and urbanization had a greater effect on milpa Maya.
Step III: Robustness measures (Table 1).- Expected vulnerability of milpa Maya was 40% higher in CC-context than is BA-context, due to a higher probability of occurrence but an equal percentage of change ().
4.1.5 Aquifer vulnerability
Causal mechanism:
Climate change reduces precipitation , thereby decreasing subsurface recharge and evapotranspiration, which in turn lowers the aquifer volume . This effect increases the vulnerability of the aquifer .
Step I: Alternatives (Figure 9A). With increasing climate change and declining precipitation, aquifer vulnerability exceeded the threshold (maximum value at the initial simulation time: ) in about 40% of the future alternatives in both BA and CC contexts.
Step II: States of the World.- Initial conditions (Figures 9B,D): Average climate change, precipitation, groundwater recharge, and aquifer volume were similar in both BA and CC contexts, with slightly greater variability for climate change in the latter. The minimum aquifer vulnerability was similar in both contexts, but the maximum aquifer vulnerability in CC-context was below the average for BA-context.
Final conditions (Figures 9C,E): Average climate change was significantly higher in CC-context than in BA-context, resulting in greater variability in precipitation, groundwater recharge, and aquifer volume in CC-context. However, average aquifer vulnerability was similar in both contexts, although with greater variability in BA-context.
Step III: Robustness measures (Table 1).- Expected vulnerability of coastal wetlands was approximately one-third higher in CC-context than in BA-context due to a higher probability of occurrence but a practically equal percentage of change ().
4.2 General resilience: coastal zone
4.2.1 Step III: robustness measures
The results of the two metrics used in Step III regarding expected vulnerability (Figure 10; Table 1) and deviation from baseline (Table 2), showed the multi-vulnerabilities to climate change risks in the coastal zone, which are described below for each state variable by Region.
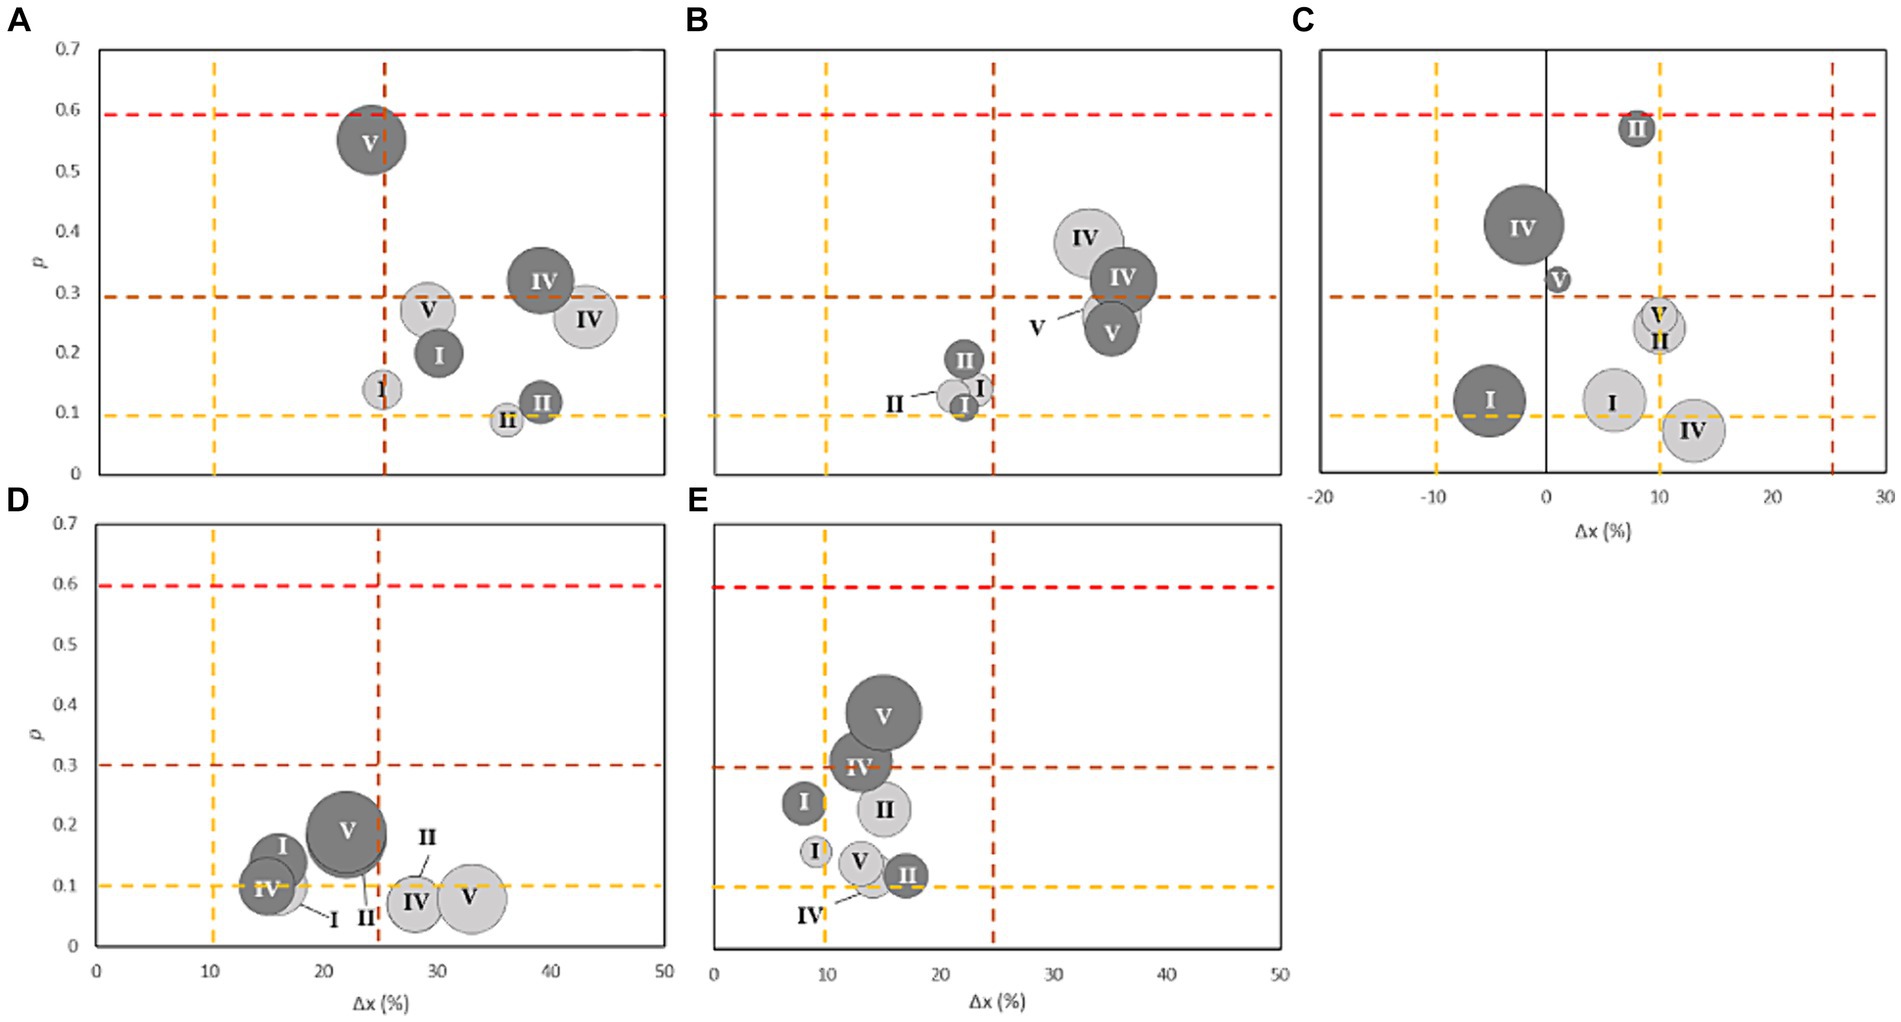
Figure 10. Expected vulnerability (circle size) of BA-context (light gray) and CC-context (dark gray); abscissa: change in mean state during the simulation, ; ordinate: probability of occurrence, p; panels: (A) beach-dune ecosystems, (B) coastal wetlands, (C) urbanization, (D) milpa Maya, and (E) aquifer vulnerability; Step cuts: yellow = low , orange = medium , and red = high
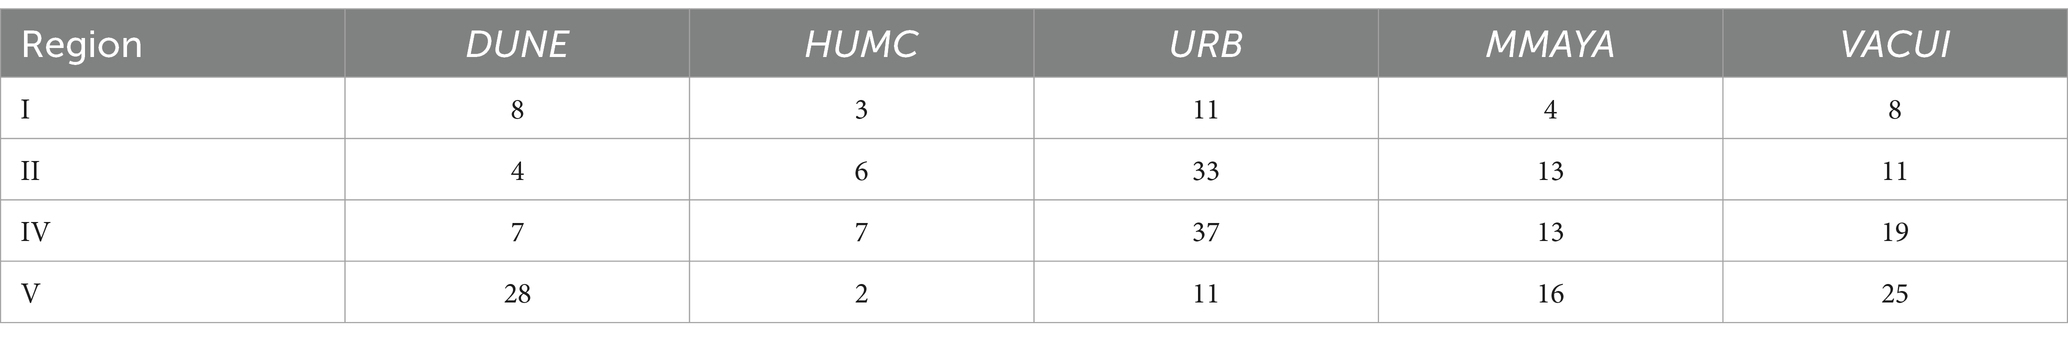
Table 2. Deviation from baseline (%) of state variables by Region (look Table 1 for state variables’ description)
Beach-dune ecosystems.- Expected vulnerability ranking shifted from in BA-context to in CC-context. The change during the simulation time was categorized as high with moderate probability for all Regions, except for in CC-context, which exhibited a high probability. In this case, the probability of change in CC-context was twice that in BA-context (Figure 10A; Table 1). The most significant deviation from baseline was observed in RV, with a value of 28%, which is four to seven times higher than those in , , and (Table 2).
Coastal wetlands.- Expected vulnerability ranking shifted from in BA-context to in CC-context due to a slightly higher probability in CC-context for . The expected vulnerability of and RV was two to four times higher than RI and RII. The change during the simulation time was categorized as moderate with moderate probability for and , and as high with moderate probability for and (Figure 10B; Table 1). The most significant deviations from baseline were in and , which were two to three times higher than those for and (Table 2).
Urbanization.- Expected vulnerability ranking shifted from for BA-context to for CC-context due to escalating costs of water supply. The change in the mean state of urbanization during the simulation () was lower in CC-context than in BA-context, particularly in , , and . During the simulation period, in general, as urbanization increased, lower expected vulnerability corresponded to higher rankings. Yet, urbanization declined during the simulation time in and in CC-context, thus yielding negative values in their mean states (Table 1). The change during the simulation time was categorized as moderate with low probability for in BA-context, as low with moderate probability for , , and in BA-context and in CC-context, and as low with high probability for , , and in CC-context. For CC-context, the change during the simulation time was slightly lower in but with double the probability compared to BA-context (Figure 10C; Table 1). The most significant deviations from baseline were in and , a threefold increase compared to the other two Regions (Table 2).
Milpa Maya.- Expected vulnerability ranking shifted from for BA-context to for CC-context due to a slightly higher probability in CC-context for . The change during the simulation time was categorized as moderate to high with low probability for the four Regions in BA-context and in CC-context, and as moderate with moderate probability for , , and in CC-context (Figure 10D). Deviations from baseline were similar in all Regions, except for , where the deviation was three to four times smaller (Table 2).
Aquifer vulnerability.- Expected vulnerability ranking shifted from for BA-context to for CC-context due to the effect of climate change on regional precipitation patterns, which ultimately reduced the volume of the aquifer. During the simulation period, in general, as aquifer vulnerability increased, higher expected vulnerability corresponded to higher rankings. The change during the simulation time was categorized as low with moderate probability for in both contexts, as moderate with moderate probability for and in both contexts and in BA-context, and as moderate with high probability for in CC-context (Figure 10E). The most significant deviation from baseline was in , followed by , , and , the latter presenting one-third the deviation of (Table 2).
4.2.2 Step IV: integration
The general objective of Step IV is to design an adaptive strategy to reduce multi-vulnerabilities in the coastal zone in Yucatán. It involved using trade-off analysis to determine the optimal allocation of resources to enhance the specified resilience of beach-dune ecosystems, coastal wetlands, urbanization, milpa Maya, and aquifers across the four Regions. Accordingly, the trade-off analysis through Gower’s residuals (Figure 11) quantified the specified vulnerabilities that required priority attention by Region in the pursuit of general resilience in the coastal zone. This quantification enabled the application of Savage’s criterion of minimizing maximum regret.
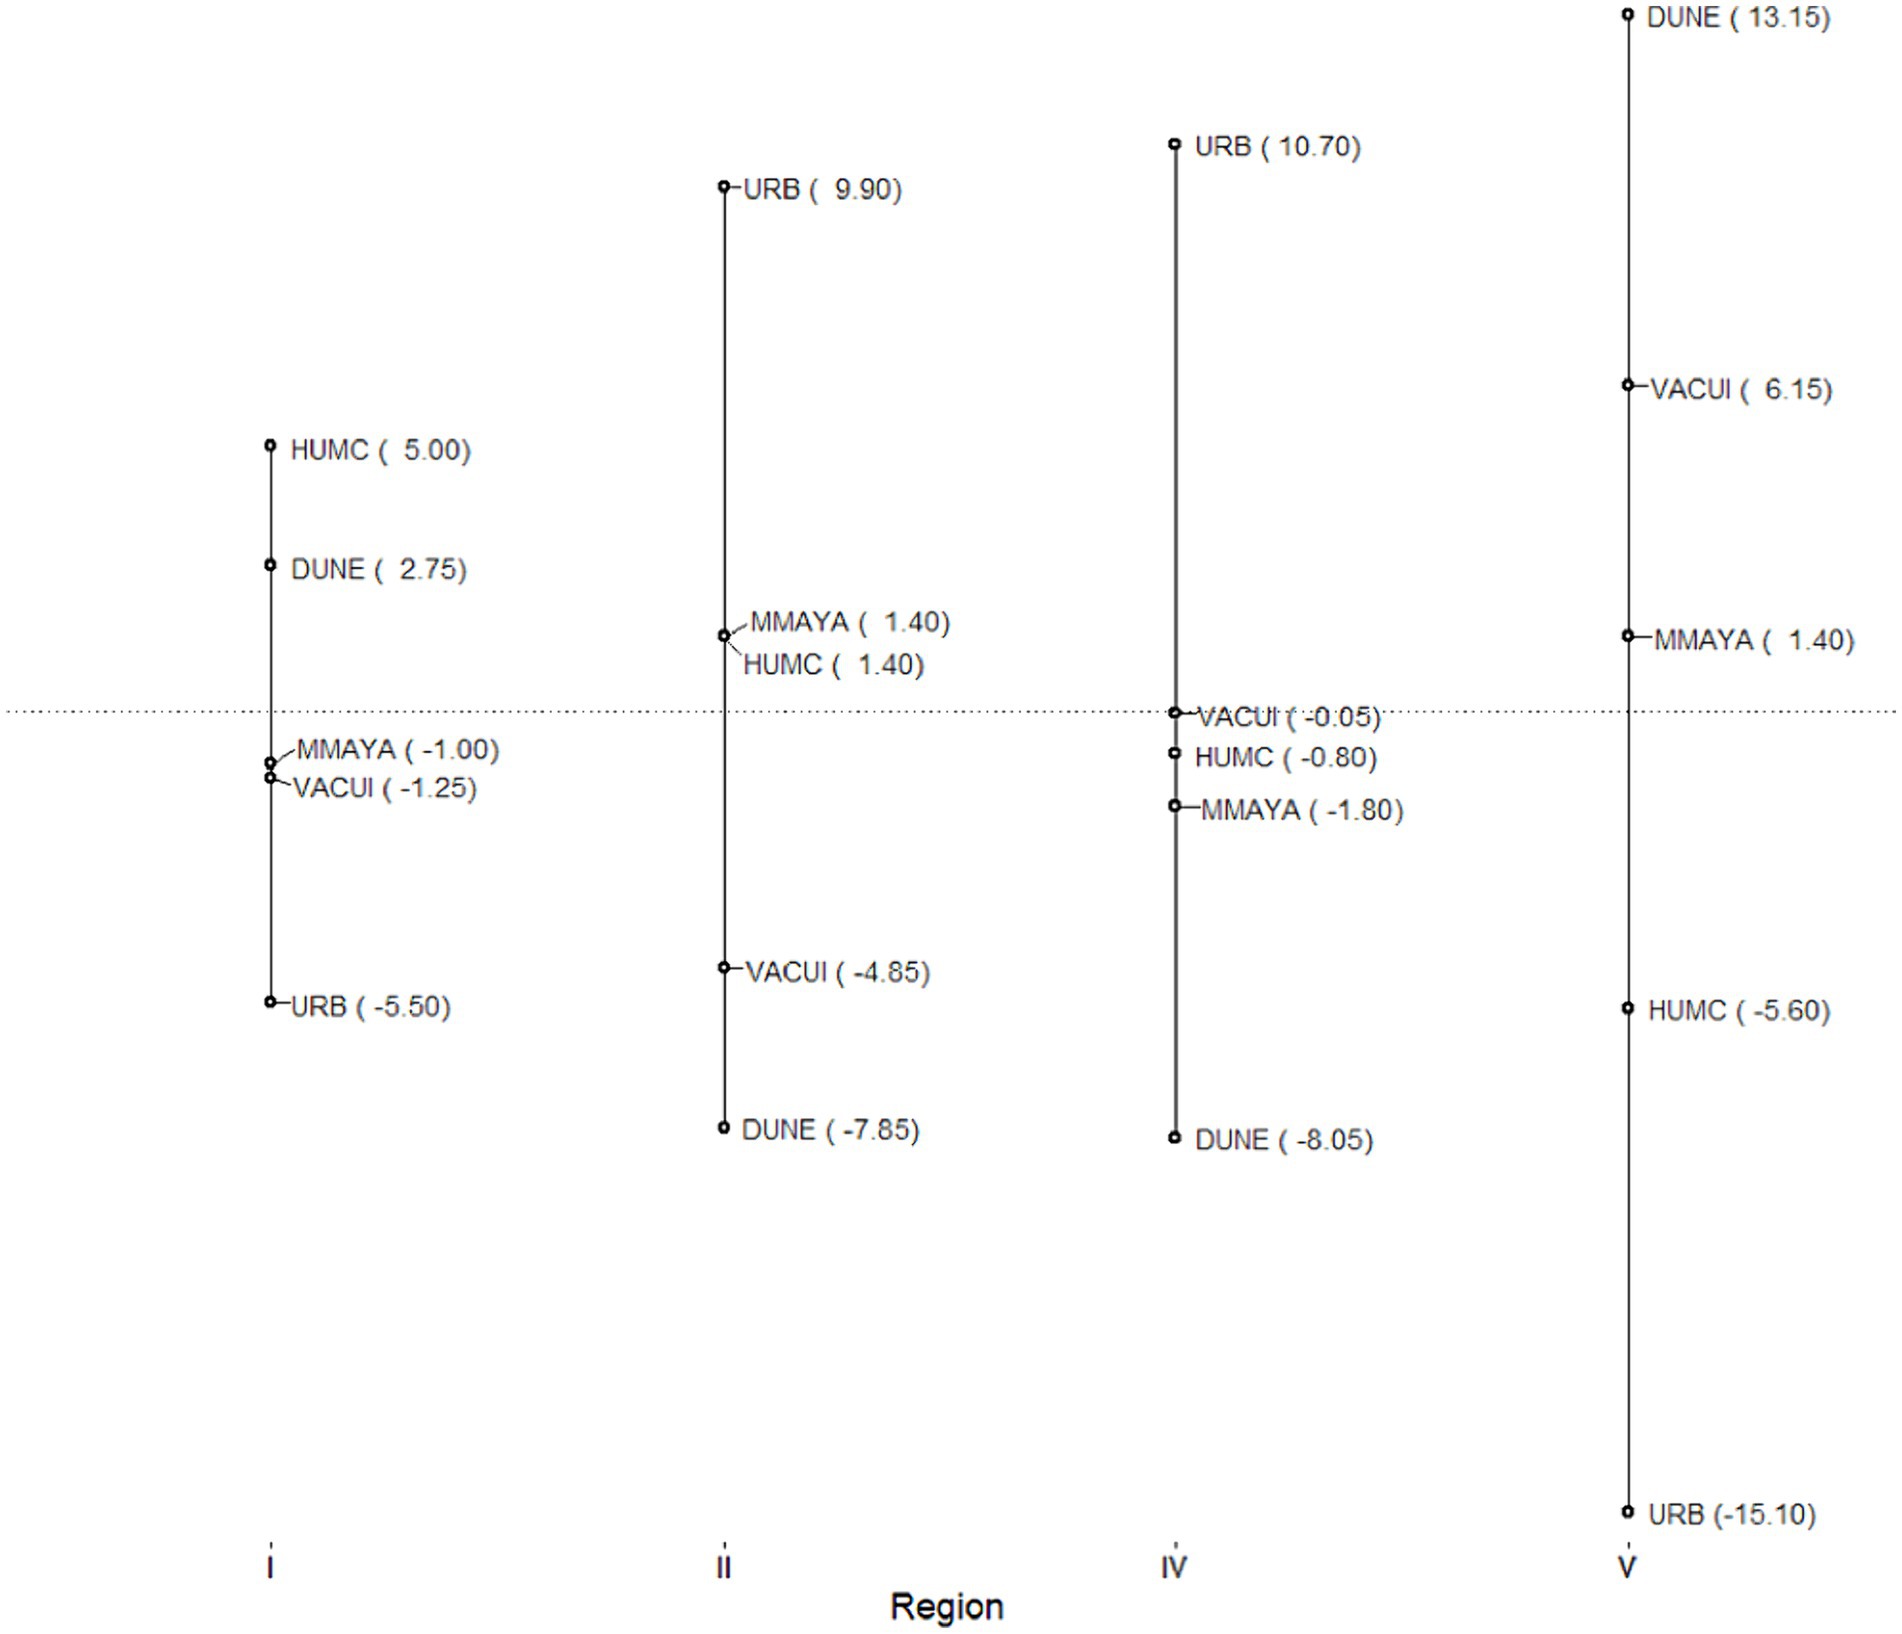
Figure 11. Gower’s residuals.
Positive residuals indicated that the robust strategy should prioritize reducing the vulnerability of beach-dune ecosystems in and , of coastal wetlands in and , urbanization in and , and aquifers in , milpa Maya in and .
obtained the extreme range of minimum and maximum residuals (Figure 11) due to the deviation from baseline being the largest for beach-dune ecosystems and the lowest for urbanization (Figure 10; Table 2). Therefore, the trade-off was the most significant.
In contrast, obtained the smallest range of minimum and maximum residuals (Figure 11) due to its tendency to present low deviations from baseline values (Figure 10; Table 2). The trade-off between coastal wetlands and beach-dune ecosystems versus the other state variables was the least significant among the four Regions.
and obtained relatively high positive residuals for urbanization and residuals that varied from low positive to moderate negative for the rest of the state variables (Figure 11). This is the result of deviations from baseline three times larger for urbanization in these and compared to and (Figure 10; Table 2).
5 Discussion
We have introduced a qualitative DMDU approach designed to carry out CCIA with a focus on navigating uncertain future scenarios and enhancing the resilience of socio-ecological systems. This approach aims to formulate an optimal strategy focused on bolstering regional general resilience. This approach involves four Steps to identify them most critical climate change risks and minimize the potential undesirable outcomes. In this way, our approach involves a stepwise application of Savage’s criterion of minimizing maximum regret to formulate a robust strategy to enhance general resilience.
Regarding Step I (Figure 2), focused on generating the socio-ecological system and conducting massive computation experiments to produce alternative SOWs, our approach addresses the challenges delineated by York et al. (2021) in climate-related policy-making. In this regard, we argue that an optimal strategy must delve into the multi-sector and multi-scale complexities that are particularly acute in the Global South. Drawing from Eisenack et al. (2007), we contend that any systematic analysis aiming at formulating an optimal strategy toward regional resilience inevitably deals with the “bottleneck of knowledge representation and derivation.” This bottleneck refers to the challenge of accurately inferring and generalizing the behavior of the system from individual observations or inputs. Accordingly, it should be acknowledged that a major difficulty in climate-related policy-making is accurately depicting socio-ecological resilience from the available information. Our results show how qualitative modeling, despite its limitations, can be used to address such knowledge bottleneck by enabling a better understanding of the most relevant mechanisms driving forces, and feedback loops of complex socio-ecological systems. This circumstance underscores the significance of programs like WIGOS and POGO (World Meteorological Organization’s Integrated Global Observing System and Partnership for Observation of the Global Ocean, respectively) in addressing geographic data deficiencies. These data are crucial for establishing baselines related to climate, water, and other environmental elements (POGO, 2022; WMO, 2024).
We concur with Harborne et al. (2017) that qualitative modeling constitutes an important set toward understanding the composition, structure, causal mechanisms, and context of socio-ecological systems. One advantage of qualitative modeling is that it makes explicit the conditions under which models are appropriate. We thus concur with Forbus (2011) that qualitative DMDU enables the development of ontologies to organize modeling knowledge that reflects conceptual assumptions about how socio-ecological systems are organized while enabling the development of computational assumptions to delineate when parcels of knowledge are relevant for a particular situation. These ontologies are in effect the formalization of the broader array of issues and concerns inherent in knowledge co-production processes under data constraints typical of the Global South. One challenge in developing such ontologies is dealing with “ambiguity aversion” (Tversky and Fox, 1995), particularly in the context of Knightian uncertainty. This aversion reflects a cognitive bias where experts demonstrate a preference for emphasizing known climate change risks over unknown ones, thus, refraining from exploring beyond the obvious effects of climate change.
Our findings indicate that the simplicity and flexibility of the KSIM aid in creating an experiment design for Step I that can overcome ambiguity aversion. KSIM proved to be useful for developing the ontologies of system processes and components by integrating local knowledge, expertise, and preferences of stakeholders into lumped-parameter approximations obtained through consensus. In addition, field ontology focused on spatially distributed climate change risks to turn the activity of modeling from an art to a science. In this way, the KSIM enabled the implementation of co-produced massive computational experiments based on a comprehensive examination of the root issues and concerns expressed by the stakeholders. As highlighted by White (1981), the dynamics of the KSIM tends toward extremal equilibrium states, where variables reach either their minimum (0) or maximum (1) individually. Typically, it is necessary to be aware that KSIM tends to extreme conditions rather than system stability and self-regulation. In our case, however, this tendency was inconsequential because the focus of our CCIA was on identifying the worst SOW, rather than portraying the homeostasis of the system. The output of these computational experiments provided valuable insights into the magnitude of change, including the identification of the expected worsts SOW under both BA and CC contexts (Figures 5–9). These findings played a critical role in building consensus regarding the characterization of climate change risks in the coastal zone of Yucatán. We acknowledge that the key factor in the experiment design was the inclusion of a diversity of viewpoints from stakeholders with different backgrounds, such as governmental entities, businesses and industries, cooperatives and civil society organizations, academic and research institutions, and concerned citizens. The organizational aspects of the co-production process (see Supplementary material S1) were aligned with the established formalized procedures of the Ecological Ordinance, a multisectoral environmental planning tool that seeks to identify the optimal zoning scheme of a territory, maximizing consensus on land suitability while minimizing intersectoral conflicts (Bojórquez-Tapia and Eakin, 2018; Páez et al., 2020).
Regarding Step II (Figure 2), focused on examining the specified resilience and identifying the worst SOW, it should be noted that the implementation of our approach involves the systematic integration of CCIA at both local (in our case, RI, RII, RIV, and RV) and regional scales (in our case, coastal zone). This integration is underpinned by a nuanced multi-sector and multi-scale experiment design that included the set of assumed key factors to foster general resilience, transformability, and adaptability within socio-ecological systems in the face of climate change. We therefore contend that the critical component in experiment design is generating the data necessary for the development of an ontology of vulnerability. It should be highlighted that the key feature of this ontology is its capacity to convey meaningful information regarding environmental degradation and climate change risks to both stakeholders and policymakers.
Because a vulnerability ontology should convey meaningful information regarding environmental degradation and climate change risks to both stakeholders and policymakers, the vulnerability of the state variables, , need to be measured using a commensurate scale. This is a necessary condition in CCIA for comparing multiple vulnerabilities across time and space. In our approach, we draw from Luers et al. (2003) to normalize these multiple vulnerabilities using a ratio scale relative to a threshold, ρm. We acknowledge that the specific value of this threshold is deeply uncertain and that its determination involves objective and subjective reasoning. In terms of objective reasoning, this method presupposes that thresholds are influenced by physiology, functional integrity, and genetic plasticity. Consequently, as Bojórquez-Tapia et al. (2021) highlight, there exists a limit in parameter , beyond which the system’s state surpasses the unacceptable risk of low resilience. Breaching this threshold could result in adverse consequences for the system’s capacity to recover or adapt to changes. Regarding subjective reasoning, the threshold values for the CCIA of Yucatán’s coastal zone were established considering that the conditions of the state variables should not worsen from their current vulnerability status. This approach streamlined the measurement of the multiple vulnerabilities by establishing a ratio, which in effect normalized the vulnerability of the state variables in a commensurate scale that allowed us to compare the severity of the multiple vulnerabilities across Regions. Hence, this ratio compared the alteration in state variables induced by forcing variables to the significance of the state variable’s final condition. Essentially, this ratio gaged the importance of the state variable’s final state to a univariate threshold.
Our approach presupposes that the stochastic simulation reflects the range of possible social, technological, and ecological conditions in a 25-year simulation span. We acknowledge, nevertheless, that one limitation of our approach is its incapability of addressing the fluid nature of vulnerability in the face of the accelerated dynamics inherent in the real world. The ever-changing and dynamic nature of real-world conditions poses a challenge for our methodology, as it may not fully capture the swift and evolving conditions of the environment, society, and technology. This limitation underscores the need for addressing the non-stationarity of data over time, referred to as “concept drift” by Khamassi et al. (2018). Therefore, the next step in qualitative DMDU research involves incorporating machine learning, data mining, and artificial intelligence. This integration would provide continuously update mechanisms, discarding outdated issues and concerns as part of an ongoing refinement modeling process. Another further step that should be consider is the application of sensitivity analysis to identify the key variables where minor changes in the input data might significantly influence the outcomes and findings.
We contend that qualitative DMDU is effective for systematically assess vulnerability and resilience to find the best strategies for climate change impact adaptation (CCIA). Our method uses three types of robustness metrics from McPhail et al. (2018). In Step III (Figure 2), which focused on identifying the expected vulnerability, the first metric evaluates alternatives by separating out those that are vulnerable using the “Starr’s domain criterion.” In our case, this is based on a defined vulnerability threshold for state variables. The second metric selects the worst SOW to calculate the average expected state variables. Identifying the worst SOW addresses the lack of prioritization in the adaptation and mitigation strategies that is typical of planning instruments such as PEACC. In this way, identifying the worst SOW pinpoints where and why these strategies should be implemented to enhance specified resilience in each Region. Focusing on the worst SOW, thus, helps prioritize ecological issues critical for enhancing the overall resilience of Yucatán’s coastal area. It is worth noticing that the choice of the worst SOW could be influenced by the criteria applied to define using CART, specifically the Gini coefficient and the probability of occurrence. Therefore, conducting a sensitivity analysis by varying these two parameters could help in identifying alternative robust strategies, as demonstrated through Gower residuals.
In Step IV (Figure 2), which focused on identifying the robust strategy, the third metric applies the Savage minimax criterion, which measures how much the state variables in each Region deviate from a baseline (BA-context). We assert that addressing the significant variability in environmental responses across different areas is a key factor in CCIA. In our methodology, we tackle this issue by calculating the expected vulnerability (Table 1). The expected vulnerability represents the relative severity of change in a state variable foreseen in a specific location. The comparison of expected vulnerability between BA and CC contexts offers a quantitative gage of the projected impacts of climate change, surpassing what could be projected based solely on historical patterns (Figure 10). These results underscore the usefulness of Savage’s criterion in providing clear and easy-to-understand measurements of potential consequences of climate change. Our approach leverages the deviation from baseline as an indicator of the extent to which additional climate change mitigation and adaptation measures are necessary, beyond the actions needed to address the deteriorating trends of the state variables in each Region. We thus argue that our qualitative DMDU approach provides an analytical platform to address the trade-offs inherent in the ranking of multiple vulnerabilities related to achieving general resilience. In essence, Gower’s residuals (Figure 11) highlight the trade-offs necessary for applying the Savage criterion of minimizing overall regret concerning general resilience. Positive residuals indicate specific vulnerabilities that should be addressed through a robust climate change adaptation strategy.
The strategy, guided by Gower’s residuals, identifies the optimal allocation of climate change mitigation and adaptation policies. The specified resilience actions (Table 3) are required to achieve the general resilience of the coastal zone in Yucatán through the following public-policy recommendations:
• In RI, there’s an extensive area with diverse wetland ecosystems, serving as a habitat for various migratory birds, mammals, and reptiles, thus, restoration and conservation actions for these wetlands should be prioritized.
• In RII and RIV, most exposed to risks due to urbanization, measures should be taken to limit urban growth and identify critical points of damage from extreme weather events and rising sea levels.
• In RV, coastal dunes show fragility due to industrial salt mining, impacting stability during extreme weather events, additionally, harbors meant to protect boats are causing erosion, exposing urban areas to coastal processes like waves and tides, therefore, strengthening conservation strategies for beach-dune ecosystems is crucial.
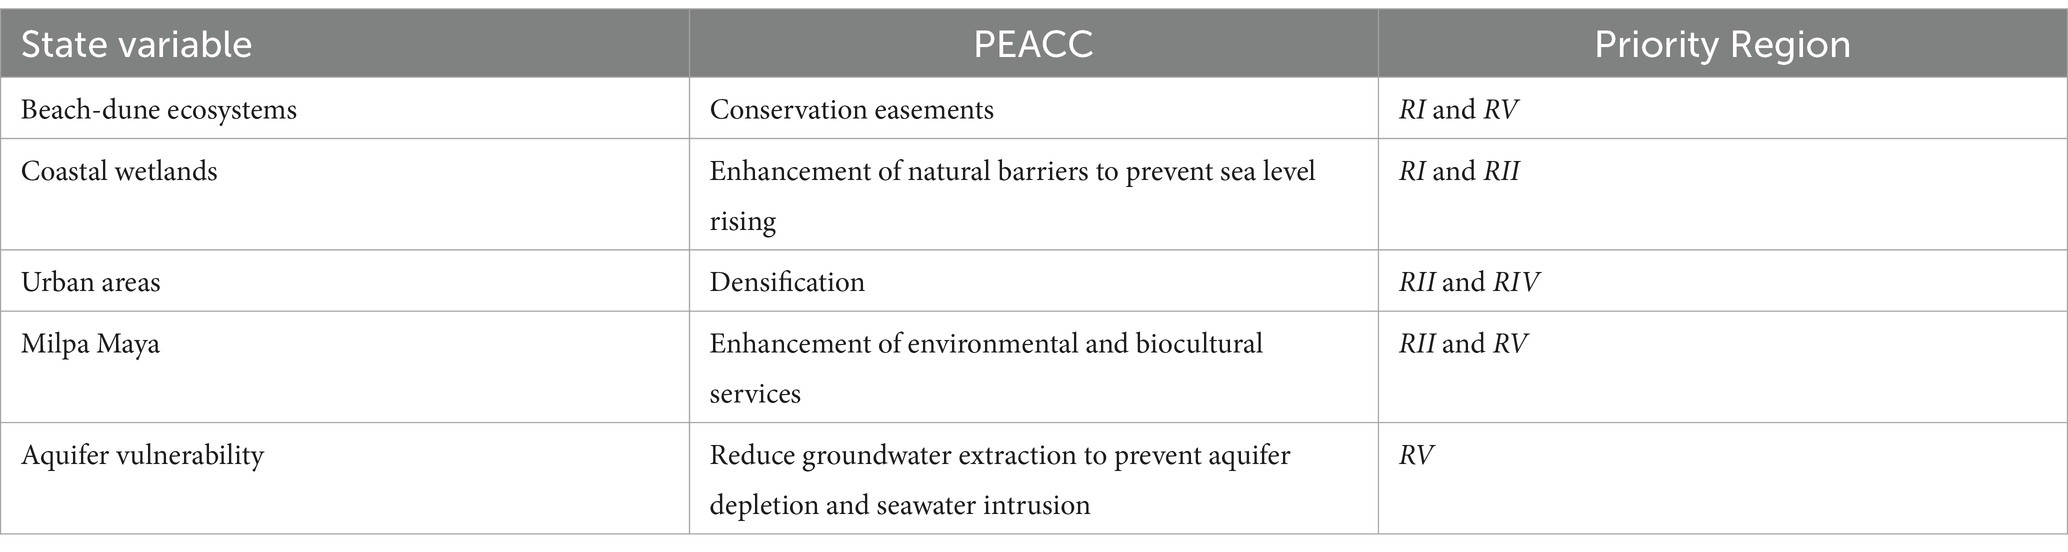
Table 3. Actions to achieve the general resilience of Yucatán’s coastal zone
These recommendations can be discussed within the state council for coastal zone Ecological Ordinance, which includes decision-makers from the federal, state, and municipal levels of governance, as well as local citizens. The residuals and information provided in Table 3 can facilitate regional discussions with these actors, thereby promoting decision-making to implement differentiated public policies that encourage adaptation and mitigation actions against climate change in the coastal zone.
We argue that the robust strategy for Yucatán’s coastal zone was supported by an appropriate field ontology or structure representation of vulnerability designed to communicate the priorities and trade-offs about environmental degradation and climate change risks. Gower’s residuals made this information accessible and meaningful to both stakeholders and policymakers, enabling them to make informed decisions and formulate policies related to environmental and climate challenges.
6 Conclusion
Our study has shown the transformative potential of qualitative DMDU in the context of CCIA. Through the development of qualitative systems dynamic modeling, robustness metrics, and active engagement with diverse stakeholders, we shifted CCIA from a subjective endeavor to an objective, science-based methodology. The participation of stakeholders, in conjunction with adherence to both quantitative and qualitative procedures, enhanced the comprehensiveness and practical applicability of CCIA outcomes in shaping policies aimed at building coastal resilience in Yucatán. A significant achievement of this approach lies in its ability to tackle a fundamental challenge in integrating multi-risk, multi-sector, and multi-scalar analysis. By employing a common scale, our approach not only made multiple vulnerabilities measurable but also rendered them comparable. Normalizing vulnerability allows for meaningful comparisons across different situations, locations, and periods, enabling a comprehensive analysis of vulnerabilities in various contexts. This normalization provides a robust framework capable of capturing the complexities of decision-making and spatial planning across different levels of climate governance, thereby paving the way for more informed and effective mitigation and adaptation policies. However, a critical challenge persists in coordinating governmental entities, spanning from local municipalities to nation-states and supra-national organizations. Furthermore, our study responds to the increasing global momentum for adaptation and resilience initiatives, such as the Call for Action on Adaptation and Resilience and the Adaptation Action Coalition (WRI, 2023), that signify a crucial stride toward climate change preparedness, essential for achieving sustainability transformations. Because our approach can be used to analyze socio-ecological systems in any territory and at various scales, potential further applications may include the analysis of droughts, floods, zoonotic outbreaks, related to climate change in other regions where feedback exists between environmental variables and socioeconomic decision-making. Future next steps in qualitative DMDU research include the incorporation of machine learning, data mining, and artificial intelligence to enhance continuous refinement of the modeling process.
Data availability statement
The raw data supporting the conclusions of this article will be made available by the authors, without undue reservation.
Author contributions
TM-B: Conceptualization, Formal analysis, Investigation, Methodology, Writing – original draft, Software. LB-T: Conceptualization, Formal analysis, Investigation, Methodology, Writing – original draft. YM: Formal analysis, Investigation, Writing – review & editing. EB-S: Formal analysis, Investigation, Writing – review & editing.
Funding
The author(s) declare financial support was received for the research, authorship, and/or publication of this article. This study was partially funded by Consejo Nacional de Humanidades Ciencias y Tecnologías (CONAHCYT), Gobierno del Estado de Yucatán (FOMIX YUC-2018-04-01-88958).
Acknowledgments
This is a partial fulfillment of the requirements for the degree of Doctor in Sustainability Science, Universidad Nacional Autónoma de México (UNAM), of TM-B, who acknowledges the support of CONAHCYT scholarship 1003060 and the Posgrado en Ciencias de la Sostenibilidad, UNAM. Declaration of generative AI and AI-assisted technologies in the writing process. During the preparation of this work, the authors used ChatGPT to improve language and readability. After using this tool, the authors reviewed and edited the content as needed and take full responsibility for the content of the publication.
Conflict of interest
The authors declare that the research was conducted in the absence of any commercial or financial relationships that could be construed as a potential conflict of interest.
Publisher’s note
All claims expressed in this article are solely those of the authors and do not necessarily represent those of their affiliated organizations, or those of the publisher, the editors and the reviewers. Any product that may be evaluated in this article, or claim that may be made by its manufacturer, is not guaranteed or endorsed by the publisher.
Supplementary material
The Supplementary material for this article can be found online at: https://www.frontiersin.org/articles/10.3389/fclim.2024.1331945/full#supplementary-material
Supplementary Figure S1 | Workshops
Supplementary Material S2 | KSIM algorithm RI
Supplementary Material S3 | Alpha matrix RI
Supplementary Material S4 | Beta matrix RI
References
Anderies, J. M., Folke, C., Walker, B., and Ostrom, E. (2013). Aligning key concepts for global change policy: robustness, resilience, and sustainability. Ecol. Soc. 18, 8–24. doi: 10.5751/es-05178-180208
Anderies, J. M., Janssen, M., and Ostrom, E. (2004). A framework to analyze the robustness of social-ecological systems from an institutional perspective. Ecol. Soc. 9, 1–18.
Anderloni, L., Bacchiocchi, E., and Vandone, D. (2012). Household financial vulnerability: an empirical analysis. Res. Econ. 66, 284–296. doi: 10.1016/j.rie.2012.03.001
Anguelovski, I., Chu, E., and Carmin, J. A. (2014). Variations in approaches to urban climate adaptation: experiences and experimentation from the global south. Glob. Environ. Chang. 27, 156–167. doi: 10.1016/j.gloenvcha.2014.05.010
Audefroy, J. F., and Sánchez, B. N. C. (2017). Integrating local knowledge for climate change adaptation in Yucatán, Mexico. Int. J. Sustain. Built Environ. 6, 228–237. doi: 10.1016/j.ijsbe.2017.03.007
Avelino, F. (2017). Power in sustainability transitions: Analysing power and (dis)empowerment in transformative change towards sustainability. Environ. Policy Gov. 27, 505–520. doi: 10.1002/eet.1777
Avelino, F. (2021). Theories of power and social change. Power contestations and their implications for research on social change and innovation. J. Polit. Power 14, 425–448. doi: 10.1080/2158379X.2021.1875307
Avelino, F., Wittmayer, J., Haxeltine, A., et al. (2014). Game changers and transformative social innovation. The case of the economic crisis and the new economy. TRANSIT work pap 1:TRANSIT: EU SSH.2013.3.2-1
Barth, M., Jiménez-Aceituno, A., Lam, D. P., Bürgener, L., and Lang, D. J. (2023). Transdisciplinary learning as a key leverage for sustainability transformations. Curr. Opin. Environ. Sustain. 64:101361. doi: 10.1016/j.cosust.2023.101361
Bartholomew, E., and Kwakkel, J. H. (2020). On considering robustness in the search phase of robust decision making: a comparison of many-objective robust decision making, multi-scenario many-objective robust decision making, and many objective robust optimization. Environ. Model. Softw. 127:104699. doi: 10.1016/j.envsoft.2020.104699
Bauer-Gottwein, P., Gondwe, B. R. N., Charvet, G., Marín, L. E., Rebolledo-Vieyra, M., and Merediz-Alonso, G. (2011). Review: the Yucatán peninsula karst aquifer, Mexico. Hydrogeol. J. 19, 507–524. doi: 10.1007/s10040-010-0699-5
Black, R. L., Oldham, W. J. B., and Marcy, W. M. (1994). Training KSIM models from time series data. Technol. Forecast. Soc. Change. 47, 293–307. doi: 10.1016/0040-1625(94)90070-1
Bojórquez-Tapia, L. A., and Eakin, H. (2018). “Conflict and collaboration in defining the “desired state”: The case of Cozumel, Mexico” in Collaborative Resilience: Moving Through Crisis to Opportunity (Cambridge, MA: The MIT Press), 153–176.
Bojórquez-Tapia, L. A., Eakin, H., Reed, P. M., Miquelajauregui, Y., Grave, I., Merino-Benítez, T., et al. (2022). Unveiling uncertainties to enhance sustainability transformations in infrastructure decision-making. Curr. Opin. Environ. Sustain. 55, 101172–101110. doi: 10.1016/j.cosust.2022.101172
Bojórquez-Tapia, L. A., Ponce-Díaz, G., Pedroza-Páez, D., Díaz-de-León, A. J., and Arreguín-Sánchez, F. (2021). Application of exploratory modeling in support of transdisciplinary inquiry: regulation of fishing bycatch of loggerhead sea turtles in gulf of Ulloa, Mexico. Front. Mar. Sci. 8:643347. doi: 10.3389/fmars.2021.643347
Breiman, L., Friedman, J., Stone, C. J., and Olshen, R. A. (1984). Classification and regression trees, Boca Raton, FL: CRC Press.
Bremer, S., and Meisch, S. (2017). Co-production in climate change research: reviewing different perspectives. Wiley Interdiscip. Rev. Clim. Chang. 8, 1–22. doi: 10.1002/wcc.482
Brown, C. (2010). Decision-scaling for robust planning and policy under climate uncertainty. World Resources Report 2010-2011 Uncertainty Series. Washington, DC.
Bunge, M. (2004). How does it work? The search for explanatory mechanisms. Philos. Soc. Sci. 34, 182–210. doi: 10.1177/0048393103262550
Calliari, E., Michetti, M., Farnia, L., and Ramieri, E. (2019). A network approach for moving from planning to implementation in climate change adaptation: evidence from southern Mexico. Environ Sci Policy 93, 146–157. doi: 10.1016/j.envsci.2018.11.025
Campos, M., Velázquez, A., and McCall, M. (2014). Adaptation strategies to climatic variability: a case study of small-scale farmers in rural Mexico. Land Use Policy 38, 533–540. doi: 10.1016/j.landusepol.2013.12.017
Cannon, T. (2008). Vulnerability, “innocent” disasters and the imperative of cultural understanding. Disaster prevention and management. A. Int. J. 17, 350–357. doi: 10.1108/09653560810887275
Canul-Macario, C., Salles, P., Hernández-Espriú, A., and Pacheco-Castro, R. (2020). Empirical relationships of groundwater head–salinity response to variations of sea level and vertical recharge in coastal confined karst aquifers. Hydrogeol. J. 28, 1679–1694. doi: 10.1007/s10040-020-02151-9
Casáres, R. S. (2006). Hidrogeología de la zona de descarga del acuífero del Estado de Yucatán y sus implicaciones ambientales. [Dissertation/master’s tesis]. [Mérida (Yucatán)]: Universidad Autónoma de Yucatán. Facultad de Ingeniería. Unidad de Posgrado e Investigación.
Clark, W., and Holliday, L. (2006). Linking knowledge with action for sustainable development: The role of program management-summary of a workshop. Washington, DC: National Research Council of the National Academies Press.
Cutter, S. L., Boruff, J. B., and Shirley, L. W. (2003). “Social vulnerability to environmental hazards” in Hazards vulnerability and environmental justice, vol. 84 (Abingdon: Routledge), 242–261.
Dakos, V., and Bascompte, J. (2014). Critical slowing down as early warning for the onset of collapse in mutualistic communities. Proc. Natl. Acad. Sci. USA 111, 17546–17551. doi: 10.1073/pnas.1406326111
Dalal, S., Han, B., Lempert, R. J., Jaycocks, A., and Hackbarth, A. (2013). Improving scenario discovery using orthogonal rotations. Environ. Mod. Soft. 48, 49–64. doi: 10.1016/j.envsoft.2013.05.013
Digby, P. G. N., and Kempton, R. A. (1987). Multivariate Analysis of Ecological Communities. London: Chap man and Hall.
Dilley, M., Chen, U., Deichmann, R. S., Lerner-Lam, A., and Arnold, M. (2005). “Natural disaster hotspots: a global risk analysis” in Disaster risk management series. ed. M. Dilley, vol. 5 (Washington, DC: The World Bank), 12–148.
DOGEY. (2014). Programa Especial de Acción ante el Cambio Climático. Diario Oficial del Gobierno del Estado de Yucatán. pp. 2012–2018. Available at: http://www.ccpy.gob.mx/agenda-yucatan/programa-estatal-cambio-climatico.php.
Douglas, J. (2007). Physical vulnerability modelling in natural hazard risk assessment. Nat. Haz. Earth Sys. Sci. 7, 283–288. doi: 10.5194/nhess-7-283-2007
Eakin, H., Bojórquez-Tapia, L. A., Diaz, R. M., Castellanos, E., and Haggar, J. (2011). Adaptive capacity and social-environmental change: theoretical and operational modeling of smallholder coffee systems response in mesoamerican pacific rim. Environ. Manag. 47, 352–367. doi: 10.1007/s00267-010-9603-2
Eakin, H., and Luers, A. L. (2006). Assessing the vulnerability of social-environmental systems. Annu. Rev. Environ. Resour. 31, 365–394. doi: 10.1146/annurev.energy.30.050504.144352
Eisenack, K., Lüdeke, M. K. B., Petschel-Held, G., et al. (2007). Qualitative modelling techniques to assess patterns of global change. Adv. Methods. Decis. Mak. Risk. Manag. Sustain. Sci. 1, 83–127.
Elsawah, S., Filatova, T., Jakeman, A. J., Kettner, A. J., Zellner, M. L., Athanasiadis, I. N., et al. (2020). Eight grand challenges in socio-environmental systems modeling. Soc. Environ. Syst. Model. 2:16226. doi: 10.18174/sesmo.2020a16226
Eriksen, S., Schipper, E. L. F., Scoville-Simonds, M., Vincent, K., Adam, H. N., Brooks, N., et al. (2021). Adaptation interventions and their effect on vulnerability in developing countries: help, hindrance or irrelevance? World Dev. 141:105383. doi: 10.1016/j.worlddev.2020.105383
Escolero, O. A., Marín, L. E., Steinich, B., and Pacheco, J. (2000). Delimitation of a hydrogeological reserve for a city within a karstic aquifer: the Merida, Yucatan example. Land. Urb. Pl. 51, 53–62. doi: 10.1016/S0169-2046(00)00096-7
Escudero, M., and Mendoza, E. (2021). Community perception and adaptation to climate change in coastal areas of Mexico. Water (Switzerland) 13:483. doi: 10.3390/w13182483
Fatemi, F., Ardalan, A., Aguirre, B., Mansouri, N., and Mohammadfam, I. (2017). Social vulnerability indicators in disasters: findings from a systematic review. Int. J. Disast. Risk Reduct. 22, 219–227. doi: 10.1016/j.ijdrr.2016.09.006
Flanagan, B. E., Gregory, E. W., Hallisey, E. J., Heitgerd, J. L., and Lewis, B. (2011). A social vulnerability index for disaster management. J. Homel. Secur. Emerg. Manag. 8:1792. doi: 10.2202/1547-7355.1792
Folke, C., Carpenter, S. R., Walker, B., Scheffer, M., Chapin, T., and Rockström, J. (2010). Resilience thinking: integrating resilience, adaptability and transformability. Ecol. Soc. 15:191. doi: 10.1038/nnano.2011.191
Forbus, K. D. (2011). Qualitative modeling. Wiley Interdiscip. Rev. Cogn. Sci. 2, 374–391. doi: 10.1002/wcs.115
Fordham, M., Lovekamp, W. E., Thomas, D. S., and Phillips, B. D. (2013). “Understanding social vulnerability” in Social vulnerability to disasters. eds. D. S. K. Thomas, B. D. Phillips, W. E. Lovekamp, and A. Fothergill. 2nd ed (Boca Raton, FL: CRC Press), 1–29.
Friedman, J. H., and Fisher, N. I. (1999). Bump hunting in high-dimensional data. Stat. Comput. 9, 123–143. doi: 10.1023/A:1008894516817
Gallina, V., Torresan, S., Critto, A., Sperotto, A., Glade, T., and Marcomini, A. (2016). A review of multi-risk methodologies for natural hazards: consequences and challenges for a climate change impact assessment. J. Environ. Manag. 168, 123–132. doi: 10.1016/j.jenvman.2015.11.011
Garuti, C., Cerda, A., and Cabezas, C. (2022). “Multicriteria decision-making for risks of natural disaster in social project assessments” in Earth Systems Protection and sustainability. eds. J. N. Furze, S. Eslamian, S. M. Raafat, and K. Swing (Cham: Springer)
Gay, C., Estrada, F., Conde, C., Eakin, H., and Villers, L. (2006). Potential impacts of climate change on agriculture: a case of study of coffee production in Veracruz, Mexico. Clim. Chan. 79, 259–288. doi: 10.1007/s10584-006-9066-x
Gerstengarbe, F. W., Hoffmann, P., Österle, H., and Werner, P. C. (2015). Ensemble simulations for the RCP8. 5-scenario. 24: Meteorol. Z. 24, 147–156. doi: 10.1127/metz/2014/0523
Gower, J. C., (1966). Some distance properties of latent roots and vector methods used in multivariate analysis. Biometrika 53, 325–338. doi: 10.1093/biomet/53.3-4.325
Gunaratnam, Y. (2013). Cultural vulnerability: a narrative approach to intercultural care. Qual. Soc. Work. 12, 104–118. doi: 10.1177/1473325011420323
Harborne, A. R., Rogers, A., Bozec, Y. M., and Mumby, P. J. (2017). Multiple stressors and the functioning of coral reefs. Annu. Rev. Mar. Sci. 9, 445–468. doi: 10.1146/annurev-marine-010816-060551
Hartshorn, S. (2016). Machine learning with random forests and decision trees: A visual guide for beginners. Kindle.
Ha, T. T. V., Fan, H., and Shuang, L. (2021). Climate change impact assessment on Northeast China’s grain production. Environ. Sci. Pollut. Res. 28, 14508–14520. doi: 10.1007/s11356-020-11602-5
Herman, J. D., Reed, P. M., Zeff, H. B., and Characklis, G. W. (2015). How should robustness be defined for water systems planning under change? J. Water Resour. Plan. Manag. 141, 1–14. doi: 10.1061/(asce)wr.1943-5452.0000509
Ibarrarán, M. E., Malone, E. L., and Brenkert, A. L. (2010). Climate change vulnerability and resilience: current status and trends for Mexico. Environ. Dev. Sustain. 12, 365–388. doi: 10.1007/s10668-009-9201-8
INECC. (2016). Zonas funcionales de las cuencas hidrográficas de México. Instituto Nacional de Ecología y Cambio Climático (INECC), SEMARNAT. Escala 1:250,000. Actualización 2016. México.
IPCC. (2023). Summary for policymakers. In: Climate Change 2023: Synthesis report. A report of the Intergovernmental Plane on Climate Change.
Jafino, B. A., Kwakkel, J. H., and Taebi, B. (2021). Enabling assessment of distributive justice through models for climate change planning: a review of recent advances and a research agenda. Wiley Interdiscip. Rev. Clim. Chang. 12, 1–23. doi: 10.1002/wcc.721
Jasanoff, S. (2004). States of knowledge: The co-production of science and social order. Routledge: London, New York.
Johansson, J., and Forsell, C. (2016). Evaluation of parallel coordinates: overview, categorization and guidelines for future research. IEEE Trans. Vis. Comput. Graph. 22, 579–588. doi: 10.1109/TVCG.2015.2466992
Jones, R. N. (2001). An environmental risk assessment/management framework for climate change impact assessments. Nat. Hazards 23, 197–230. doi: 10.1023/A:1011148019213
Kane, J. (1972). A primer for a new cross-impact language- KSIM. Technol. Forecast. Soc. Change. 4, 129–142. doi: 10.1016/0040-1625(72)90010-8
Kane, J., Vertinsky, I., and Thomson, W. (1973). KSIM: a methodology for interactive resource policy simulation. Water Resour. Res. 9, 65–79. doi: 10.1029/WR009i001p00065
Kappes, M. S., Papathoma-Koehle, M., and Keiler, M. (2012). Assessing physical vulnerability for multi-hazards using an indicator-based methodology. Appl. Geogr. 32, 577–590. doi: 10.1016/j.apgeog.2011.07.002
Khamassi, I., Sayed-Mouchaweh, M., Hammami, M., and Ghédira, K. (2018). Discussion and review on evolving data streams and concept drift adapting. Evolv. Syst. 9, 1–23. doi: 10.1007/s12530-016-9168-2
Langsdale, S. M., Beall, A., Carmichael, J., Cohen, S. J., Forster, C. B., and Neale, T. (2009). Exploring the implications of climate change on water resources through participatory modeling: case study of the Okanagan Basin, British Columbia. J. Water Resour. Plan. Manag. 135, 373–381. doi: 10.1061/(asce)0733-9496(2009)135:5(373)
Lan, J., Ma, Y., Zhu, D., Mangalagiu, D., and Thornton, T. F. (2017). Enabling value co-creation in the sharing economy: the case of Mobike. Sustain. For. 9:1504. doi: 10.3390/su9091504
Lempert, R. J., Miro, M., and Prosdocimi, D. (2021). A DMDU guidebook for transportation planning under a changing climate. Washington, DC: Inter-American Development Bank.
Lempert, R. J., and Turner, S. (2021). Engaging multiple worldviews with quantitative decision support: a robust decision-making demonstration using the Lake model. Risk Anal. 41, 845–865. doi: 10.1111/risa.13579
Lerman, RI, and Yitzhaki, S (1989). Improving the accuracy of estimates of Gini coefficients. J Econom 42:43–47. doi: 10.1016/0304-4076(89)90074-2
Luers, A. L. (2005). The surface of vulnerability: an analytical framework for examining environmental change. Glob. Environ. Chang. 15, 214–223. doi: 10.1016/j.gloenvcha.2005.04.003
Luers, A. L., Lobell, D. B., Sklar, L. S., Addams, C. L., and Matson, P. A. (2003). A method for quantifying vulnerability, applied to the agricultural system of the Yaqui Valley, Mexico. Glob. Environ. Change. 13, 255–267. doi: 10.1016/S0959-3780(03)00054-2
Malekpour, S., Walker, W. E., de Haan, F. J., de Haan, F. J., Frantzeskaki, N., and Marchau, V. A. W. (2020). Bridging decision making under deep uncertainty (DMDU) and transition management (TM) to improve strategic planning for sustainable development. Environ. Sci. Pol. 107, 158–167. doi: 10.1016/j.envsci.2020.03.002
Mannucci, S., and Morganti, M. (2022). How to tackle climate fragilities by DMDU. Making possible with regenerative design. TECHNE 1, 45–53. doi: 10.36253/techne-12136
Marchau, V., Walker, W., Bloemen, P., and Popper, S. (2019). Decision making under deep uncertainty. From Theory to Practice. Berlin: Springer.
Marín, L. E., and Perry, E. C. (1994). The hydrogeology and contamination potential of northwestern Yucatan, Mexico. Geofísca Int. 33, 619–623. doi: 10.22201/igeof.00167169p.1994.33.4.594
Ma, Y., Thornton, T. F., Mangalagiu, D., Lan, J., Hestad, D., Apostoli, E. C., et al. (2020). Co-creation, co-evolution and co-governance: understanding green businesses and urban transformations. Clim. Chang. 160, 621–636. doi: 10.1007/s10584-019-02541-3
McPhail, C., Maier, H. R., Kwakkel, J. H., Giuliani, M., Castelletti, A., and Westra, S. (2018). Robustness metrics: how are they calculated, when should they be used and why do they give different results? Earths Future 6, 169–191. doi: 10.1002/2017EF000649
Merino-Benítez, T., Grave, I., and Bojórquez-Tapia, L. A. (2020). AHP- based social vulnerability index for small fisheries in Yucatan, Mexico. International symposium of the analytic hierarchy process 2020, web conference. DEC. 3 – DEC. 6. 2, pp. 1–5.
Moallemi, E. A., Kwakkel, J., de Haan, F. J., and Bryan, B. A. (2020). Exploratory modeling for analyzing coupled human-natural systems under uncertainty. Glob. Environ. Chang. 65:102186. doi: 10.1016/j.gloenvcha.2020.102186
Moser, S. (2010). Now more than ever: the need for more societally relevant research on vulnerability and adaptation to climate change. Appl. Geogr. 30, 464–474. doi: 10.1016/j.apgeog.2009.09.003
Murali, R. M., Riyas, M. J., Reshma, K. N., and Kumar, S. S. (2020). Climate change impact and vulnerability assessment of Mumbai city, India. Nat. Hazards 102, 575–589. doi: 10.1007/s11069-019-03766-2
Muudeni, S. M. (2023). Co-production process with coastal communities: Surfacing Ocean knowledge, relationships and culture. ACM Int. Conf. Proc. Ser. 2023, 119–123. doi: 10.1145/3593743.3593766
Orellana, R., Espadas, E., Conde, C., and Gay, C. (2009). Atlas: Escenarios de cambio climático en la Península de Yucatán. Prob. Des. 43, 191–193.
Páez, D. P., Bojórquez-Tapia, L. A., Delgado Ramos, G. C., and Chavero, E. L. (2020). Understanding translation: co-production of knowledge in marine spatial planning. Ocean Coast. Manag. 190:105163. doi: 10.1016/j.ocecoaman.2020.105163
Pedersen, J. T. S., van Vuuren, D., Gupta, J., Santos, F. D., Edmonds, J., and Swart, R. (2022). IPCC emission scenarios: how did critiques affect their quality and relevance 1990–2022? Glob. Environ. Chang. 75:102538. doi: 10.1016/j.gloenvcha.2022.102538
Pérez-Ceballos, R. Y. (2011). Modelo Hidrogeoquímico para la zona del anillo de cenotes de Yucatán, México. [dissertation/PhD thesis]. [Mérida (Yucatán)]: CINVESTAV-IPN, Depto. Recursos del Mar.
Perry, E., Marín, L., McClain, J., and Velázquez, G. (1995). Ring of cenotes (sinkholes), Northwest Yucatan, Mexico: its hydrogeologic characteristics and possible association with the Chixculub impact crater. Geo GSA 23, 17–20. doi: 10.1130/0091-7613(1995)023<0017:ROCSNY>2.3.CO;2
POGO. (2022) Gulf of Mexico Oceanographic and Meteorological Observation Group (GMOMOG). Available at: https://pogo-ocean.org/innovation-in-ocean-observing/activities/gulf-of-mexico-oceanographic-and-meteorological-observation-group-gmomog/ (Accessed February 8, 2024).
Pope, K. O., Ocampo, A. C., and Duller, C. E. (1993). Surficial geology of the Chicxulub impact crater, Yucatan, Mexico. Earth Moon Planets 63, 93–104. doi: 10.1007/BF00575099
Raso, L., Kwakkel, J., Timmermans, J., and Panthou, G. (2019). How to evaluate a monitoring system for adaptive policies: criteria for signposts selection and their model-based evaluation. Clim. Chang. 153, 267–283. doi: 10.1007/s10584-018-2355-3
Rittel, H. W. J., and Webber, M. M. (1973). Dilemmas in a general theory of planning. Policy. Sci. 4, 155–169. doi: 10.1007/BF01405730
IPCC (2014). “Climate change 2014: synthesis report” in Contribution of working groups I, II, and III to the fifth assessment report of the intergovernmental panel on climate change. eds. R. K. Pachauri and L. A. Meyer (Geneva, Switzerland: IPCC), 151.
Roopnarine, P. D. (2008). Catastrophe theory, Encyclopedia of Ecology. Amsterdam, Netherlands: Elsevier, pp. 531–536.
Ruiz-Mallén, I. (2020). Co-production and resilient cities to climate change, in participatory research and planning in practice (eBook). Berlin: SpringerOpen.
Ruof, C. M. (2004). Vulnerability, vulnerable populations, and policy. Kennedy Inst. Ethics J. 14, 411–425. doi: 10.1353/ken.2004.0044
Saaty, T. L. (2001). “Fundamentals of the analytic hierarchy process” in The analytic hierarchy process in natural resource and environmental decision making. eds. D. L. Schmoldt, J. Kangas, G. A. Mendoza, and M. Pesonen, vol. 3 (Dordrecht: Kluwer Academic Press), 15–35.
Sabbioni, C., Cassar, M., Brimblecombe, P., and Lefevre, R. A. (2008). Vulnerability of cultural heritage to climate change. European and Mediterranean Major Hazards Agreement (EUR-OPA), 1-24.
Sáenz-Romero, C., Rehfeldt, G. E., Crookston, N. L., Duval, P., and Beaulieu, J. (2012). Spline models of contemporary, 2030, 2060 and 2090 climates for Michoacán state, México, impacts on the vegetation. Rev. Fitotec. Mex. 35, 333–345. doi: 10.35196/rfm.2012.4.333
Saldana-Zorrilla, S. O. (2014). Assessment of disaster risk management in Mexico. Disaster Prevent. Manage. 24, 230–248.
Samaniego, J. (2009). “Cambio Climático y Desarrollo En América Latina y el Caribe: Una Reseña” in Documento De Proyecto. Comisión Económica Para América Latina y el Caribe (CEPAL). ed. J. Samaniego (Santiago de Chile: Naciones Unidas), 148.
Savoska, S., and Loskovska, S. (2009). “Parallel coordinates as tool of exploratory data analysis” in 17th telecommunications forum TELFOR. ed. S. Savoska (Belgrade: Serbia), 24–26.
Scheffer, M., Carpenter, S. R., Lenton, T. M., Bascompte, J., Brock, W., Dakos, V., et al. (2012). Anticipating critical transitions. Science 338, 344–348. doi: 10.1126/science.1225244
SEDUMA (2010). Climas: precipitación más frecuente. Secretaría de desarrollo urbano y medio ambiente del estado de Yucatán. Available at: http://www.seduma.yucatan.gob.mx/mapas-sig/index.php.
Trainter, J. A. (1988). The collapse of complex societies. New Studies in Archaeology, Cambridge University Press: United Kingdom
Trussel, J. M. (2002). Revisiting the prediction of financial vulnerability. Nonprofit Manag. Leadersh. 13, 17–31. doi: 10.1002/nml.13103
Tversky, A., and Fox, C. R. (1995). Weighing risk and uncertainty. Psy. Rev. 102, 269–283. doi: 10.1037/0033-295X.102.2.269
United Nations. (2022). Handbook of statistics 2022. Geneva: United nations conference on trade and development.
Vaghefi, S. A., Muccione, V., van Ginkel, K. C., and Haasnoot, M. (2021). Using decision making under deep uncertainty (DMDU) approaches to support climate change adaptation of Swiss ski resorts. Environ. Sci. Pol. 126, 65–78. doi: 10.1016/j.envsci.2021.09.005
Van den Belt, M. (2004). Mediated modeling: A system dynamics approach to environmental consensus building. Washington, DC: Island Press.
Van Kerkhoff, L. E., and Lebel, L. (2015). Coproductive capacities: rethinking science-governance relations in a diverse world. Ecol. Soc. 20:14. doi: 10.5751/ES-07188-200114
Vargas, L. G. (1982). Reciprocal matrices with random coefficients. Math. Model. 3, 69–81. doi: 10.1016/0270-0255(82)90013-6
Walker, B., Holling, C. S., Carpenter, S. R., and Kinzig, A. (2004). Resilience, adaptability and transformability in social-ecological systems. Ecol. Soc. 9:5. doi: 10.5751/ES-00650-090205
Wamsler, C. (2016). From risk governance to city-citizen collaboration: capitalizing on individual adaptation to climate change. Environ. Policy Gov. 26, 184–204. doi: 10.1002/eet.1707
White, KP (1981). The Equilibria of KSIM Models: Existence, Stability, and Implications. IEEE Trans Syst Man Cybern 11:564–570. doi: 10.1109/TSMC.1981.4308745
Wilby, R. L. (2005). Uncertainty in water resource model parameters used for climate change impact assessment. Hydrol. Process. 19, 3201–3219. doi: 10.1002/hyp.5819
Wisner, B., Blaikie, P., Cannon, T., and Davis, I. (2003). At risk: Natural hazards, People’s vulnerability and disasters. London: Routledge.
WMO. (2024). WMO Integrated Global Observing System. Available at: https://wmo.int/activities/wmo-integrated-global-observing-system-wigos/wmo-integrated-global-observing-system (Accessed February 8, 2024).
WRI. (2023). Adaptation Action Coalition: A state-led coalition accelerating global action on adaptation to achieve a climate resilient world. World Resource Institute. Available at: https://www.wri.org/initiatives/adaptation-action-coalition#:~:text=Mission%3A%20The%20AACs%20primary%20aim,Action%20on%20Adaptation%20and%20Resilience (Accessed October 3, 2023).
Wright, L. D., and Nichols, C. R. (2019). “Tomorrow’s coasts: complex and impermanent” in Coastal research library. ed. C. W. Finkl (Berlin: Springer)
Wyborn, C., Datta, A., Montana, J., Ryan, M., Leith, P., Chaffin, B., et al. (2019). Co-producing sustainability: reordering the governance of science, policy, and practice. Annu. Rev. Environ. Resour. 44, 319–346. doi: 10.1146/annurev-environ-101718-033103
York, A. M., Drummond Otten, C., BurnSilver, S., Neuberg, S. L., and Anderies, J. M. (2021). Integrating institutional approaches and decision science to address climate change: a multi-level collective action research agenda. Curr. Opin. Environ. Sustain. 52, 19–26. doi: 10.1016/j.cosust.2021.06.001
Keywords: vulnerability, robustness, systems dynamic modeling, spatial planning, DMDU, KSIM, coastal zone, adaptation
Citation: Merino-Benítez T, Bojórquez-Tapia LA, Miquelajauregui Y and Batllori-Sampedro E (2024) Navigating climate change complexity and deep uncertainty: approach for building socio-ecological resilience using qualitative dynamic simulation. Front. Clim. 6:1331945. doi: 10.3389/fclim.2024.1331945
Edited by:
Edmundo Molina-Perez, Monterrey Institute of Technology and Higher Education (ITESM), MexicoReviewed by:
Charles Reid Nichols, Marine Information Resources Corporation, United StatesRoberto Duran-Fernandez, Monterrey Institute of Technology and Higher Education (ITESM), Mexico
Copyright © 2024 Merino-Benítez, Bojórquez-Tapia, Miquelajauregui and Batllori-Sampedro. This is an open-access article distributed under the terms of the Creative Commons Attribution License (CC BY). The use, distribution or reproduction in other forums is permitted, provided the original author(s) and the copyright owner(s) are credited and that the original publication in this journal is cited, in accordance with accepted academic practice. No use, distribution or reproduction is permitted which does not comply with these terms.
*Correspondence: Luis Antonio Bojórquez-Tapia, Ym9qb3JxdWV6QGVjb2xvZ2lhLnVuYW0ubXg=