 Manon Abegg
 Zeynep Clulow
 Lucrezia Nava
 David M. Reiner
94% of researchers rate our articles as excellent or good
Learn more about the work of our research integrity team to safeguard the quality of each article we publish.
Find out more
ORIGINAL RESEARCH article
Front. Clim., 21 May 2024
Sec. Carbon Dioxide Removal
Volume 6 - 2024 | https://doi.org/10.3389/fclim.2024.1331901
This article is part of the Research TopicCarbon dioxide removal: Perspectives from the social sciences and humanitiesView all 13 articles
Introduction: To achieve net-zero targets, it is essential to evaluate and model the costs and scalability of emerging carbon dioxide removal technologies like direct air capture with CO2 storage (DACCS) and bioenergy with carbon capture and storage (BECCS). Yet such efforts are often impeded by varying assessments of the climate impact and potential contributions of these technologies. This study explores the future costs and scalability of DACCS and BECCS to advance net-zero goals.
Methods: We analyze expert opinions on these technologies’ potential costs and deployment scales for 2030, 2040, and 2050. Data was collected from 34 experts, comprising 21 DACCS and 13 BECCS specialists. They provided 90% confidence interval estimates and ‘best estimates’ for future costs and deployment under two International Energy Agency (IEA) policy scenarios—Stated Policies (STEPS) and Net Zero Emissions by 2050 (NZE).
Results: We find that BECCS costs start at a lower level but decrease more slowly, whereas DACCS costs decline more steeply from a higher initial cost. However, DACCS estimates varied significantly among experts, showing no convergence over time. Regarding potential scalability, both technologies are associated with substantially higher deployment under the NZE scenario. Yet the combined estimated capacity of DACCS and BECCS by 2050 is only about a quarter of the CO2 removals projected by the IEA for its NZE scenario (1.9 GtCO2).
Discussion: This study provides valuable insights into the future of DACCS and BECCS technologies in Europe, especially since our experts expect that DACCS and BECCS costs will be even higher (and deployment scales lower) than those predicted by recent IEA tracking, opening future research directions.
The ultimate goal of the United Nations Framework Convention on Climate Change (UNFCCC) is to stabilize greenhouse gas concentrations in the atmosphere at safe levels to prevent hazardous anthropogenic interference with the climate system. This objective, as defined in the 2015 Paris Agreement, requires keeping the global temperature rise well below 2°C above pre-industrial levels, with efforts to limit the increase to 1.5°C. With global temperatures already 1.1°C higher than pre-industrial levels (IPCC, 2023), rapidly achieving carbon neutrality is imperative for a Paris-compliant trajectory. The Paris Agreement (Article 4.1) emphasizes balancing anthropogenic emissions with greenhouse gas removals in the latter half of this century. In pursuit of this balance, several countries including major economies such as the United Kingdom, France, the EU, Japan, South Korea, and the United States under President Biden, have set legally binding net-zero targets for 2050. Notably, major emerging economies such as China, Indonesia, and Saudi Arabia (targeting 2060), and India (targeting 2070) have also established carbon neutrality goals. Attaining these commitments solely through emission reductions is challenging. The energy sector, which faces rising marginal abatement costs and limited technical solutions in hard-to-abate sectors, exemplifies these difficulties (Davis et al., 2018). Consequently, achieving net-zero will require decarbonizing all viable sectors and utilizing Carbon Dioxide Removal (CDR) technologies to offset emissions from sectors that are difficult to decarbonize (Honegger and Reiner, 2018).
Reaching net zero requires political and economic decisions based on projections of technology deployment, which entails understanding the pace of cost reductions for different technologies, often referred to as ‘learning curves’, and assessing the potential scalability of these technologies under different policy scenarios. The modelling groups that contributed to the IPCC assessment report developed different socioeconomic development pathways for future CO2 levels that are compatible with the Paris Agreement. These mitigation pathways include the generation of green electricity and e-fuels, replacing primary chemicals with new fossil-free alternatives, reducing total energy demand, improving energy efficiency, and removing residual emissions from hard-to-abate industries such as steel and cement.
CDR is a crucial element in most Paris Agreement-aligned scenarios. Conventional CDR, or ‘nature-based’ solutions, involve land-based carbon storage methods such as afforestation, reforestation, soil carbon sequestration, and biochar (Smith et al., 2023). In contrast, novel ‘engineered removals’ store carbon in oceans, geological formations, or products, including technologies like enhanced weathering and ocean alkalinization. Our study specifically examines Direct Air Capture with CO2 Storage (DACCS) and Bioenergy with Carbon Capture and Storage (BECCS), which chemically separate CO2 for potential long-term storage.
The IPCC (2018) Special Report on 1.5°C indicated that only one scenario (P1), which assumed a significantly downsized energy system, could meet the 1.5°C target without substantial reliance on CDR. However, the Sixth Assessment Report (AR6), which the IPCC published in 2022 (IPCC, 2022), suggests a more comprehensive use of afforestation, reforestation, BECCS, and, to a lesser extent, DACCS, to achieve the 2°C target. These scenarios reflect substantial uncertainties regarding the deployment scales of these technologies, which are influenced by social acceptability, institutional capacity, and deployment costs. AR6’s Chapter Five further discusses how the scalability of emissions reduction and CDR are influenced by perceived and objective equity outcomes, trust in policymaking, socio-cultural preferences, and institutional governance capacity. Indeed, the (expanding) track-record of operational facilities shows that societal involvement in policymaking, building public trust and the existence of project outcomes that meet societal needs are often critical for successful deployment of these technologies (AR6; Clulow and Reiner, 2022; Erans et al., 2022).
While most models overlook these uncertainties, those that address them suggest significant implications for scalability. Accounting for cost uncertainty, for example, indicates a need for greater decarbonization in the 2020s to reduce long-term reliance on uncertain future CDR capabilities. According to one estimate, models that account for uncertainty predict a three-fold increase in renewable energy deployment by the 2030s compared to scenarios that do not consider uncertainty (Grant et al., 2021). From a policy standpoint, better modeling of these uncertainties could reduce reliance on CDR and pave the way for more ambitious emissions reduction commitments in the near-term. For policymakers to anticipate potential deployment trajectories and design effective support mechanisms, there is a need for reliable economic models that project cost and upscaling pathways for DACCS and BECCS. These models require two types of inputs; the uncertainty surrounding relevant parameters and expected best estimates for cost trajectories and the scale of deployment. Current cost data for these technologies is limited, mainly developed by private companies and not publicly available.
Our study investigates the future costs and deployment scale uncertainties of DACCS and BECCS technologies in Europe in 2030, 2040, and 2050. We also examine how future policies might influence these uncertainty levels. To gather experts’ insights, we conducted 34 expert elicitations by interviewing 21 DACCS experts and 13 BECCS experts. Initially, experts were asked to provide their 90% confidence intervals for future costs, breaking down various cost items like Capex and Opex where possible, and then to give their ‘best estimates’. These assessments contribute empirical data to the technology learning curves, which is crucial for projecting the future mitigation potentials of different options. Additionally, experts estimated the expected deployment scale of these technologies under two stylized policy scenarios: the International Energy Agency’s Stated Policies (STEPS) and Net Zero Emissions by 2050 (NZE). This approach helps us understand how different policy frameworks could affect the deployment of DACCS and BECCS.
Following this introduction, our paper is structured as follows: Section 2 reviews extant studies about current and future DACCS and BECCS costs and scalability. Section 3 details our study’s aims, research questions, scope and limitations. Section 4 describes our research methods and analytical tools, while Section 5 presents the results. Finally, Section 6 draws out conclusions, policy implications and recommendations for further research.
DACCS is a technology that addresses climate change by removing CO2 directly from the atmosphere. The process involves two main steps: (1) Direct Air Capture (DAC), which entails using chemical processes to capture CO2 from the ambient air; and (2) Carbon Storage, which entails injecting the CO2 into geological formations, such as depleted oil and gas fields or deep saline aquifers, where it is stored permanently and safely underground. Appendix A describes this technology in detail.
There are relatively few authoritative or peer-reviewed cost estimates of DACCS. Moreover, cost (and deployment) assessments vary widely because authors employ different analytical approaches and often start from divergent assumptions about cost drivers (summarized in Table 1). An early 2011 American Physical Society (APS) study estimated the cost of an aqueous technology similar to that presented here (Socolow et al., 2011). The APS “realistic” case had costs of 780 $/t-CO2-avoided and 550 $/t-CO2-captured, where the “avoided” value includes emission from electricity supply outside the plant boundary. Using a similar methodology, Keith et al. (2018) estimate levelized costs of $94 to $232 per ton CO2 from the atmosphere. The comprehensive review of NETs by the NASEM (2019) concludes that DACCS costs could span a wide range of cost estimates from $100 to $1000/tCO2 as a function of commercialization, technological development, choice of technology and capex and opex costs. More optimistically, Lackner and Azarabadi (2021) find that capital investment of several hundred million dollars would be sufficient to bring down the cost of DAC to $100/ton. Another relatively early analysis that combines a review of earlier literature with an analysis of data from industrial sources estimates a much wider cost range spanning $10 to over $2500/tCO2. The well-known comprehensive IAM reviews by Fuss et al. (2018), Minx et al. (2018) and NASEM (2019) find near-term costs of $600-1000/tCO2 and estimate potential decreases to $100-300/tCO2, which are associated with significant, though not necessarily (climatically) sufficient CO2 removals of 0.5 to 5GtCO2 annually by mid-century.
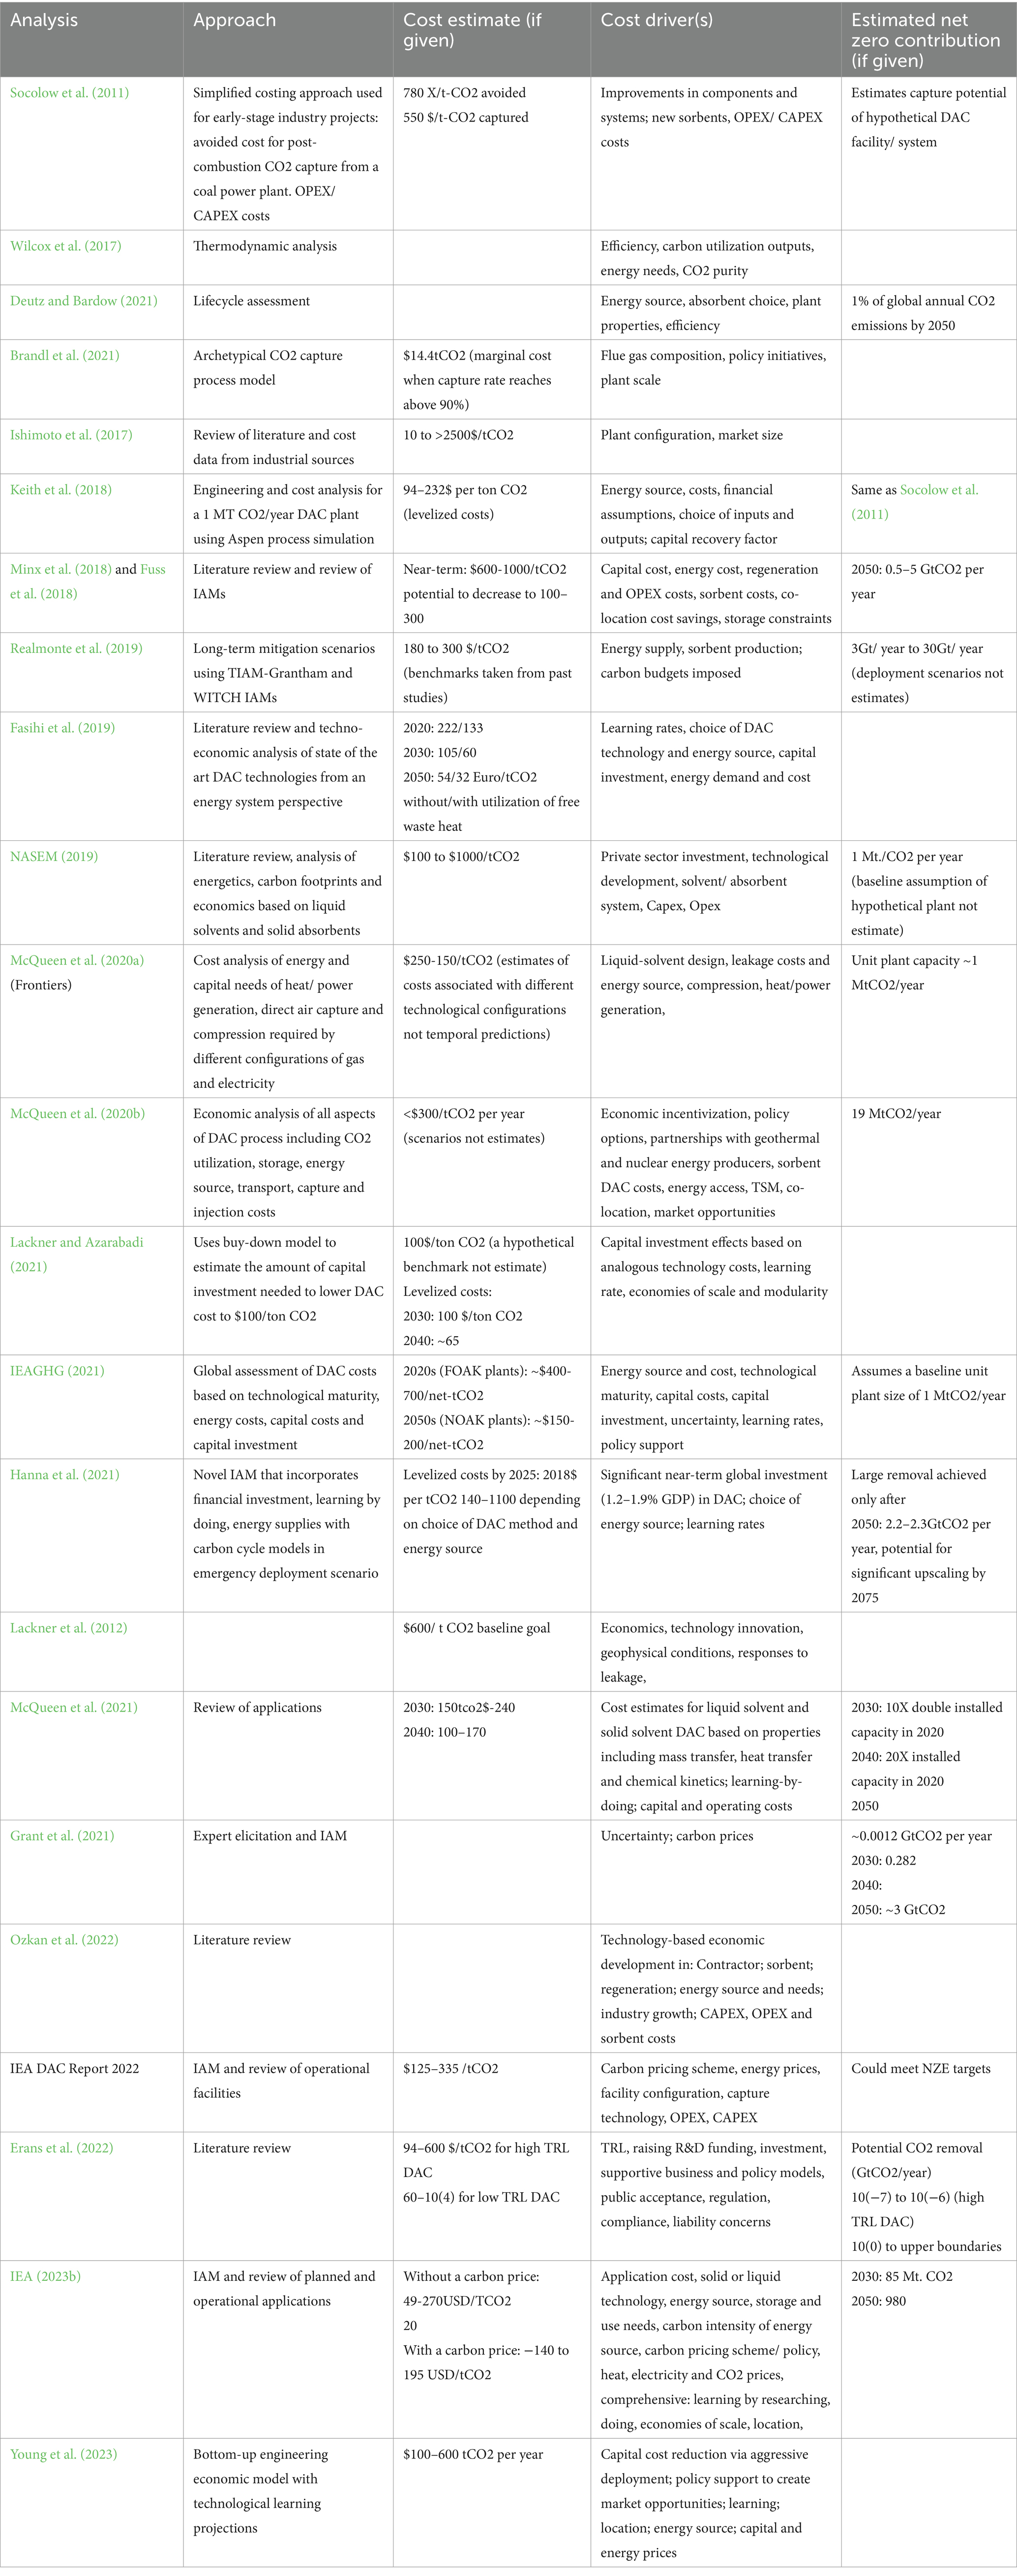
Table 1. Summary of DACCS cost and scalability analyses.
Using a different approach, Hanna et al. (2021) investigate an emergency DAC program that receives vast investment of 1.2–1.9% of global GDP annually and estimate a significant annual removal potential of 2.2–2.3 GtCO2 by 2050, which rises to 13–20 GtCO2 by 2075. In this analysis, significant near-term global investment, choices of energy and learning rates are the major cost drivers, which result in costs below $100/t by 2075 for some low temperature configurations. Later analyses that explore the influence of near-term investment and learning rates also reach relatively optimistic conclusions; with near-term costs falling from ~$400–700 tCO2/year in the 2020s to ~$65–170 tCO2/year by mid-century (e.g., McQueen et al., 2020b; Lackner and Azarabadi, 2021). By contrast, more recent analyses (e.g., Young et al., 2023) find that DACCS capital costs do come down with large-scale deployment, but overall costs actually plateau by 2050 at a higher level of $100-600/t, reflecting both greater pessimism and also greater uncertainty over potential cost reductions. The role of uncertainty is also considered critical.
A handful of engineering and cost analyses estimate costs (and sometimes deployment scales) based on an assumed unit plant capacity (usually ~1 MtCO2/year). Most of these analyses reach relatively convergent estimates about potential cost reductions between $100–300/ tCO2 by mid-century (e.g., Fasihi et al., 2019; McQueen et al., 2020a; IEAGHG, 2021). By contrast, Realmonte et al.’s (2019) assessment of long-term mitigation scenarios using the TRAM-Grantham and WITCH IAMs reaches relatively pessimistic conclusions despite using relatively modest cost benchmarks ($180–350 tCO2) from past analyses. The authors foresee that demands on sorbent production and high energy inputs severely obstruct dramatic upscaling and estimate that the risk of relying on (unrealizable) DACCS at scale could lead to a global temperature overshoot of up to 0.8°C. Most similar to our analysis, Grant et al. (2021) conduct an expert analysis on DACCS, BECCS and afforestation/reforestation and find that a high uncertainty scenario is associated with 10 Gt CO2 more emissions reductions than a scenario that does not consider uncertainty.
There has been a significant growth in support for DAC projects over the past few years. The UK government was the first to establish substantial funding when it created the £100 m Innovation Fund to support DAC and other greenhouse gas removal options in Aug 2020. That funding was soon dwarfed by funding from the US Inflation Reduction Act, which included a 45Q tax credit of up to $180/t. The US Government also made a $3.5bn commitment to four large DAC hubs, of which the first phase was launched in Aug 2023 and included $1.2 billion in funding for new large projects in Texas (led by Occidental Petroleum/Carbon Engineering) and Louisiana (led by Battelle, Climeworks/Heirloom). The U.S. Department of Energy (2022) also established an overarching objective, termed the Carbon Negative Shot, of reducing costs to $100/tCO2 over the next decade. Ozkan et al. (2022) describe how progress needs to be made in terms of the contactor, sorbent, and regeneration to achieve $100/ton of CO2 or less. The policy environment, particularly the ambitiousness of carbon pricing and use of other incentivization mechanisms, also takes on a more prominent role in more recent assessments, which are increasingly broader and multidisciplinary in their analysis of cost drivers and feasibility. Indeed, alongside technological development, design problems, the DACCS process and investment, more recent cost and scalability estimates also consider the likely implications of learning by doing, co-location, governance, policy support, and synergies with other CDR and, increasingly, other mitigation approaches (e.g., IEA, 2021, 2023b; Erans et al., 2022; Young et al., 2023). Perhaps a reflection of the larger number of moving parts, later estimates are somewhat more cautious than earlier (purely engineering or economic/ investment) analyses, with annual costs estimated to reach $49–600 tCO2 by mid-century.
BECCS technology combines producing energy from biomass with capturing and storing carbon dioxide (CO2), potentially resulting in a net reduction of atmospheric CO2 and contributing to climate change mitigation efforts. Appendix B describes this technology in detail.
In general, earlier literature reviews are more optimistic in terms of scalability, with BECCS estimated to contribute between 1 to 21 GT CO2 annually by mid-century (Kemper, 2015; Minx et al., 2018) (see Table 2). The BECCS chapter of the comprehensive NASEM (2019) review mentioned above estimates an annual carbon removal potential of 10–15 GtCO2 per year by mid-century depending on commercialization, carbon flux, electricity cost and technological development. Later literature reviews tend to posit more cautious scalability estimates. For example, Consoli (2019) estimate 16 GTpa by 2100. Interestingly, lower scalability predictions are not obviously linked to higher cost estimates as many more recent cost estimates such as Consoli’s foresee notably low costs—as low as 20$/tCO2 in some sectors.

Table 2. Summary of BECCS cost and scalability analyses.
The breadth of cost and scalability estimates reflects the large number of moving parts and potential sources of uncertainty of BECCS deployment. Compared to DACCS, the BECCS process encompasses a greater number of steps including processes required for biomass production, processing into fuel or electric power, CO2 storage, investment in the power plant or biofuel production facility, CCS infrastructure, OPEC costs and the possibility of offsetting costs from potential revenues from energy generation (Clulow and Reiner, 2022). While economies of scale are expected to reduce costs until around mid-century, after a certain point, most analyses—whether from political economy (Honegger and Reiner, 2018), IAM (Fuss et al., 2018; Minx et al., 2018; NASEM, 2019; Butnar et al., 2020) or expert elicitation perspective (Grant et al., 2021)—concur that cost reduction and scalability will eventually be obstructed by limited resource inputs—mainly relating to land (and to a lesser extent water) for biomass generation and CO2 storage.
Despite the high variability of estimated costs arising from the modularity of the technology, and widespread expectation that costs in at least some sectors will fall below the industry target ($100/tCO2), most analyses suggest that BECCS will contribute around 2.5GtCO2 by mid-century —only a fraction of the 1380 MtCO2 pa required to be NZE-compliant, with the most recent IEA (2023a) tracking predicting a relatively modest scalability of 50MtCO2 pa by 2030.
In summary, the existing literature reveals that while there are some emerging efforts to estimate future costs and scalability potential for DACCS and BECCS, the available estimates are sparse and divergent, which could potentially hinder policymakers’ decision-making processes.
Our study aims to provide model-builders and policymakers with a better understanding of the uncertainty surrounding the costs and scalability of DACCS and BECCS technologies. The following section presents the contributions as well as scope and limitations of the research. Specifically, we aim to understand the current state of DACCS and BECCS technologies and how they may evolve in the future as well as the potential scalability of these technologies under different policy scenarios. Due to the lack of data on these technologies, we undertook expert elicitations to answer the following research questions:
1. How do the costs of DACCS and BECCS technology change over time? Does the uncertainty increase or decrease?
2. What is the potential scale of BECCS and DACCS that experts project will be deployed under the IEA STEPS and NZE policy scenarios? How does uncertainty evolve under the different policy scenarios?
This research is developed along three axes, which have previously been addressed separately but not collectively: (1) comparing DACCS and BECCS technologies; (2) providing uncertainty knowledge on costs and scalability estimates; and (3) gathering novel qualitative insights to explore factors that can influence the cost and scalability of the technologies. Apart from its novelty, our research can assist in improving the models used to project and analyze future decarbonization scenarios. Our expert elicitation study provides valuable insights into the evolution and future prospects of DACCS and BECCS technologies in Europe for the short (2030), medium (2040), and long term (2050). It offers detailed assessments of the costs, scalability, and uncertainties associated with these technologies under varying policy scenarios. Additionally, the interviews shed light on the political and technological challenges Europe may face in implementing these technologies.
In this study, we interviewed a total of 34 experts from October 2022 to January 2023, focusing on DACCS (21 experts) and BECCS (13 experts), with the difference in numbers due to availability and time constraints. Most experts were from the academic or research sectors in Europe. The minority of experts that were not based in Europe were briefed to base their responses on the European context. We opted for live interviews over online questionnaires to capture qualitative insights alongside quantitative data, allowing for dynamic discussions and deeper understanding of expert opinions. This approach has helped to establish a foundational database of current expert judgments on DACCS and BECCS. Furthermore, the design of our elicitation protocol facilitates this research to be extended in the future, for example, by adding new expert interviews on DACCS and BECCS to the existing database or interviewing experts on other carbon dioxide removal solutions.
While a large number of studies employ expert elicitation to evaluate the potential scalability of CCS more broadly (e.g., Abdulla et al., 2021; Machado et al., 2022), only a handful investigate the deployment of individual CDR options. For example, Shayegh et al. (2021) conducted an expert elicitation to assess judgments on the future costs, capacity, energy requirements, and downstream use of CO2 from solid and liquid sorbent DAC technologies. Their analysis of 18 expert elicitations from industry and academia found that while DAC costs are likely to decrease significantly by mid-century, they could remain about twice as high as the industry target of $100/tCO2. Vaughan and Gough (2016) engaged 18 climate and BECCS experts and concluded that Integrated Assessment Models (IAMs) incorporated unrealistic assumptions about BECCS and its supporting infrastructure. Izikowitz et al. (2023) consulted 54 experts on various criteria to identify optimal locations for DACCS plants and found that the US, Canada, China, and Australia are most favorable. Another recent study by Perdana et al. (2023) analysed 260 expert opinions on the impact of different innovations for achieving Net Zero focusing on technological and non-technological decarbonization solutions (Perdana et al., 2023).
These previous elicitations have either concentrated on a single technology or used questionnaires for data collection. Our work, however, aims to highlight the differences between DACCS and BECCS technologies not only in terms of costs but also scalability under different policy scenarios and utilizes a methodology that facilitates a deeper understanding of expert opinions. Consequently, the methodologies, questions, and system assumptions used in these studies differ from ours, making direct comparisons challenging. The relatively novel status of DACCS and BECCS technologies and narrow pool of experts with expertise on both technologies necessitated us to select separate groups of experts for each technology. We sought to minimise potential biases arising from differences between the groups of experts by employing a common interview protocol and framing cost and scalability forecasting around the same (STEPS and NZE) policy scenarios to facilitate novel comparisons to be made about expert opinions on both technologies. The interviews were semi-structured, which ensured that respondents were asked to provide insights on key issues under investigation while providing flexibility and opportunity for individual respondents to provide more detailed insights which were recorded as qualitative insights or forego parts of the interview, for example, if knowledge was lacking on costs.
Our study faces certain limitations. DACCS and BECCS technologies encompass a great degree of heterogeneity in terms of the technologies, processes, and methods employed. For example, various solvents can be utilized in DACCS to capture carbon dioxide from the atmosphere, while BECCS can utilize a diverse range of biomass feedstocks, including different types of crops, for carbon capture and storage. Considering the relatively small scale of our study, we established strict boundaries around DACCS and BECCS technologies to ensure the comparability of expert responses. This entailed delineating a set of specific assumptions regarding the technologies and type of plants involved in both DACCS and BECCS, which are detailed in the methods section. The primary purpose of setting these boundaries was to facilitate comparability across the responses of different experts, ensuring that our analysis was coherent and focused on directly comparable insights. Consequently, our findings are not generalizable beyond these specific technological boundaries. Therefore, our study does not consider systems that involve other forms of carbon storage, such as in cement, chemical products, or e-fuels.
Secondly, the results are inherently linked to the background, expertise, and location of the participating experts. Most interviewees had academic backgrounds in engineering or natural sciences and were based in Europe. To contextualize the data and address limitations related to specific regional factors, we supplemented quantitative findings with qualitative insights from these experts.
Finally, expert elicitations are susceptible to biases, which can stem from the methodology, experts preparation, or the interviewers’ own skill (Apostolakis, 1990; Morgan, 2014). We minimized common biases by employing a well-tested protocol and ensuring that experts were thoroughly briefed. However, cognitive biases such as anchoring or overconfidence, which are common in social sciences, are more challenging to eliminate. Anchoring bias can lead experts to overly rely on specific information like the 2020 cost breakdown, while overconfidence might result in inflated self-assessment of one’s own knowledge (Block and Harper, 1991). To mitigate these biases, experts were encouraged to use simple models to predict future costs and scalability and to consult relevant literature during the interviews as needed.
DACCS and BECCS are technologies that have been tested at pilot scale and are in the process of being deployed at larger scale. Despite this, the amount of public information on active projects is limited. There exists an array of qualitative forecasting methods which facilitate the creation of knowledge on subjects where real-life data is limited. For this research we decided to undertake expert elicitation, a method that supports the systematic gathering of quantitative and qualitative expert opinions. Our sample size was similar to those of previous studies. The in-person aspect ensures that experts provided quality answers, while giving them the freedom to provide context to the quantitative figures.
Historically, expert elicitations stem from probabilistic risk assessments of technological systems such as nuclear power plants or chemical process facilities. Interviewing a variety of experts using a formal protocol is one of the few ways to generate knowledge and quantitative data to characterize the risk or frequency of certain hazardous events. In past decades, expert elicitations gained attention in the field of climate science, particularly for IAMs or climate change modelling (Apostolakis, 1990). Expert elicitations have also been conducted for individual negative emission technologies (Vaughan and Gough, 2016; Shayegh et al., 2021; Perdana et al., 2023), but none employ a holistic elicitation method and use the same set of questions to compare DACCS and BECCS costs and scalability. In a field where there is so much uncertainty and where future trajectories are highly dependent on current political decisions, it is imperative to use a structured method. Expert elicitations typically constrain expert answers to a particular system or framework. Although this impedes the generalization of findings to a wider range of technologies, it allows for a coherent and systematic modelling of uncertainty for a set of given technologies (Zickfeld et al., 2010; Rai, 2013).
The experts for this elicitation were selected based on evidence of previous research or activities undertaken in this area. We compiled a database of more than 500 technical experts who have worked on carbon dioxide removal, who were then reviewed in terms of their level of expertise to answer the questions under consideration. 112 DACCS experts and 88 BECCS experts were contacted by email. Mailchimp was used to reach out to most of the experts. In total, 21 experts for DACCS and 13 for BECCS agreed to participate in the elicitation (equivalent to response rates of 19 and 15% for DACCS and BECCS respectively).
The selection of experts for both technologies included a diverse range of participants, encompassing academics and researchers from universities, research institutes, or think tanks and government, as well as practitioners working in firms developing these technologies. Moreover, they also are drawn from a number of different disciplines and background, so some will have more expertise in technical, or economic or policy dimensions. We recognize the variation in perspectives, motives, and assumptions across these distinct groups. Despite these differences, each expert could contribute a high level of familiarity and expertise with the technologies. Since perspectives on cost and scalability can vary, leading to differing degrees of optimism, it is crucial to encompass the entire spectrum of expert opinions. By including a wide range of viewpoints, we mitigate the risk of bias—whether overly optimistic or pessimistic—that could arise from focusing solely on one subgroup of experts. This comprehensive approach ensures a more balanced and representative understanding of the field.
The study was developed in the context of the European Commission Horizon 2020 Project, NEGEM. We therefore carried out two pilot elicitations for both DACCS and BECCS using experts from within the NEGEM consortium. The goal of these interviews was to ensure proper understanding of the system assumptions and questions. Despite some minor changes that were made to the reference assumptions following the pilots, the responses of these four experts are included in the larger study as none of the changes significantly affected the overall consistency of the questions. Table 3 lists the experts (including their primary affiliation) who participated in the expert elicitation in alphabetical order.1
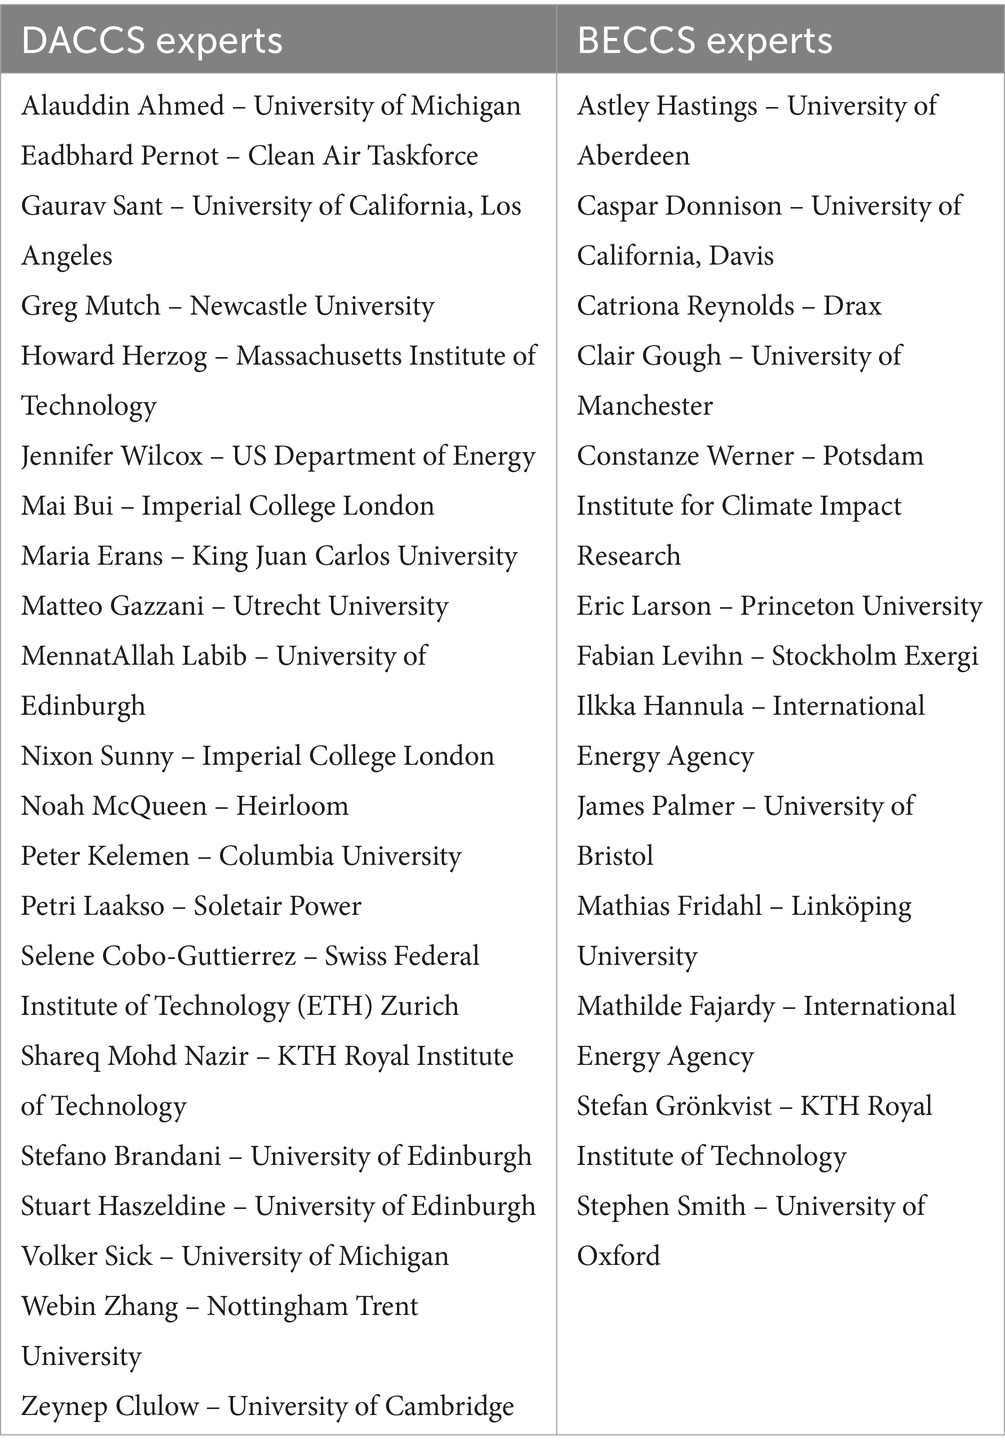
Table 3. Interviewed experts on DACCS and BECCS technologies and their principal affiliation.
Due to the multidisciplinary scope of the research, a mix of experts from academia, industry, policy, and technology fields was sought. Academics represent the largest share, comprising 62% of DACCS experts and 81% of BECCS experts, respectively.
Prior to the elicitation, experts were sent a two-pager along with the meeting invitation. The goal of this document was to inform experts on the NEGEM project and technological and policy assumptions used in the study. While these are presented in detail for each technology in Appendix C, it is worth noting that starting cost and scale assumptions were based on recent operational facilities; DACCS was based on the Climeworks process with total costs of 581 Euros/CO2t operating at ~1 Mt. CO2 capture capacity; and BECCS assumptions were derived from a Drax power plant with total costs of 172 Euro/CO2t operating at 909.5 Kt CO2 capture capacity.
A multi-page Excel-based protocol was developed to facilitate the visualization and organization of interview responses. The protocol included expert information, a review of system assumptions, questions on costs and energy usage (for DACCS) or costs, feedstock type and land usage (for BECCS), scalability under the two policy scenarios, and limiting factors and enabling policies.2
Experts provided their details, and then responded to quantitative questions about costs, energy, and other variables for 2030, 2040, and 2050, including minimum, maximum, and best estimates to represent a 90% confidence interval. The protocol also allowed experts to assess scalability under different scenarios, discuss technological variations, and rank limiting factors and enabling policies, and add new elements where necessary. Supporting information in the form of tables and graphs was available for visualization, review and amendment of answers.
In total, four different sets of data were examined for DACCS and BECCS technologies: future total costs, future breakdown costs, and scalability under the STEPS and the NZE policy scenarios, which are expected to substantially affect scalability.
Costs were described along three dimensions: (1) cost type: total cost, capex, opex, heat and fuel, feedstock, revenue, and CO2 transport, storage and monitoring; (2) year: 2030, 2040, or 2050; and (3) estimate type: minimum, maximum, or best estimate (BE). First, the trajectories of all obtained min-max ranges were analyzed using a scatterplot. For this, only the total costs and breakdown total costs are discussed. To portray the spread of the answers, five experts were selected, and their results are presented in detail. These experts were selected according to their 2030 cost best estimate. The smallest, second smallest, median, penultimate, and largest best estimates were chosen. The second smallest and penultimate expert responses were included to prevent affording too much importance to possible outliers. The trajectories of these experts represent the span of responses and are discussed in detail using insights from the respective experts.
We next asked experts their views on the potential scalability of both technologies. The scalability answers were also characterized along three dimensions: (1) the policy framework; STEPs or NZE scenario (2) variable type: minimum, maximum, or best estimate and (3) year: 2030, 2040 or 2050. The International Energy Agency’s Stated Policies (STEPS) and Net Zero Emissions by 2050 (NZE) scenarios were used as the basis for two key stylized scenarios to explore how different policies could influence the deployment of these DACCS and BECCS. The STEPS is a scenario where only existing or proposed policies are in place, while the NZE describes a scenario whereby the global energy sector reaches net-zero emissions by 2050. For this part of the elicitation, we describe stylized versions of these two scenarios and experts were asked what role DACCS and BECCS could play in those scenarios. They were also free to assume the deployment of technologies other than those specified in the previous stage of the elicitation. Appendix D provides a description of these scenarios.
As for the costs, the uncertainty of the scalability results was analyzed through the evolution of the min-max ranges throughout the years and within the experts. For this, we discussed the trajectories of all potential scale results under the two policy scenarios in 2030, 2040 and 2050. Five representative expert answers were selected to gain a better understanding of the span of these results. Since scalability depends on the policy scenarios, two sets of experts were chosen for each technology. The first batch of experts was selected based on the potential scale best estimate under STEPS in 2030. The second batch of experts was chosen based on the potential scale best estimate under NZE in 2030. For both sets of experts, the smallest, second smallest, median, penultimate, and largest potential scales were selected, and the best estimate and min-max trajectories analyzed. Both under STEPS and NZE, up to three experts had the same scalability as the median result of BECCS scalability in 2030. Due to the already low number of respondents, showing all these experts in the trajectories analysis would have been counterproductive. For this reason, the median result of the last expert interviewed was selected. Uncertainty is additionally analyzed using the average widths of the min-max ranges. As explained above, a narrow width indicates that experts agree on the min-max range and are more confident in their predictions in a certain year. The percentage changes are also indicated to capture the increase or decrease in uncertainty over a 10-year period. Finally, we compared the potential scale best estimates of the technologies under both policy scenarios to understand the effect of policies on future scalability.
Qualitative insights gathered during the interviews are used to discuss the results. During our interviews with the experts, qualitative insights, including expert views and comments, were recorded and transcribed. Important or recurring insights were then collated into a separate document and categorized according to various themes reflecting either specific questions of the protocol (like comments on assumptions, future costs and scalability) or transversal themes like barriers and factors limiting each technology. This data provided a rich context for explaining our results, and while they have been anonymized to maintain confidentiality, we have included selected quotes to substantiate and illustrate the points made within our manuscript. This further analysis serves illustrative purposes and adds nuance to our quantitative analysis of expert opinions and expectations. However, it is important to note that these insights are not intended to be exhaustive or generalizable, but rather to enrich the understanding of the specific contexts within which the results were obtained.
This section discusses the results from the expert elicitations by focusing on both the uncertainty range and the best estimates, scalability under the different policy scenarios, and, finally, limiting factors and enabling policies. This order of presentation is motivated by the elicitation methodology where uncertainty ranges were probed before the best estimates. Importantly, the numbers used in this section do not correspond to the order of the expert list and all expert answers were anonymized.
The following sections investigate the trajectory and evolution of uncertainty of DACCS and BECCS technology costs in 2030, 2040 and 2050 using the elicitations for both the total costs and the cost breakdowns.
Figure 1 shows the ranges provided by all experts in €/tCO2 for DACCS total costs trajectories over the years. Of the 21 DACCS experts, 18 provided an estimate of total costs, with 13 also giving a cost breakdown.
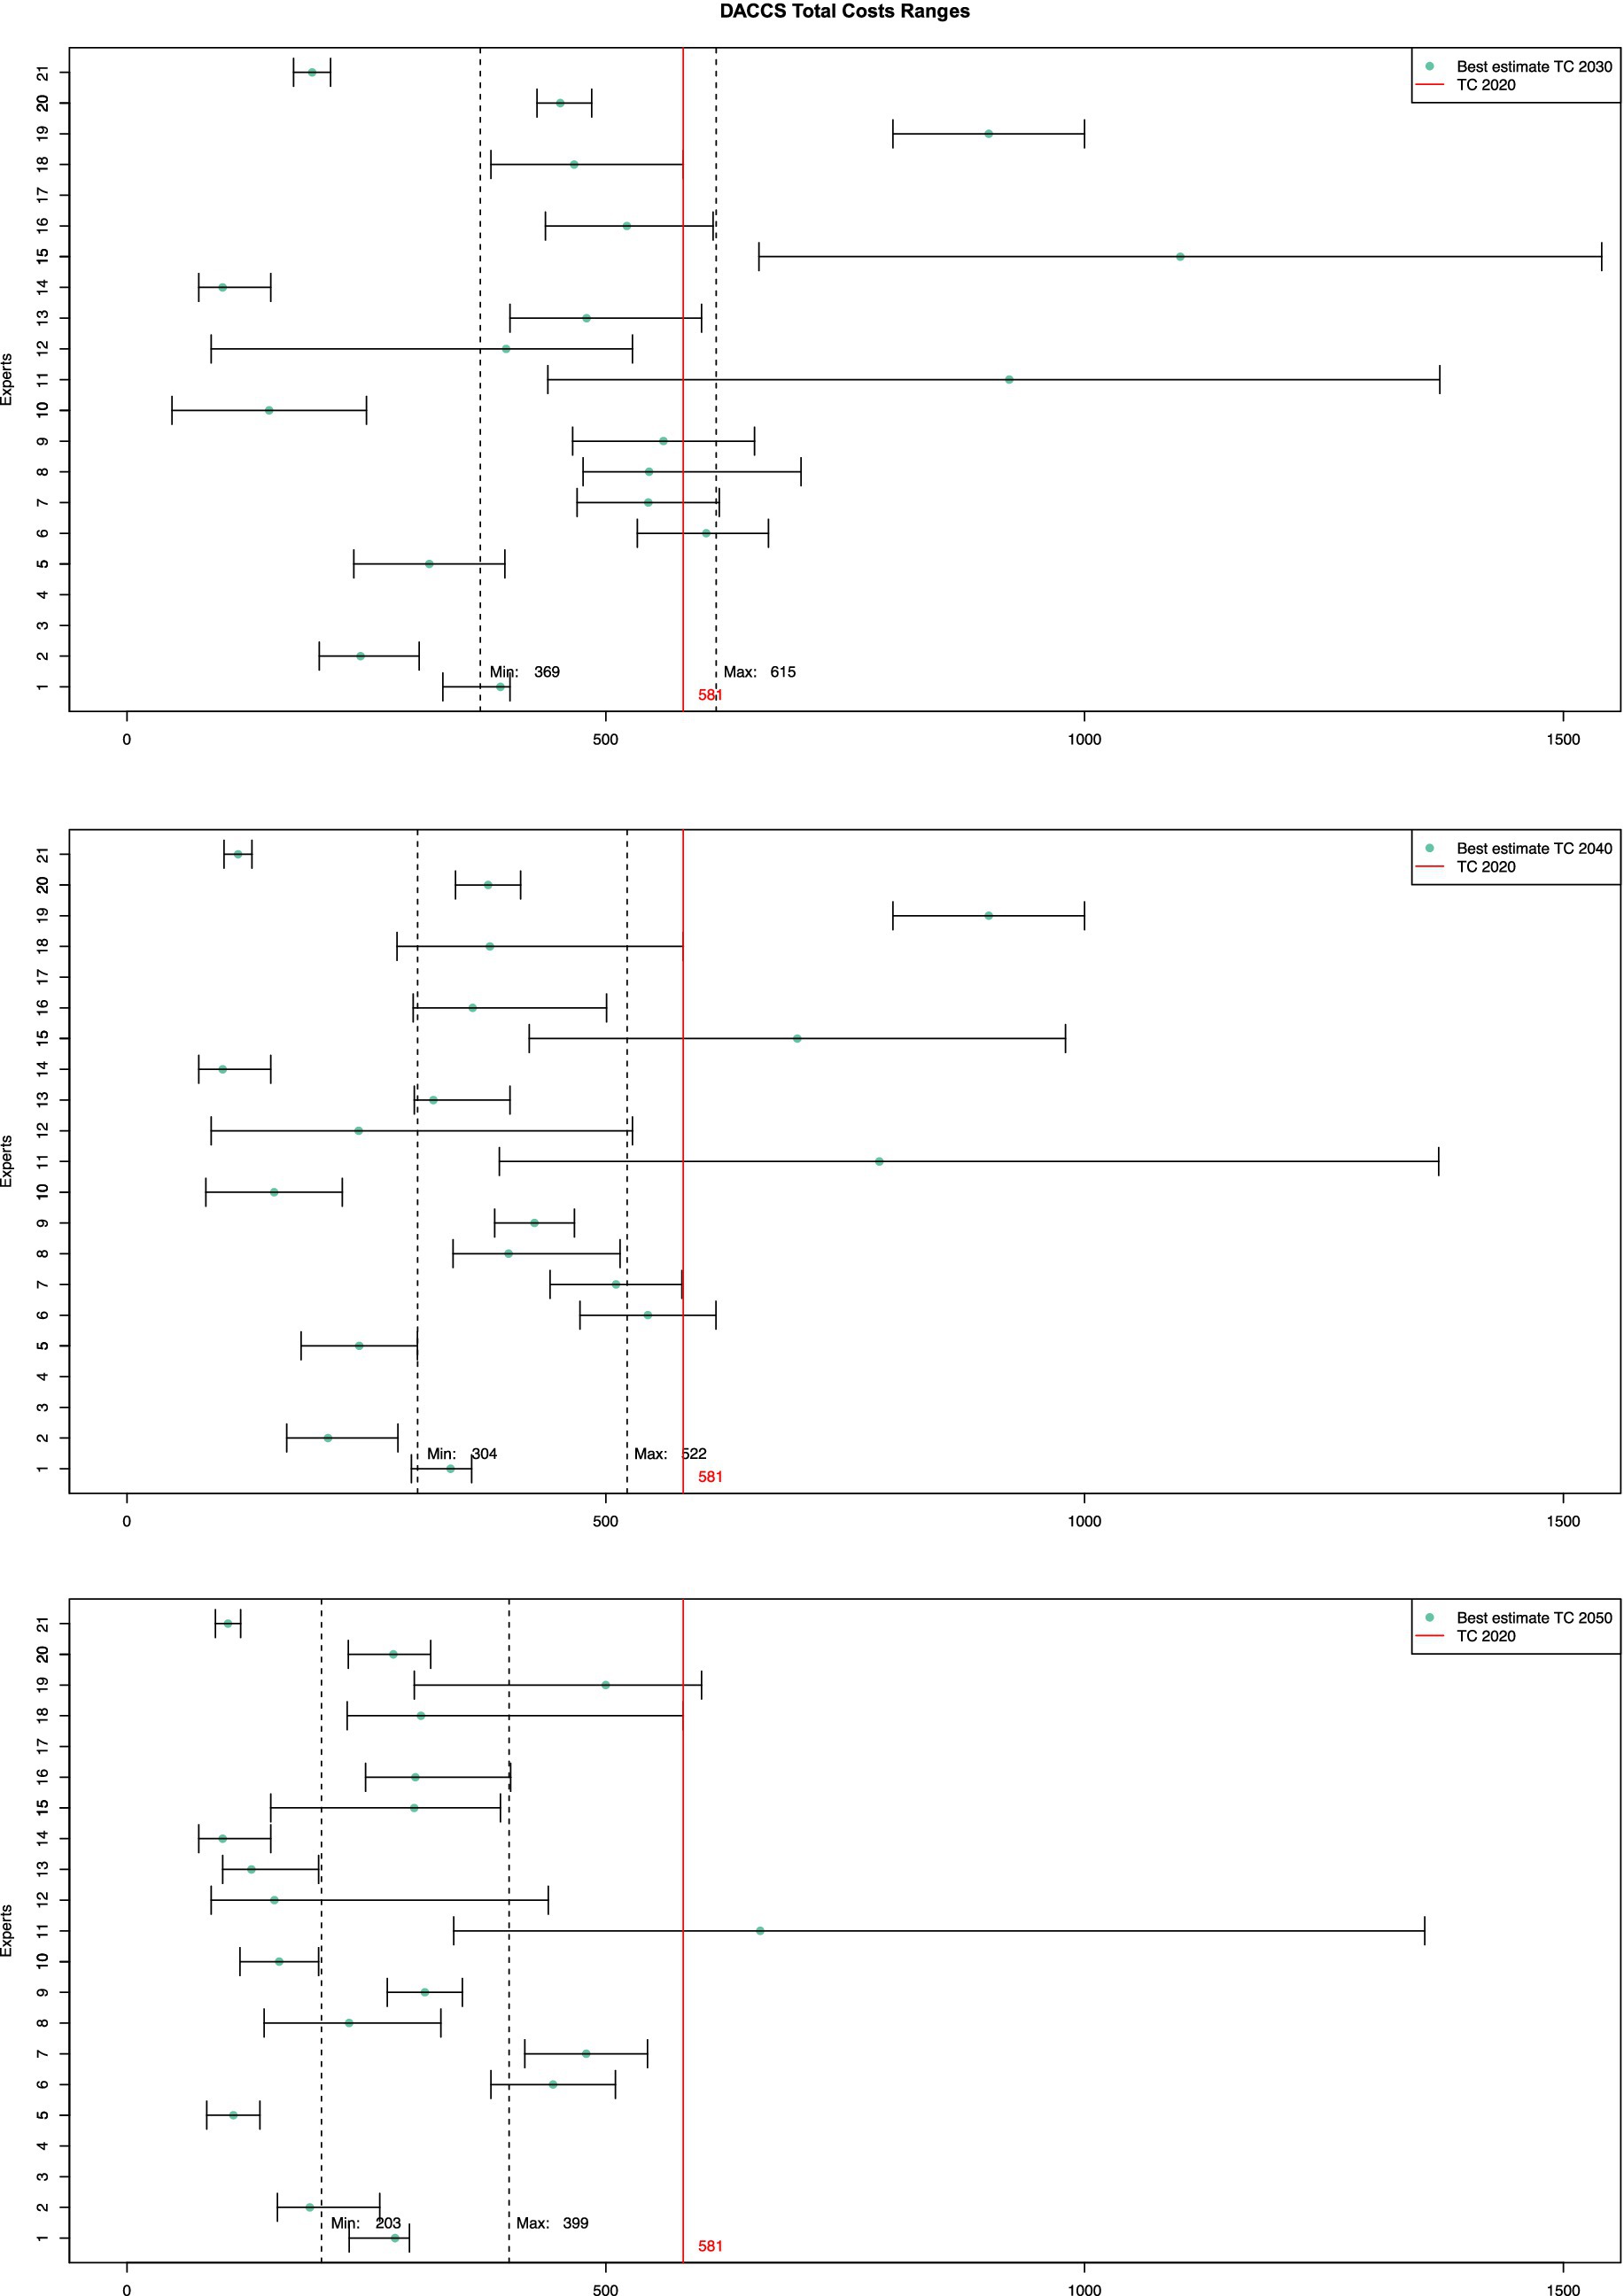
Figure 1. DACCS total costs ranges. DACCS total costs estimates with minimum, maximum, and best estimate of each expert in €/tCO2. Figures are given for 2030, 2040 and 2050. Best estimates are the blue dots, and the 2020 total cost is shown by the red line. Dashed lines show the average min and max ranges.
There is a clear disparity across experts with some providing very narrow ranges and others spanning over two orders of magnitude. Starting in 2030, there is a tendency for experts that gravitate towards higher costs to also provide wider min-max ranges while those gravitating towards lower costs provided narrower ranges. This can indicate that the higher the cost, the larger the uncertainty of the experts or that experts which are confident in their belief of attaining low costs provided narrower intervals.
Experts 10, 12, 13, 14 and 15 did not provide a detailed breakdown of the costs. In most cases, reluctance to give cost breakdowns stemmed from experts’ (self-perceived) lack of expertise and/or knowledge about the technology’s different cost items. One expert did not offer cost breakdowns, for example, because of their ‘lack of technical expertise around the component cost items [of DACCS]’ (DACCS Expert 15). Similarly, another expert opted not to give cost breakdowns because of the high uncertainty surrounding ‘too many moving parts’ (DACCS Expert 13).
On comparing the total costs and total costs obtained from the cost item breakdown (from here on called ‘breakdown cost’), it is apparent that experts that gave a breakdown of the costs tended to provide cost ranges that span higher than the five experts which only provided total costs. One possible explanation for this is that by separating the costs in different items, a buffer for uncertainty is added to each item which leads to higher overall costs.
No expert employs the 2020 reference costs (provided to respondents in the two-pager) for their 2030 costs, although some said that they used it as a starting point and then assumed some learning and gains from upscaling over the intervening seven years (specifically, Experts 6, 10, 11, 15, 16, 10 and 18). A minority of experts said that the 2020 reference costs were too low and instead based their assessments on different (higher) starting costs that they regarded as more accurate reflections of world average costs (Experts 8 and 13). Strikingly, some experts do not even include that starting point within their min-max ranges for 2030. Nevertheless, when asked if they agreed with the 2020 starting costs, most DACCS experts answered affirmatively. Half of the experts’ ranges lie outside of the reference provided, which further indicates that our experts answered the questions according to their own knowledge without being strongly anchored by the reference costs. All expert ranges decrease throughout the decades, except for expert 11. This expert provided a very wide range that does not change throughout the years, skewing the average min-max range over the years. This expert expected that different cost components would follow contradictory trajectories which would result in consistently wide ranges: for example, ‘changing sorbent chemistry might reduce OPEX, it would also increase CAPEX’ (DACCS Expert 11). In the interviews, experts consistently commented that extrapolating future energy costs was difficult. Reasons given include the volatility of the energy market driven in part by the Russian invasion of Ukraine (DACCS Expert 11), increasing energy prices throughout Europe (DACCS Expert 11, 13 and 18), and the uncertainty surrounding the rate of adoption of renewable energy and the timing of fossil phase-out in the European grid (DACCS Experts 10, 11, 18, 20 and 21), uncertainty over the investment in DACCS (DACCS Experts 12 and 21) and ‘how quickly the voluntary market will saturate in Europe’ (DACCS Expert 21). A number of experts mentioned the uncertainty regarding the ambition and stringency of European energy policy as a justification for the wide ranges (DACCS Experts 1, 10, 11, 12, 15 and 16). Although not stated explicitly by our experts, hopes for energy prices to settle back to pre-war levels could explain the decrease of the energy cost min-max ranges over time.
Due to the limited pool of experts interviewed and dispersed nature of the estimates, the data cannot undergo traditional inferential statistical analysis. As shown in Table 4, the smallest, second smallest, median, penultimate, and largest, best estimates were selected from the pool of 2030 cost best estimates to represent the obtained data and span the space without giving too much weight to single outliers. Figure 2 and Table 5 show the trajectories of the min-max ranges of these selected experts over the years. Experts 11* and 18* are indicated with an asterisk as they provided a cost breakdown.
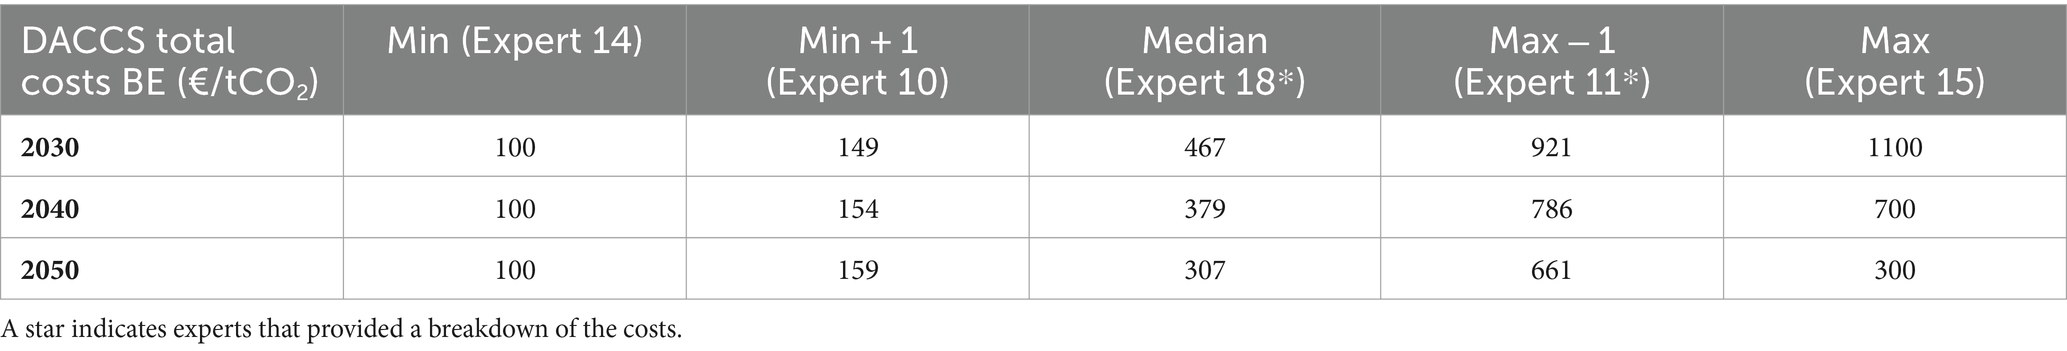
Table 4. DACCS total cost best estimates of selected experts for 2030, 2040 and 2050.

Figure 2. DACCS total cost ranges in 2030, 2040 and 2050. DACCS total cost range and best estimate evolution of five selected experts in 2030, 2040 and 2050.
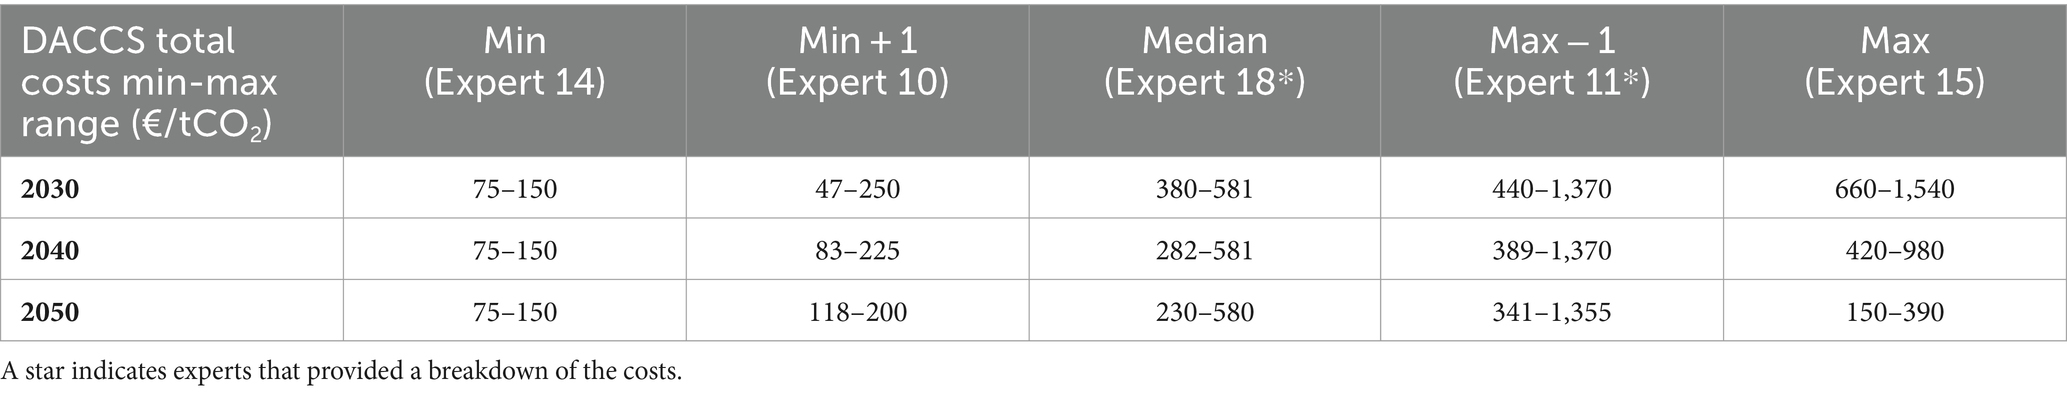
Table 5. DACCS costs min-max range of selected experts for 2030, 2040 and 2050.
Of the five selected experts, experts 11*, 15 and 18* believe in a general reduction of costs. Expert 18* uses the 2020 starting costs as a maximum point for 2030 and 2040 costs. Expert 15 starts with the highest costs and ends in a similar range as the median cost in 2050. This could point again to the behavior that experts that start with large costs tend to decrease these more over time than experts that start with smaller costs. Finally, despite a decrease in costs over time, Expert 11* provides high costs and has a 2050 best estimate that is higher than the 2020 starting costs.
Expert 14 has a constant min-max range and best estimate over the three decades. This expert’s reasoning is that by 2030, DACCS will rely ‘only [on] processes which are already in industrial use. There may be some economies of scale, [but DACCS] will not be cheaper’. Finally, DACCS Expert 10 shows a min-max range and best estimates which shift right. As previously highlighted, increasing costs in the first years of deployment of a technology is not uncommon. Here, the increase in minimum costs is due to the belief that, while it is ‘very likely that innovation… [in capture methods reduces] capex and opex, … you might need to pay a lot more for transport and storage’ (DACCS Expert 10). However, the min-max range, or the uncertainty range of this expert narrows over the years. This again could indicate that experts which believe that low costs can be attained in 2030 are confident in this prediction and provide narrower intervals.
To conclude, many experts assumed that the introduction of more renewables into the energy grid would reduce energy costs, and that novel and more efficient sorbents will reduce capex and opex costs by 2050. Additionally, experts also mentioned that minimum costs can be capped by technological or thermodynamical feasibility. For example, when making minimum cost predictions, DACCS Expert 19 reasoned that ‘we have, historically, not been able to get much improvements in… solvents and sorbents developed for DACCS and industrial applications.’ Similarly, another expert felt that DACCS cost reductions will eventually be limited as ‘old industry [used for DACCS compression] is already optimised’ (DACCS Expert 18). Another expert perceived a fundamental design problem: ‘DACCS [will be] locked in a certain technological design space due to sorbent’ (DACCS Expert 4). These factors are expected to constrain the minimum to certain ranges below which the costs cannot feasibly go.
Looking at the uncertainty within experts, Table 6 shows the average width of the min-max ranges of the costs throughout the decades and its relative percentage changes. It is important to note that these figures are not actual costs but the average difference between the minimum and maximum. A greater width indicates less expert agreement on the costs and a positive percentage change indicates increasing uncertainty for that cost item. These figures show that, on average, the five experts who only answered the total cost question provide wider ranges than those that also answered the cost breakdown questions.
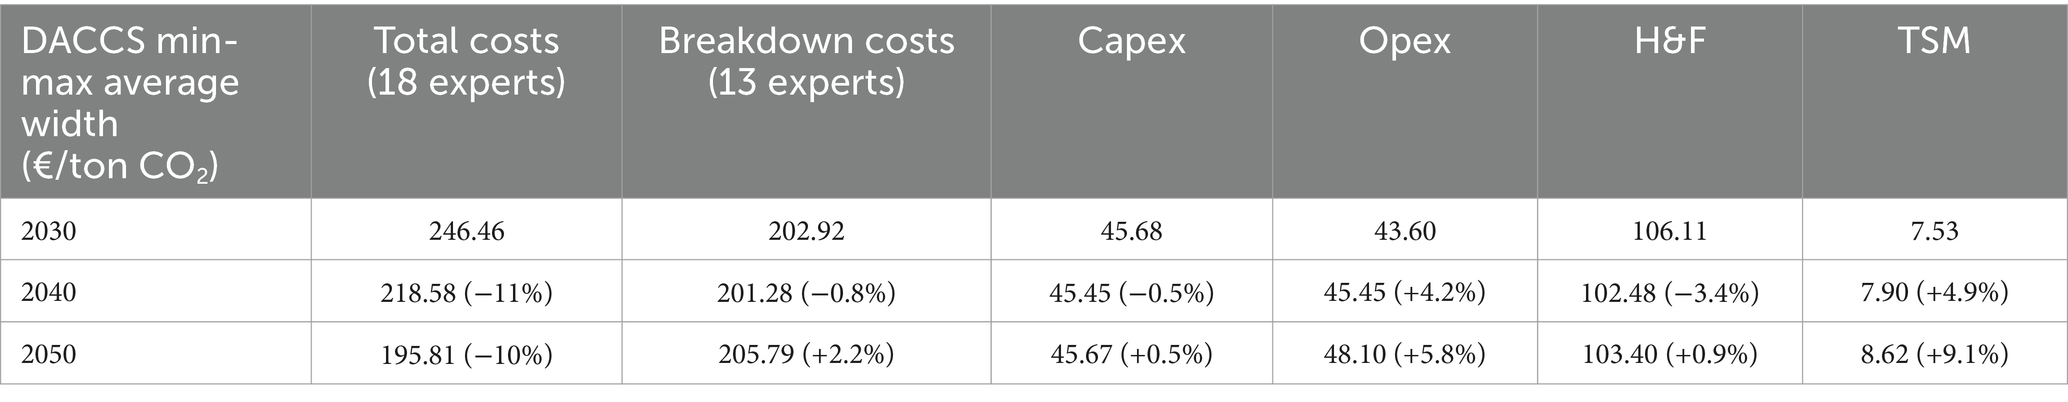
Table 6. DACCS min-max range width average across experts in €/tCO2 (the percentage change for each decade is provided in parentheses).
Looking at the evolution in uncertainty over the years, the percentage changes of the total costs decrease compared to the breakdown costs. The increase in uncertainty when experts provide a cost breakdown of the technology can be due to two factors. First, it could stem from a difference of opinion: the five experts that did not provide a cost breakdown could be cost optimists and be certain of a strong reduction in costs. Second, providing a breakdown of the costs could lead to an overhead or a “safety-range” that is added to all cost items, leading to an average increase of the range width over the years. To conclude, these results could suggest that experts that provide a cost breakdown agree more on their answers and know that they cannot predict the far future as well as the near future.
To summarize, the trajectories and uncertainty in DACCS costs point to the following results. First, higher costs in 2030 seem to lead to an increase in expert uncertainty while experts with lower starting costs seem to be more confident. Second, experts which provide a cost breakdown seem to agree more on the min-max interval (smaller ranges) and are less certain of future costs (increasing percentage change).
For BECCS, 13 experts were interviewed in total, 9 experts provided total costs and 6 of those were able to also break the costs down into different items. Figure 3 shows the trajectory of expert total costs, min-max ranges and best estimates in 2030, 2040 and 2050. Expert 1 did not answer the cost questions and is not included in the graphs. Expert 4 expected efficiency levels and (high) TSM costs to remain fairly constant over time and has a min-max range that is the same as the best estimate in 2030 and 2040.
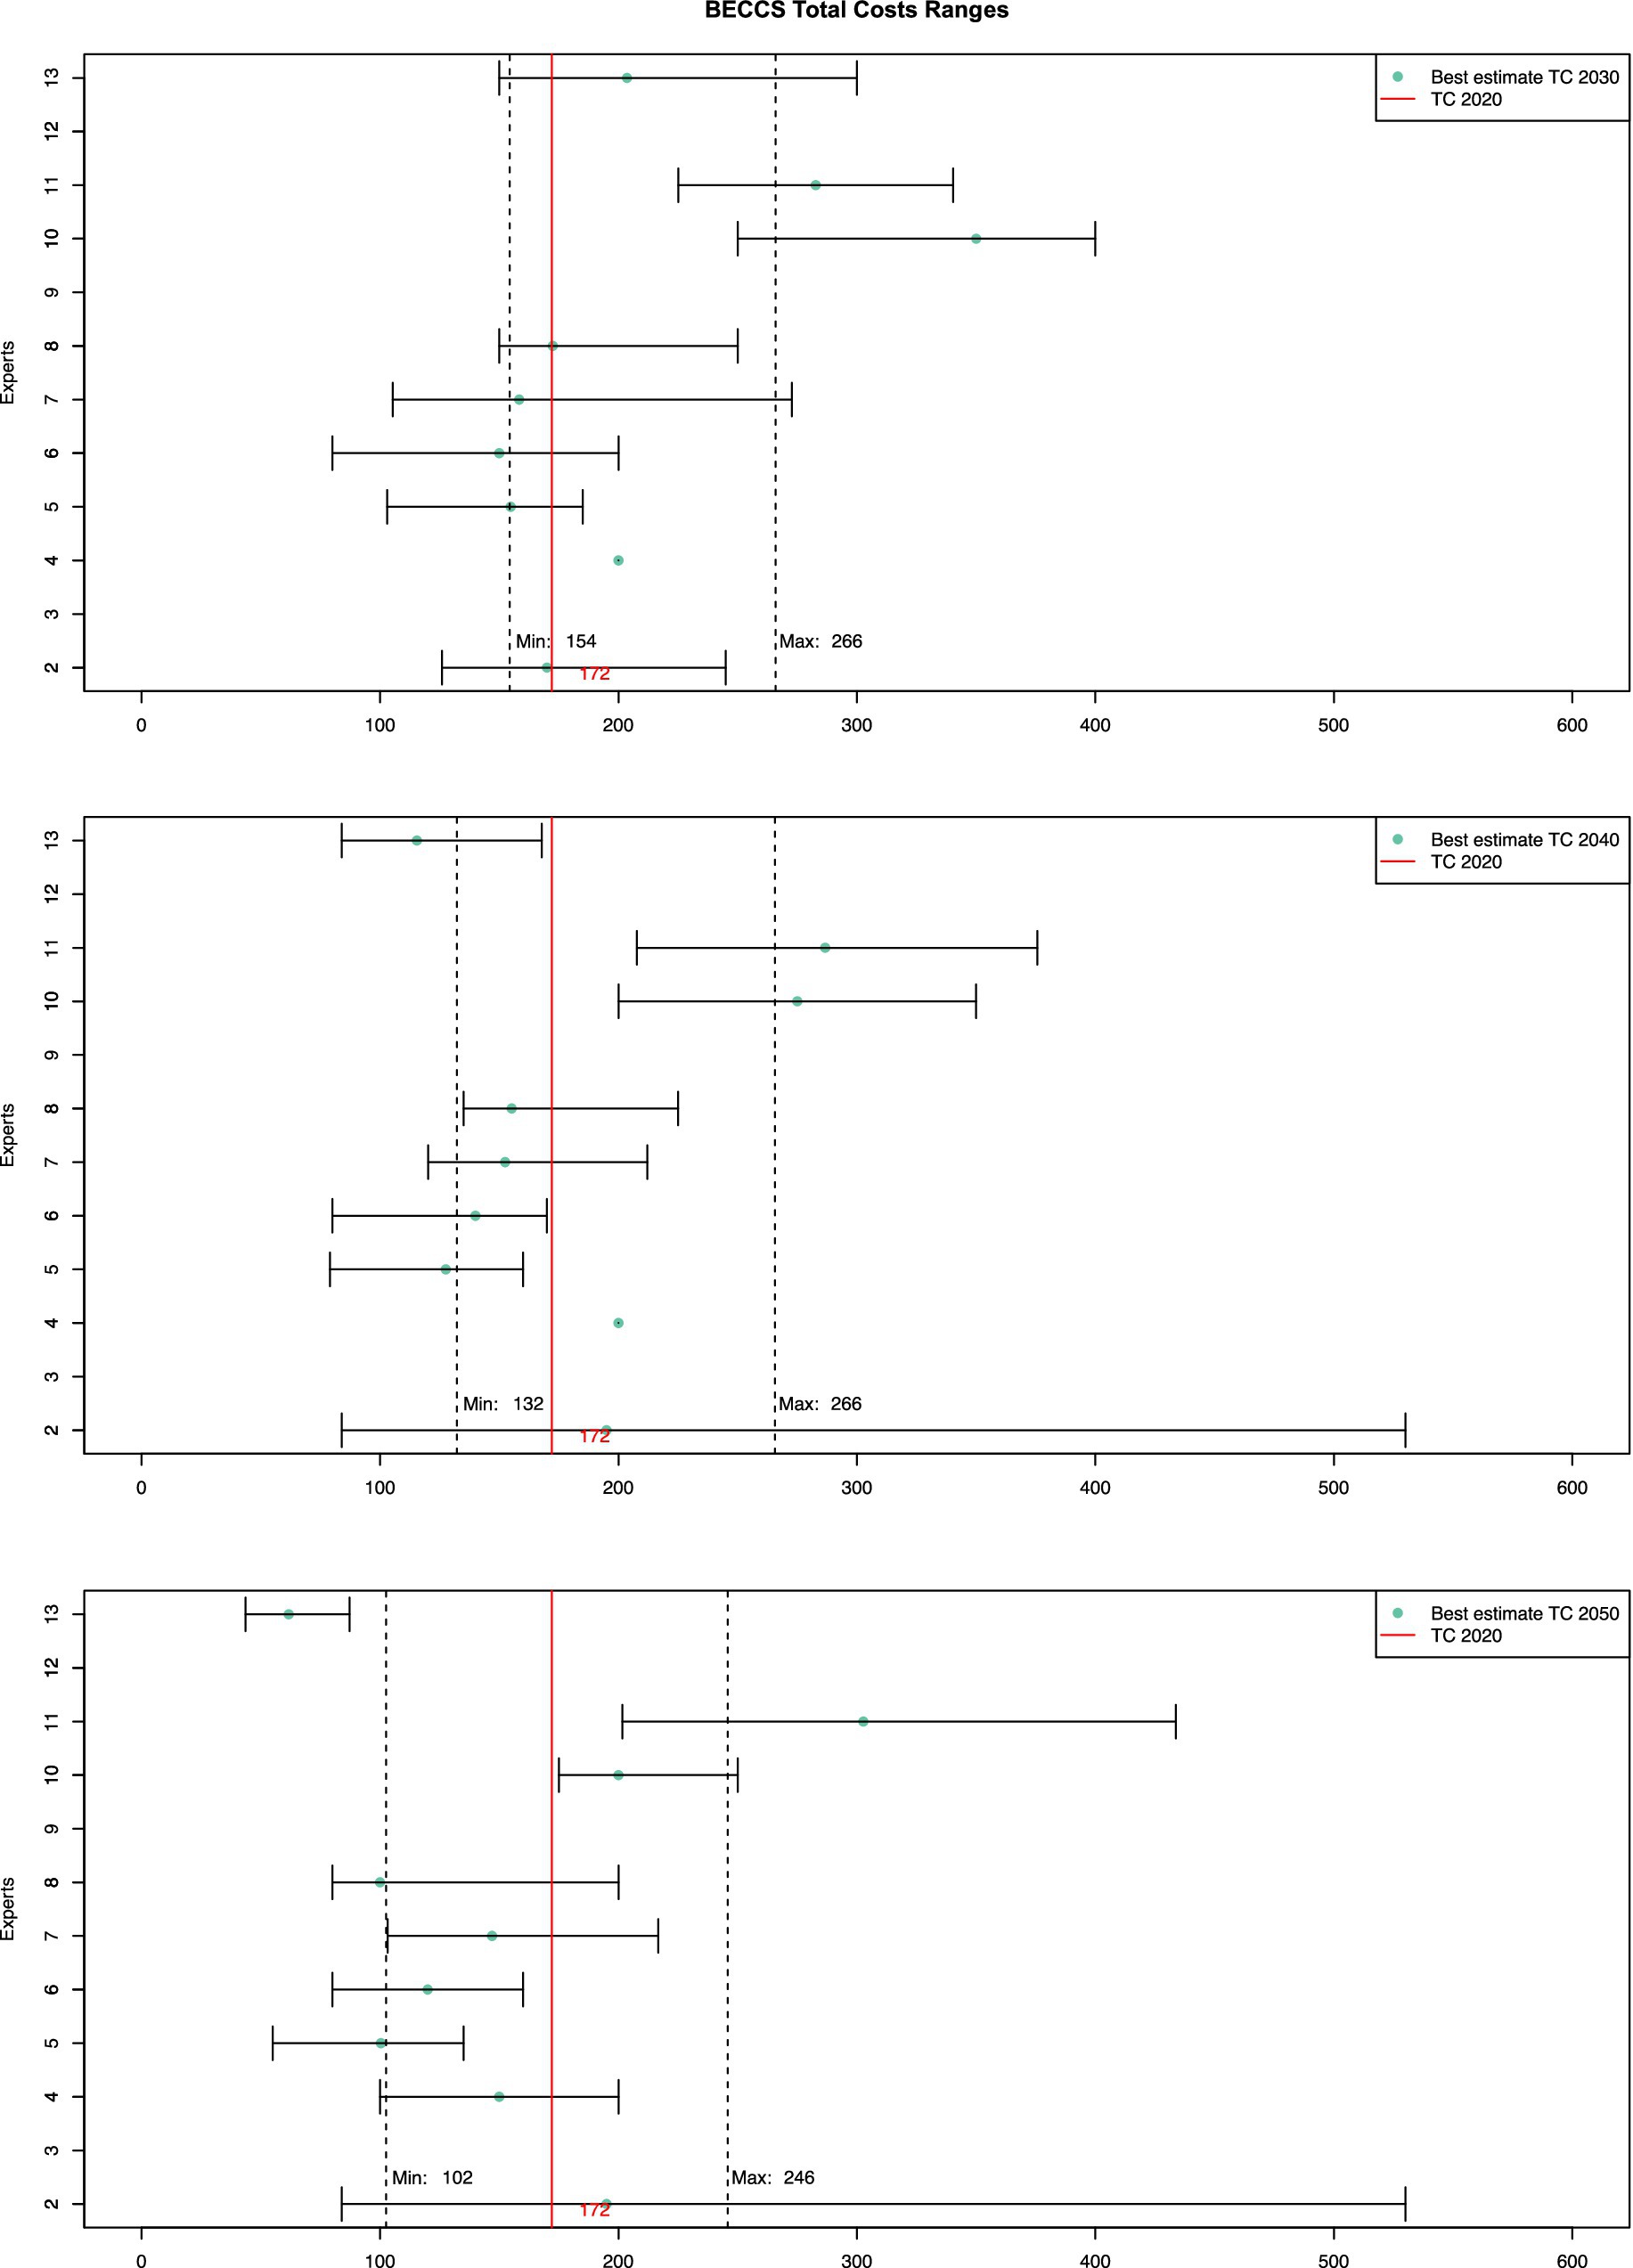
Figure 3. BECCS total costs ranges. BECCS total costs estimates with minimum, maximum, and best estimate of each expert in €/tCO2. Figures are given for 2030, 2040 and 2050. Best estimates are the blue dots, and the 2020 total cost is shown by the red line. Dashed lines show the average min and max ranges. Note that our Expert 1 was only able to provide scalability estimates and not costs so we do not include Expert 1 in these figures.
Particularly when compared with DACCS, there is widespread agreement over the min-max ranges of the total costs as seen by the overlapping intervals (Figure 3). Unlike DACCS, we cannot state that the higher the costs, the larger the min-max interval due to the small sample size.
Expert 2 shows an interesting behavior. For this response, the min-max range is relatively narrow in 2030 before widening in 2040 and 2050. This expectation appears to be based on the belief that deployment costs ‘depend on where you put the BECCS… [project developers] would go to the optimal [sites] ones first… [then] smaller unit [deployments will be] situated in more remote places which are more expensive’ as they are located further from CO2 transport and storage infrastructure and feedstock supply chains.
For BECCS, some experts appear to disagree with the starting costs. Experts 4, 10, 11 and 13 have 2030 costs that sit above the reference value which was considered too low. Expert 13, for instance, commented that ‘the more recent MONET results… [in] lots of model changes [and] less conservative numbers’ and asserted that the existence of ‘so many different BECCS systems… [gives rise to] lots of different cost profiles’. Importantly, while for DACCS all of the experts responded based on the assumptions provided, in the case of BECCS, extensive conversations were had with experts on the system assumptions and costs. The complexity of BECCS lies not in the technology itself but in the case-by-case deployment thereof. Each expert has a specific feedstock, supply chain, plant location, furnace type and energy production that they are accustomed with. Imposing a reference plant configuration on experts was in many cases prohibitive. For this reason, not only were the feedstock assumptions dropped, but as most experts were based in Europe, they were also told to answer the questions with either the Drax or Stockholm Exergi plant in mind. That way, experts could choose the plant configuration that they were the most familiar with to answer the questions. Due to this disparity, the obtained cost ranges could contain varying underlying system assumptions that lead to some unavoidable differences that can undermine comparability.
As with DACCS, five BECCS experts were selected based on their best estimate and their trajectories were analyzed in detail. For BECCS, experts 6, 7*, 8, 11* and 10 were selected as the smallest, second smallest, median, second largest, and largest best estimates, respectively. An asterisk indicates that experts 7* and 11* also provided a breakdown of the costs. Table 7 shows the best estimates and Figure 4 and Table 8 show the evolution of the ranges over time. Interestingly, all best estimates decrease over time, except for expert 11*. The reasoning behind this is that capex and opex do not decrease and feedstock costs increase over the years due to higher competition for waste material.
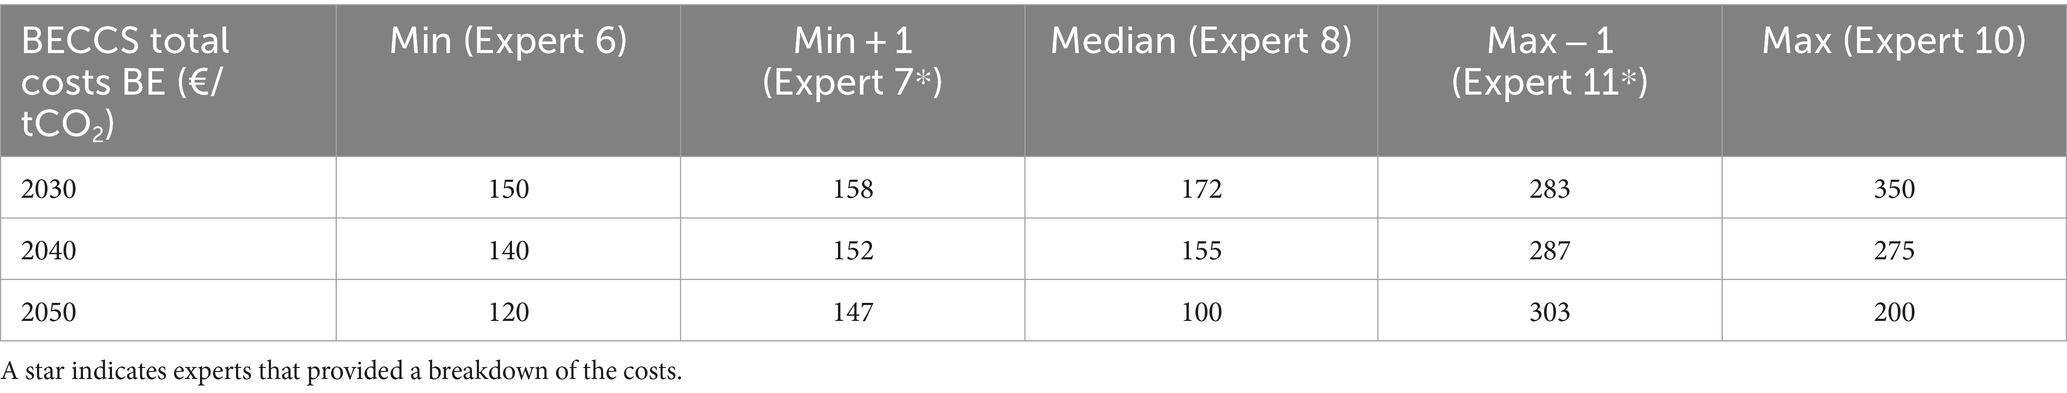
Table 7. BECCS total cost best estimates of selected experts for 2030, 2040 and 2050.
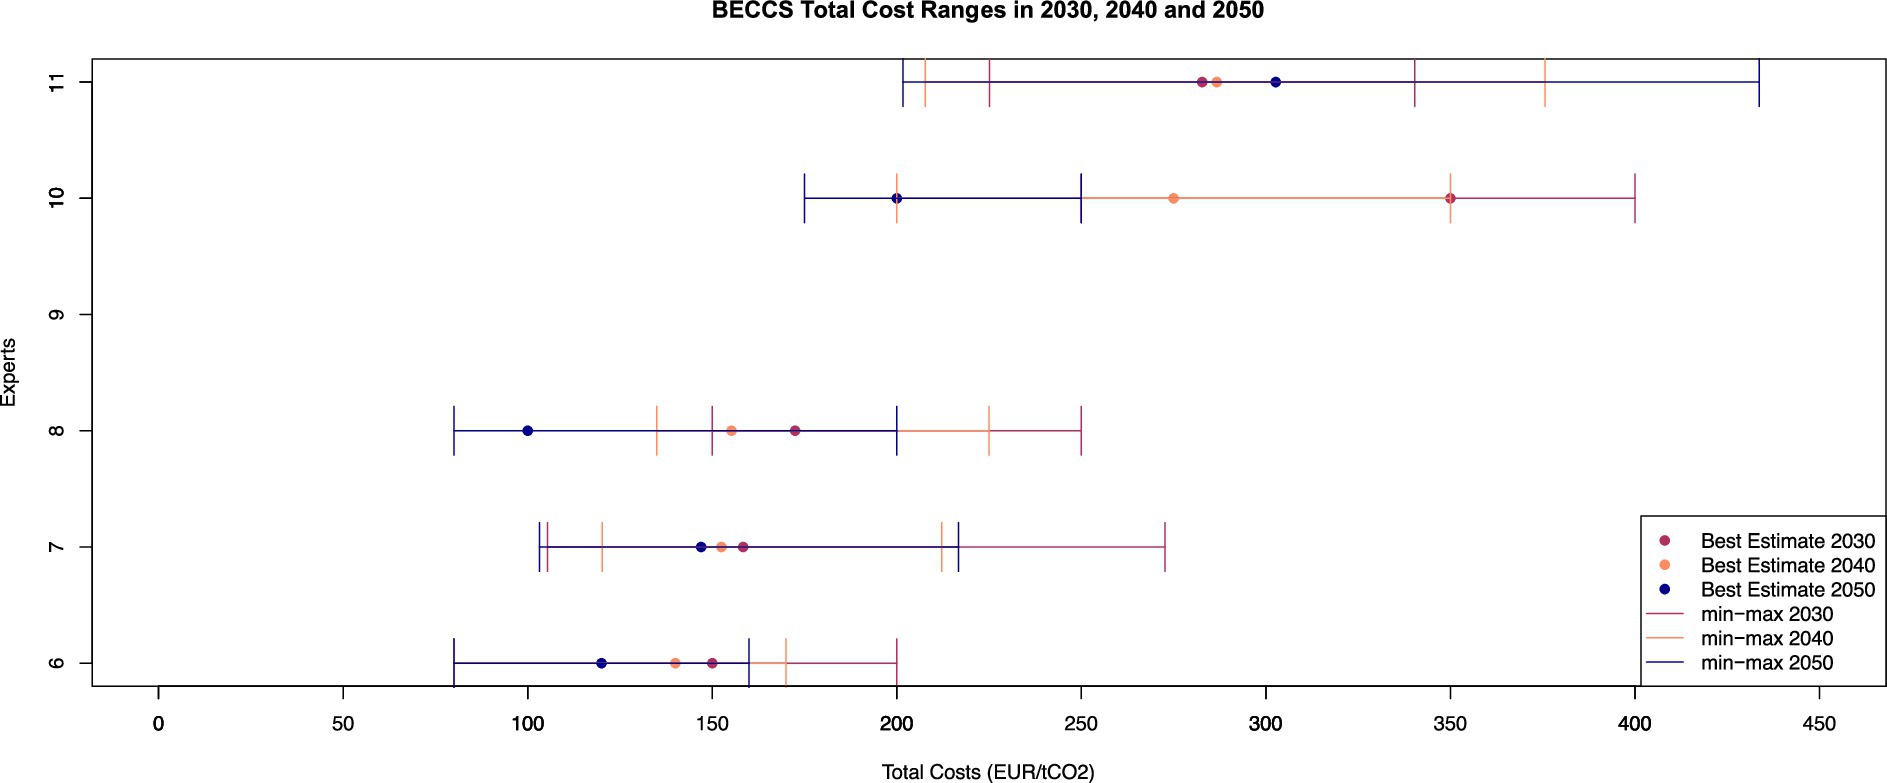
Figure 4. BECCS total cost ranges in 2030, 2040 and 2050. BECCS total cost range and best estimate evolution of five selected experts in 2030, 2040 and 2050.
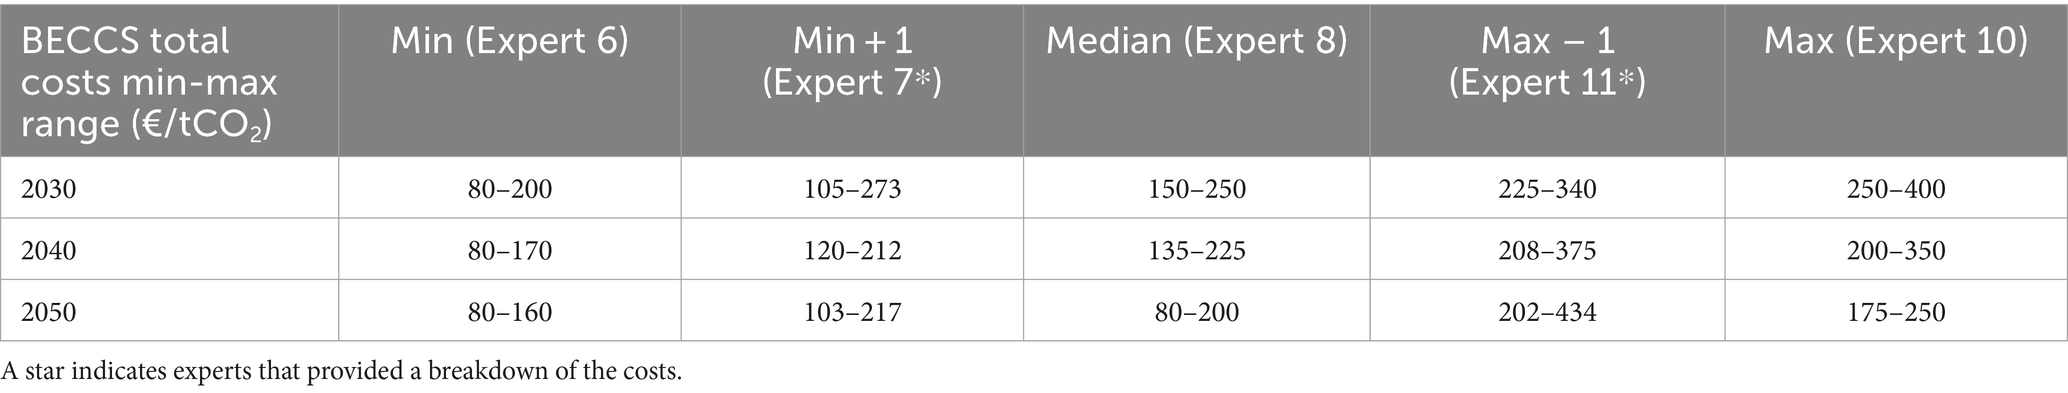
Table 8. BECCS costs min-max ranges of selected experts for 2030, 2040 and 2050.
For four of the five experts, the cost ranges shift towards lower costs over the years. Expert 6 believes that the minimum achievable costs stay constant over time. According to this expert, ‘You start by integrating CCS into existing CHP plants… use the feedstock from today: woodchips from the pulp industry’, which are only integrated by the energy sector later. Furthermore, ‘the way to get started would be to make it in smaller scale at the beginning, then you will have high costs… [then see] costs go down with larger plants.’ (BECCS Expert 6) Expert 7* first sees an increase in the minimum costs and later a decrease. The initial increase in minimum costs is due to an increase of capex between 2030 and 2040. As mentioned previously, an increase in costs is not unlikely for a new technology. The increase in maximum costs between 2040 and 2050 is caused by a reduction in energy revenues that is higher than the combined decrease of capex and TSM costs for the same period. Despite the forecasted increase in feedstock costs, which are linked to both forestry and adapted crop requirements, Expert 8 predicts a constant decrease in BECCS costs over the decades and expects that increasing deployments will give ‘time to iron out [problems], reduce costs and benefit from learnings’. By contrast, Expert 10 does not believe there will be much deployment between now and 2030 because of the time and scale needed to setup new deployments: ‘it takes seven years to build a 500 MW plant’. According to this expert, ‘co-generation with heat and power… [yields] different qualities of energy… [but] the average fleet of BECCS plants will not change much’. Therefore, this expert expects most of the cost reductions will to in the capex and to a lesser extent in the feedstock costs. Additionally, it is interesting that both experts 6 and 10, which have the smallest and largest ranges, show increasing confidence over time. This behavior is at odds with the common assumption that future values are more uncertain.
Finally, Expert 11* shows a min-max range that shifts towards higher costs, and which becomes wider over the years. As mentioned before, this increase in costs is largely due to increasing feedstock costs which, despite increasing energy revenues and decreasing TSM costs, leads to an overall increase of costs. Because these dynamics happen simultaneously, this expert asserted that the widening ‘minimum and maximum ranges show the variety of costs you can have’.
Table 9 portrays the uncertainty evolution of BECCS costs by showing the average min-max ranges for the total costs and the cost breakdown items. Again, a wider span indicates less expert agreement on the costs and a positive percentage change indicates increasing uncertainty for that cost item.
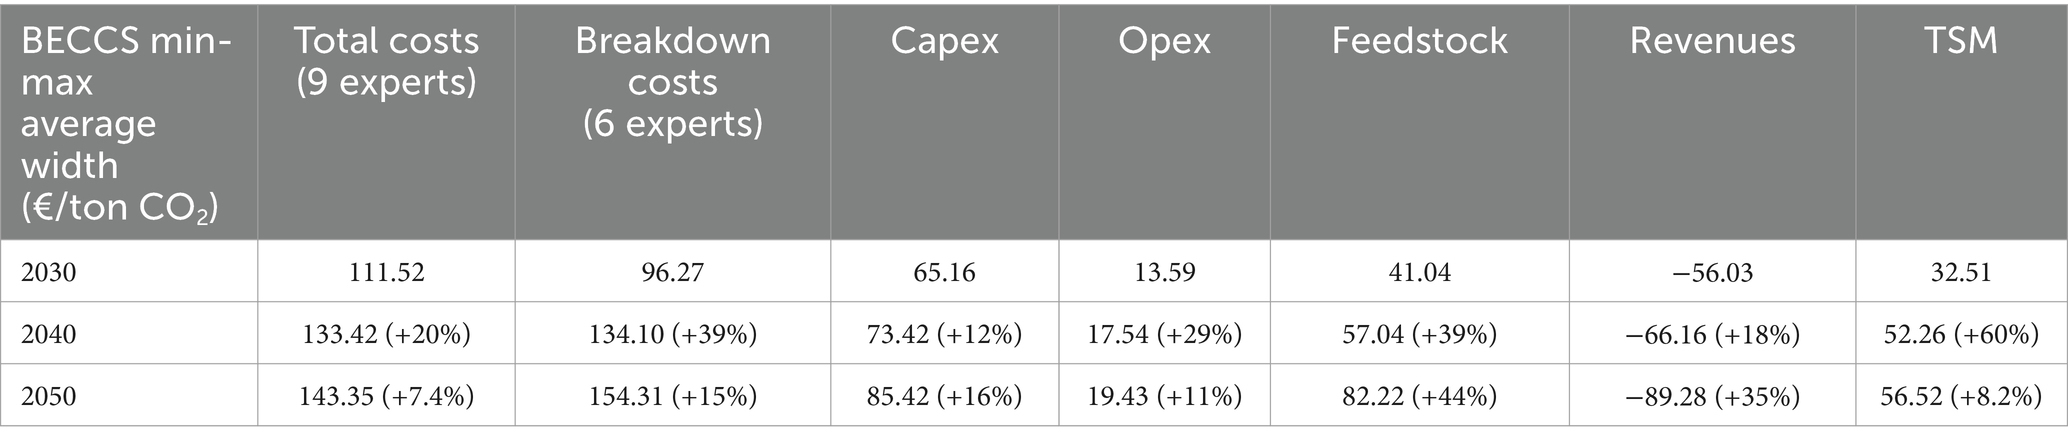
Table 9. BECCS min-max range width average across experts in €/tCO2 (the percentage change for each decade is provided in parenthesis).
For BECCS, the total cost intervals are on average larger than the ones from those who offered the breakdown costs. This again shows a higher agreement for experts providing a costs breakdown. The increasing ranges for the total cost of breakdown show that on average experts become less confident of their answers over the decades. This increasing uncertainty reflects what one expects in general from technology estimates but in the case of BECCS could also reflect the case-by-case deployment of the technology, and hence the high intrinsic uncertainty.
There is not only a clear increase in uncertainty for TSM costs but also a significant difference between these costs for DACCS and BECCS respondents. These differences may reflect the fact that DACCS plants are newbuilds which can be located right next to a storage site, reducing the transport distance and total infrastructure investment needed whereas BECCS plants are less modular and must be fully integrated within the existing energy system. For instance, while ‘optimizing of location will be much more important [for driving down DACCS costs] (DACCS Expert 9) and ‘DACCS can be utilizing flexibility [of location]’ (DACCS Expert 5), experts expected that ‘smaller [BECCS] units which are situated in more remote places will be more expensive’ (BECCS Expert 2). This could lead to longer transport routes to the storage sites and higher costs. Most experts stated that this supporting infrastructure is crucial, and its development will greatly depend on the government and consortium’s willingness to invest. Experts also believe that a large part of this investment will happen between 2030 and 2040. Any differences between BECCS and DACCS TSM costs may also reflect the composition of the experts recruited for each technology and the small sample size for BECCS.
To summarize, BECCS experts tend to be less confident in costs than for DACCS. They believe that future costs depend on many different parameters and that overall, the uncertainty of BECCS costs should grow in the future. Finally, the cost breakdown leads to more optimistic cost ranges than the total costs. In some extreme minimum cases, experts place the cost of BECCS below €100/tCO2.
The previous section discussed the uncertainty surrounding DACCS and BECCS costs. Notable findings are that for DACCS, high costs are associated with higher uncertainty and rate of change over time. For BECCS, experts that offered a cost breakdown provided more optimistic ranges than those who only offered total cost estimates. Collectively, our results pertaining to both technologies suggest that experts that provide a cost breakdown tend to suggest narrower ranges.
Finally, the total costs for DACCS might indicate a degree of overconfidence bias as ranges become narrower over time whereas this effect disappears in the cost breakdown. In contrast, there appears to be no clear overconfidence bias for BECCS. This can be explained by the difference in complexity of the two technologies as DACCS technology is still undergoing significant development and various novel processes are under consideration or could emerge over time. It might be difficult to reflect the full complexity of the technology in a single total cost metric because the technology could take on a very different form in the next decade.
The following section presents the best estimates for DACCS and BECCS total costs in 2030, 2040 and 2050. Figure 5 shows the best estimates of all experts for DACCS and BECCS in 2030, 2040 and 2050. It is apparent that DACCS cost estimates, which span over two orders of magnitude, vary much more widely between experts compared to BECCS estimates, which fall within the same order of magnitude.
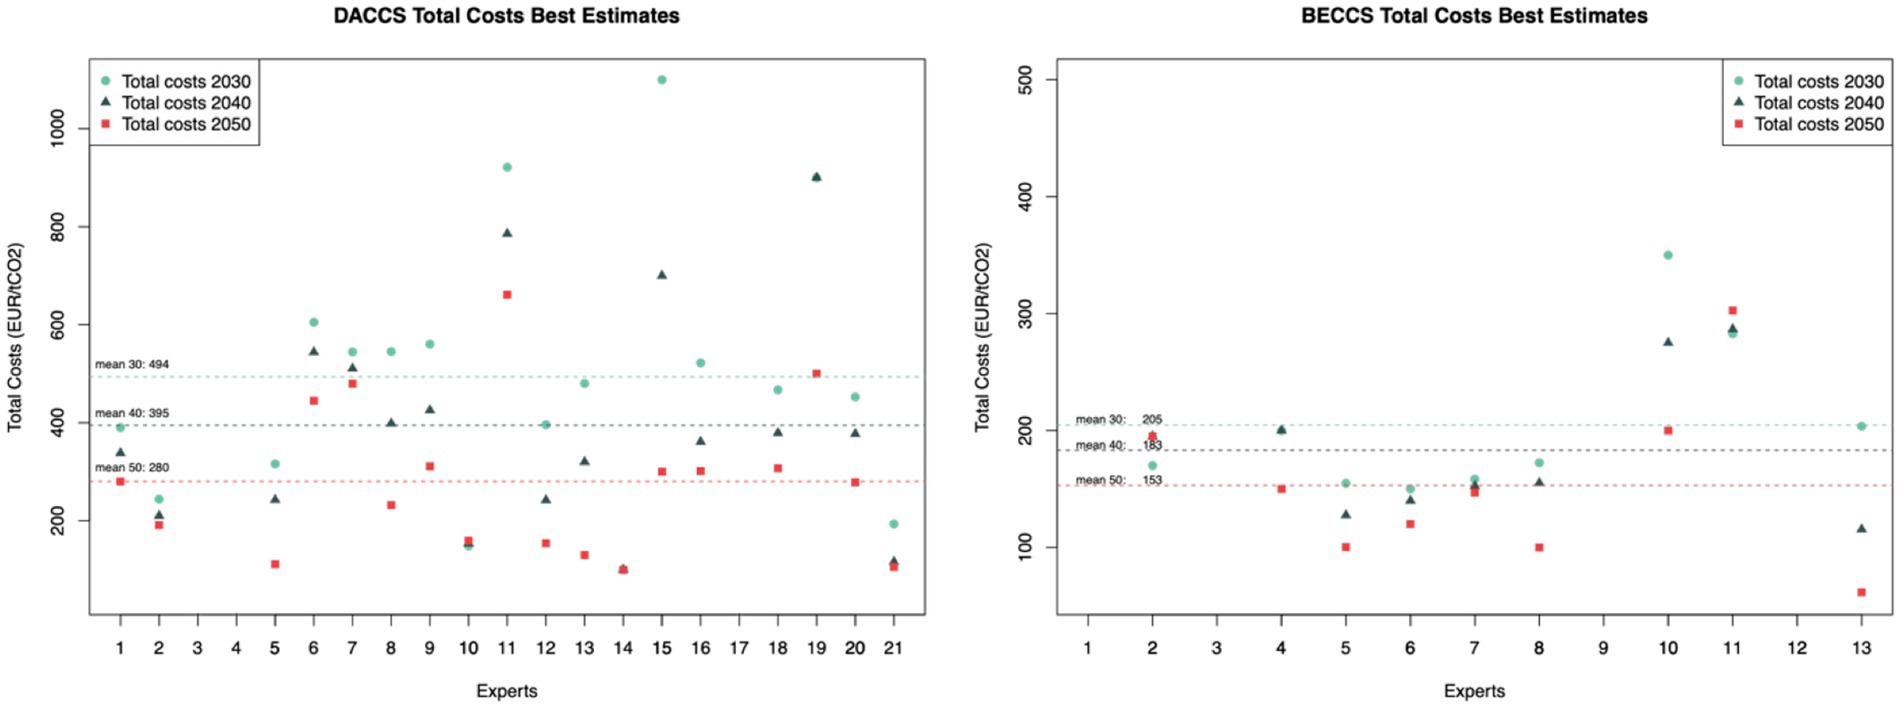
Figure 5. DACCS and BECCS total costs estimates. DACCS and BECCS total cost estimates by experts in 2030, 2040 and 2050.
DACCS expert 10 is the only expert for either technology that expects costs to (slightly) increase. As mentioned before, this expert’s reasoning is that the technology cannot achieve any lower minimum costs because although ‘it is very likely that innovation in DACCs… [reduces] capex and opex costs… optimal sites [become scarce with upscaling]. For BECCS, the results for experts 2 and 11 show interesting behaviors. They both believe that the costs will increase between 2030 and 2040 and stay constant or, respectively, increase by 2050. The reason for this is the existing gap between early cost-effective projects and later more expensive projects as BECCS projects developers ‘would go to the optimal ones first’ (BECCS Expert 2) and ‘we [need to] factor in increasing feedstock costs’ (BECCS Expert 11).
This sort of dip has been found previously in other technologies such as flue gas desulphurization (FGD) as described by Rubin et al. (2015).
Table 10 shows the average of the best estimates. The BECCS results suggest that, on average, experts expect a higher starting cost in 2030 than the 2020 reference cost and a gradual cost reduction thereafter over the following decades. DACCS results suggest that, on average, DACCS costs will decrease more steeply in the coming decades than BECCS. Despite the narrowing between the two costs, however, DACCS costs are expected to be 83% higher than BECCS costs by 2050.
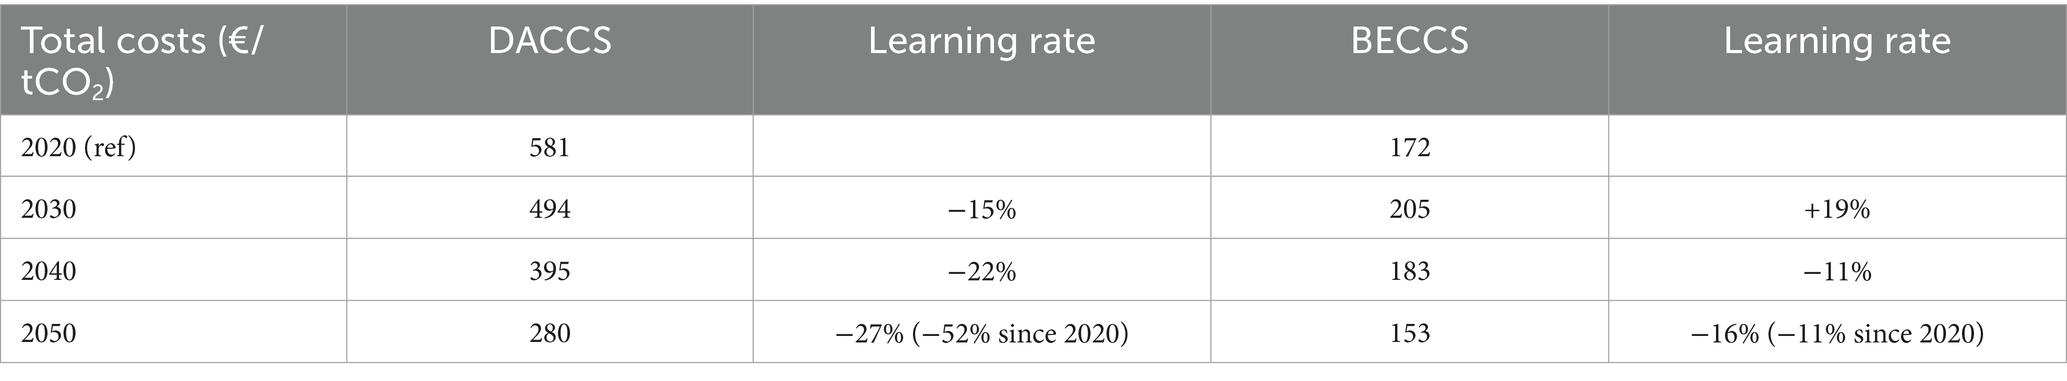
Table 10. Average DACCS and BECCS total costs and the decadal learning rate.
In summary, experts posited various reasons for expecting that DACCS costs will decrease; fabrication costs will fall due to economies of scale and process optimization (DACCS Experts 6, 9, 13, 14, 15 and 19), including the development of more efficient and less costly sorbents (DACCS Experts 5, 7, 9 12, 19, 20 and 21). In addition, the ability to ‘integrated DAC with all renewables’ (DACCS Expert 16), where costs are also falling, ‘should [make DACCS] energy prices go down’ (DACCS Expert 17). While BECCS costs are also expected to decrease, the cost reductions are not of the extent envisioned for DACCS. One expert said ‘you can have renewable (free) energy next to the system to avoid the grid (DACCS Expert 5). Some experts firmly believe that BECCS costs will increase in the coming decades due to increasing running costs of up- and down-stream operations (BECCS Expert 5, 7, 11 and 13). BECCS is currently the far cheaper technology of the two, but for deployment at scale, ‘we need a lot of investments, transport networks and preparation of sequestration sites’ (BECCS Expert 5). Additional investments will also be needed to distribute any biomass energy that is generated (BECCS Expert 9). While the former costs would also be incurred for DACCS at scale, the potential for location-independent sourcing of CO2 means that capture facilities can be located near renewable energy sources, thereby avoiding costly infrastructural and regulatory challenges that are associated with transporting biomass for powering BECCS.
To summarize, the nominal difference between DACCS and BECCS costs can be explained by differences in both technology and perceptions. DACCS is a more novel technology which can still undergo significant improvements, which is especially visible in expectations about decreasing operational costs arising from sorbent improvements and novel materials. BECCS, on the other hand, uses common industrial processes with lower current costs, but also has limited room for improvement. The results confirm that the learning rate between 2020 and 2050 is significantly higher for DACCS than for BECCS.
Interestingly, both technologies are highly dependent on the evolution of power markets. For DACCS, energy represents about a third of its total costs and experts hope that an expanding role for renewables in the energy grid will lower costs. For BECCS, as a power producer, the market price of feedstocks and energy influences plant revenues. BECCS power production, however, could be a strategic advantage for the technology in the future. Some of the experts we interviewed suggest that, by providing baseload power, BECCS could help stabilize a more volatile green grid. One expert, for example, described this potential as ‘energy gain’ (BECCS Expert 5); another expert noted that different ‘possibilities’ are raised by the ‘co-generation with heat and power’ (BECCS Expert 10).
By way of a benchmark, over the course of 2022 and 2023, prices in the EU Emissions Trading Scheme (ETS) approached or even exceeded €100/t on several occasions. For BECCS, three of twelve experts believe that BECCS costs will reach at least €100/t or lower by 2050. For DACCS, seven out of eighteen experts believe that total DACCS costs will be below €200/t in 2050 and only one of them places the costs at €100/t. This again shows that, despite the relative improvements, DACCS is expected to remain a relatively costly technology. Improving the current processes or subsidizing the technology will require heavy investments, large subsidies or technological breakthroughs.
Unsurprisingly, a more ambitious global decarbonization scenario is expected to lead to higher levels of deployment of both DACCS and BECCS. However, the specific results are less intuitive. Figure 6 shows the DACCS potential scale trajectories for 2030, 2040 and 2050 from all experts. The graphs on the left show the responses under the STEPS policy scenario and the ones on the right show those under the NZE policy scenario.
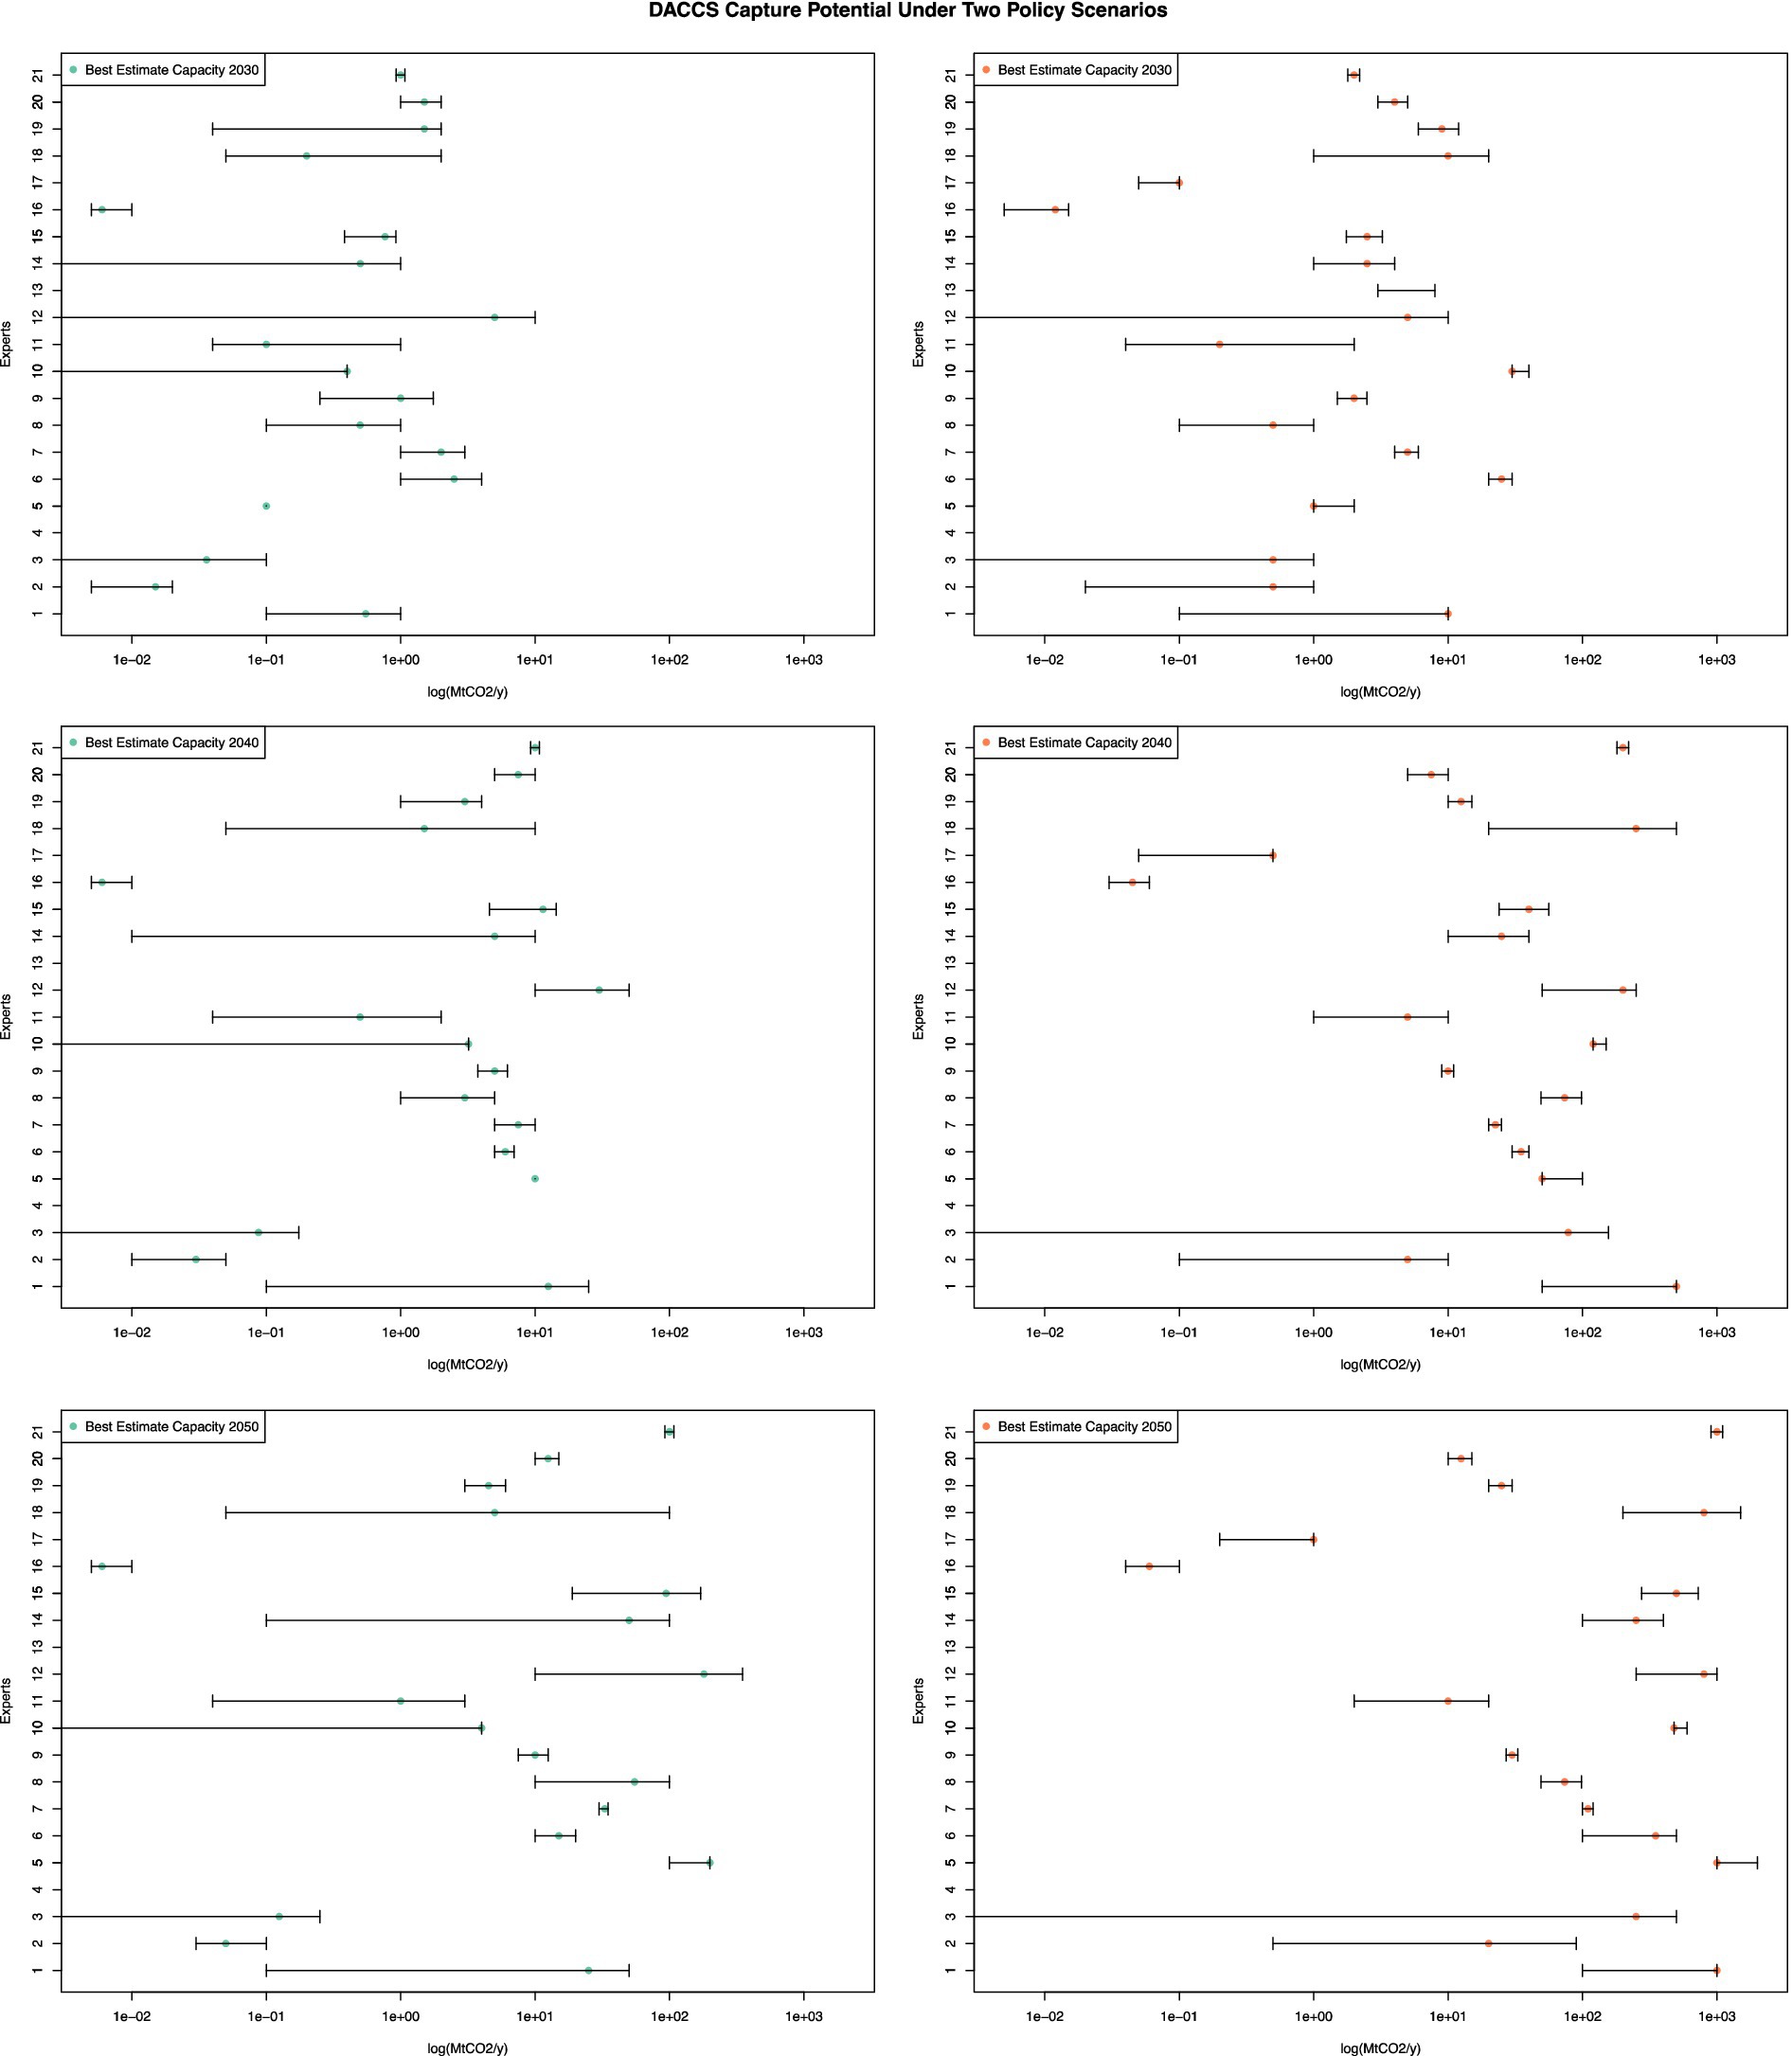
Figure 6. DACCS capture potential under two policy scenarios. DACCS potential scale under two policy scenarios in 2030, 2040 and 2050. Estimates with minimum, maximum, and best estimate of each expert in log(MtCO2) captured per year. Left graphs are the STEPS scenario, right graphs are the NZE scenario.
The ranges provided by the experts shows that the two scenarios are associated with different behaviors. In STEPS 2030, four experts believe that the minimum scale (measured in MtCO2/year) is zero, with two of these experts expecting that this will still be the case in 2040 and 2050. Under NZE 2030, two of the same experts believe the minimum scale is 0 while only one of them believes this for 2040 and 2050. Overall, there is a clear increase in the potential scale under NZE, as the ranges shift to the right. Looking at STEPS and NZE range evolution over time shows that a clear majority of experts increase their ranges. In STEPS, expert 2 decreased their range and experts 14 and 15 kept them unchanged. In NZE all experts increased their ranges over time. On average the ranges are narrower for STEPS than for NZE. This could indicate that experts tend to agree more on potential scale under STEPS than NZE. This could be because most experts agree that the possible scale attained under STEPS is limited because only voluntary market forces are at play. Additionally, the NZE scenario is less familiar and requires more stringent measures than the STEPS scenario.
As for the costs, the trajectories of selected experts are followed over time. As two different policy scenarios were used during the elicitations, five experts were selected once based on of their STEPS 2030 best estimates (1) and a second time based on their NZE 2030 best estimates (2). Table 11 shows the obtained best estimates that span across the STEPS 2030 results and Figure 7 shows the trajectories of the best estimates and min-max ranges.
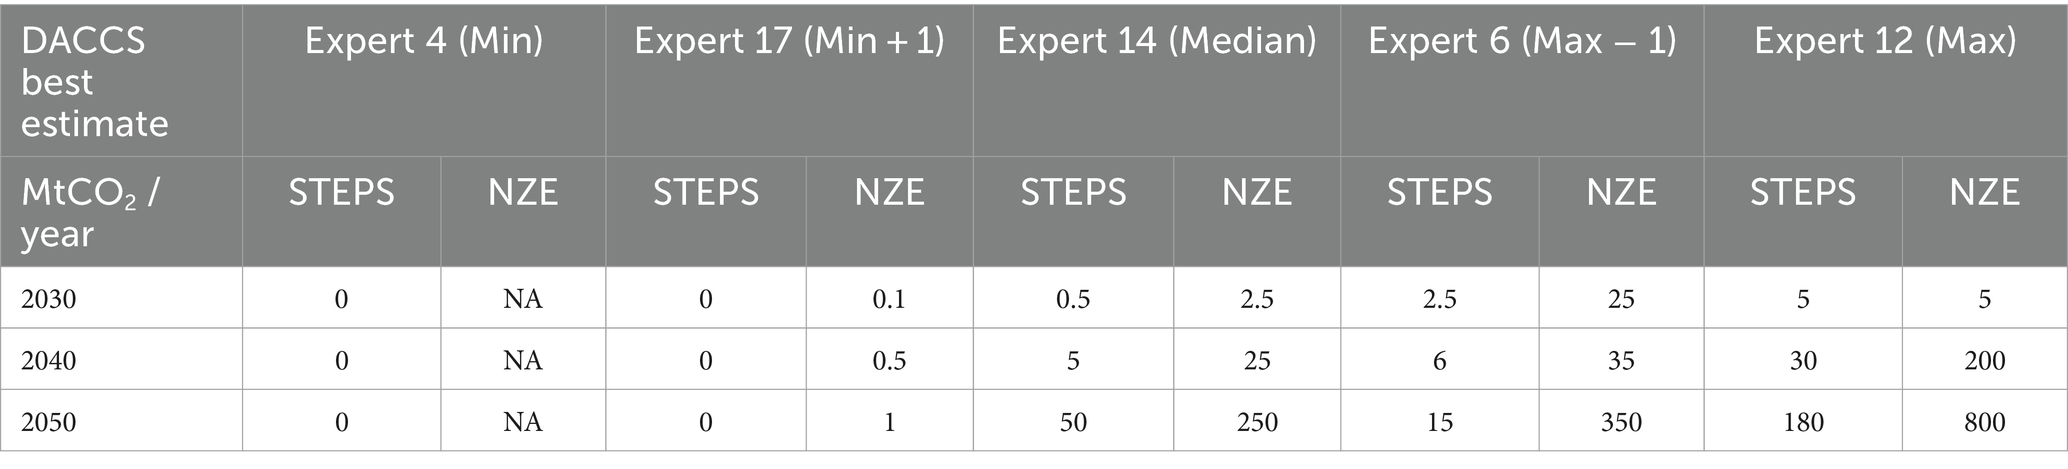
Table 11. DACCS potential scale best estimates of selected experts (1) under STEPS and NZE policy scenarios.
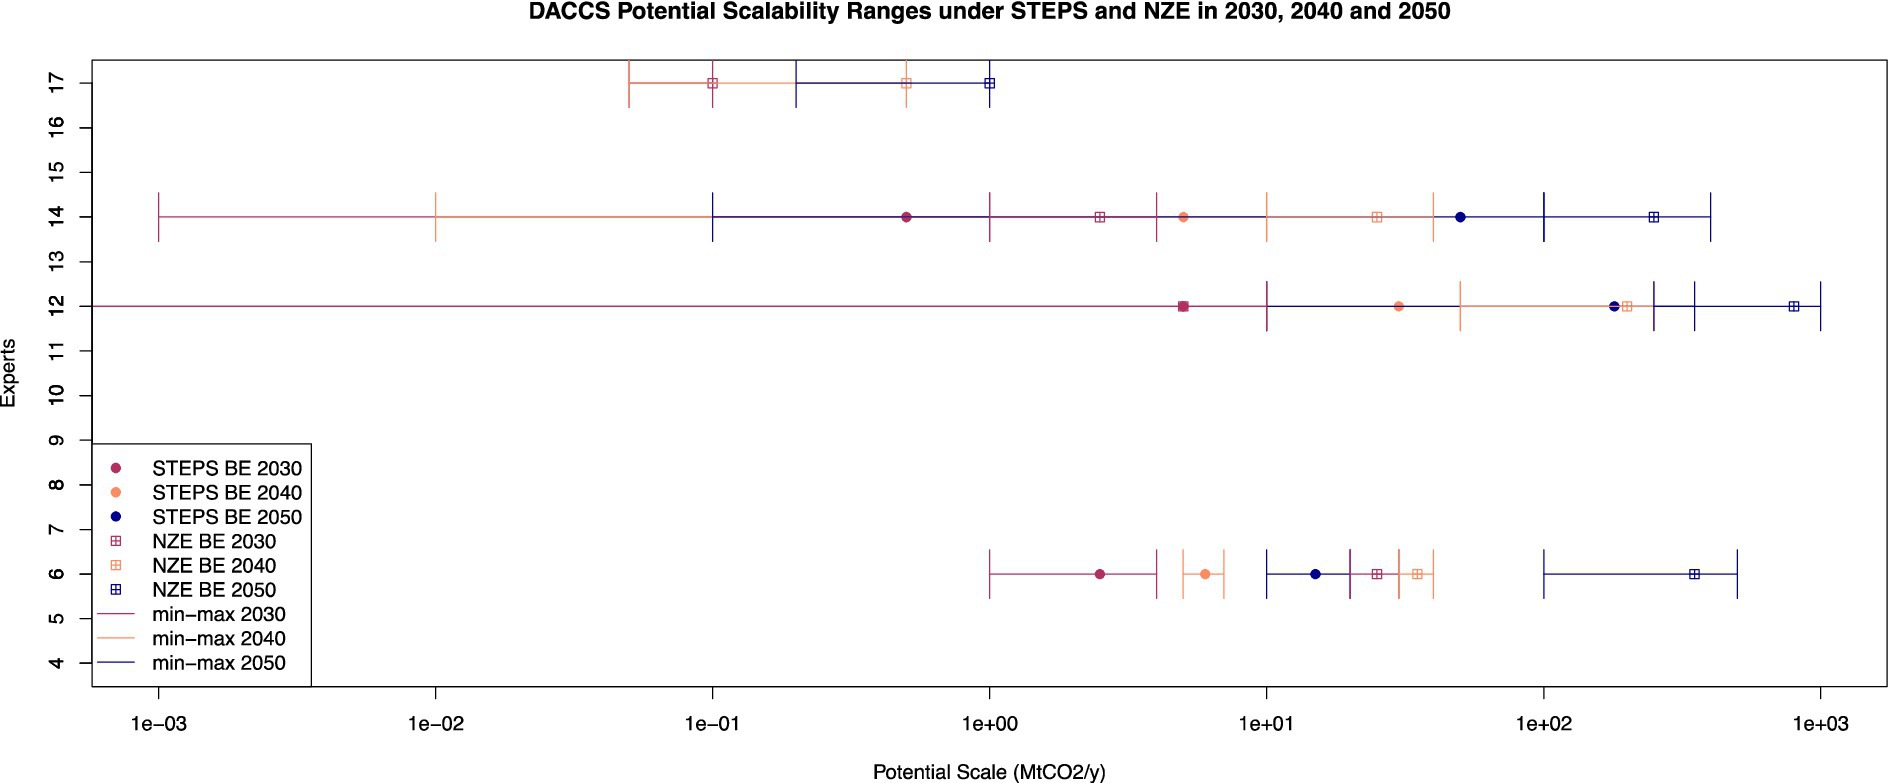
Figure 7. DACCS potential scalability ranges under STEPS and NZE in 2030, 2040 and 2050.
Figure 8 shows expert uncertainty ranges for BECCS deployment in Europe in 2030, 2040 and 2050. The graphs on the left show the ranges under the STEPS policy scenario and the ones on the right show the ranges under the NZE policy scenario. Of the 13 interviewed BECCS experts, experts 12 and 13 did not answer the potential scale questions and expert 3 only provided the best estimates. The NZE scenario leads to higher deployment scales in all three decades than the STEPS scenario. Compared to DACCS, BECCS ranges are narrower and overlapping, and there is no clear outlier in the results. All min-max ranges increase or stay constant for STEPS and NZE.
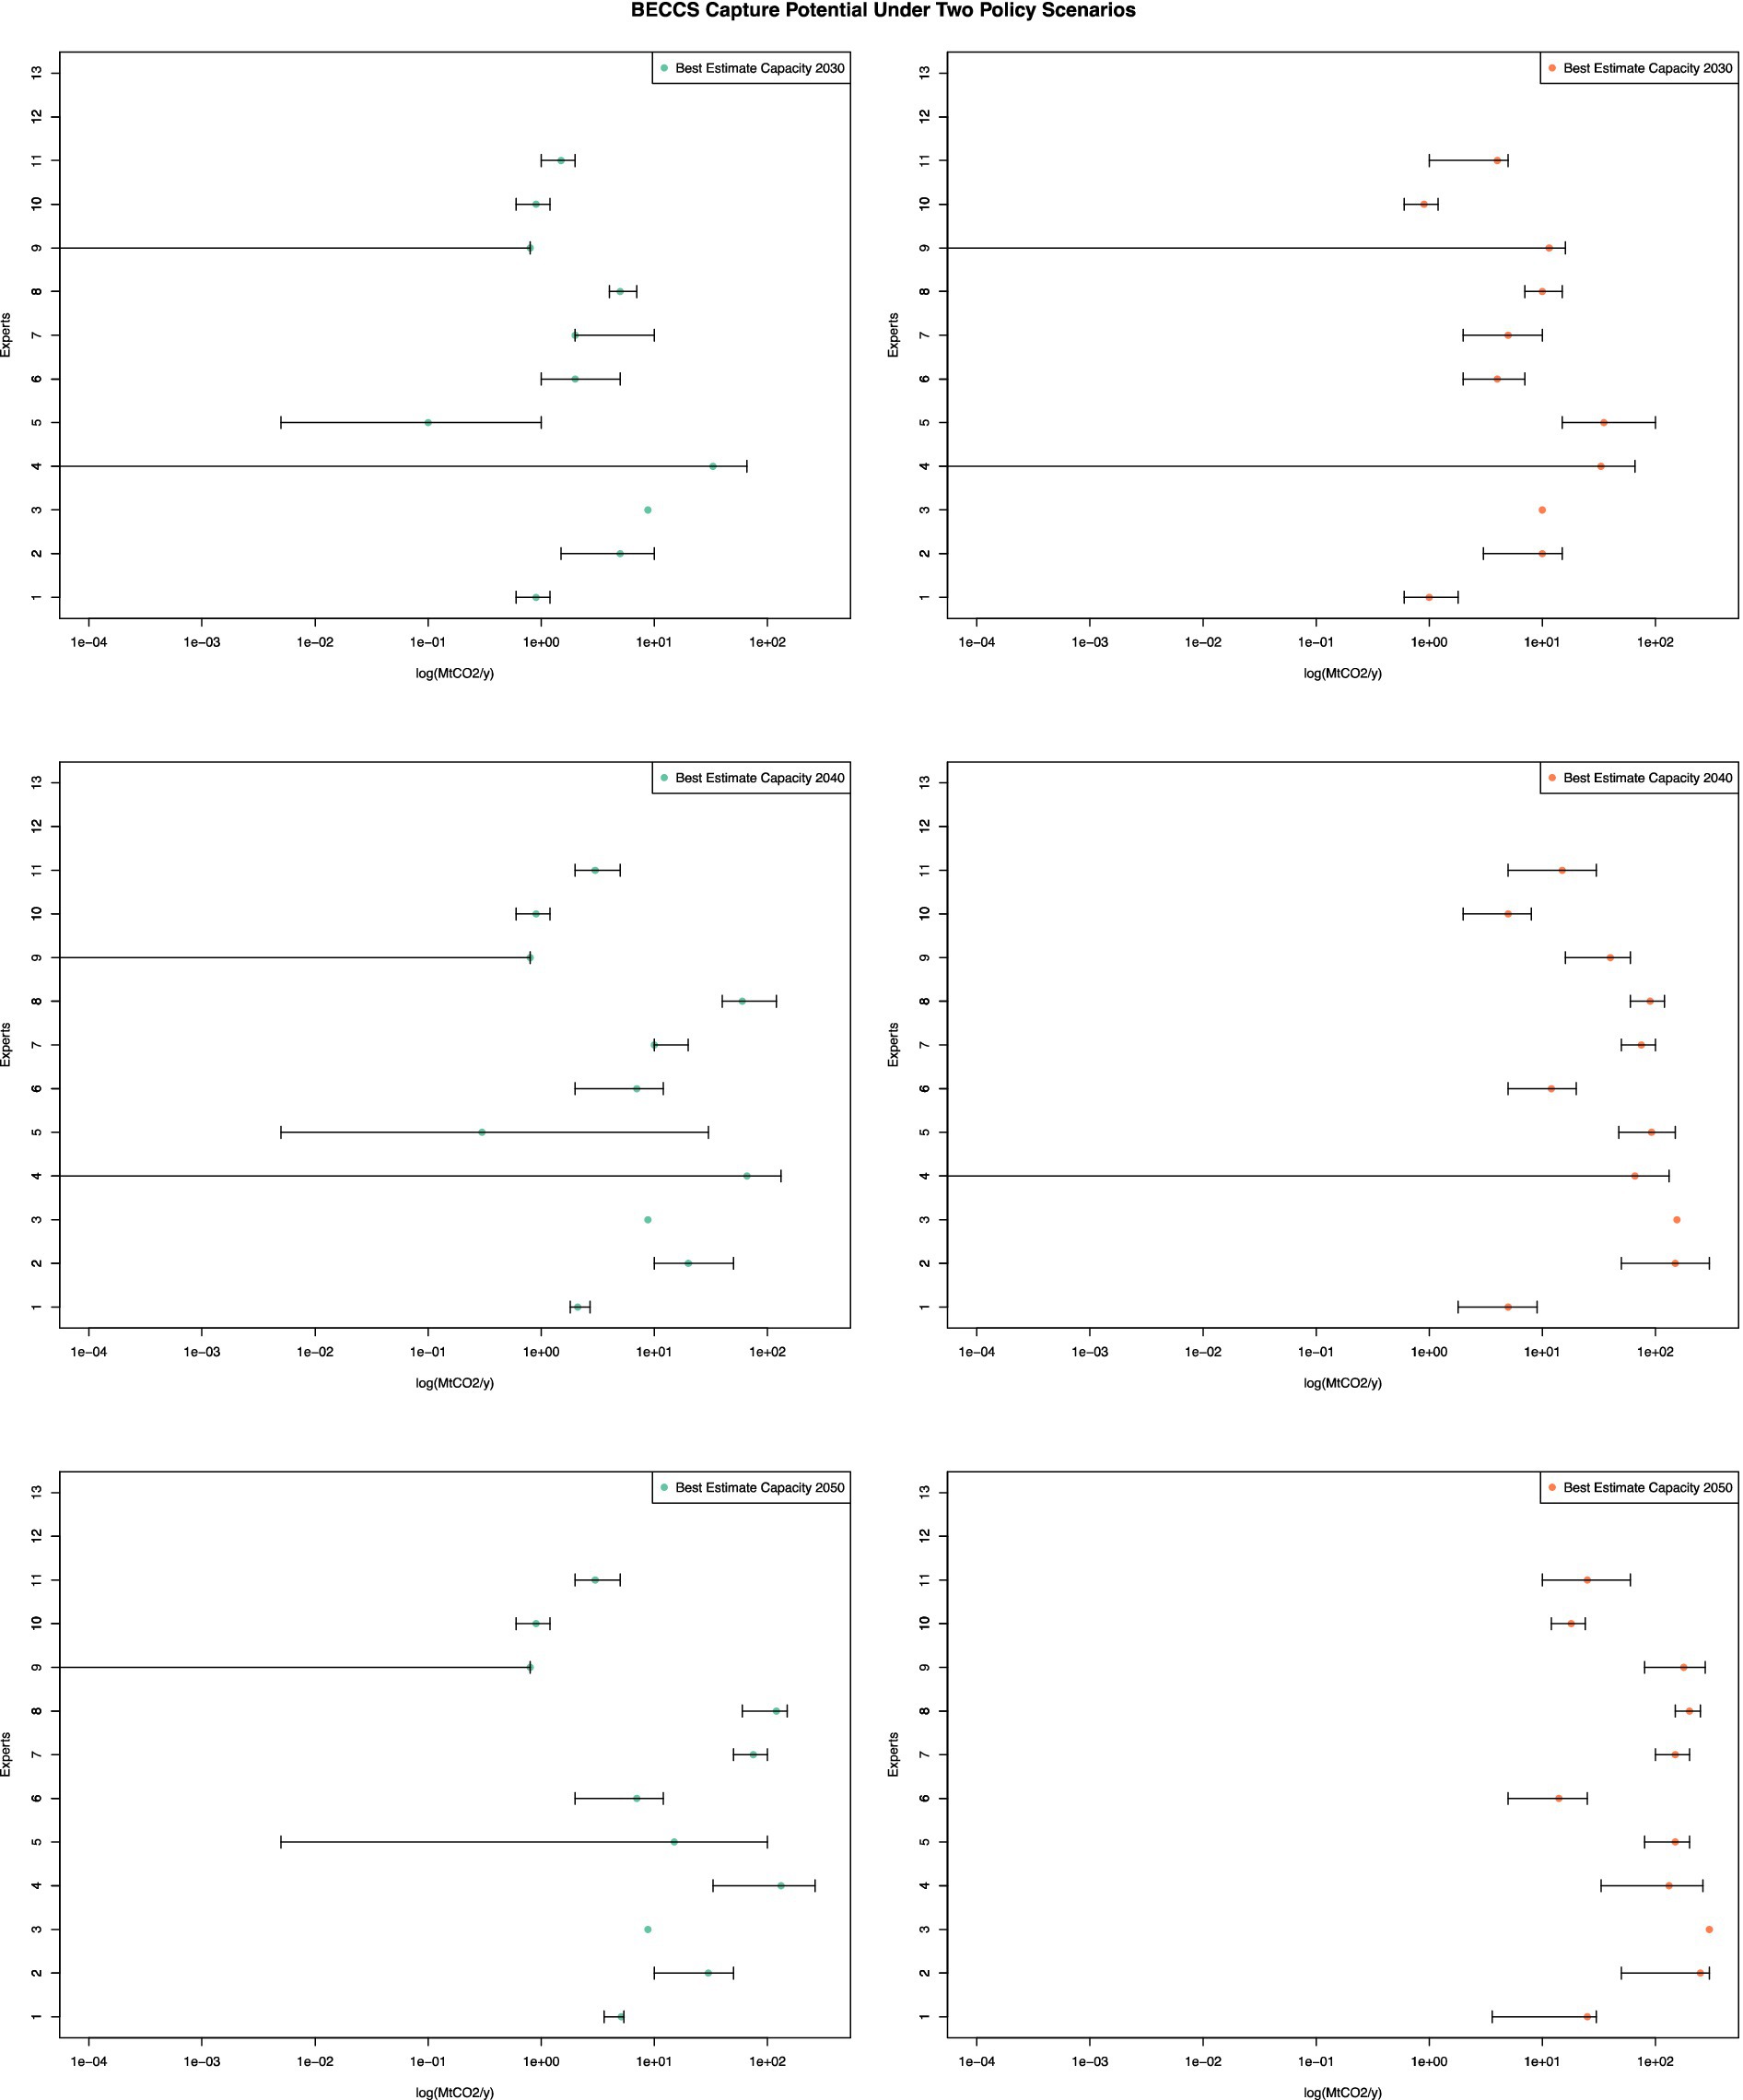
Figure 8. BECCS capture potential under two policy scenarios. BECCS potential scale under two policy scenarios in 2030, 2040 and 2050. Estimates with minimum, maximum, and best estimate of each expert in log(MtCO2) captured per year. Left graphs are the STEPS scenario, right graphs are the NZE scenario.
For STEPS, some experts stated that only the UK and Scandinavian countries would operate BECCS plants (BECCS Experts, 4, 5, 8 and 9). One expert believes that only the currently developed DRAX and Stockholm Exergi projects would be operational as ‘there is no other funding [in the EU], only the Stockholm Exergi Project (BECCS Expert 3). A number of experts concur that Scandinavia is an ideal choice to develop the plants due to the large amount of waste that can be used from forest residues and the pulp and paper industry. One expert comments, for example, said that ‘pulp plants is the first portion [determinant of deployment capacity], not the energy sector’ (BECCS Expert 6). Sweden is predicted to assume about one third of European BECCS as the country has existing policies encouraging the deployment of the technology (but this can also be influenced by the overrepresentation of Scandinavian experts in our sample). Such considerations lead one expert to expect that by mid-century, all additional BECCS plants will be located only in Sweden (BECCS Expert 2). Finally, strong opinions were expressed on the uniqueness of each BECCS project: experts made the following comments to describe this heterogeneity ‘all options/ plants are different’ (BECCS Expert 6) and ‘one of a kind… modular [projects]’ (BECCS Expert 13). Experts therefore expressed strong beliefs that BECCS be treated on a case-by-case basis there is no one-size-fits all deployment strategy, which creates an expectation that NZE targets will not be met. While several experts emphasized the potential role for more effective policy to drive future deployment (e.g., BECCS Experts 3, 5, 8, 11 and 12), the overall cautious or even pessimistic expectations about BECCS scalability suggest the need for exploring other negative emission technologies that can undergo large-scale deployment.
The trajectories of two different expert batches are shown below. These trajectories help understand the specific evolution of expert ranges that span throughout the obtained result range. Table 12 shows the best estimates of the experts selected based on their span of the STEPS 2030 best estimates. Figure 9 shows the trajectories of these selected experts. Expert 3 provided only the best estimate and no min-max ranges.
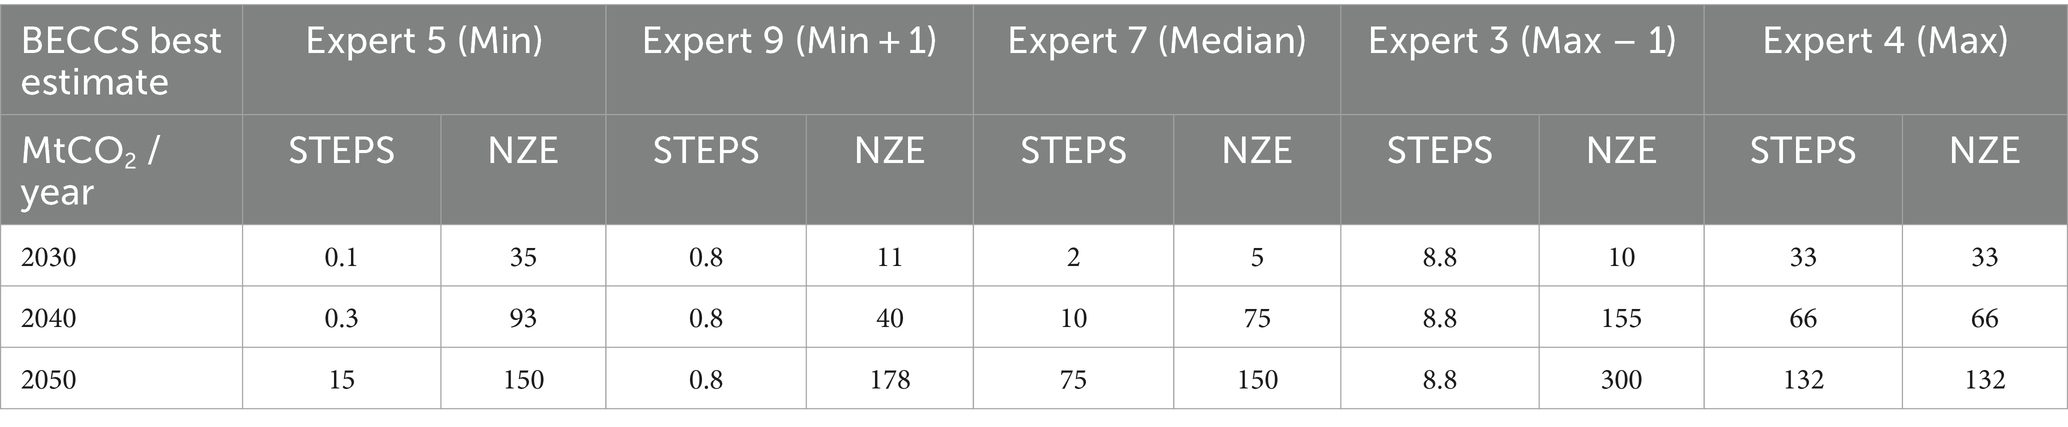
Table 12. BECCS potential scale best estimates of selected experts under STEPS and NZE policy scenarios.
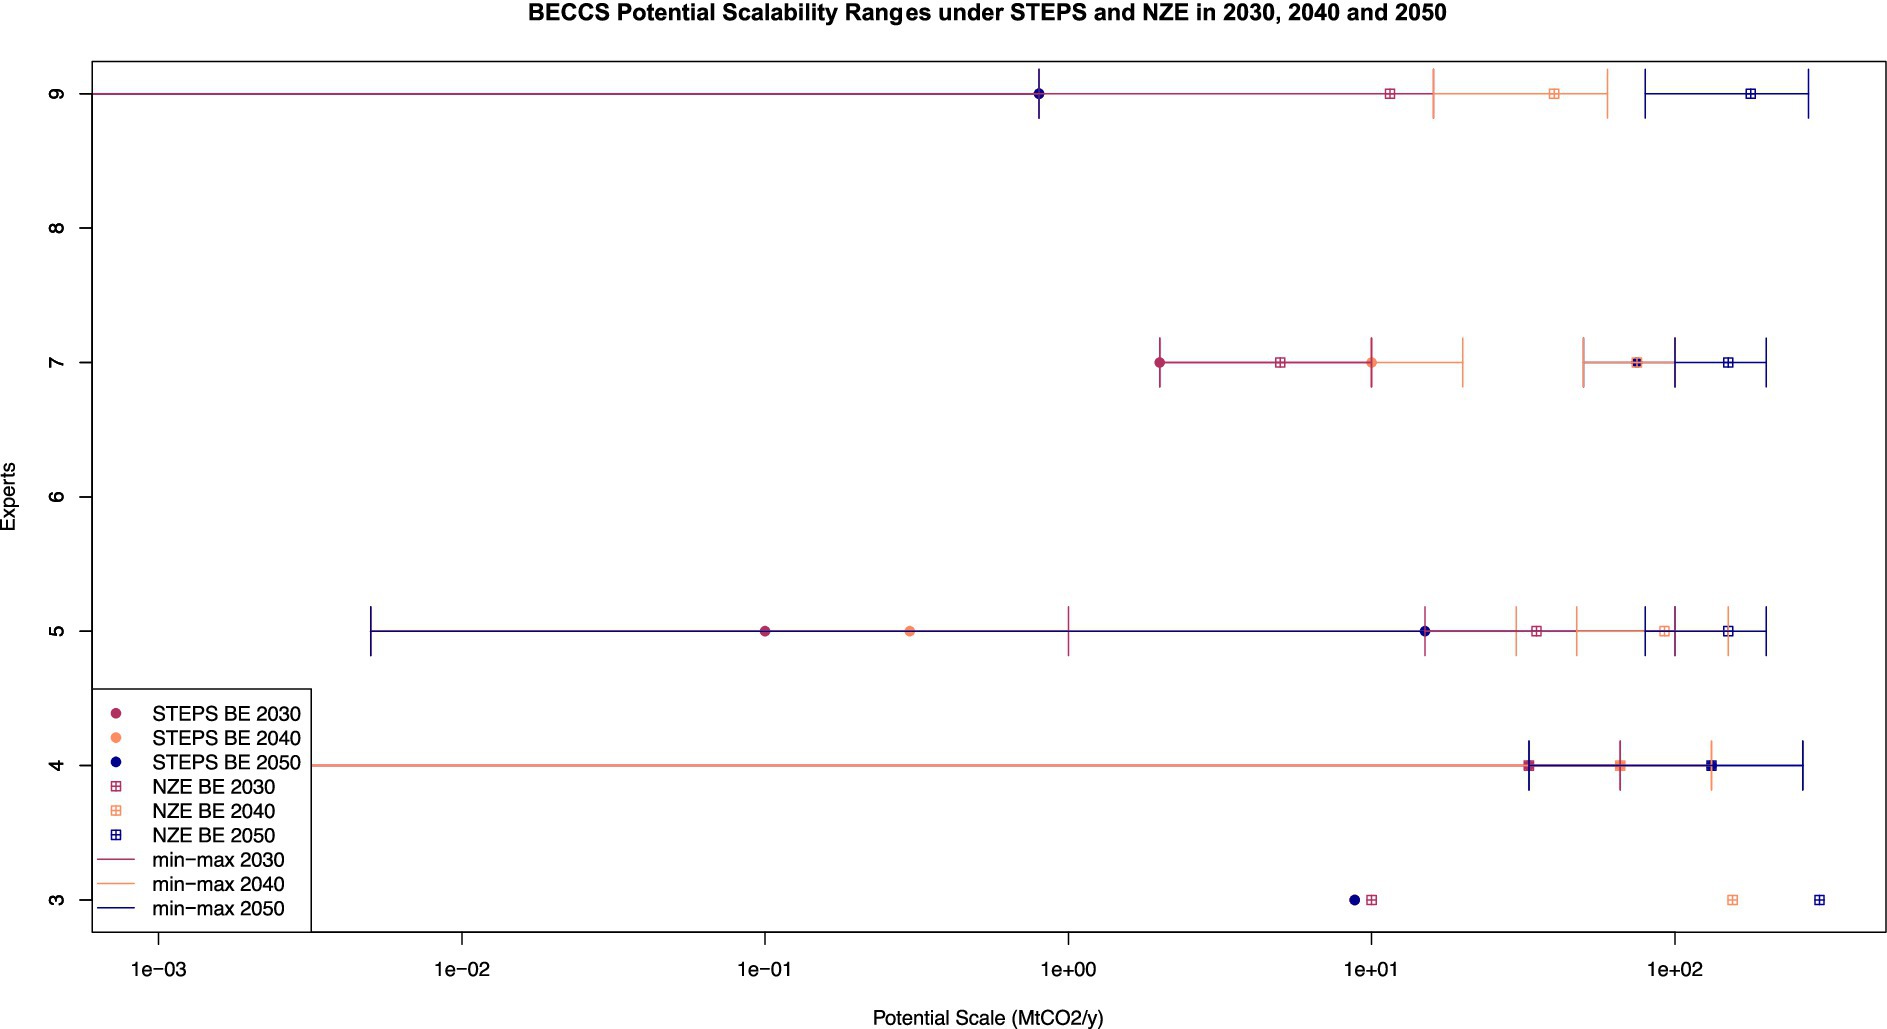
Figure 9. BECCS potential scalability ranges under STEPS and NZE in 2030, 2040 and 2050.
Table 13 shows the average of the best estimates for the potential scale of DACCS and BECCS in Europe under STEPS and NZE for each year. In the first decade, DACCS is deployed more slowly than BECCS, before the trend reverses. For DACCS, the assumptions under the STEPS scenario lead to a linear increase up to 39.5 MtCO2 captured per year. The expected development under the NZE scenario, however, involves a sharp increase in the 2040s, leading to up to 353Mt CO2 captured per year. For BECCS, the NZE scenario leads to additional capture capacity, but the change is not as drastic as for DACCS. Under NZE the deployed scale would average 131 Mt. CO2 capture per year, not even half that of DACCS.

Table 13. Average of capacity best estimates for DACCS and BECCS technologies under STEPS and NZE.
To summarize, the best estimates show that stringent climate policies are expected to result in larger capacity deployment for both DACCS and BECCS. Enabling policies have a particularly strong effect on the deployment of DACCS, with a sharp increase in the years leading to 2040. With the ongoing research and investment in that field, experts expect that a dominant design will be adopted by 2040. This would reduce DACCS costs and, combined with the modularity of the technology, would enable a quick scale-up of capacity. However, the figures show that for this to happen, it is crucial to develop and implement the right policies.
In sum, our experts expect that under the NZE scenario, the average best estimate for the potential scale of DACCS is 353Mt CO2/year, which is a ninefold increase from the STEPs estimate (39Mt CO2/year). By contrast, despite nominally lower costs, BECCS struggles to achieve similar scales in 2050, reaching an average capture capacity of 131Mt CO2/year under NZE and 36Mt CO2/year under STEPS, which amounts to less than a fourfold increase. Of course, any comparison of the DACCS and BECCS expert elicitations must be treated with caution since they involve two distinct and independent groups of experts.
The NZE scenario is associated with substantially higher deployment of both technologies, but the average estimated combined capacity of DACCS and BECCS in the expert elicitations for 2050 amounts to only about a quarter of the CO2 removals that the IEA envisions would be needed in its NZE scenario (1.9 GtCO2). This reinforces the view expressed by several experts that ‘a suite of technologies will’ (DACCS Expert 12) be needed to meet net-zero ambitions. Alongside the higher expected deployment for both technologies under the NZE scenario, the uncertainty associated with these estimates is also higher. As one expert puts it, ‘Huge uncertainty [exists] because what will be done has a range of technologies available… depends on policymakers’ (BECCS Expert 8). Although the most conservative DACCS estimates the risk that DACCS will not be deployed at all, expert projections suggest that this technology shows promising deployment scale under NZE with the confidence interval maxima reaching up to 1Gt CO2/year captured in 2050. Most experts concurred that the deployment levels of both technologies depend on the successful implementation of early plants and that this requires negative emission technologies to be clearly defined in European policy frameworks. Hence, the prospects of future deployment were described as ‘contingent on EU policy decisions’ (DACCS Expert 1), particularly regarding the development of regulations around ‘who is paying for what’ (DACCS Expert 10), especially ‘in the EU, when it is not the ideal place to develop it [CCS-based NETs due to] energy costs and proximity to storage…’ (DACCS Expert 13). As one expert put it, ‘the EU Commission should not think in terms of stated policies, but in terms of policy reform’ (BECCS Expert 11). For the STEPS scenario, the most conservative estimates (i.e., the minimum of the confidence interval) for BECCS deployment shows a higher potential scalability compared to DACCS. However, BECCS shows a maximum deployment scale that remains limited to around 0.3Gt CO2/year captured in both scenarios. We found higher uncertainty for the scalability of BECCS, which can be due to the need for one-of-a-kind plants and local supporting infrastructure.
The results of our study imply the following conclusions about our key research questions over the change in cost uncertainty over time and learning rates. We find that for both DACCS and BECCS technologies, cost uncertainty increases over time. We also find the learning rate for DACCS tends to be higher than for BECCS. In particular, experts expect operational costs for DACCS to decline more sharply than BECCS costs. It is likely that higher learning rates associated with DACCS stem from the novel status of the technology and potential for larger improvements.
This study provides valuable insights into the future of DACCS and BECCS technologies in Europe. The experts’ quantitative inputs, supported by their judgement of the factors that influence the field, shed light on the cost uncertainties of these technologies. In the interest of achieving a nuanced understanding of expert perceptions, our analysis is based on in-depth insights provided by a select group of 34 experts, prioritizing depth of insight over statistical representativeness. Consequently, the generalizability of our results is inherently limited, and we cannot presuppose that a larger or different cohort of experts would necessarily concur with the findings presented. The discussion that follows is purely our interpretation of the insights garnered from the 34 experts interviewed through this research effort and does not purport to extend beyond the specific set of experts consulted in this study.
Although DACCS total costs exhibit decreasing uncertainty over time, the cost breakdown displays increasing uncertainty. This could be a reflection of the difficulty of grasping the full complexity of the technology in one total cost metric arising from the potential of the technology to take on a vastly different form in a relatively short time period. Additionally, DACCS involves an energy intensive process and therefore depends on energy prices. The current geopolitical climate does not favor energy cost certainty and the experts which provided the cost breakdown found it hard to speculate on this cost item. DACCS experts were confident that in the future new and better materials as well as economies of scale would lower the costs of the technology, but overall, the uncertainty of European energy prices remains a hurdle to the deployment of the technology.
BECCS costs show growing uncertainty over time due to the unique aspect of each plant development. BECCS plants are developed as a one-of-a-kind plant, with specific up- and down-stream supply chains, leading to high uncertainty. As for DACCS, the energy revenue of BECCS is linked to European energy prices and hence, uncertain. However, the revenues obtained through energy sales help make the technology financially attractive and BECCS is consistently cheaper than DACCS, with some extreme minimum cases attaining costs below €100/tCO2.
Overall, our experts expect BECCS costs to decrease in the coming decades but not as dramatically as DACCS costs. On average, by 2050, DACCS reaches costs of €280/tCO2 and BECCS costs of €153/tCO2. Despite being the cheaper technology, large-scale BECCS deployment would require both significant investment and international coordination for regulating relatively diverse plants, sourcing and transporting biomass upstream and distributing biomass energy downstream. By contrast, by facilitating location-independent sourcing of CO2, DACCS avoids some of the transport and regulatory challenges that are encountered for powering BECCS at scale and regulating potential biomass energy generation. However, some experts believe that by providing baseload power, BECCS could be strategically positioned to help stabilize a volatile green energy grid and, unlike DACCS, could accrue revenues from power generation rather than consuming vast amounts of electricity.
To conclude on the cost best estimates, our experts expect that the major cost reductions will be driven by economies of scale, process optimization and energy cost reductions. As the costs of both technologies are linked to European energy prices, policymakers must prioritize securing a stable green energy grid to reduce the uncertainty arising from the energy prices of these technologies.
This study highlights the need to understand the nature and sources of uncertainty surrounding key emerging climate technologies for reaching realistic assessments about the potential of CDR to achieve climate neutrality. Our results show that expectations about costs vary widely and tend to expand with increasing time horizons. As discussed above, past research (e.g., Grant et al., 2021) shows that experts that hold different expectations about costs of CDR options tend to hold different expectations about deployment scales. While the IEA (2021) identifies NZE-compliant DACCS and BECCS deployment scales for each decade, no such cost targets have been stipulated beyond the $100/tCO2/year removal industry target for advanced economies. Nonetheless, it is possible to explore the scalability implications of our cost uncertainty analysis by comparing the average cost and deployment estimates provided by our experts with the decadal cost and deployment estimates from recent IEA tracking data as summarised in Table 14 (Sources for tracking data are specified in the Table caption).3 The average 2030 DACCS cost estimated by our experts is significantly (approximately two to ten-fold) higher than current IEA tracking data (that does not assume the existence of a carbon price). While our average 2030 DACCS scalability estimate is more optimistic than the equivalent IEA projection (0.88 versus <0.01 Mt./CO2/year respectively), this is still significantly lower than the NZE target for that decade (85 Mt./CO2/year). Although the gap between expected DACCS costs and deployment predicted by our experts and the NZE scenario narrows by mid-century, our experts expect that DACCS costs will be four-times higher than current IEA tracking projections suggest and deployed at less than half of the scale predicted by IEA tracking – around a quarter of the scale needed to be NZE-compliant.
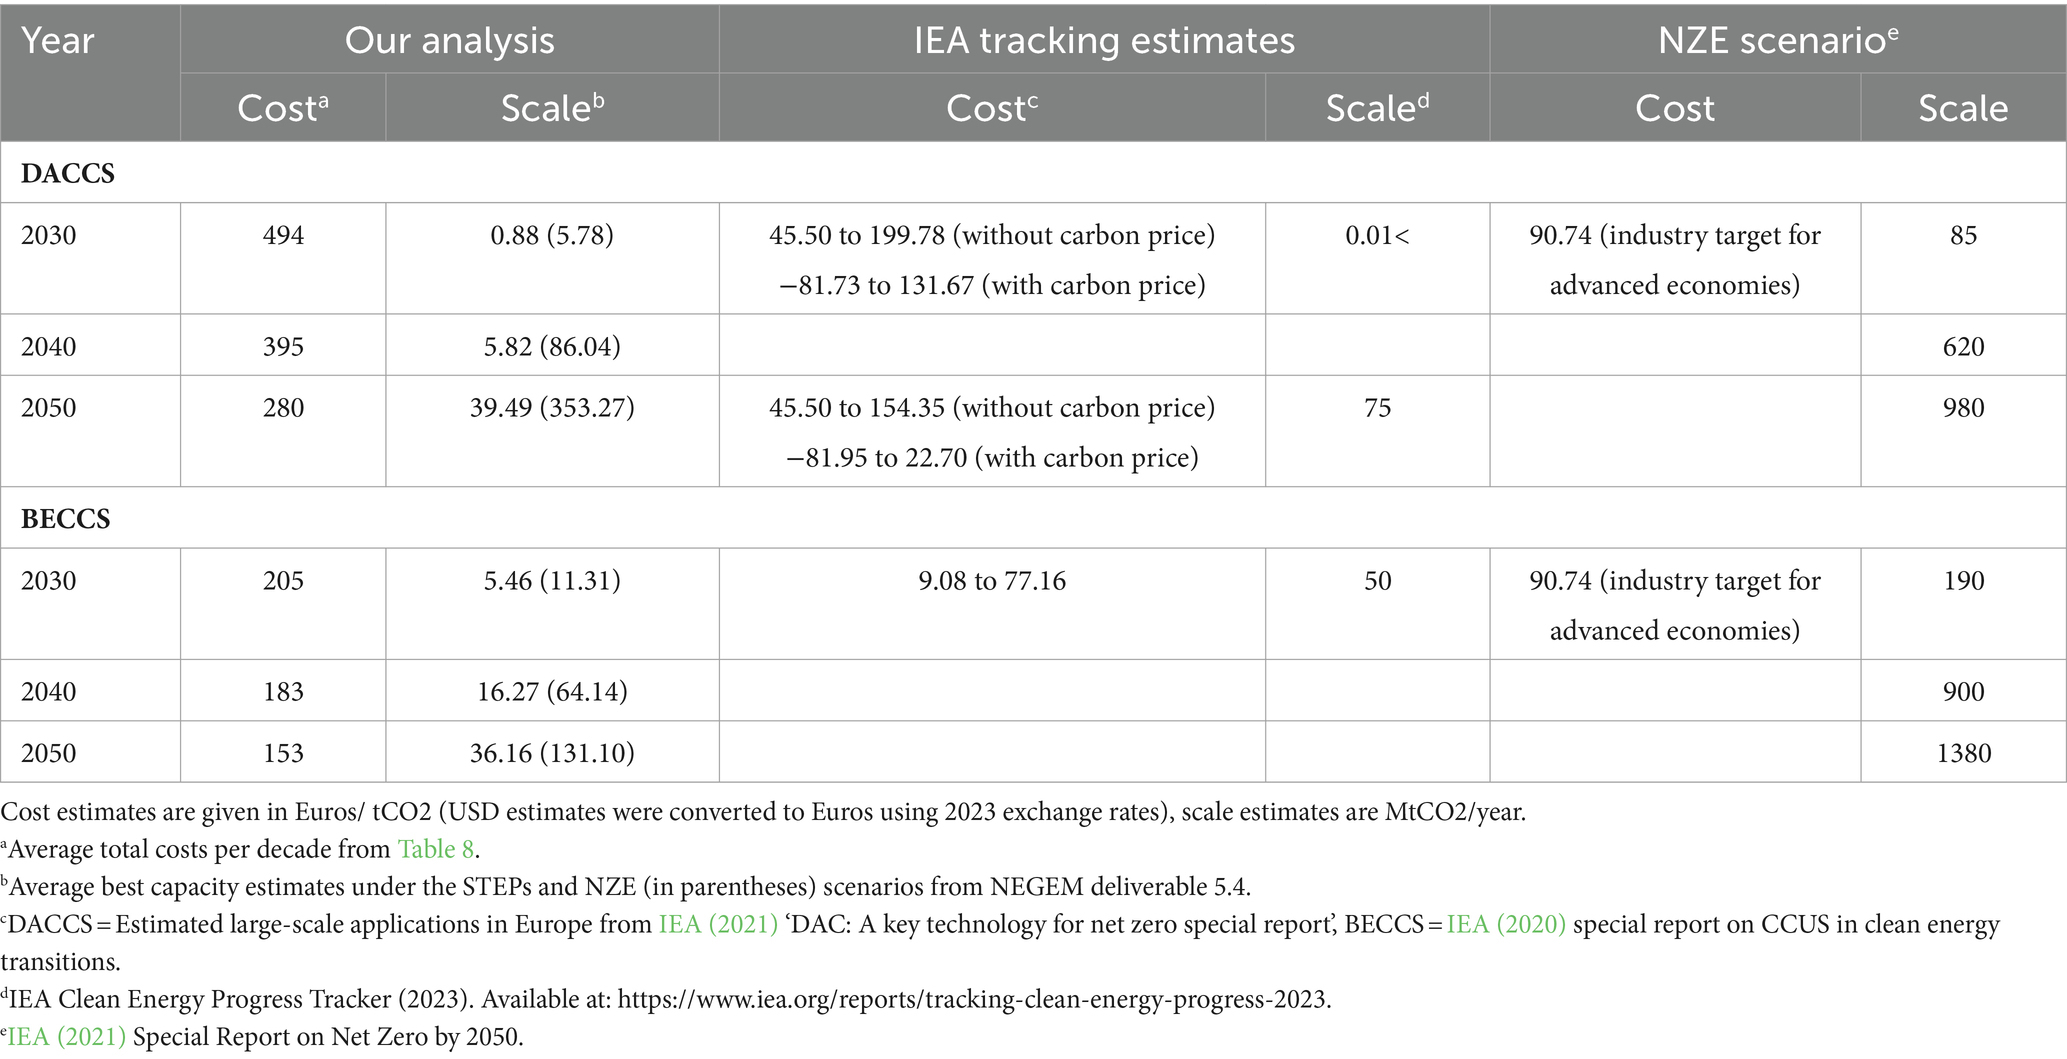
Table 14. Comparison of our cost and scalability estimates with IEA tracking and NZE scenario goals.
Compared to DACCS, our experts’ expectations about BECCS are relatively more pessimistic. By 2030, our BECCS costs are expected to be significantly higher (around two- to twenty-fold) than those predicted by IEA tracking, which is more than twice as high as the NZE industry target. While a lack of decadal data obstructs our comparison with tracking and NZE estimates beyond 2030, it is striking that despite expected declining costs and increasing deployment, our experts predict that throughout the 2030s to 2050s, BECCS deployment relative to NZE targets will be significantly insufficient—around one 36th of the scale needed to reach negative emissions by mid-century.
Moreover, it is striking that even when experts were asked to estimate scalability under the NZE scenario (see separate NZE estimates presented in parentheses in Table 14), the scalability of both technologies were still only a fraction (around a third for DACCS and tenth for BECCS) of the levels required to reach net zero by mid-century.
In conclusion, our experts expect that DACCS and BECCS costs will be even higher (and deployment scales lower) than those predicted by recent IEA tracking. While, relative to NZE requirements, DACCS scalability is assessed more favorably than BECCS, our experts’ wide uncertainty ranges suggest that current IAM projections about the scalability of these technologies are likely to be more optimistic (closer to NZE targets) than is actually feasible. Better understandings about the uncertainty surrounding costs, particularly in relation to the distant future, would significantly improve projections about the relative role and scalability of different CDR options and other technologies and processes within the wider portfolio of climate policy options and ultimately assist policymakers design effective legislation for meeting decarbonization and net zero targets.
The results and insights gathered in this work present a preliminary assessment of the uncertainty of future costs of DACCS and BECCS technologies. Our study focuses on both shorter and longer-term technology evolution from 2030 to 2050. In so doing, we provide a first understanding of selected expert views on parameters which influence future emission scenarios and European wide policies.
As a first effort, the scope of this study was inevitably limited. In the process of conducting the study we identified a number of extensions or additional angles that could be explored by future research.
1. It would be helpful to find experts who would be able to appraise multiple options at the same time, which would allow for direct comparison of options. Additionally, ensuring that more industry experts are represented is crucial in building an accurate view of the challenges developers face.
2. Finally, this research could be extended along other geographical and sectoral dimensions. We focused primarily on Europe, but other regions such as North America, where important carbon capture clusters and supporting policies are being developed would also benefit from expert elicitation analysis. We could also extend the study to explore uncertainty surrounding the supporting infrastructure such as infrastructure companies that develop the transport routes from carbon capture to carbon storage sites and the carbon storage companies including oil and gas companies or companies that specialize in carbon storage. Improving understandings of the challenges and uncertainties that these companies face is crucial for developing a robust carbon capture supply chain.
3. Relatedly, similar analyses could be conducted with experts from industrializing economies, which are increasingly emerging as critical for hosting or funding CDR (e.g., Peters and Geden, 2017; Pozo et al., 2020). At scale deployments in these countries are likely to encounter both similar (e.g., infrastructural, resource needs) and different (e.g., social/ ethical acceptability, fragile energy system, poor energy access) challenges to those identified by our European experts. Therefore, expert perspectives from developing economies would yield valuable insights into the wider global infrastructural and social acceptability challenges that are likely to arise under climatically-relevant deployment.
The anonymized raw data supporting the conclusions of this article will be made available by the authors, without undue reservation.
The studies involving humans were approved by Judge Business School research ethics review group. The studies were conducted in accordance with the local legislation and institutional requirements. The participants provided their written informed consent to participate in this study.
MA: Data curation, Formal analysis, Investigation, Visualization, Writing – original draft. ZC: Writing – review & editing. LN: Conceptualization, Methodology, Supervision, Visualization, Writing – review & editing. DR: Conceptualization, Funding acquisition, Methodology, Project administration, Supervision, Writing – review & editing.
The author(s) declare financial support was received for the research, authorship, and/or publication of this article. This project has received funding from the European Union’s Horizon 2020 research and innovation programme under grant agreement no. 869192 (Negem).
We thank Nixon Sunny and Solène Chiquier for reviewing the background materials sent to participants and our NEGEM partners more generally for their support with this project. We are grateful to all of the experts involved for the time they gave us to participate in the elicitations.
The authors declare that the research was conducted in the absence of any commercial or financial relationships that could be construed as a potential conflict of interest.
All claims expressed in this article are solely those of the authors and do not necessarily represent those of their affiliated organizations, or those of the publisher, the editors and the reviewers. Any product that may be evaluated in this article, or claim that may be made by its manufacturer, is not guaranteed or endorsed by the publisher.
The Supplementary material for this article can be found online at: https://www.frontiersin.org/articles/10.3389/fclim.2024.1331901/full#supplementary-material
1. ^Subsequent to the expert interviews conducted for our study, we extended an invitation to one of our interviewed experts, Zeynep Clulow, to join the authorial team. Her inclusion was specifically due to her demonstrated expertise in DACCS, which proved invaluable during the manuscript revision process and in the interpretation of our results.
2. ^The protocol can be obtained from the authors on request.
3. ^Unless specified otherwise, the present discussion considers the scalability estimates that experts predicted in relation to the STEPs scenario.
Abdulla, A., Hanna, R., Schell, K., Babacan, O., and Victor, D. (2021). Explaining successful and failed investments in US carbon capture and storage using empirical and expert assessments. Environ. Res. Lett. 16:014036. doi: 10.1088/1748-9326/abd19e
Apostolakis, G. (1990). The concept of probability in safety assessments of technological systems. Science 250, 1359–1364. doi: 10.1126/science.2255906
Block, R. A., and Harper, D. R. (1991). Overconfidence in estimation: testing the anchoring-and-adjustment hypothesis. Organ. Behav. Hum. Decis. Process. 49, 188–207. doi: 10.1016/0749-5978(91)90048-X
Brandl, P., Bui, M., Hallett, J. P., and Mac Dowell, N. (2021). Beyond 90% capture: possible, but at what cost? Int. J. Greenhouse Gas Control 105:103239. doi: 10.1016/j.ijggc.2020.103239
Butnar, I., Li, P. H., Strachan, N., Portugal Pereira, J., Gambhir, A., and Smith, P. (2020). A deep dive into the modelling assumptions for biomass with carbon capture and storage (BECCS): a transparency exercise. Environ. Res. Lett. 15:084008. doi: 10.1088/1748-9326/ab5c3e
Clulow, Z., and Reiner, D. M. (2022). “Political and socio-economic challenges to negative emission technologies” in Greenhouse gas removal technologies. eds. M. Bui and N. Mac Dowell (Croydon, UK: Royal Society of Chemistry), 390–429.
Davis, S. J., Lewis, N. S., Shaner, M., Aggarwal, S., Arent, D., Azevedo, I. L., et al. (2018). Net-zero emissions energy systems. Science 360:eaas9793. doi: 10.1126/science.aas9793
Deutz, S., and Bardow, A. (2021). Life-cycle assessment of an industrial direct air capture process based on temperature–vacuum swing adsorption. Nat. Energy 6, 203–213. doi: 10.1038/s41560-020-00771-9
Donnison, C., Holland, R. A., Hastings, A., Armstrong, L. M., Eigenbrod, F., and Taylor, G. (2020). Bioenergy with carbon capture and storage (BECCS): finding the win–wins for energy, negative emissions, and ecosystem services—size matters. GCB Bioenergy 12, 586–604. doi: 10.1111/gcbb.12695
Erans, M., Sanz-Pérez, E. S., Hanak, D. P., Clulow, Z., Reiner, D. M., and Mutch, G. A. (2022). Direct air capture: process technology, techno-economic and socio-political challenges. Energy Environ. Sci. 15, 1360–1405. doi: 10.1039/D1EE03523A
Fajardy, D., Köberle, A., Mac Dowell, N., and Fantuzzi, A. (2019). BECCS deployment: a reality check. Grantham institute briefing paper 28, Imperial College London.
Fajardy, M., Morris, J., Gurgel, A., Herzog, H., MacDowell, N., and Paltsev, S. (2021). The economics of bioenergy with carbon capture and storage (BECCS) deployment in a 1.5°C or 2°C world. Glob. Environ. Chang. 68:102262. doi: 10.1016/j.gloenvcha.2021.102262
Fasihi, M., Efimova, O., and Breyer, C. (2019). Techno-economic assessment of CO2 direct air capture plants. J. Clean. Prod. 224, 957–980. doi: 10.1016/j.jclepro.2019.03.086
Fuss, S., and Johnsson, F. (2021). The BECCS implementation gap–a Swedish case study. Front. Energy Res. 8:553400. doi: 10.3389/fenrg.2020.553400
Fuss, S., Lamb, W. F., Callaghan, M. W., Hilaire, J., Creutzig, F., Thorben, A., et al. (2018). Negative emissions: II. Costs, potentials, and side effects. Environ. Res. Lett. 13:063002. doi: 10.1088/1748-9326/aabf9f
Grant, N., Hawkes, A., Mittal, S., and Gambhir, A. (2021). The policy implications of an uncertain carbon dioxide removal potential. Joule 5, 2593–2605. doi: 10.1016/j.joule.2021.09.004
Hanna, R., Abdulla, A., Xu, Y., and Victor, D. G. (2021). Emergency deployment of direct air capture as a response to the climate crisis. Nat. Commun. 12:368. doi: 10.1038/s41467-020-20437-0
Honegger, M., and Reiner, D. (2018). The political economy of negative emissions technologies: consequences for international policy design. Clim. Pol. 18, 306–321. doi: 10.1080/14693062.2017.1413322
IEA . (2020). CCUS in clean energy transitions – analysis. Available at: https://www.iea.org/reports/ccus-in-clean-energy-transitions
IEA . (2021). Net zero by 2050 – analysis. Available at: https://www.iea.org/reports/net-zero-by-2050
IEA (2023a). Bioenergy with carbon capture and storage – analysis. Available at: https://www.iea.org/reports/bioenergy-with-carbon-capture-and-storage
IEA . (2023b). Direct air capture – analysis. Available at: https://www.iea.org/reports/direct-air-capture.
IEAGHG . (2021). Global Assessment of Direct Air Capture Costs. International Energy Agency Greenhouse Gas R&D Programme. IEAGHG technical report 2021-05. Available at: https://documents.ieaghg.org/index.php/s/A8Qau09NMQQYgVL
IPCC (2018). Global warming of 1.5°C: IPCC special report on impacts of global warming of 1.5°C above pre-industrial levels in context of strengthening response to climate change, sustainable development, and efforts to eradicate poverty. 1st Edn. Cambridge: Cambridge University Press.
IPCC . (2023). Summary for Policymakers. In Climate Change 2021 – The Physical Science Basis: Working Group I Contribution to the Sixth Assessment Report of the Intergovernmental Panel on Climate Change. eds. V. Masson-Delmotte, P. Zhai, A. Pirani, S. L. Connors, C. Péan, and S. Berger, et al. (Cambridge, United Kingdom and New York, NY, USA: Cambridge University Press), pp. 3–32.
Ishimoto, Y., Sugiyama, M., Kato, E., Moriyama, R., Tsuzuki, K., and Kurosawa, A. (2017). Putting costs of direct air capture in context. SSRN Electron. J. doi: 10.2139/ssrn.2982422
Izikowitz, D., Li, J., Wang, E., Zheng, B., and Zhang, Y. W. (2023). Assessing capacity to deploy direct air capture technology at the country level–an expert and information entropy comparative analysis. Environ. Res. Commun. 5:045003. doi: 10.1088/2515-7620/acc834
Keith, D. W., Holmes, G., Angelo, D. S., and Heidel, K. (2018). A process for capturing CO2 from the atmosphere. Joule 2, 1573–1594. doi: 10.1016/j.joule.2018.05.006
Kemper, J. (2015). Biomass and carbon dioxide capture and storage: a review. Int. J. Greenhouse Gas Control 40, 401–430. doi: 10.1016/j.ijggc.2015.06.012
Lackner, K. S., and Azarabadi, H. (2021). Buying down the cost of direct air capture. Ind. Eng. Chem. Res. 60, 8196–8208. doi: 10.1021/acs.iecr.0c04839
Lackner, K. S., Brennan, S., Matter, J. M., Park, A. H. A., Wright, A., and Van Der Zwaan, B. (2012). The urgency of the development of CO2 capture from ambient air. Proc. Natl. Acad. Sci. 109, 13156–13162. doi: 10.1073/pnas.1108765109
Machado, P., Hawkes, A., and Ribeiro, C. (2022). What is the future potential of CCS in Brazil? An expert elicitation study on the role of CCS in the country. Int. J. Greenhouse Gas Control 112:103503,
McQueen, N., Gomes, K. V., McCormick, C., Blumanthal, K., Pisciotta, M., and Wilcox, J. (2021). A review of direct air capture (DAC): scaling up commercial technologies and innovating for the future. Prog. Energy 3:032001. doi: 10.1088/2516-1083/abf1ce
McQueen, N., Kelemen, P., Dipple, G., Renforth, P., and Wilcox, J. (2020a). Ambient weathering of magnesium oxide for CO2 removal from air. Nat. Commun. 11, 1–10. doi: 10.1038/s41467-020-16510-3
McQueen, N., Psarras, P., Pilorgé, H., Liguori, S., He, J., Yuan, M., et al. (2020b). Cost analysis of direct air capture and sequestration coupled to low-carbon thermal energy in the United States. Environ. Sci. Technol. 54, 7542–7551. doi: 10.1021/ACS.EST.0C00476
Minx, J. C., Lamb, W. F., Callaghan, M. W., Fuss, S., Hilaire, J., Creutzig, F., et al. (2018). Negative emissions—part 1: research landscape and synthesis. Environ. Res. Lett. 13:063001. doi: 10.1088/1748-9326/aabf9b
Morgan, M. G. (2014). Use (and abuse) of expert elicitation in support of decision making for public policy. Proc. Natl. Acad. Sci. 111, 7176–7184. doi: 10.1073/pnas.1319946111
NASEM (2019). Negative emissions technologies and reliable sequestration: A research agenda. Washington, DC: The National Academies Press.
Ozkan, M., Nayak, S. P., Ruiz, A. D., and Jiang, W. (2022). Current status and pillars of direct air capture technologies. iScience 25:103990. doi: 10.1016/j.isci.2022.103990
Perdana, S., Xexakis, G., Koasidis, K., Vielle, M., Nikas, A., Doukas, H., et al. (2023). Expert perceptions of game-changing innovations towards net zero. Energ. Strat. Rev. 45:101022. doi: 10.1016/j.esr.2022.101022
Peters, G. P., and Geden, O. (2017). Catalysing a political shift from low to negative carbon. Nat. Clim. Chang. 7, 619–621. doi: 10.1038/nclimate3369
Pour, N., Webley, P. A., and Cook, P. J. (2018). Potential for using municipal solid waste as a resource for bioenergy with carbon capture and storage (BECCS). Int. J. Greenhouse Gas Control 68, 1–15. doi: 10.1016/j.ijggc.2017.11.007
Pozo, C., Galán-Martín, Á., Reiner, D. M., Mac Dowell, N., and Guillén-Gosálbez, G. (2020). Equity in allocating carbon dioxide removal quotas. Nat. Clim. Chang. 10, 640–646. doi: 10.1038/s41558-020-0802-4
Rai, V. (2013). Expert elicitation methods for studying technological change under uncertainty. Environ. Res. Lett. 8:041003. doi: 10.1088/1748-9326/8/4/041003
Realmonte, G., Drouet, L., Gambhir, A., Glynn, J., Hawkes, A., Köberle, A. C., et al. (2019). An inter-model assessment of the role of direct air capture in deep mitigation pathways. Nat. Commun. 10:3277. doi: 10.1038/s41467-019-10842-5
Rubin, E., Davison, J., and Herzog, H. (2015). The cost of CO2 capture and storage. Int. J. Greenhouse Gas Control 40, 378–400. doi: 10.1016/j.ijggc.2015.05.018
Shayegh, S., Bosetti, V., and Tavoni, M. (2021). Future prospects of direct air capture technologies: insights from an expert elicitation survey. Front. Clim. 3:46. doi: 10.3389/fclim.2021.630893
Smith, S. M., Geden, O., Nemet, G. F., Gidden, M., Lamb, W. F., Powis, C., et al. (2023). The state of carbon dioxide removal, 1st ed. doi: 10.17605/OSF.IO/W3B4Z
Socolow, R., Desmond, M., Aines, R., Blackstock, J., Bolland, O., Kaarsberg, T., et al. (2011). Direct air capture of CO2 with chemicals: A technology assessment for the APS panel on public affairs : American Physical Society.
U.S. Department of Energy (2022). Carbon negative shot – an introduction. Available at: https://www.energy.gov/sites/default/files/2022-07/Carbon-Negative-Shot-FactSheet_7.5.22%20Updates.pdf
Vaughan, N. E., and Gough, C. (2016). Expert assessment concludes negative emissions scenarios may not deliver. Environ. Res. Lett. 11:095003. doi: 10.1088/1748-9326/11/9/095003
Wilcox, J., Psarras, P. C., and Liguori, S. (2017). Assessment of reasonable opportunities for direct air capture. Environ. Res. Lett. 12:065001. doi: 10.1088/1748-9326/aa6de5
Young, J., McQueen, N., Charalambous, C., Foteinis, S., Hawrot, O., Ojeda, M., et al. (2023). The cost of direct air capture and storage can be reduced via strategic deployment but is unlikely to fall below stated cost targets. One Earth 6, 899–917. doi: 10.1016/j.oneear.2023.06.004
Keywords: learning curves, direct air capture, BECCS, negative emissions, model uncertainties, expert elicitations
Citation: Abegg M, Clulow Z, Nava L and Reiner DM (2024) Expert insights into future trajectories: assessing cost reductions and scalability of carbon dioxide removal technologies. Front. Clim. 6:1331901. doi: 10.3389/fclim.2024.1331901
Edited by:
Anders Hansson, Linköping University, SwedenReviewed by:
Emily Cox, University of Oxford, United KingdomCopyright © 2024 Abegg, Clulow, Nava and Reiner. This is an open-access article distributed under the terms of the Creative Commons Attribution License (CC BY). The use, distribution or reproduction in other forums is permitted, provided the original author(s) and the copyright owner(s) are credited and that the original publication in this journal is cited, in accordance with accepted academic practice. No use, distribution or reproduction is permitted which does not comply with these terms.
*Correspondence: David M. Reiner, ZC5yZWluZXJAamJzLmNhbS5hYy51aw==
Disclaimer: All claims expressed in this article are solely those of the authors and do not necessarily represent those of their affiliated organizations, or those of the publisher, the editors and the reviewers. Any product that may be evaluated in this article or claim that may be made by its manufacturer is not guaranteed or endorsed by the publisher.
Research integrity at Frontiers
Learn more about the work of our research integrity team to safeguard the quality of each article we publish.