 Patrick Bodilly Kane
 Nastaran Tebyanian
 Daniel Gilles
 Brett McMann1
 Jordan R. Fischbach
94% of researchers rate our articles as excellent or good
Learn more about the work of our research integrity team to safeguard the quality of each article we publish.
Find out more
ORIGINAL RESEARCH article
Front. Clim., 12 June 2024
Sec. Climate and Decision Making
Volume 6 - 2024 | https://doi.org/10.3389/fclim.2024.1303951
This article is part of the Research TopicClimate Strategies and Deep UncertaintyView all 11 articles
Introduction: Future urban stormwater flood risk is determined by the confluence of both climate-driven changes in precipitation patterns and the effectiveness of flood mitigation systems, such as urban drainage and pump systems. This is especially true in coastal cities protected by levee systems like New Orleans, where even present-day rainfall would be enough to cause serious flooding in the absence of extensive stormwater drainage and pumping. However, while the uncertainties associated with climate change have been well studied, uncertainties in infrastructure performance and operation have received less attention.
Methods: We investigated how these interrelated sets of uncertainties drive flood risk in New Orleans using a Robust Decision Making (RDM) approach. RDM is a framework for Decision Making Under Deep Uncertainty (DMDU) that leverages simulation models to facilitate exploration across many possible futures and the identification of decision-relevant scenarios. For our work, we leveraged a detailed Storm Water Management Model (SWMM) representation of the New Orleans urban stormwater management system to examine flood depths across the city when faced with different levels of future precipitation, sea-level rise, drainage pipe obstruction, and pumping system failure. We also estimated direct flood damage for each neighborhood in the city for this scenario ensemble. These damage estimates were then subjected to vulnerability analysis using scenario discovery—a technique designed to determine which combinations of uncertainties are most stressful to the system in terms of an outcome of interest (excess flood damage).
Results: Our results suggest that key drivers of vulnerability depend on geographic scale. Specifically, we find that possible climate-driven precipitation increases are the most important determinant of vulnerability at the citywide level. However, for some individual neighborhoods, infrastructure operation challenges under present day conditions are a more significant driver of vulnerability than possible climate-driven precipitation increases.
Devising resilient urban drainage policies requires understanding stormwater system performance both now and in the future. Uncertain changes in precipitation patterns driven by climate change make accurate estimates of future performance challenging. However, many cities are challenged by uncertainty in whether maintenance and upkeep has successfully preserved the capacity of stormwater infrastructure, even under present day conditions. Determining how these uncertainties affect system performance is a vital task in guiding future investments aimed at reducing stormwater flooding. The effect of uncertain factors such as land use change and climate change on urban flooding frequency and damage as well as the uncertainty inherent to complex models of urban drainage systems have been extensively studied (Jung et al., 2011; Miller and Hutchins, 2017; Fischbach et al., 2020; Liu et al., 2020; Xu et al., 2020). However, few studies have investigated the effect of uncertainty in infrastructure operation and characteristics, such as the service lifetime of infrastructure (Sharma et al., 2021). This is particularly important because citywide factors (e.g., climate change) can interact with more geographically specific infrastructure problems causing the relative effects of different factors to vary on a spatial level.
These interlocking challenges pose a threat to the future livability of many cities including New Orleans. As a coastal city, New Orleans has been well studied in the domain of coastal and storm surge flooding (Interagency Performance Evaluation Task Force (IPET), 2006; Fischbach, 2010; Johnson et al., 2015; Wong and Keller, 2017), but its frequent rainfall flooding has received less attention in the academic literature. In addition to the challenges presented by the city’s climate, the physical and political history of the city has left its stormwater system without unified municipal control. Parts of the system are managed by the New Orleans Sewerage and Water Board (SWBNO), while others are managed by New Orleans’ Department of Public Works (DPW). A widely implemented Level of Service for a stormwater management system is the capacity to effectively clear the “10-year” rainfall event (ABS Group, 2018); however, prior studies found no evidence of any such Level of Service throughout the city (ABS Group, 2018). In particular, some parts of the city are unable to effectively clear the 2-year, 24-h rainfall event even before accounting for the effects of climate change (Ardurra, 2019).
To assess the contributions of climate and infrastructure uncertainties to the city of New Orleans’ flood risk, we adopted a Robust Decision Making (RDM) analysis framework (Lempert et al., 2006, 2013; Lempert, 2019). RDM is a model-based approach to scenario analysis which draws on many simulations of potential scenarios to determine how uncertain variables connect to scenarios in which the system is under high stress. Unlike other model-based approaches, RDM does not try to make a single most-likely prediction about what the future will hold but instead seeks to explore a broad range of plausible future conditions to help to answer questions about which uncertainties matter most to system performance. Drawing on a model adopted by the firm Ardurra and built in the Environmental Protection Agency’s (EPA) Stormwater Management Model (SWMM) software to support SWBNO planning and analysis (Meselhe et al., 2017; Ardurra, 2019), we ran several hundred rainfall simulations under a variety of different infrastructure and climate conditions to calculate flood depths across the city. These depths were translated into expected annual damage to structures which were then analyzed. The questions addressed in our analysis are: (1) How are flood depths and damage driven by both climate and infrastructure factors in the city of New Orleans? (2) What are the key drivers of system stress at the neighborhood and city level and how do they differ?
In what follows we provide a brief history of New Orleans’ stormwater system and an overview of RDM before discussing the specific methods used in this study.
The components of New Orleans’ internal drainage system can be divided into three categories: (1) the primary system of intercepting canals, culverts, and pumping stations, (2) the secondary systems of pipes less than 36 inches in diameter that collect local runoff and convey it downstream, and (3) the tertiary drainage system consisting of small block-by-block collections of catch basins and conveyance pipes. The SWBNO is responsible for operating and maintaining the primary system, while New Orleans DPW is responsible for the secondary and tertiary systems (CDM Smith, 2010; Black & Veach, 2016; Meselhe et al., 2017; ABS Group, 2018).
The DPW system is comprised of approximately 1,287 miles of drainage lines between 8 and 36 inches in diameter and approximately 117,770 manholes, catch basins, and inlets. Over half of the pipe system is less than 18 inches in diameter (CDM Smith, 2010). The SWBNO system consists of more than 90 miles of open drainage channels and 90 miles of closed conduit drainage lines greater than 36 inches in diameter. It also consists of 24 major and 12 minor pumping stations comprised of 120 pumps with a combined capacity of more than 50,000 cubic feet per second.
Many of SWBNO’s pumps utilize self-generated antiquated 25-cycle power delivered on a closed SWBNO owner-operated grid whereas the remainder of its system utilizes modern 60-cycle power from the municipal grid. Some 25-cycle pumps are fitted with frequency changing equipment to also utilize 60-cycle power (Bureau of Governmental Research, 2017). The system is split geographically onto the Mississippi River’s east and west banks. Approximately 90% of the service area is on the east bank and is further divided into three major polders divided by the Industrial and Intracoastal canals, respectively. A depiction of the east bank drainage system is shown in Figure 1 (SWBNO system) and Figure 2 (DPW system).
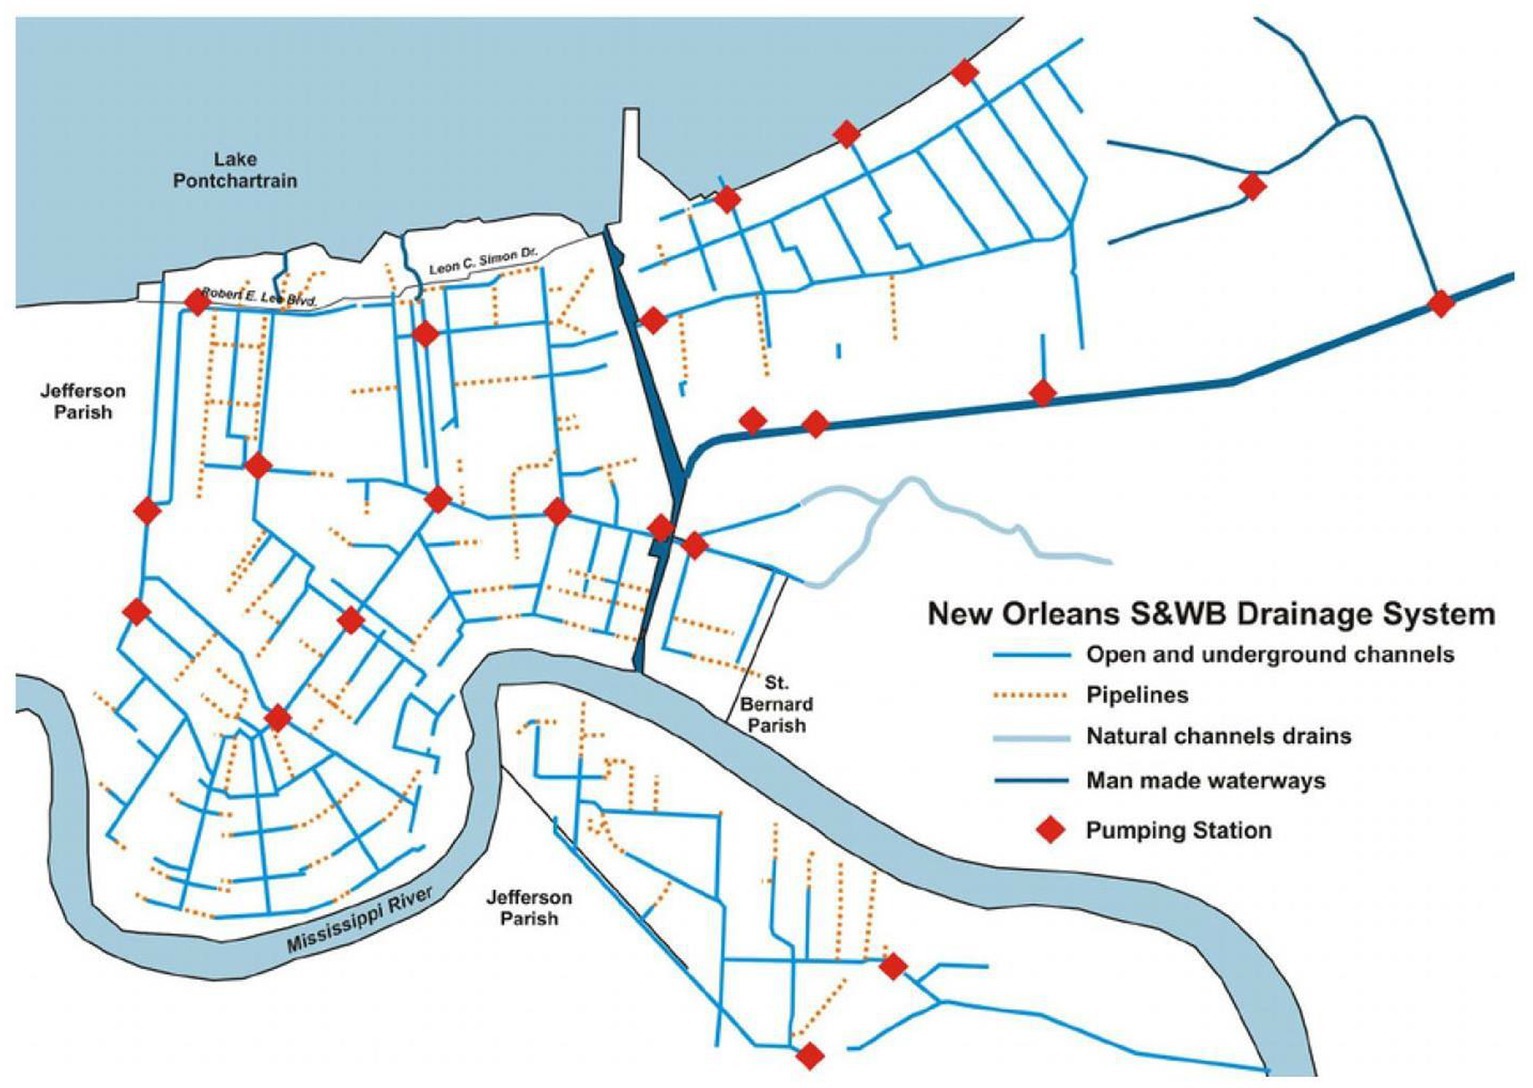
Figure 1. Sewerage and Water Board of New Orleans Drainage Infrastructure (Source: Boogaard et al., 2023).
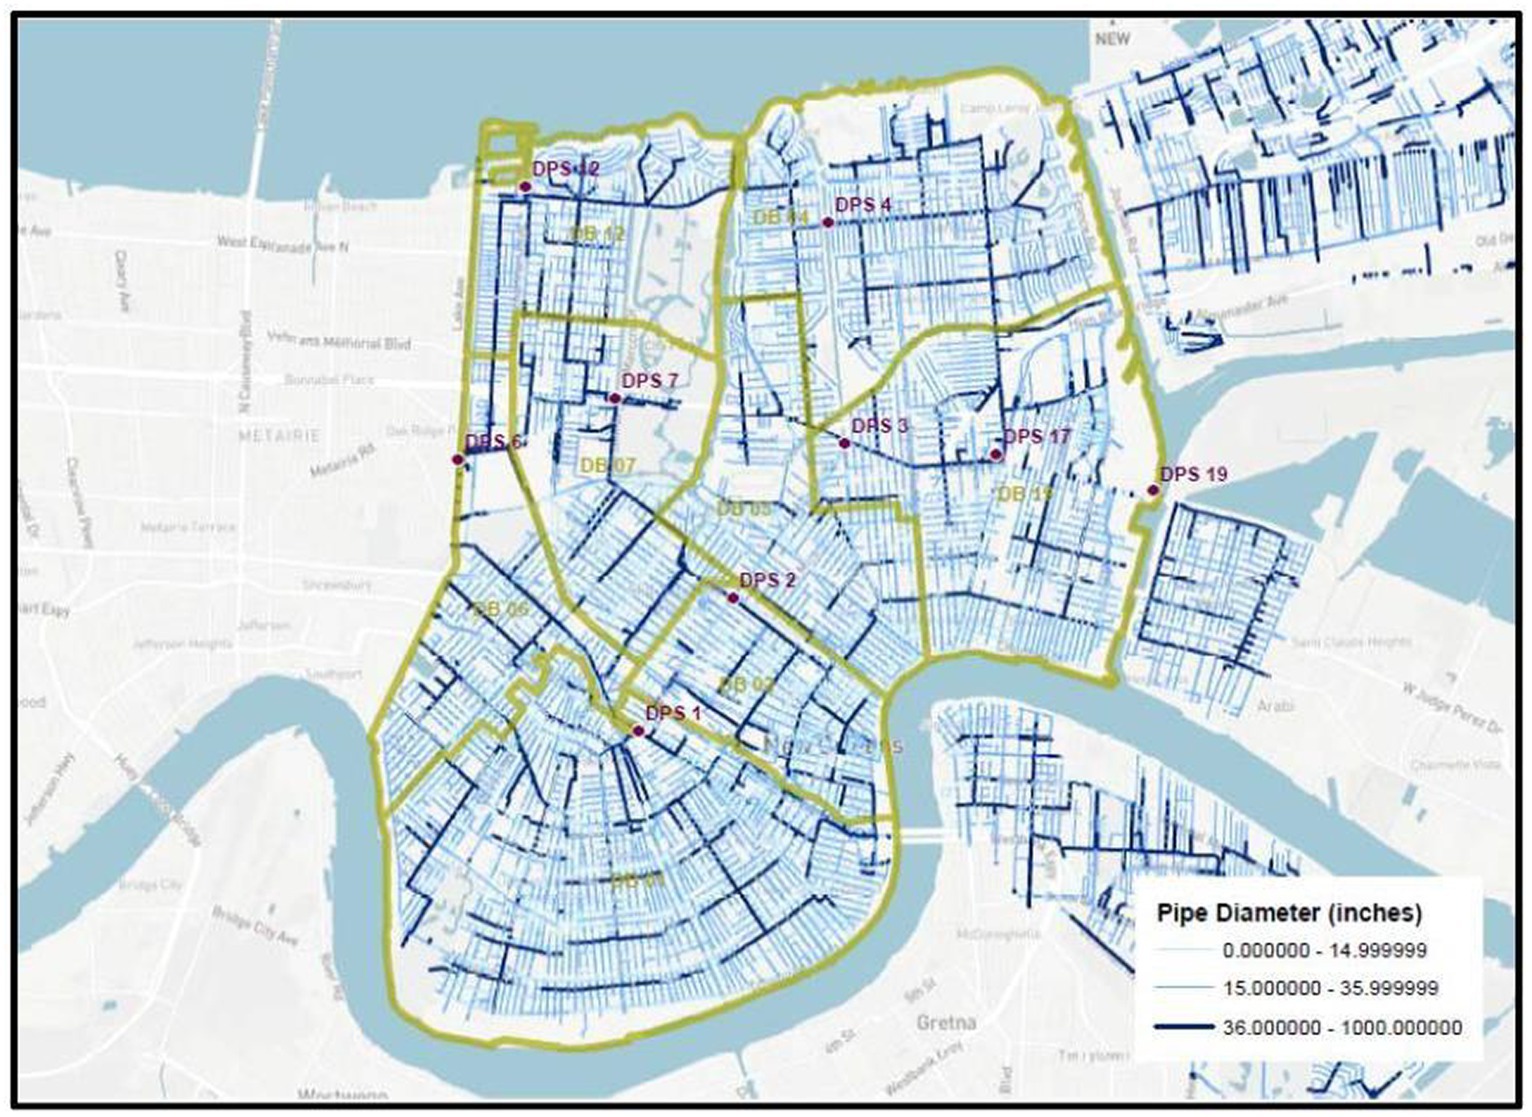
Figure 2. New Orleans Department of Public Works Drainage Infrastructure (adapted from ABS Group, 2018).
Severe rainfall events have inundated large areas of the city in the last several decades (Ardurra, 2019). These floods can be attributed to both tropical and non-tropical precipitation events including: 8 May 1995; 10–14 September 1998; 5–7 June 2001; 24–26 September 2002; 29 August 2005; 11 September 2008; 12 December 2009; 22 July 2017; 5–8 August 2017; and 10 July 2019. To address these rainfall flooding challenges, SWBNO has invested in modern technology to characterize, assess, and create digital modeling capabilities for its system.
Building on this analysis and data collection effort, SWBNO and its consultants have pieced together multiple disparate numeric modeling tools over the past decade and created a single integrated stormwater management model built on the EPA SWMM platform. This integrated set of models was calibrated to the events of 8 May 1995; 22 July 2017, and 5–8 August 2017; and is additionally capable of simulating the 2-, 5-, 10-, 25-, 50-, and 100-year annual exceedance probability (AEP) rainfall events (Meselhe et al., 2017; Ardurra, 2019). The modeling effort was built upon concurrent and prior efforts to create a Geographic Information System (GIS) model of the entire conveyance network in the city, a gauging system of intake and discharge levels at pump stations, as well as a field-sampling campaign which took in-situ measurements of approximately 11% of the city’s conveyance and intake systems (Meselhe et al., 2017; Ardurra, 2019).
While these prior modeling efforts provide a detailed foundation for understanding rainfall flooding in New Orleans, several uncertain factors can affect the performance of the city’s stormwater management now and in the future. Climate change can lead to an increase in the intensity, duration, and frequency of extreme rainfall events in New Orleans (Liu et al., 2012; USGCRP, 2017; Kunkel, 2020) which can aggravate current rainfall flooding challenges in the city. For example, while the current estimated intensity of the 10-year, 24-h rainfall event is 8.3 inches of rain over 24 h (Perica et al., 2013), climate change could increase this to 9 or 10 inches in 2045 or 2075, respectively (Kunkel, 2020). Previous modeling efforts have used historical rainfall data which has been found to no longer be adequate for planning stormwater management in other cities given a changing climate (Torres, 2018). In addition to uncertain future rainfall patterns, sea-level rise is a potentially relevant uncertain factor as the pump system relies on lifting and conveying stormwater to the north of the city into Lake Pontchartrain, an estuary connected to the Gulf of Mexico.
Additionally, all prior modeling efforts assume that the combined SWBNO and DWP systems operate with 100% efficiency, meaning that there are no pump failures due to power loss, mechanical issue, or operator error, as well as no system impairments such as blocked pipes or catch basins (Ardurra, 2019). In contrast to these assumptions, however, pump outages are a regular occurrence during heavy rainfall events. For example, on 10 June 2022, three pumps lost power, causing flooding in the Gentilly neighborhood. In addition, based on a field verification and inspection of 1% of the city’s collection and conveyance system (ABS Group, 2018), it was estimated that the system suffered from a 14–27% capacity reduction across different infrastructure types (Table 1).
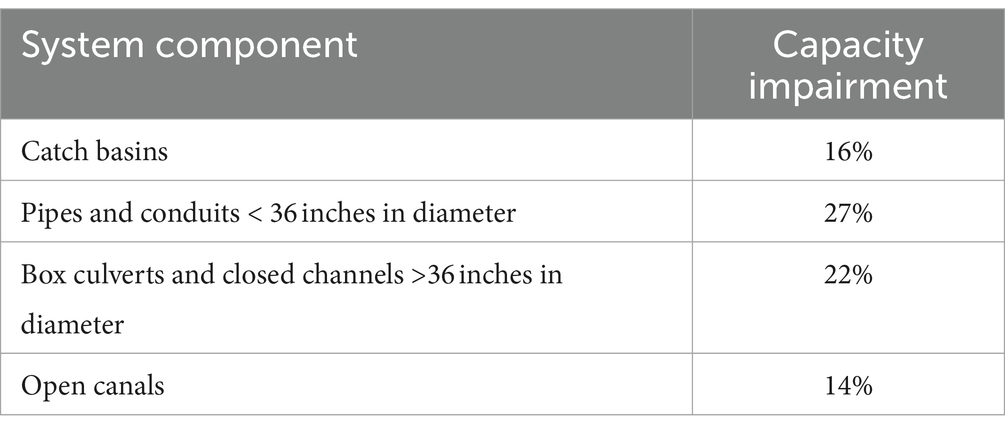
Table 1. Capacity impairment by infrastructure type in New Orleans (ABS Group, 2018).
All of the previously discussed uncertainties are best described as deep uncertainties (Lempert et al., 2003). While some uncertainties can be characterized with a probability distribution based on historical observations or other sources, deep uncertainties cannot be represented with a single knowable probability distribution because they may be determined by highly complex or poorly understood mechanisms. These mechanisms may pertain to far future events for which there is no historical record to draw on or may be contingent on decisions which have yet to be made.
Methods that support DMDU, such as RDM, minimize attempts to apply probability to deep uncertainties (Lempert et al., 2013). Instead, RDM uses plausible bounds on uncertainties to develop large sets of scenarios which are then run through a model to gain insight about which uncertainties matter most. In particular, one pillar of RDM is vulnerability analysis “in which Scenario Discovery (SD) algorithms and techniques help identify the uncertain conditions that cause the strategies to perform unacceptably. Often in collaboration with stakeholders and decisionmakers, these conditions are refined to describe decision-relevant scenarios” (Groves et al., 2019). More specifically, we investigate scenarios to determine which uncertain factors can lead to failure to achieve the goals of SWBNO and the City of New Orleans with respect to managing and reducing flood risk.
We begin with a review of the RDM framework and break down the elements that make up our experimental design. We then provide a brief review of the analytic methods used.
We use an RDM framework to identify key drivers of vulnerability. A common approach to problem framing in RDM is the creation of an XLRM matrix which defines the problem relevant uncertainties (X), policy levers (L), relationships (R), and outcome metrics (M) (see Table 2). The RDM framework samples over the list of uncertainties and policy levers and runs them through the relevant set of relationships in order to arrive at estimates of the outcome metrics of interest. This process is repeated many times to develop a sample of cases which are then subjected to a vulnerability analysis to determine which uncertain states lead to chosen policies succeeding or failing. Vulnerability analysis is most typically used as a means for probing different strategies in support of a decision. Here we opt to use the method in a more exploratory manner to provide insight into the features of flooding across the city under current management conditions.
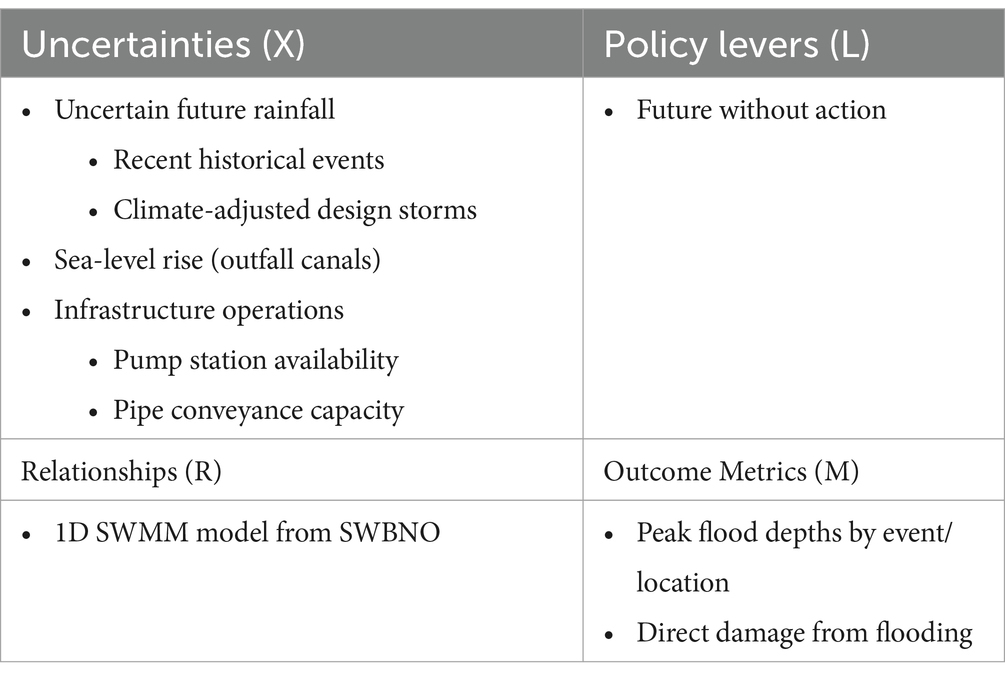
Table 2. Study XLRM matrix, containing a list of relevant uncertainties (X), policy levers (L), relationships (R) and outcome metrics (M) used in the study.
Uncertainties represent the input variables to a model that are unknown and uncontrolled by relevant decision makers. As discussed above, we considered rainfall intensity and sea-level rise as climate uncertainty factors, and pipe obstruction and pump failure as infrastructure operation uncertainty factors.
Precipitation values are based on NOAA Atlas 14 data for the New Orleans region (Perica et al., 2013). We included both 1- and 24-h precipitation totals for six recurrence intervals (2-year, 5-year, 10-year, 25-year, 50-year, and 100-year). These values can be found in Table 3. The Atlas 14 data was developed in 2013 and serves as our estimate of present conditions. To account for the effect of climate change, we scaled up the values for each AEP using delta-change factors—a percentage adjustment for each AEP adopted from Kunkel (2020).
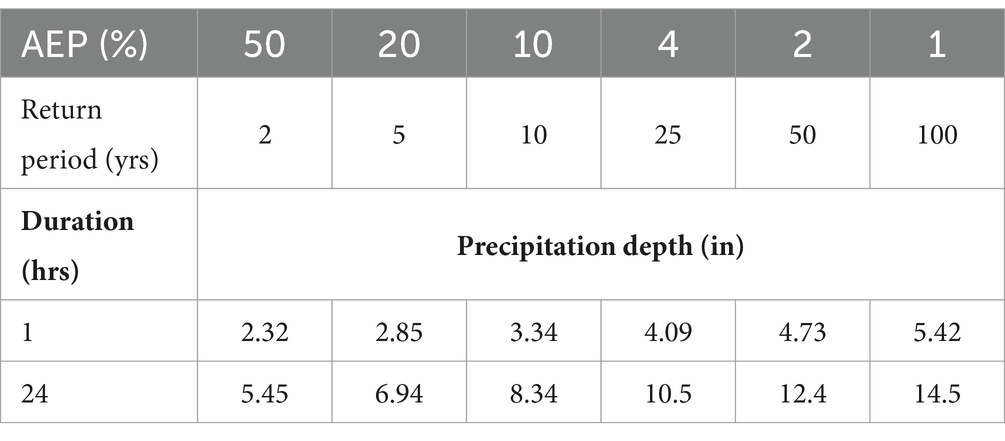
Table 3. NOAA Atlas 14 point precipitation frequency estimates for 1- and 24-h durations (Perica et al., 2013).
We selected delta-change factor projections from two future time periods: 2045 and 2075. For the 2075 values, we used the value from two different climate projections: Representative Concentration Pathways (RCP) 4.5 and 8.5. These correspond to intermediate and worst-case climate projections. For 2045, delta-change factors for RCP 4.5 and 8.5 did not meaningfully differ, so the RCP 4.5 values were used. The selected delta-change factors and resulting precipitation amounts can be found in Table 4. These three sets of delta-change factors plus the present conditions result in a total of four rainfall levels considered.
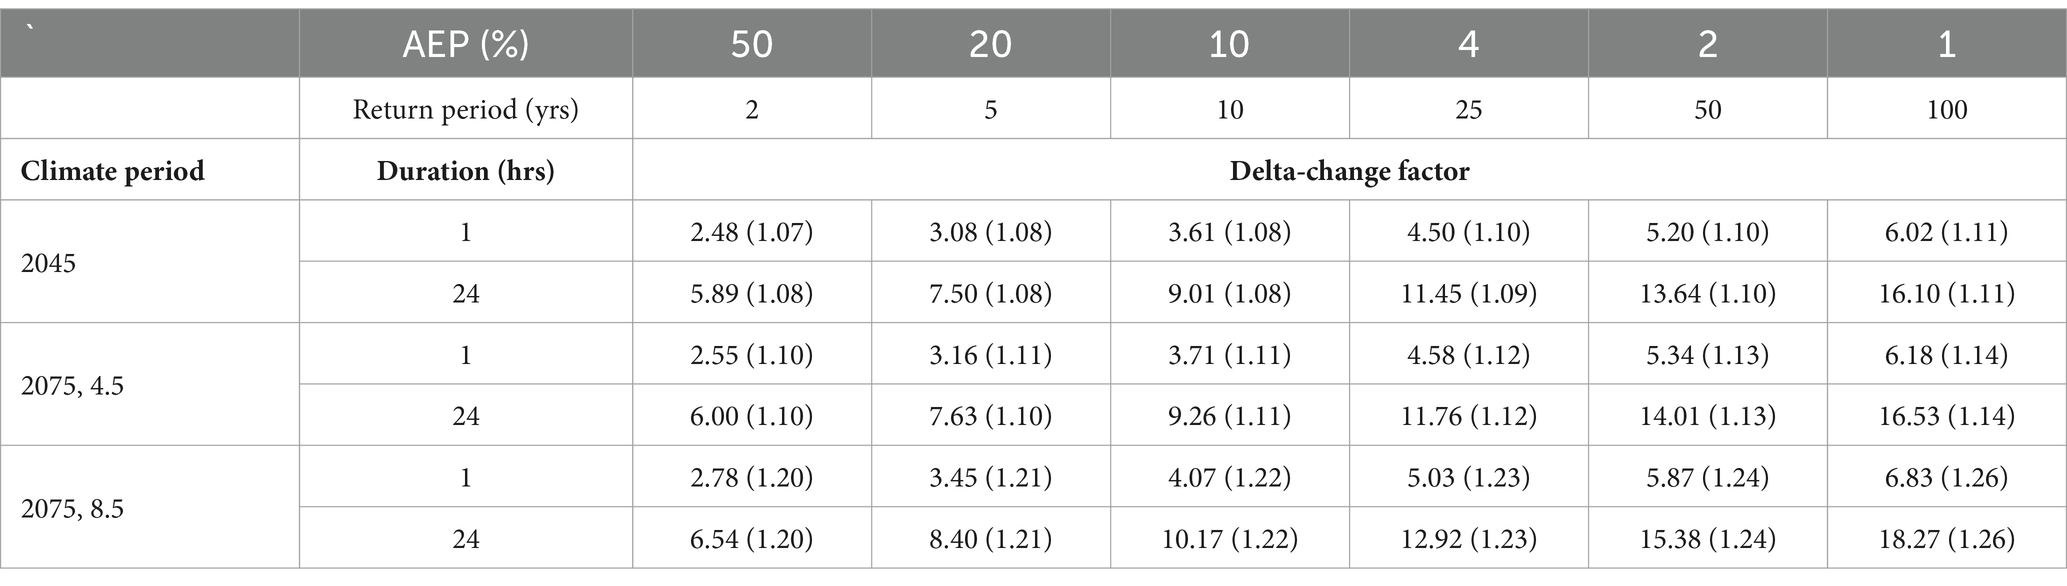
Table 4. Rainfall amounts with delta-change factors in parentheses for 2045, 2075 RCP 4.5, and 2075 RCP 8.5 for 1- and 24-h durations (Kunkel, 2020).
Sea level rise scenario projections were drawn from Louisiana’s 2023 Coastal Master Plan (Pahl et al., 2023) with four values being selected: 0 meters corresponding to present conditions; 0.27 m corresponding to 2045 conditions; and 0.78 and 1.03 meters corresponding to 2075 low and high sea-level rise scenarios, respectively. Low and high sea-level rise scenarios for 2045 did not meaningfully differ, so only the low scenario value was used.
The rainfall intensity and sea-level rise uncertainties were combined into an overall climate uncertainty with six levels: (a) present conditions; (b) 2045 sea-level rise and 4.5 RCP rainfall; (c) 2075 low sea-level rise and RCP 4.5 rainfall; (d) 2075 low sea-level rise and RCP 8.5 rainfall; (e) 2075 high sea-level rise and RCP 4.5 rainfall; and (f) 2075 high sea-level rise and RCP 8.5 rainfall. The factorial combination of 2075 RCP 4.5 and 8.5 rainfall data with 2075 low and high sea-level rise scenario data was done to reflect uncertainty about how rainfall patterns and sea-level rise might covary.
We included two uncertain factors that represent infrastructure operation uncertainty in New Orleans: pipe obstruction and pump failures. Pipe obstruction (representing debris potentially clogging pipes) was operationalized in the SWMM model by scaling up the Manning’s roughness coefficient for the concrete pipes in the SWMM model from the default value of 0.013. Five levels were selected for this variable: 0%, 25%, 50,% 75%, and 100% increase over default. These values correspond to a 0%, 20%, 33%, 43%, and 50% reduction in flow through every pipe in the system. Pump failures were operationalized as complete or partial shutdown of particular combinations of pump stations in the model. Specifically, we considered a condition in which every pump station was operating at 100% capacity, one in which every pump station was operating at 50% capacity, and one in which all pumps were completely offline. We also included two additional conditions: one in which Drainage Pump Station (DPS) 1 and DPS 2 were at 50% capacity while all other pumps were fully operational; and one in which DPS 1 and DPS 2 were completely offline while all other pumps were fully operational. The choice to single out DPS 1 and DPS 2 stems from these pump stations’ central role in the system and a preliminary analysis indicating that they were the primary pump stations creating interactive effects with other pump stations (e.g., DPS 1 and DPS 3 being down has a different effect than just DPS 1 being down).
Policy levers represent the input variables to a modeled relationship that are under the direct control of the decision maker. For this study we considered only a single policy, a future without action, indicating no changes in the overall design of stormwater management system in New Orleans. Future research will consider system improvements and other stormwater investments using this same modeling and uncertainty framework. The decision to explore the effect of uncertainties within a single future without action scenario such as this rather than across multiple competing solutions is a somewhat unconventional use for RDM, but the toolkit provides useful techniques for discovering relationships between uncertainties and outcomes in this context relevant to our research questions.
The primary relationships of interest in our study are encapsulated in the previously described Ardurra SWMM model (Ardurra, 2019) which we used to simulate the function of the New Orleans’s urban drainage system under our selected uncertainties. The model is a dynamic rainfall-runoff model capable of routing runoff through a system of pipes, channels, storage nodes, and pumps. The model utilizes one-dimensional links and nodes to describe New Orleans’ drainage system and consists of more than 12,000 subcatchments, 21,000 junctions, and 54,000 conduits. Model files are text-based, allowing for easy modification of input variables. The large number of input variable combinations required running simulations in a high-performance computing environment. As a result, the final model is a composite of several discrete basin-wide models to better facilitate high-performance computing.
Outcome metrics represent the outputs of a modeled relationship that decision makers care about and provide the basis of classifying scenarios as stressing to the system during vulnerability analysis. Our vulnerability analysis focuses on the flood damage outcome metric, but in order to calculate this metric we also extracted flood depths directly from the SWMM model as an intermediate outcome metric.
To determine flood depths, we extracted the maximum value of the hydraulic grade line elevation for each of the nodes in the model. We then subtracted the corresponding ground surface elevation for every node to determine depth. Negative values were then set to zero.
Direct structure damage was calculated using the standard HAZUS methodology for direct building flood damage (Federal Emergency Management Agency, 2020). This approach compares the flood depth relative to a building’s first floor elevation to a specific damage function based on the class of building to determine the damage to the building and its contents as a percentage of its replacement value. Structure first floor elevations, replacement values, and building classifications were taken from the structure inventory used in the coastal risk assessment for Louisiana’s 2023 Coastal Master Plan (Fischbach et al., 2021).
First floor elevations were compared to depths at the nearest SWMM nodes. Short duration, freshwater damage functions from the US Army Corps of Engineers (USACE) New Orleans District were used for the damage calculation (for structure classes for which a USACE New Orleans District damage function did not exist, the default HAZUS damage function was used).
Because depths are being drawn from a simplified one-dimensional SWMM model and the very prevalent shallow depths are generally unable to reach above the street curb to damage buildings, flood damage was only calculated at nodes where a depth of at least 12 inches was observed. Expected annual damage (EAD) values were calculated by combining the damage within a scenario for the six AEP design storms. The recurrence interval for each storm was translated to an AEP (e.g., the 2-year precipitation value corresponds to a 50% AEP), these AEPs were then used to approximate the probability density function for flood depths which was integrated to yield an estimate of EAD (Fischbach et al., 2017, 2019). EAD values were then summarized at the neighborhood level for each scenario in the experimental design.
The four uncertainties discussed above were assembled into a full factorial experimental design comprising 150 total conditions (six climate uncertainty by five pipe obstruction by five pump state). This experimental design was applied both to individual historic storms for the purpose of validation and the six AEP design storms. Maximum flood depths were collected from each node in the SWMM model both for the historical storms and both 1- and 24-h versions of the storms. In this paper we report on flood depths for the 10 July 2019, event as it was the storm used to validate the model and the 10-year, 24-h design storm because it is the target Level of Service used for the overall model.
Vulnerability analysis was conducted using two classification algorithms (1) the Patient Rule Induction Method (PRIM) to “identify the ranges of uncertain factors most likely to cause system failure” (Friedman and Fisher, 1999); and (2) Classification and Regression Trees (CART) to extract combinations of uncertain factors that result in stressing scenarios. We also used logistic regression and feature importance analysis to provide a numerical ranking of the uncertain factors based on their ability to predict which scenarios were stressing. The dependent variable was EAD for 24-h design storms with the threshold for what constitutes a stressing scenario set at an EAD greater than 2% of total structure value for the area being analyzed. We conducted the vulnerability analysis both at the city level as well as for specific neighborhoods chosen based on their location throughout the city and known flood challenges. The full details of the analysis can be found in the Supplementary Material, while the code for the analysis can be accessed through GitHub: https://github.com/waterinstitute/new_orleans_stormwater.
We first present a summary of the flood depth and damage results at the city level and their relationship to the geography of the city and the uncertainties described above. We then provide the primary results of the vulnerability analysis.
Analysis of peak flood depths from the SWMM model for the 10 July 2019 event and the 10-year, 24-h design storm under present conditions reveal distinct patterns of flooding across the city (Figure 3). The 10 July 2019 event features relatively little flooding in the Lakeview, New Orleans East, and Algiers areas with at least 6 inches of flooding throughout the Broadmoor, Mid-City, Central Business District (CBD), and Gentilly regions. Throughout these flooded parts of the city are pockets of deeper flooding (up to 3 ft peak depth) extending from the Broadmoor neighborhood to the Desire Area. This tract of flooding roughly corresponds to the locations of DPS 1, DPS 2, DPS 3, and DPS 4.
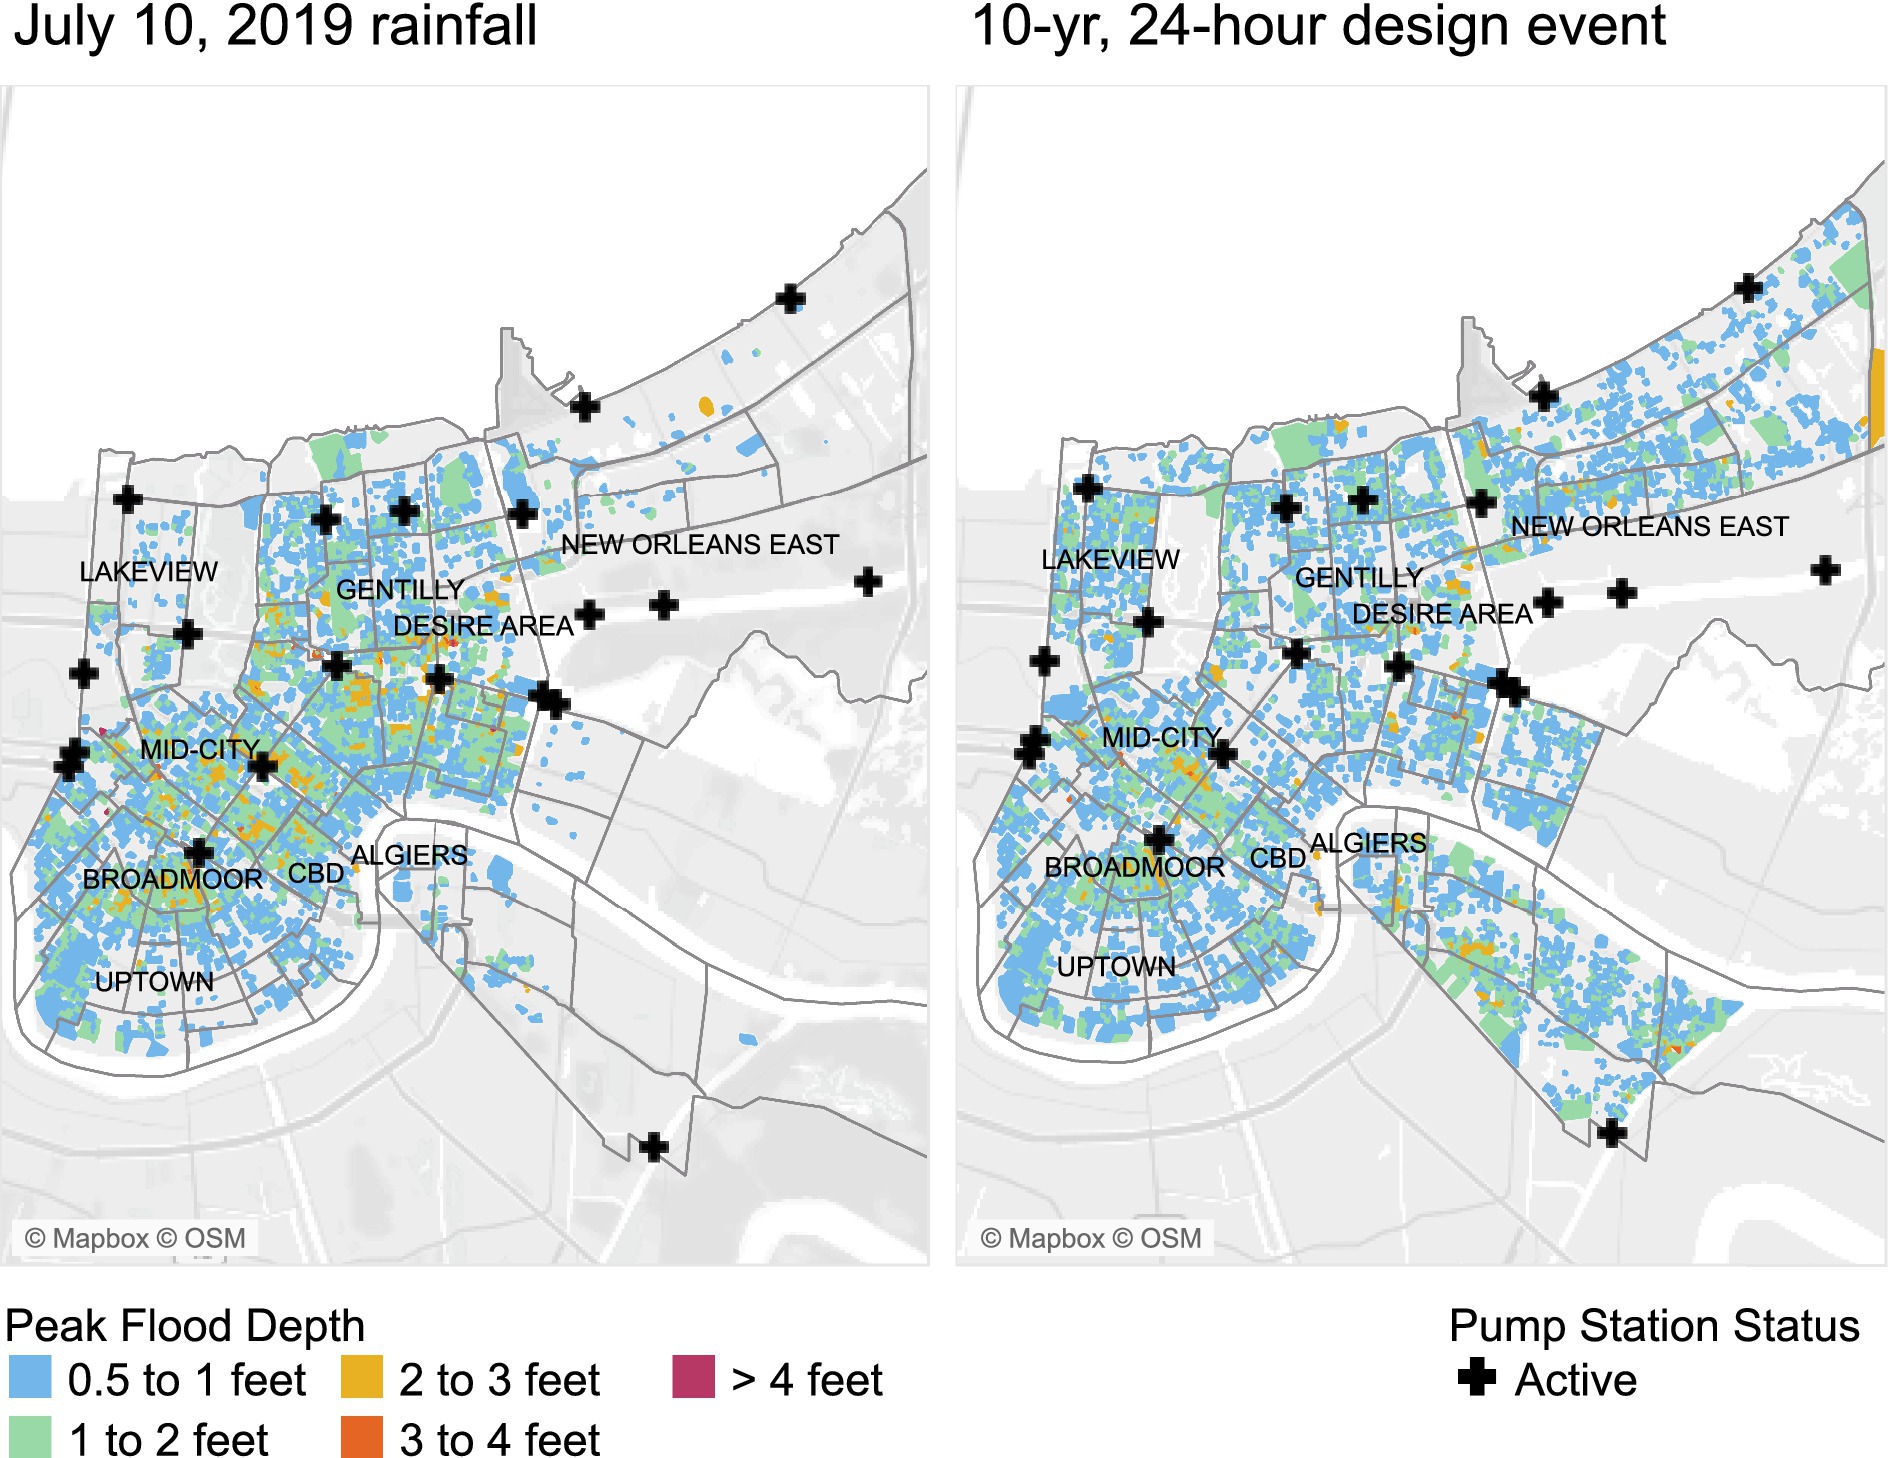
Figure 3. Map of New Orleans showing the maximum flood depth at each SWMM node for the storm that occurred on 10 July 2019 (left) and the 10-year, 24-h design storm event (right).
The 10-year, 24-h design storm differs from the historical storm in that it features uniform precipitation across the city, rather than concentrating it in a smaller area as a realistic storm might. This difference is reflected in both the greater extent of low-level flooding (now including the Lakeview, New Orleans East, and Algiers regions) and the relative scarcity of pockets of more extreme flooding. Notably, the largest pocket of more extreme flooding for the design storm is in the vicinity of the Broadmoor neighborhood which also saw extensive flooding during the 10 July 2019 historical event. This likely reflects the position of the neighborhood as low ground where water pools before being pumped toward Lake Pontchartrain by DPS 1.
Under future rainfall conditions, the pattern of peak flood depths changes significantly for both events with greater changes being seen under 2075 8.5 flood rainfall conditions compared to 2045 4.5 conditions (Figure 4). For both events, the 2045 rainfall amounts correspond to relatively uniform increases in flood depth throughout the city of fewer than 6 inches. While this may seem like a minor increase, it may be enough to put flood waters above the first-floor elevation of many structures, resulting in significantly more flood damage. The 2075 increased rainfall amounts lead to a similar increase across the city but with pockets of larger increases. For both events, these pockets seem to be concentrated in areas that were already experiencing more extensive flooding at present rainfall levels (e.g., Broadmoor). This suggests that while flood risk will grow across the city, some areas already burdened with higher flood risk will see an even greater increase in the future.
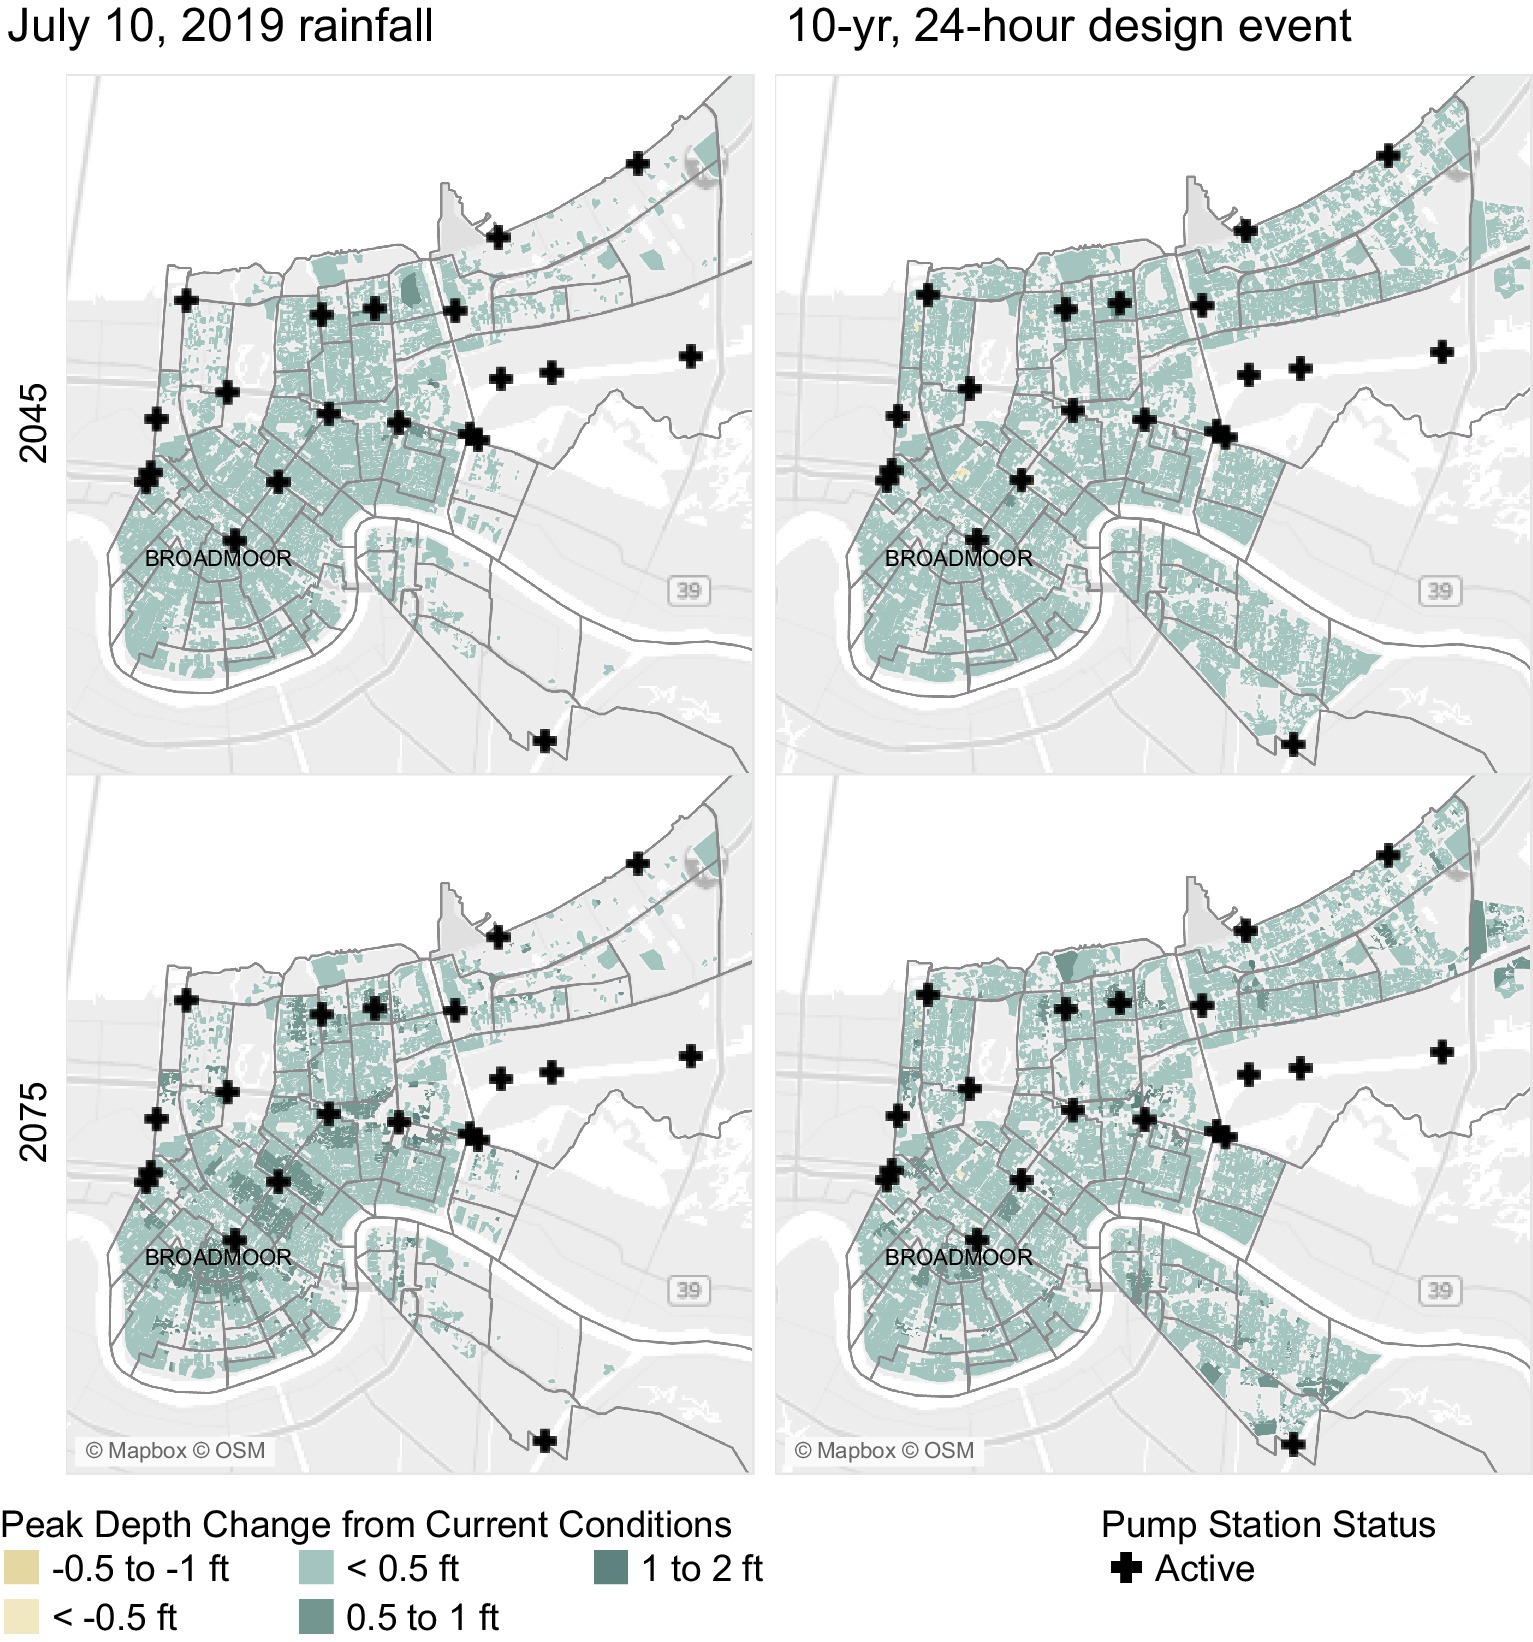
Figure 4. Change in maximum flood depths for the 10 July 2019, and 10-year, 24-h design storm events under projected 2045 and 2075 rainfall conditions.
Similarly, changing either pipe obstruction or decreasing pump capacity can cause substantial changes in flood depths for the 10-year, 24-h event (Figure 5). Increasing the amount of pipe obstruction leads to relatively minor increases (fewer than 6 inches) of flooding throughout most of the city with greater pipe obstruction leading to more areas affected. Notably, however, increasing the pipe obstruction does not affect every part of the city—some areas are unaffected, reflecting parts of the city that are less dependent on the pipe system for drainage. This includes parts of Lakeview, Gentilly, and the part of the city around Broadmoor and Central City. The latter two neighborhoods see a decrease in flooding under high pipe obstruction because water from other neighborhoods does not flow to them to be pumped out of the city. In contrast, the effect of the pumps being off appears to be more localized but also more extreme. In particular, it can lead to increases in maximum flood depths of more than 3 ft particularly in the areas around Broadmoor, Mid-City, and the Desire area. Notably, these increases in depth are more extreme in their local areas under present climate conditions than what would be anticipated under a fully operational system under projected 2075 rainfall conditions.
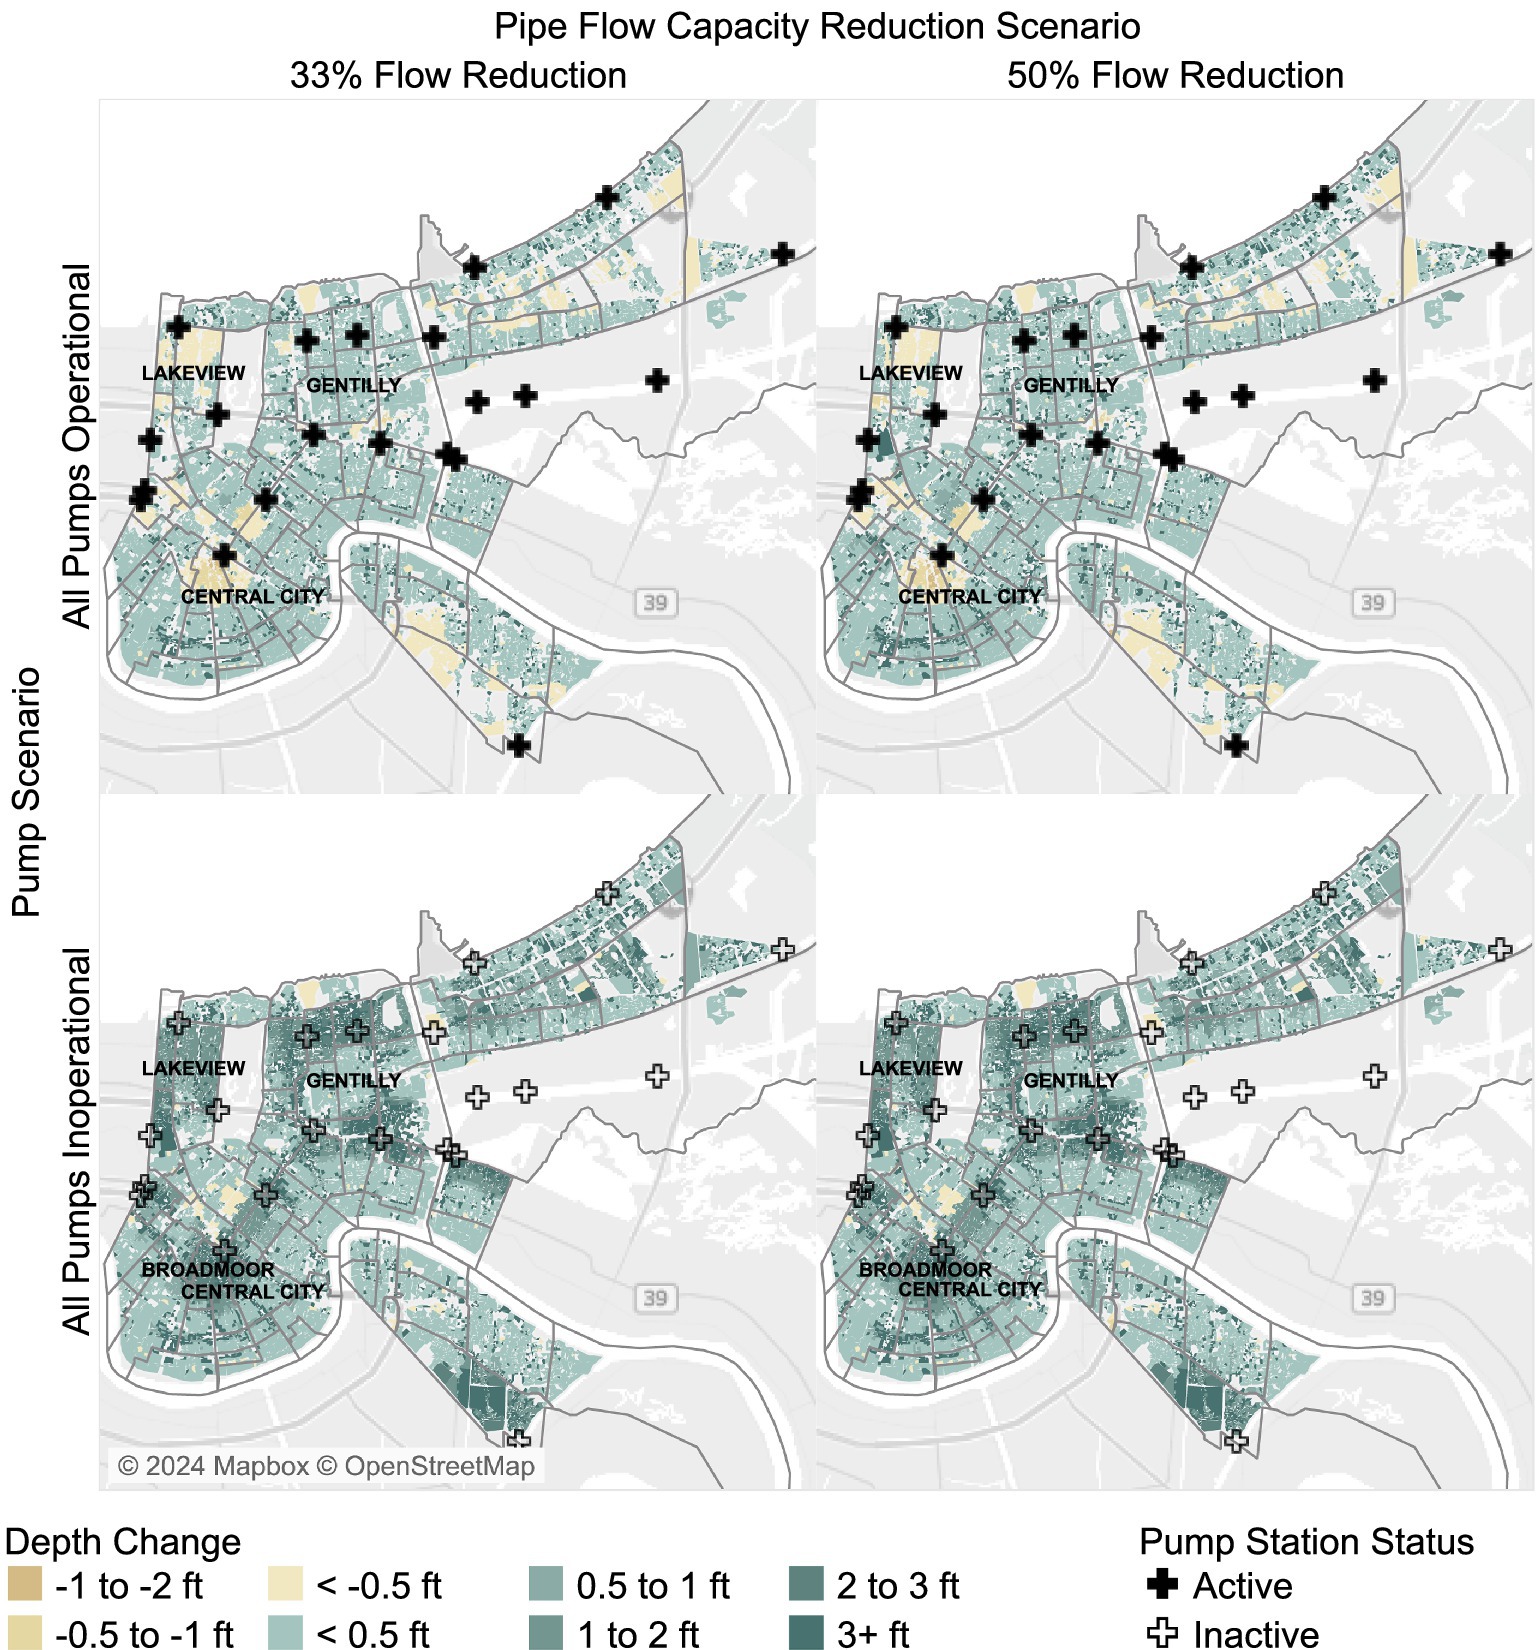
Figure 5. Change in maximum flood depths for the 10-year, 24-h design storm events when pipe obstruction levels are increased and/or all pumps are inactive.
Flood damage is a function of both the depth of flooding and the value of the assets exposed and the distribution of damage reflects this for the 10 July 2019 event and 10-year, 24-h design storm (Figure 6). For example, the CBD has comparable levels of flooding to other nearby neighborhoods like Tulane, Central City, and the French Quarter, but has substantially more flood damage (more than $200 million for both storms) driven by the high value of the many commercial buildings in the area. However, flood depths are still very relevant: the Lakeview, New Orleans East, and Algiers regions all saw minimal flood damage for the 10 July 2019 event because they had minimal flooding. These same areas all see more damage under design storm conditions during which they also experience more flooding.
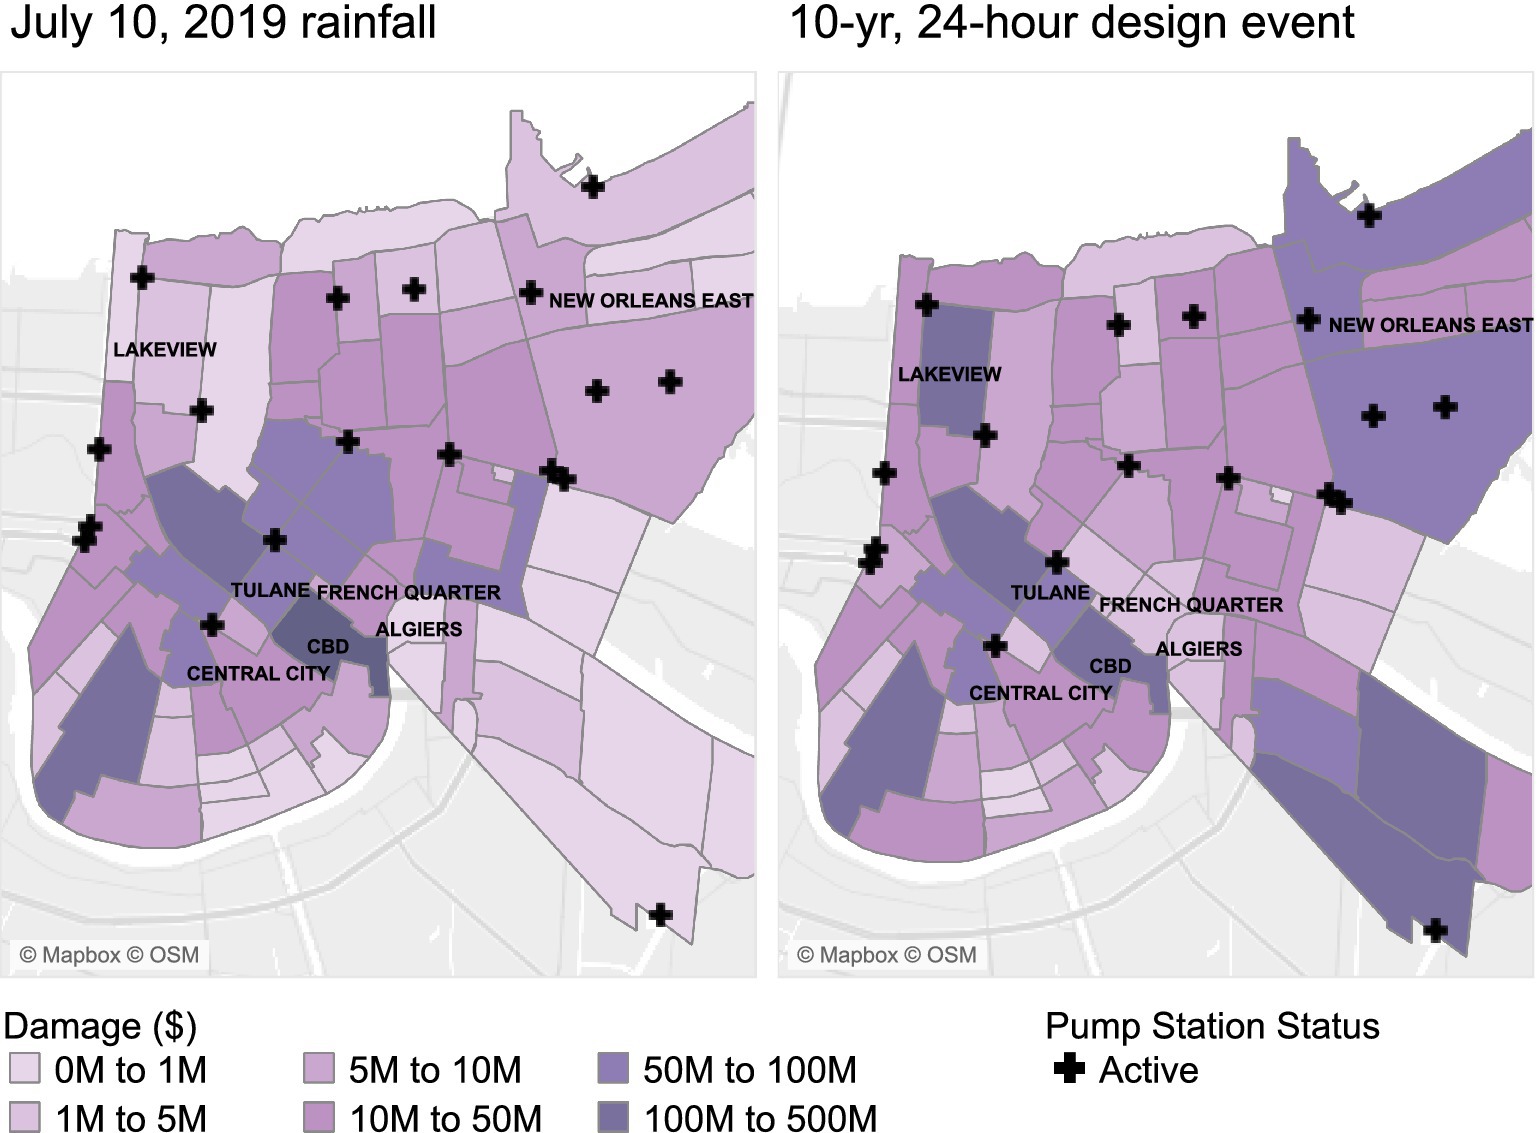
Figure 6. Asset damage by neighborhood for the storm that occurred on 10 July 2019 (left) and the 10-year, 24-h design storm event (right).
As in the case of flood depths, future rainfall conditions substantially change the distribution of damage for both events (Figure 7). Under 2045 rainfall conditions, both storms saw depths across the affected areas of the city increase by approximately 6 inches (Figure 4), and this is reflected in the damage values with most neighborhoods’ modeled damage increasing by a relatively small percentage. For the 10 July 2019 event, the few neighborhoods that see large percentage increases still have relatively modest damage (e.g., Venetian Isles and the Lower Ninth Ward). Similarly, the only neighborhoods experiencing large percentage changes in damage for the design storm have low absolute damage relative to the more heavily affected neighborhoods in the city. The 2075 rainfall values lead to much more substantial percentage increases in damage across the city for both storms. For the 10 July 2019 historical storm, flood depths increased the most in places already experiencing substantial flooding. This is reflected in the damage values, with neighborhoods like Broadmoor, Mid-City, Tulane, and the Seventh Ward all experiencing damage greater than $100 million but not ranking among the neighborhoods with the greatest increase in percentage damage. These later were, as in the 2045 case, largely neighborhoods with relatively modest absolute damage values.
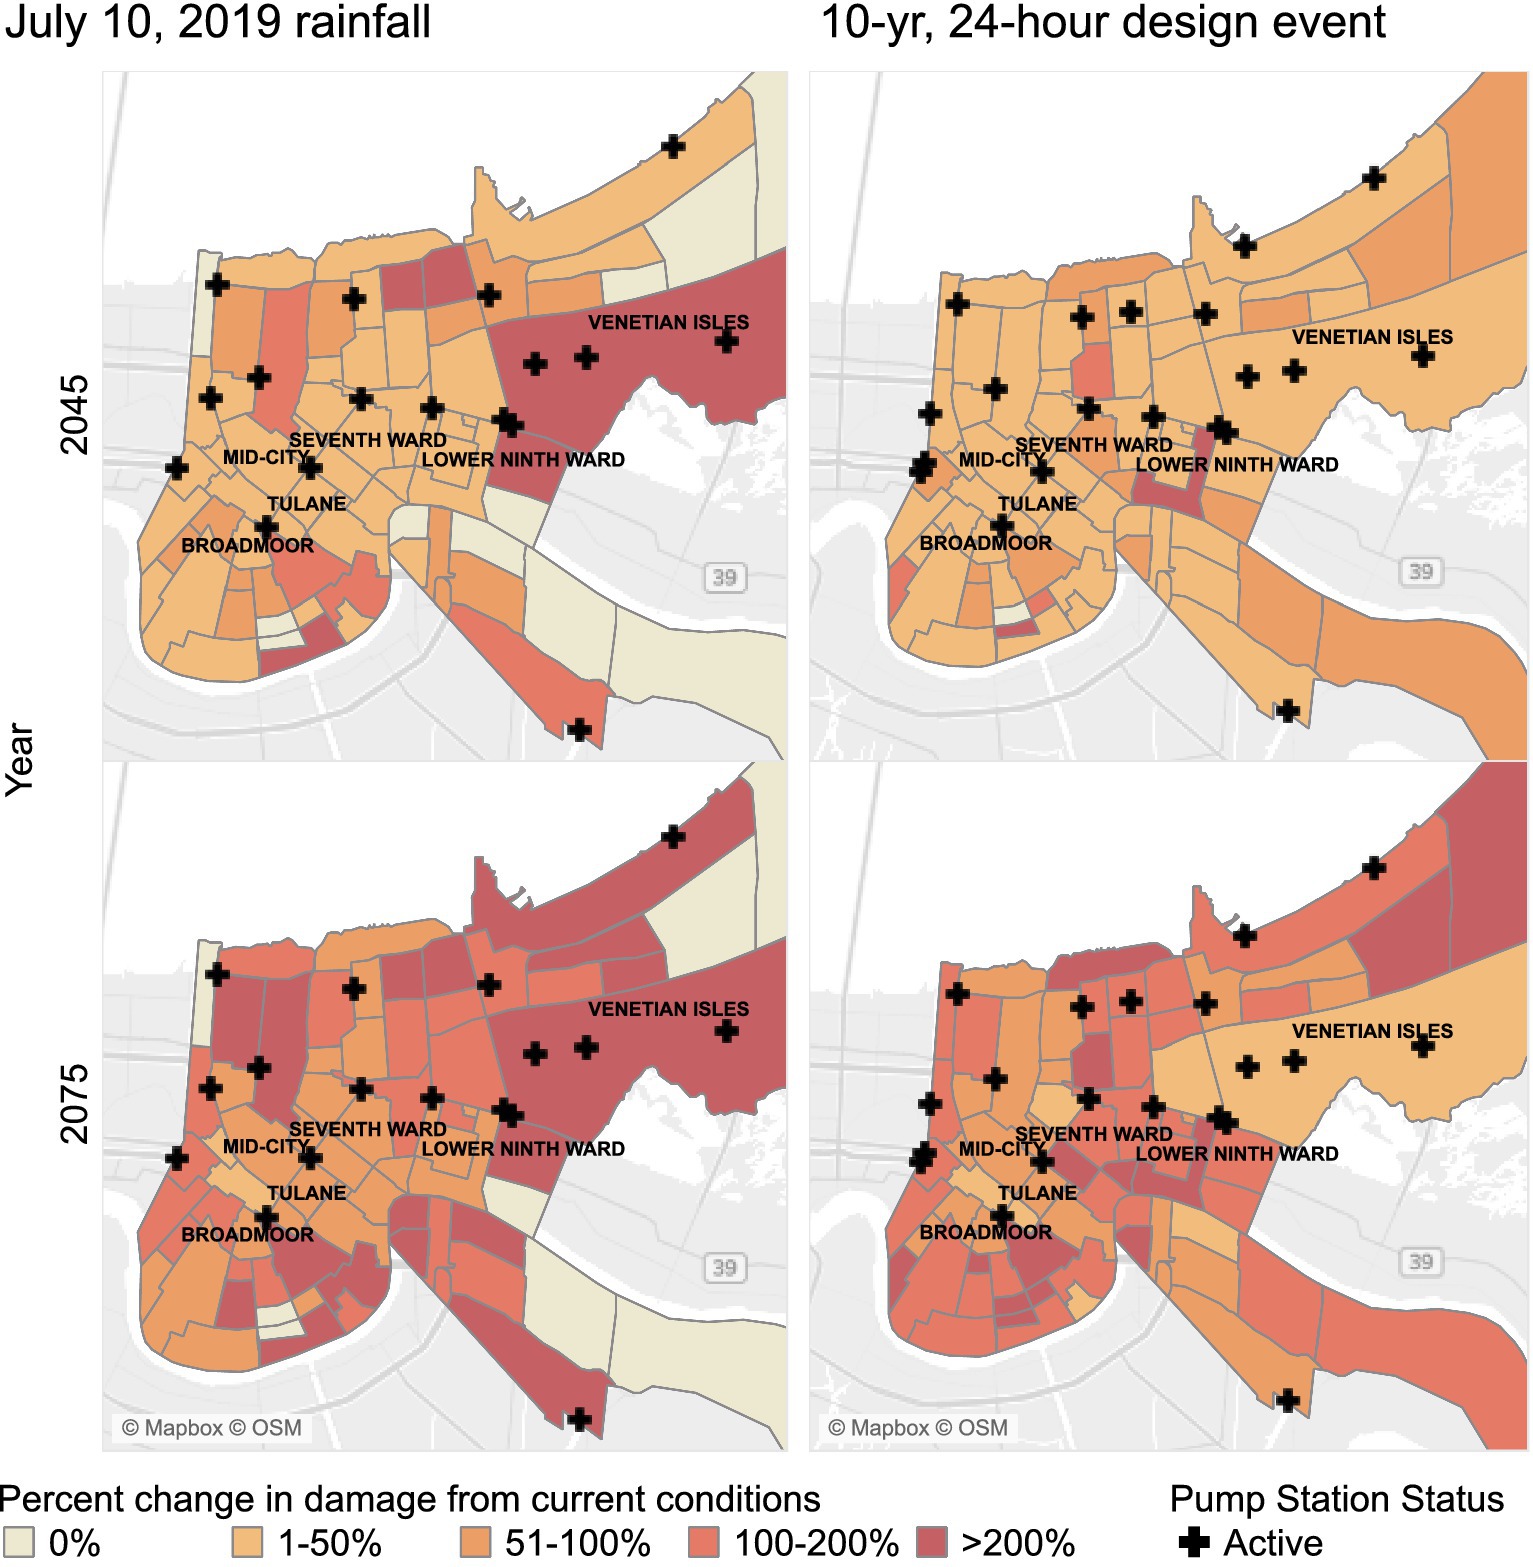
Figure 7. Percentage change in neighborhood level damage for the 10 July 2019, and 10-year, 24-h design storm events under projected 2045 and 2075 rainfall conditions.
Finally, increasing the level of pipe obstruction or reducing pump capacity alters flood depths across the city, and these effects are carried through to flood damage for the 10-year, 24-h design storm (Figure 8). Increasing pipe obstruction caused most parts of the city to see minor increases in flooding with a few areas seeing reduced flooding because of the gravity fed nature of the system. This pattern is reflected in the damage with areas from the center of the city to the northwestern edge all experiencing less damage under higher obstruction conditions while the rest of the city saw modest increases (Figure 5). Because pipe obstruction distributed flooding across the city, areas seeing the greatest increase in damage were relatively expensive parts of the city with high property values where any increase in flooding translates to a large increase in damage (e.g., CBD). By contrast, turning the pumps off tends to have the greatest effect on both flood depths and flood damage in the neighborhoods that are most directly served by the pumps, particularly those served by DPS 1 (e.g., Broadmoor, Central City, and Milan), those served by DPS 3 (e.g., the Sixth and Seventh wards), those served by DPS 4 (e.g., Milneburg and Gentilly) and those served by DPS 6 (e.g., Lakeview and Lakewood).
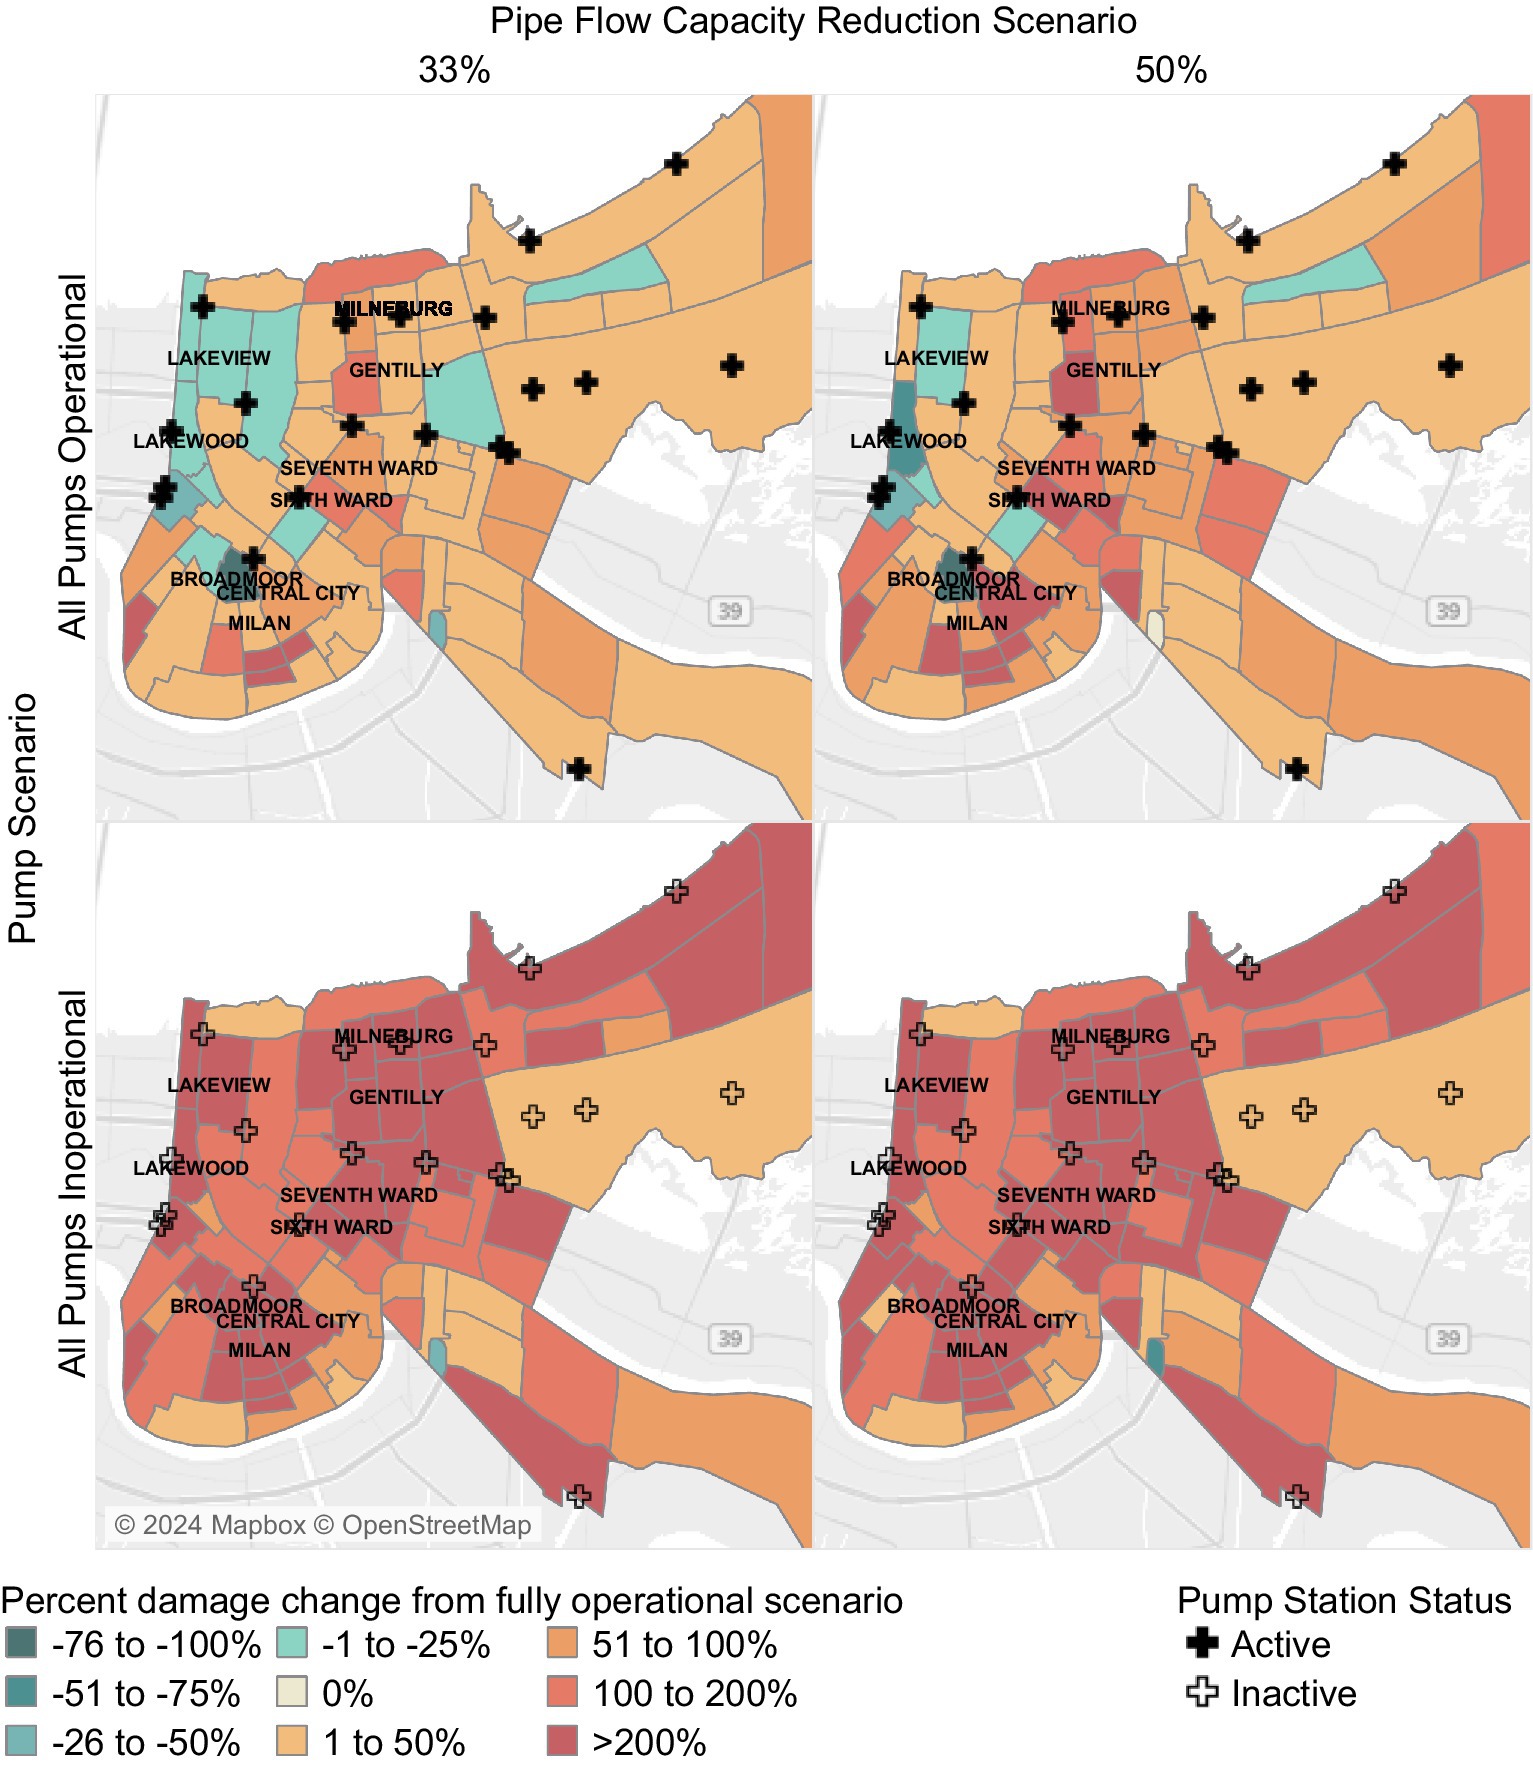
Figure 8. Percentage change in damage at the neighborhood level for the 10 July 2019, and 10-year, 24-h design storm events when pipe obstruction levels are increased and all pumps are shut off.
Based on a preliminary review of the depths and damage results, we selected three neighborhoods for specific vulnerability analysis: Broadmoor, the Sixth Ward, and Milneburg (Figure 9). These neighborhoods were selected to provide geographic variation and because they are neighborhoods currently under consideration for additional stormwater and green infrastructure investments.
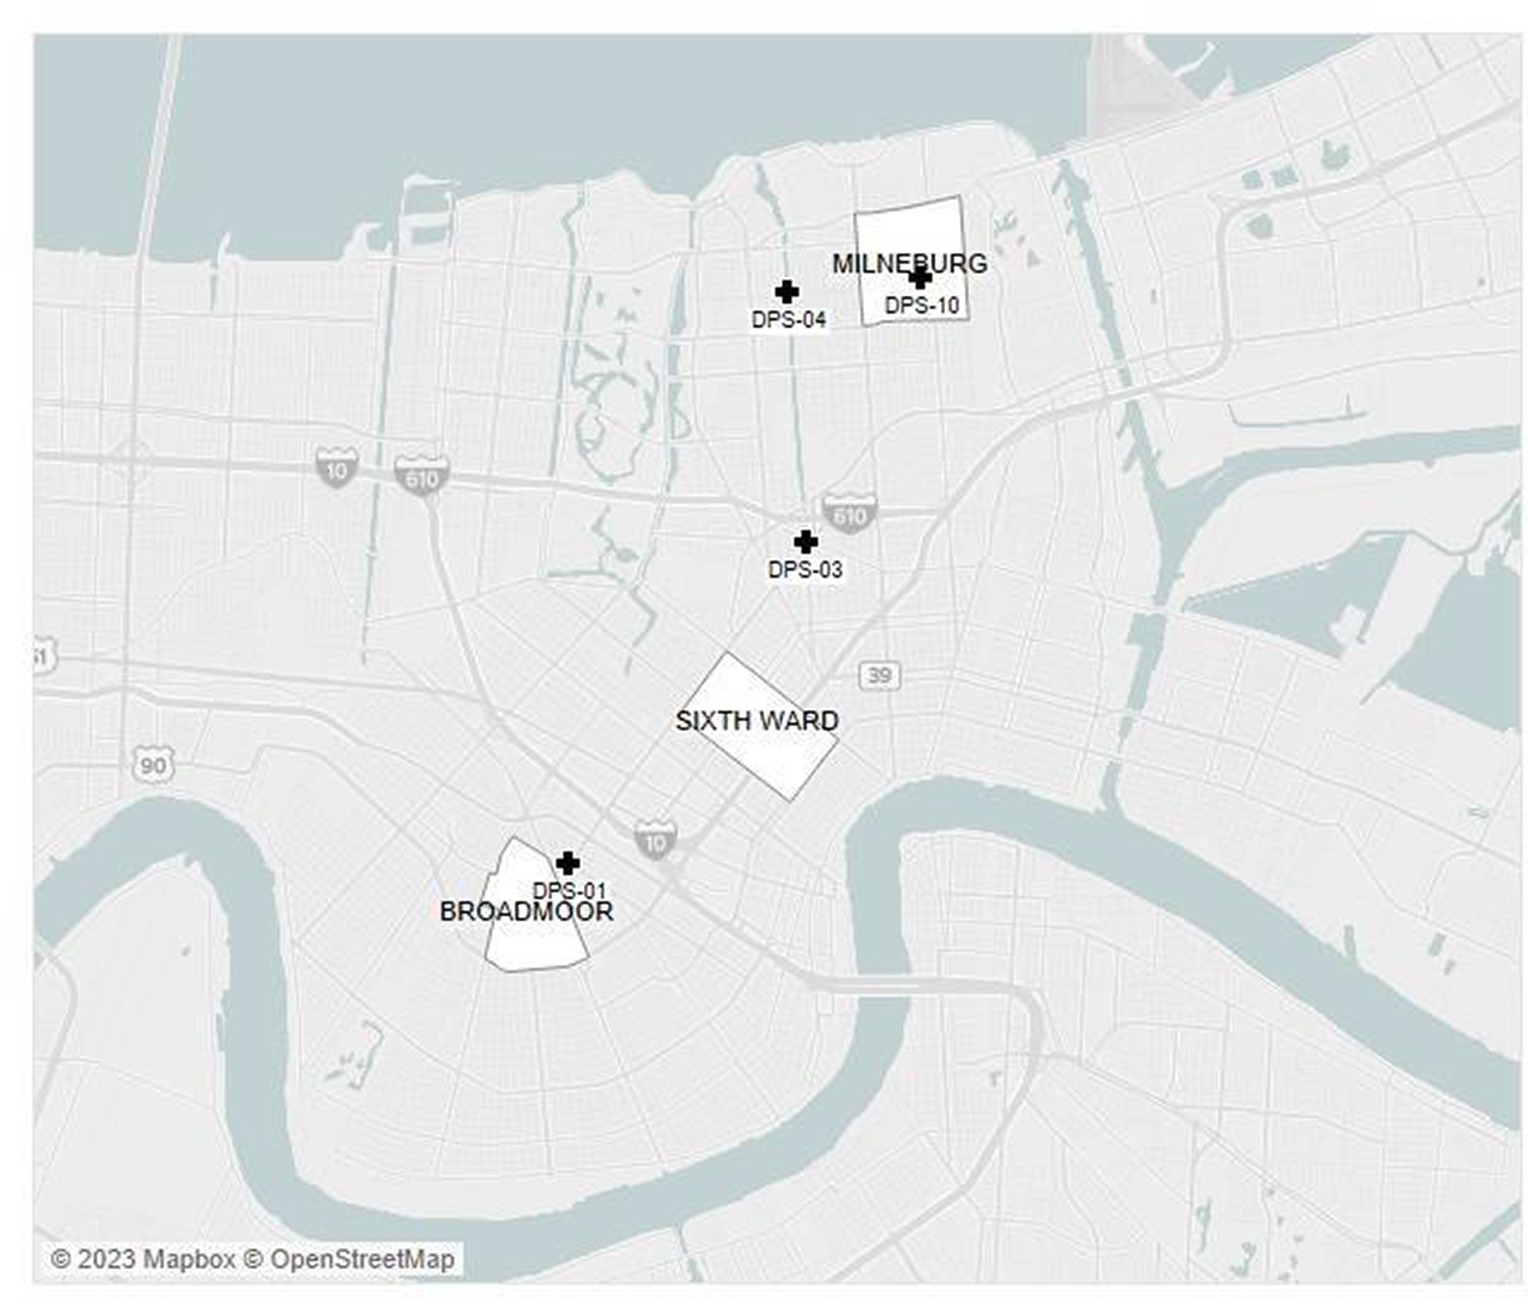
Figure 9. Neighborhoods selected for additional vulnerability analysis with associated pump stations.
The variables identified through the PRIM and CART analyses to describe stressing scenarios vary across neighborhoods and the city level (Table 5). At the citywide level, the most important variable in the analysis was whether DPS 1 and 2 were on, reflecting the importance of these pumps both to the system and the fact that they serve neighborhoods with high asset values (e.g., CBD). These pumps are followed closely by rainfall factors, with future rainfall conditions causing widespread damage throughout the city. At the neighborhood level, however, different patterns emerge. In Broadmoor, the most important factor is the operation of DPS 1; however, the second most important factor is pipe obstruction with greater levels of obstruction causing lower total damage. For the Sixth Ward, the most important feature is whether DPS 3 is active with other uncertainties having minimal impact. Finally, in Milneburg the most important factor was future climate with both 2075 rainfall conditions leading to extensive damage regardless of other factors. DPS 4 and pipe conveyance were secondary in importance.
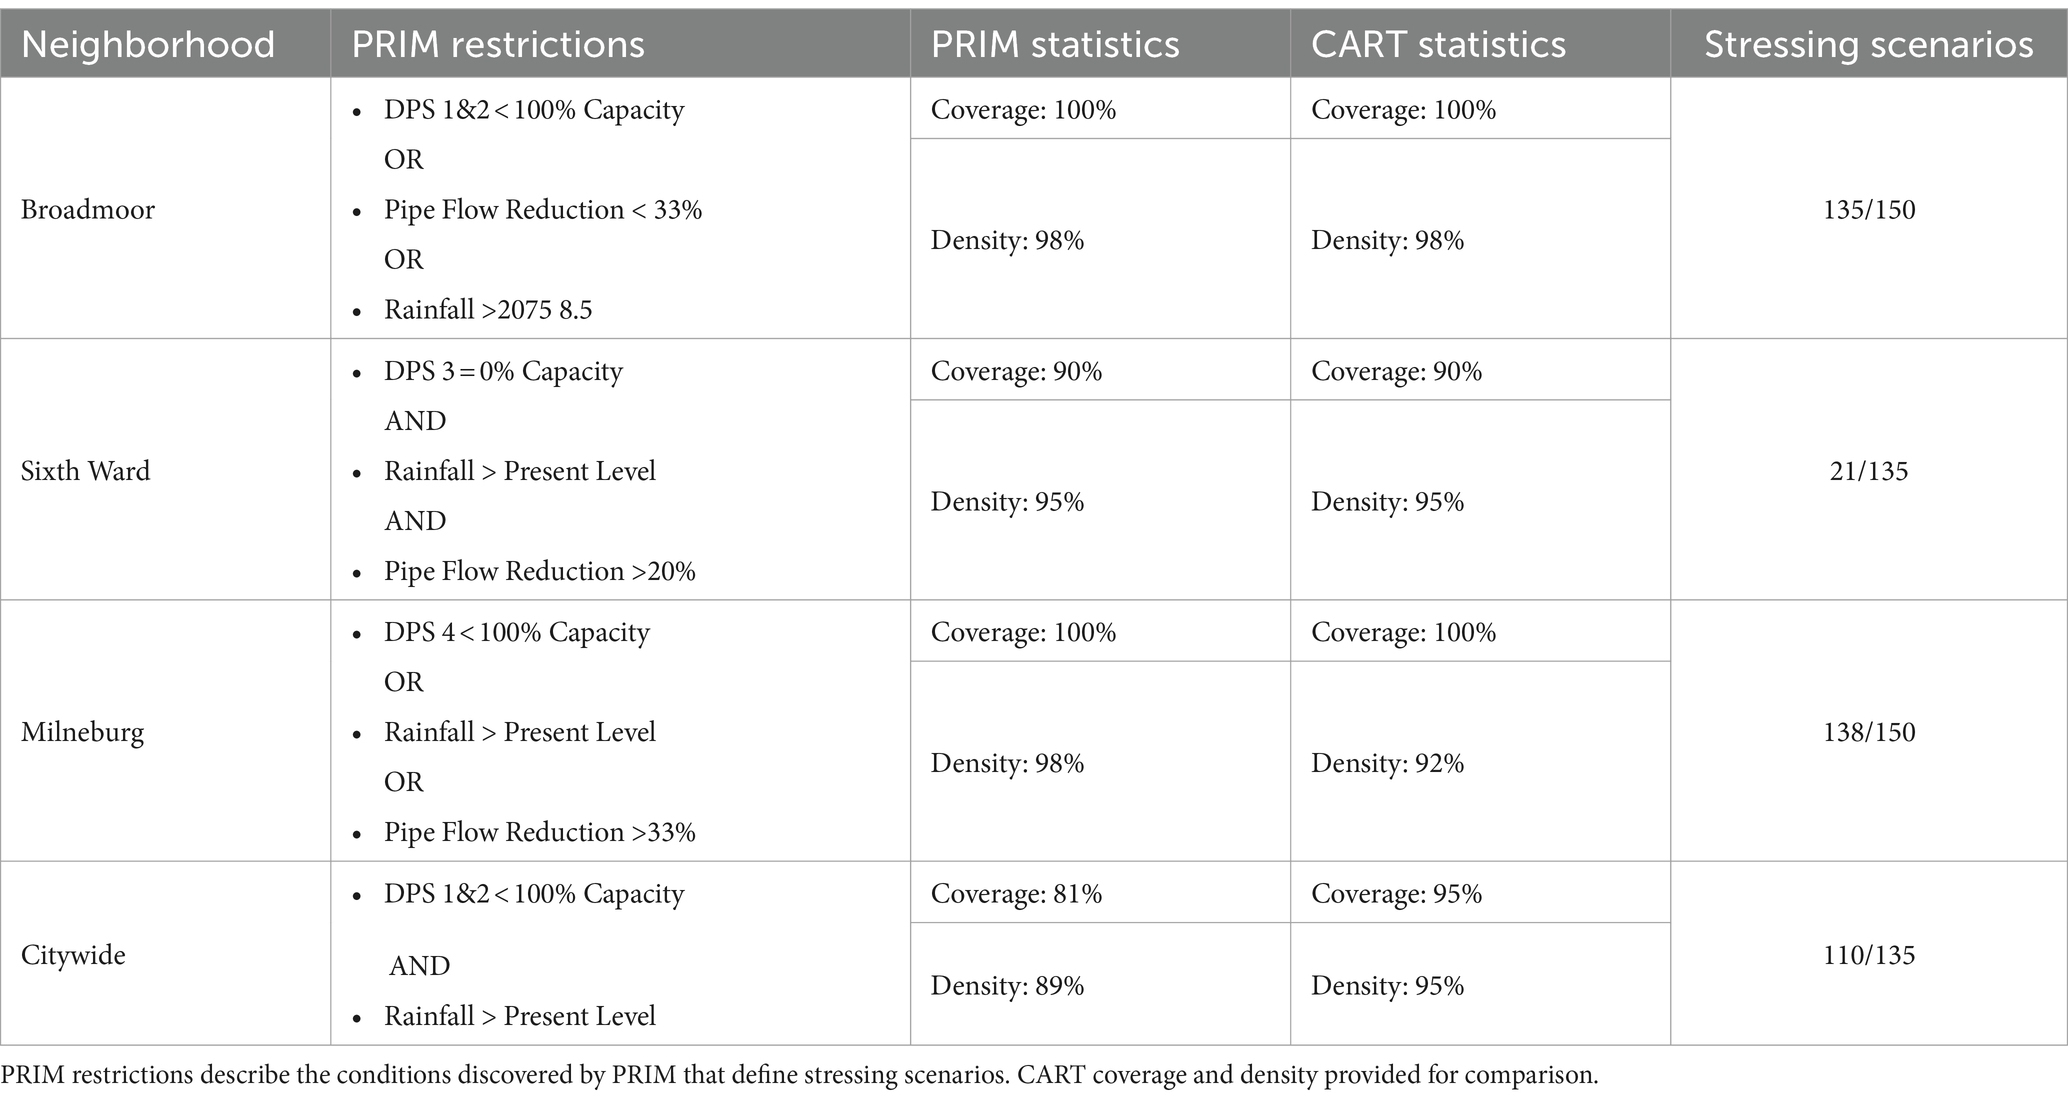
Table 5. Vulnerability analysis results for each neighborhood and city wide.
The logistic regression reveals a similar pattern at both the neighborhood and city level, though at the city level the most extreme rainfall intensity overtook pump operations as the most important factor with high levels of citywide pipe obstruction ranking as more important than the non-DPS 1 and 2 pump operations. The neighborhood level analysis was similar to the PRIM results described above with the same combination of uncertain factors being the most important identifiers of stressing scenarios (or lack thereof in the case of Broadmoor and pipe obstruction). For the full details of the analysis results see Supplementary material.
Overall, our study results are suggestive of a few important findings. First, at the level of the entire city, one of the most important uncertainties is the potential for increases in rainfall due to climate change. However, notably this variable was “manipulated” at the city level in our analysis. We used design storms for this analysis which have a uniform rainfall across the city, unlike a more realistic storm which would produce greater rainfall intensity over some parts of the city than others (for example, compare the 10 July 2019, event to the 10-year design storm in Figure 3). By contrast, the operations of DPS 1 and 2, which mostly have local effects, showed up as quite important at the city level as well, reflecting the high-risk neighborhoods served by these pumps.
At the local level every neighborhood analyzed showed a different pattern of results. Two had pump operation (though for different pumps) as the most important while the third had rainfall as the most important (Milneburg). Of the two neighborhoods where pumping was most important, one was largely unaffected by other factors (Sixth Ward) while the other (Broadmoor) actually benefited from pipe obstruction. These findings suggest that not only is system stress not spatially uniform, but the factors that drive it and even the direction of relationships can vary from one neighborhood to another.
This last point suggests an important feature of the stormwater management system in New Orleans—there is competition between neighborhoods for access to stormwater clearance capacity. Due to its position near DPS 1, stormwater that falls directly in Broadmoor can be quickly pumped away. However, many other neighborhoods drain into Broadmoor, which can potentially overwhelm DPS 1’s capacity, but this water cannot reach Broadmoor when pipe obstruction is high. The high obstruction condition thus harms the neighborhoods around Broadmoor whose water cannot easily reach DPS 1 but is beneficial to Broadmoor because DPS 1’s capacity can be solely devoted to rain falling on Broadmoor. An examination of flood depths suggests this pattern may hold for other neighborhoods in the city.
In general, sea-level rise was not a particularly important driver of flooding in the model, though this may have been because we ran the model with non-tropical rainfall and using the “closed” configuration of the drainage system.
Our work has several important limitations. First, the damage value outputs from our model rely on simplifying assumptions from HAZUS that may make them difficult to compare to retrospective damage estimates from actual storms. The HAZUS database lacks New Orleans-specific depth-damage curves for some building categories, for example, and the damage estimates presented use the replacement value of structures rather than depreciated structure values. However, the modeled damage values remain comparable to one another and examining how damage varies across neighborhoods, years, and scenarios still produces relevant insights. The scenarios we considered were also somewhat unrealistic. Notably, we relied on uniform rainfall across the study domain in our simulation, pipe obstruction was considered at a very coarse level, and pump failure was operationalized as all pumps in a station failing. In reality, individual pumps within a pump station might fail while others remain online. Additionally, as mentioned above our work is reliant on an existing SWMM model that may not fully capture current system operations (e.g., an earlier version of the model erroneously included an active connection between DPS 2 and 3). Finally, the thresholds used in our vulnerability analysis were largely exploratory and a different set of thresholds might have revealed somewhat different relationships between uncertainties and stressing scenarios.
However, despite these limitations, our work features important methodological advances and theoretical insights. On the methodological side, while the RDM framework is typically used to explore vulnerability and robustness across a range of different policies to support decision making, here we use it as a problem framing tool to help decision makers better understand the stressors to the system under a future without action. This is a more exploratory analysis with a goal of building an understanding of the challenges facing the city rather than building evidentiary support for a proposed solution. This is not a unique need for the city of New Orleans, and we hope that other researchers may take inspiration from this use of the RDM framework. Our work also demonstrates the utility of modeling with a high spatial resolution, particularly in the context of flood damage. Though many of the uncertainties considered in our analysis are varied uniformly across the model domain, the effect of those variations is not uniform. Models with a coarse spatial resolution that produce single flood depth and damage estimates for wide geographic areas can elide these important differences. By disaggregating flood damage from the city level to the neighborhood level, we discovered several suggestive patterns about the importance of spatial variability in the drivers of flood risk. In addition to providing valuable local information, these patterns suggest the theoretical importance of analysis scale for future DMDU research on flood risk. Finally, this work helps illuminate some important next steps for the city of New Orleans, such as improving flood drainage in neighborhoods where current infrastructure cannot meet future flood depth projections even at maximum capacity, improving the reliability of critical pump stations and better determining how systems like green infrastructure could help to reduce the competition between neighborhoods for pump capacity.
The raw data supporting the conclusions of this article will be made available by the authors, without undue reservation.
PK: Conceptualization, Data curation, Formal analysis, Investigation, Methodology, Software, Writing – original draft, Writing – review & editing. NT: Formal analysis, Investigation, Methodology, Software, Writing – original draft, Writing – review & editing. DG: Conceptualization, Data curation, Investigation, Methodology, Software, Writing – original draft, Writing – review & editing. BM: Conceptualization, Investigation, Writing – original draft, Writing – review & editing. JF: Conceptualization, Funding acquisition, Investigation, Methodology, Project administration, Supervision, Validation, Visualization, Writing – original draft, Writing – review & editing.
The author(s) declare financial support was received for the research, authorship, and/or publication of this article. The authors declare that this study received funding from Shell Corporation. The funder was not involved in the study design, collection, analysis, interpretation of data, the writing of this article or the decision to submit it for publication.
The authors declare that the research was conducted in the absence of any commercial or financial relationships that could be construed as a potential conflict of interest.
All claims expressed in this article are solely those of the authors and do not necessarily represent those of their affiliated organizations, or those of the publisher, the editors and the reviewers. Any product that may be evaluated in this article, or claim that may be made by its manufacturer, is not guaranteed or endorsed by the publisher.
The Supplementary material for this article can be found online at: https://www.frontiersin.org/articles/10.3389/fclim.2024.1303951/full#supplementary-material
Ardurra (2019). Comprehensive S&WB-City of New Orleans Stormwater management model (SWMM) July 10, 2019 rainfall event modeling and mapping.
Boogaard, F, Rooze, D, and Stuurman, R. (2023). The Long-Term Hydraulic Efficiency of Green Infrastructure under Sea Level: Performance of Raingardens, Swales and Permeable Pavement in New Orleans. Land. 12:171. doi: 10.3390/land12010171
Bureau of Governmental Research (2017). Beneath the surface: A primer on Stormwater fees in new Orleans. Available at: www.bgr.org (Accessed September 20, 2021].
Federal Emergency Management Agency (2020). Multi-Hazard loss estimation methodology: Flood model HAZUS-MH Technical Manual. Washington D.C: Federal Emergency Management Agency.
Fischbach, J. R. (2010). Managing New Orleans flood risk in an uncertain future using non-structural risk mitigation. Santa Monica: RAND.
Fischbach, J. R., Johnson, D. R., and Groves, D. G. (2019). Flood damage reduction benefits and costs in Louisiana’s 2017 coastal master plan. Environ. Res. Commun. 1:111001. doi: 10.1088/2515-7620/ab4b25
Fischbach, J. R., Johnson, D. R., Kuhn, K., Pollard, M., Stelzner, C., Costello, R., et al. (2017). Coastal master plan modeling: Attachment C3-25: Storm surge and risk assessment Baton Rouge, Louisiana: Coastal Protection and Restoration Authority.
Fischbach, J. R., Johnson, D. R., Wilson, M. T., Geldner, N. B., and Stelzner, C. (2021). 2023 Coastal Master Plan: Attachment E2: Risk Assessment Model Improvements. Version 2. Baton Rouge, Louisiana: Coastal Protection and Restoration Authority. 1–78. Available at: https://coastal.la.gov/wp-content/uploads/2023/06/E2_RiskAssessmentModelImprovements_Mar2021_v2.pdf
Fischbach, J. R., Wilson, M. T., Bond, C. A., Kochhar, A. K., Catt, D., and Tierney, D. (2020). Managing heavy rainfall with green infrastructure: An evaluation in Pittsburgh’s Negley run watershed. Available at: https://www.rand.org/pubs/research_reports/RRA564-1.html (Accessed 20 April 2021).
Friedman, J. H., and Fisher, N. I. (1999). Bump hunting in high-dimensional data. Stat. Comput. 9, 123–143. doi: 10.1023/A:1008894516817
Groves, D. G., Molina-Perez, E., Bloom, E., and Fischbach, J. R. (2019). “Robust decision making (RDM): application to water planning and climate policy” in Decision making under deep uncertainty: From theory to practice. eds. V. A. W. J. Marchau, W. E. Walker, P. J. T. M. Bloemen, and S. W. Popper (Cham: Springer International Publishing), 135–163.
Interagency Performance Evaluation Task Force (IPET) (2006). Performance evaluation of the New Orleans and Southeast Louisiana hurricane protection system draft final report of the interagency performance evaluation task force volume VIII – Engineering and operational risk and reliability analysis. Washington D.C: U.S: Army Corps of Engineers.
Johnson, D. R., Corporation, R., Fischbach, J. R., Corporation, R., Kuhn, K., and Corporation, R. (2015). Current and future flood risk in greater New Orleans, 14.
Jung, I.-W., Chang, H., and Moradkhani, H. (2011). Quantifying uncertainty in urban flooding analysis considering hydro-climatic projection and urban development effects. Hydrol. Earth Syst. Sci. 15, 617–633. doi: 10.5194/hess-15-617-2011
Kunkel, K. (2020). Incorporation of the effects of future Anthropogenically-forced climate change in intensity-duration-frequency design values. North Carolina Institute for Climate Studies, North Carolina State University.
Lempert, R. J. (2019). “Robust decision making (RDM)” in Decision making under deep uncertainty. Eds. Vincent A. W. J. Marchau, Warren E. Walker, Pieter J. T. M. Bloemen and Steven W. Popper. (Cham: Springer), 23–51.
Lempert, R. J., Groves, D. G., Popper, S. W., and Bankes, S. C. (2006). A general, analytic method for generating robust strategies and narrative scenarios. Manag. Sci. 52, 514–528. doi: 10.1287/mnsc.1050.0472
Lempert, R. J., Popper, S. W., and Bankes, S. C. (2003). Shaping the next one hundred years: New methods for quantitative, Long-term policy analysis. Santa Monica, Calif.: RAND Corporation.
Lempert, R. J., Popper, S. W., Groves, D. G., Kalra, N., Fischbach, J. R., Bankes, S. C., et al. (2013). Making good decisions without predictions: robust decision making for planning under deep uncertainty. RAND Corporation Available at: https://www.rand.org/pubs/research_briefs/RB9701.html (Accessed 11 November 2021).
Liu, J., Shao, W., Xiang, C., Mei, C., and Li, Z. (2020). Uncertainties of urban flood modeling: influence of parameters for different underlying surfaces. Environ. Res. 182:108929. doi: 10.1016/j.envres.2019.108929
Liu, L., Hong, Y., Hocker, J. E., Shafer, M. A., Carter, L. M., Gourley, J. J., et al. (2012). Analyzing projected changes and trends of temperature and precipitation in the southern USA from 16 downscaled global climate models. Theor. Appl. Climatol. 109, 345–360. doi: 10.1007/s00704-011-0567-9
Meselhe, E., White, E., Welles, E., and McCorquodale, J. A. (2017). New Orleans drainage models and data monitoring – review and recommendations. New Orleans Sewerage Water Board 11
Miller, J. D., and Hutchins, M. (2017). The impacts of urbanisation and climate change on urban flooding and urban water quality: a review of the evidence concerning the United Kingdom. J. Hydrol. 12, 345–362. doi: 10.1016/j.ejrh.2017.06.006
Pahl, J. W., Freeman, A. M., Fitzpatrick, C., Jankowski, K. L., and White, E. D. (2023). 2023 Coastal Master Plan: Attachment B2: Scenario Development: Sea Level Rise and Additional Climate-Driven Variables. Version 2. Baton Rouge, Louisiana: Coastal Protection and Restoration Authority. 43. Available at: https://coastal.la.gov/wp-content/uploads/2023/11/B2_ScenarioDevel_SLRAdditionalClimateDrivenVariables_Nov2023_v2.pdf
Perica, S., Martin, D., Pavlovic, S., Roy, I., St. Laurent, M., Trypaluk, C., et al. (2013). NOAA Atlas 14 Volume 9, Version 2.0: Southeastern States (Alabama, Arkansas, Florida, Georgia, Louisiana, and Mississippi). Available at: https://www.weather.gov/media/owp/oh/hdsc/docs/Atlas14_Volume9.pdf.
Sharma, S., Lee, B. S., Nicholas, R. E., and Keller, K. (2021). A safety factor approach to designing urban infrastructure for dynamic conditions. Earths Fut 9:e2021EF002118. doi: 10.1029/2021EF002118
Torres, J. (2018). The NOAA atlas 14 update and what it means for Houston. Available at: https://lan-inc.com/wp-content/uploads/2018/12/The-NOAA-Atlas-14-Update-and-What-It-Means-for-Houston.pdf.
USGCRP (2017). Climate science special report: Fourth National Climate Assessment, Volume I. Washington, DC, USA: U.S. Global Change Research Program.
Wong, T. E., and Keller, K. (2017). Deep uncertainty surrounding coastal flood risk projections: a case study for New Orleans. Earths Fut 5, 1015–1026. doi: 10.1002/2017EF000607
Keywords: robust decision making, decision making under deep uncertainty, stormwater management, SWMM, spatial decision making, New Orleans
Citation: Kane PB, Tebyanian N, Gilles D, McMann B and Fischbach JR (2024) Key drivers of vulnerability to rainfall flooding in New Orleans. Front. Clim. 6:1303951. doi: 10.3389/fclim.2024.1303951
Edited by:
Edmundo Molina-Perez, Monterrey Institute of Technology and Higher Education (ITESM), MexicoReviewed by:
Francesco Sapino, Universidad de Salamanca, SpainCopyright © 2024 Kane, Tebyanian, Gilles, McMann and Fischbach. This is an open-access article distributed under the terms of the Creative Commons Attribution License (CC BY). The use, distribution or reproduction in other forums is permitted, provided the original author(s) and the copyright owner(s) are credited and that the original publication in this journal is cited, in accordance with accepted academic practice. No use, distribution or reproduction is permitted which does not comply with these terms.
*Correspondence: Patrick Bodilly Kane, cGthbmVAdGhld2F0ZXJpbnN0aXR1dGUub3Jn
Disclaimer: All claims expressed in this article are solely those of the authors and do not necessarily represent those of their affiliated organizations, or those of the publisher, the editors and the reviewers. Any product that may be evaluated in this article or claim that may be made by its manufacturer is not guaranteed or endorsed by the publisher.
Research integrity at Frontiers
Learn more about the work of our research integrity team to safeguard the quality of each article we publish.