 More-Grace Hungwe
 Webster Gumindoga
 Oscar Manuel Baez Villanueva3
95% of researchers rate our articles as excellent or good
Learn more about the work of our research integrity team to safeguard the quality of each article we publish.
Find out more
ORIGINAL RESEARCH article
Front. Clim. , 20 May 2024
Sec. Climate Services
Volume 6 - 2024 | https://doi.org/10.3389/fclim.2024.1291751
This article is part of the Research Topic Promoting Climate Services Through Earth Observations in Africa View all articles
Tropical cyclones (TCs) are extreme meteorological events that cause significant deaths, infrastructure damage, and financial losses around the world. In recent years, the Eastern Highlands of Zimbabwe's have become increasingly vulnerable to TCs caused by Indian Ocean tropical cyclones making landfall more frequently. There is still a limited understanding of the phenomenon and the quantification of its impacts. The aim of this research is to conduct a comparative analysis of the variability in the severity of tropical cyclones by analysing historical storm tracks and mapping the environmental impacts in Zimbabwe's Chimanimani and Chipinge districts. Results indicate that, between 1945 and 2022, the Eastern Highlands of Zimbabwe experienced 5 of the total 865 cyclones in the Southwest Indian Ocean. The maximum sustained winds from the Cyclone Idai in the Eastern Highlands were recorded as 195 km/h. Some of the remote sensing-based indices used to extract spatial information about the condition of vegetation, wetlands, built-up area, and bar land during pre and post cyclonic events included the Normalized Difference Vegetation Index (NDVI) and Modified Normalized Difference Water Index (MNDWI). Analysis of NDVI in the Eastern Highlands revealed that there was a significant decrease in vegetated area because of the cyclone impact, with a decrease of 2.1% and 16.68% for cyclone Japhet and Idai respectively. The MNDWI shows a 10.74% increase in water content after cyclone Eline. Field validation in 2019 confirms the research findings. An Operations Dashboard Disaster Management System was developed in order to disseminate information to the affected stakeholders about the potential risk that the face due to the occurrence of the natural phenomena.
Tropical cyclones (TCs) also known as hurricanes, typhoons, or cyclones depending on the region, are strong and well-organized low-pressure weather systems that form over warm ocean waters close to the equator (Wang and Wu, 2004; Kossin et al., 2014; Tiwari et al., 2022). TCs display a distinctive structure with severe thunderstorms and rotating circulation with high winds, and they are distinguished by a well-defined eye at their center and an eyewall surrounding them (Kossin et al., 2020). The eyewall of the cyclone is where the storm's greatest winds and most significant rains fall (Knaff et al., 2017).
When tropical cyclones (TCs) make landfall, their destructive impact extends inland for hundreds of kilometers, unleashing havoc with wind speeds reaching up to 200 km/h and causing severe rainfall-induced destruction (Marks et al., 2002; Ramos-Scharrón et al., 2022). This is due to TCs being characterized by high storm surges, powerful winds, and heavy rainfall, leading to substantial damage to infrastructure, agriculture, and ecosystems (Mansour, 2019; Ahammed and Pandey, 2021).
Climate change also presents a critical global challenge with profound repercussions across multiple spheres of the globe, encompassing extreme meteorological phenomena (Kossin, 2018; Knutson et al., 2021). Within this context, TCs, hold a significant place owing to their immense capacity for destruction on a global scale (Eberenz et al., 2021). The economic ramifications of TCs have been staggering, with billions of dollars in damages incurred across affected regions with thousands of lives lost or displaced (Hendricks et al., 2023).
The Southwest Indian Ocean (SWIO) region, encompassing the coastal areas of countries such as Madagascar, Mozambique, South Africa, and Tanzania, is highly vulnerable to the devastating impacts of cyclones (Ramos-Scharrón et al., 2022). This region is a known hotspot for tropical storms and cyclones, with significant loss and damage in the affected areas (Otto et al., 2022). Zimbabwe, located adjacent to the coastal country of Mozambique, has experienced a series of cyclones and tropical storms, including Cyclone Eline in 2000, Japhet in 2003, Dineo in 2017, Idai in 2019, Batsirai in 2022, as well as tropical storms Chalane in 2020, Eloise in 2021, and Ana in 2022. These cyclones have disproportionately affected the provinces of Midlands, Manicaland, Masvingo, and Matabeleland South, resulting in approximately 1,000 fatalities, $5 billion in property damage, displacement of people, and extensive environmental degradation (Chatiza, 2019; Mavhura, 2020).
Intense cyclones can also cause substantial damage to vegetation and have the ability to alter ecosystem structure and function by quickening up biomass transport and associated nutrient cycles (Potter, 2014).
Measuring and quantifying TC impacts are essential for understanding their destructive potential, estimating the threats they pose to affected communities, and devising effective mitigation techniques (Li et al., 2021). Remote sensing, particularly the use of spectral indices obtained from satellite imagery, is important in this procedure because it provides crucial data on numerous impact characteristics. Spectral indices, which are mathematical combinations of distinct light bands or wavelengths, can be used to evaluate changes in vegetation health, land cover, and water bodies, allowing for thorough and objective analyses of tropical storm impacts (Jin et al., 2020).
The prompt dissemination of information about a TC occurrence is critical for guaranteeing public safety, supporting preparedness, and minimizing the possible repercussions of these extreme weather occurrences (Li et al., 2021). Communication of information enables individuals, communities, and authorities in making informed decisions about evacuation, disaster response, and resource allocation. As a modern communication tool, interactive dashboards play an important part in this process by providing real-time updates, visualizing data, and increasing public interaction. Dashboards allow users to easily examine data, customize perspectives, and access the most up-to-date information (Blake et al., 2020).
Countries in the global south face unique challenges and vulnerabilities in the face of tropical cyclones, necessitating effective disaster risk reduction strategies, robust communication infrastructures, and early warning systems to mitigate the loss of life and property (Dube and Nhamo, 2021; Chiimba and Verne, 2022).
Prompt dissemination of information about TC occurrences is crucial for protecting public safety, assisting with preparedness, and mitigating the possible consequences of these extreme weather phenomena. Dashboards that are interactive serve as modern communication tools, allowing for real-time updates, data visualization, and increased public participation. This study aims to be a improve tropical cyclone monitoring, measurement, and communication in the Eastern Highlands of Zimbabwe, with a focus on understanding their changing characteristics of TCs, analyzing their impacts, and establishing effective response strategies.
The Eastern Highlands of Zimbabwe (Figure 1), which shares a border with Mozambique is the area most affected by tropical cyclones in Zimbabwe. The area has been affected by historical cyclones such as Idai (2019), Japhet (2003) and Eline (2000). These districts include Chimanimani and Chipinge (Figure 1), which have populations of 200,000 and 350,000 people, respectively with 96.2% of the Chimanimani district population resides in rural areas.
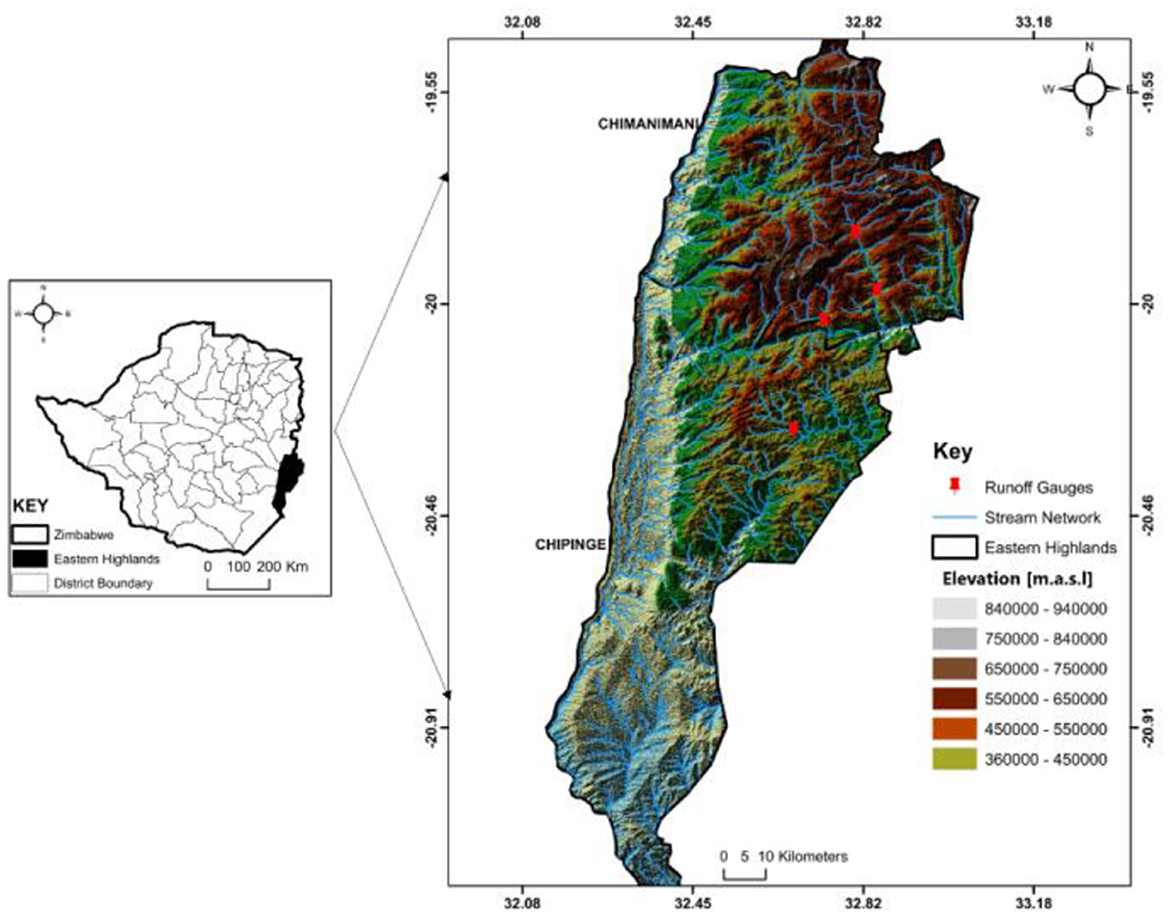
Figure 1. Location of the study area, the Eastern Highlands of Zimbabwe.
The main summer rainfall season is from October to March but on the high mountains can occur throughout the year. Mean annual rainfall range from 1500 to 2000 mm/year and the elevation ranges between 300 and 2300 meters above sea level. The Eastern Highlands also experiences yearly average low and high daily temperatures ranging between 10 and 28 degrees Celsius (Muchaka et al., 2022).
The sub-basins that cover the Eastern Highlands are Rusitu (142 km2), Nyahode (127 km2), Rusitu, Chipita (100 km2), and Buzi (147 km2). Deep ravines and gorges are separated by steep valleys in the topography of the Eastern Highlands. The streams are high-altitude, narrow mountain torrents with rapid flow and rocky underpinnings (Chabwela, 1994).
The locations visited were chosen because they were in the path of several cyclones that hit Zimbabwe. Cyclone Idai in 2019 was the most recent and notable of these. The Ngangu landslide deposition point, Nyahode Bridge, Rutsitu River, Musangazi River, and St Charles school were all points of interest in observing the visual impression of the remnants of the cyclone disaster. These sample points were chosen because various indicators of the occurrence of Cyclone Idai (2019) are still present.
The first data collection campaign was from the 23–25th September 2022 and involved the collection of GPS coordinates of locations of interest, as well as the identification of cyclone indicators of a cyclone path such as landslide scars and deposition, destruction of weirs and communication infrastructure such as roads, and bridges, and property damage.
In this study, the National Oceanic and Atmospheric Administration (NOAA) IBTrACS dataset (Knapp et al., 2010; Kumar et al., 2023) was used. The IBTRACs is a centralized repository for TC best track data from all TC warning centers worldwide, and it can be used to investigate the global distribution, frequency, duration, size, and intensity of TCs. The SWIO's 3 h tropical cyclone location and maximum sustained surface wind (MSW) data from the Japan Meteorological Administration (JMA), and the US Joint Typhoon Warning Center (JTWC) were used for this analysis (Kabir et al., 2020). The IBTrACS dataset contains the historical record of a tropical cyclone in terms of its ocean basin, time, latitude, longitude, pressure, wind speed, distance to land, category, distance, and direction between the successive locations of a TC at 3 h intervals (Kumar et al., 2023). On a 6-h basis, the term “best track” refers to the best estimate of the TC's location, maximum sustained winds, central pressure, and other parameters (at 00, 06, 12, and 18 UTC) during a TC's lifetime (Kruk et al., 2010).
Landsat data was used for calculating spectral indices. Satellite data was downloaded from: https://earthexplorer.usgs.gov/. All images were collected pre and post the cyclonic episodes when cloud cover was below 30%. This study used Landsat pictures to do geographic analysis (Rahaman and Esraz-Ul-Zannat, 2021). This time period allowed for the avoidance of cloud contamination as well as the reduction of seasonal phenological changes in vegetation (Sharma et al., 2022).
Data obtained from Landsat 7 Enhanced Thematic Mapper Plus (ETM+), which was launched on the April 15, 1999 (Chittumuri et al., 2023). A panchromatic band with a spatial resolution of 15 meters, an inbuilt full aperture solar calibrator and 5% absolute radiometric calibration, and a thermal infrared channel with four times the spatial resolution of Thematic Mapper (TM) are among the main characteristics of Landsat 7. Table 1 shows data acquisition for images used in the study.
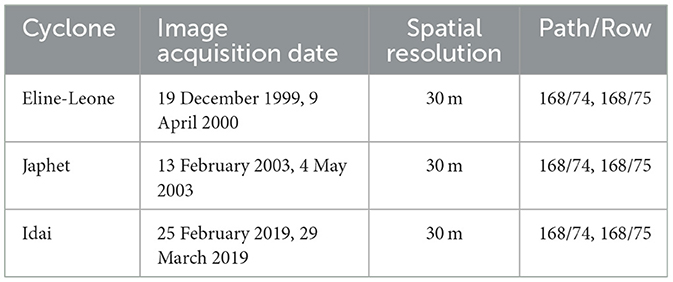
Table 1. Data acquisition from Lnadsat 7.
As part of the pre-processing of the Landsat pictures, atmospheric and radiometric flaws were removed. To cover the research area, Landsat tiles 74 and 75 were required. As a result, layer stacking on the bands of the pictures in ArcGIS Pro was required. The images were then mosaiced.
Tropycal is an open-source Python library and package and was used to simplify the process of retrieving and analyzing tropical cyclone data (Burg and Lillo, 2021). The package is capable of reading tropical cyclone tracks in real time from the International Best Track Archive for Climate Stewardship (IBTrACS) merged with the Neumann reanalysis dataset from 1941 to 2022 in the Southwest Indian Ocean (Burg and Lillo, 2021).
Is the library provides functionality for working with tropical cyclone data by retrieving, manipulating, analyzing, and visualizing it. Tropycal performs a variety of functions, including data retrieval from meteorological agencies and research institutions that collect data on tropical cyclones from a variety of sources, such as weather satellites, weather radar, aircraft reconnaissance, and ground-based weather stations. These data sources contain information about tropical cyclones' location, intensity, wind speed, and other characteristics.
Tropycal Data Manipulation provides tools for altering, preparing, and gaining insights from tropical cyclone data. Features including handling missing or incorrect data, translating formats, and filtering and subsetting data based on criteria are all included. Tropycal enables data analysis through computations of cyclone features and estimation of factors using statistical approaches or algorithms. It also facilitates geospatial visualization using libraries such as Cartopy and Matplotlib, allowing for the creation of maps and plots showcasing cyclone trajectories, strength, size, and other relevant data. Customization options for visual components enhance the display of data, including color schemes, labels, legends, and map projections.
The Saffir-Simpson Hurricane Wind Scale (SSHWS) is used to indicate the strength of an oncoming TC. The scale categories TCs into five groups depending on wind speed. TCs with winds of 150 mph or more (strong Category 4 and Category 5) are classified as super cyclones by the Joint Typhoon Warning Center (JTWS), although all tropical cyclones can be dangerous (Schott et al., 2019). The Saffir-Simpson Hurricane Wind Scale estimates the potential for property damage. Despite having extremely severe gusts, Category 1 TCs will cause minimal damage. A Category 5 cyclone, on the other hand, will cause catastrophic destruction (Camelo and Mayo, 2021).
Change detection is one of the most effective techniques for providing an overview of post-disaster impact and recovery using multi-date moderate to very high spatial resolution satellite imagery that can be performed in a simple and straightforward manner (Lu et al., 2004; Hoque et al., 2018). Change detection is used to distinguish differences in the state of an object or phenomenon observed at two different times (Martino et al., 2009). In satellite image-based change detection analysis for tropical cyclone impact assessment and recovery, there are two mainstream approaches: pre-classification change detection and post-classification change detection (Hussain et al., 2013; Joyce et al., 2018).
The NDVI, MNDWI, Modified soil adjusted vegetated Index (MSAVI), Normalized Difference Built-up Index (NDBI), Vegetation temperature condition index (VTCI), and Normalized Difference Water Index (NDMI) are spectral indices used for various applications. NDVI measures vegetation health by analyzing near-infrared and red reflectance values. Table 2 shows the indices formulas and the thresholds used in the study. MSAVI reduces soil influences on vegetation spectra. VTCI is used to determine stress on vegetation caused by temperatures and excessive wetness. NDBI detects urban changes based on the spectral response of built-up areas. MNDWI enhances water extraction from built-up regions. NDMI distinguishes water bodies by comparing NIR and SWIR reflectance values. These indices provide valuable insights for environmental studies, land-use and land-cover analysis, and water mapping.
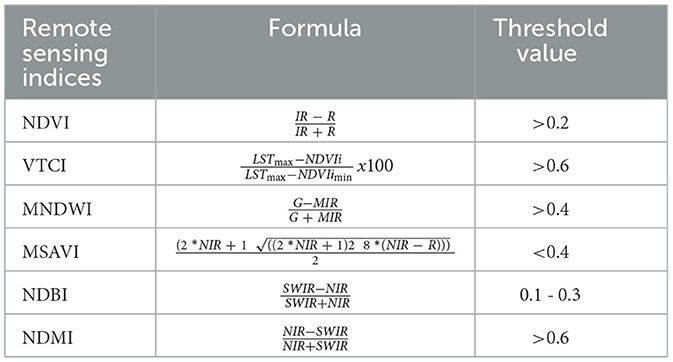
Table 2. Remote sensing indices and their threshold values (edited from source: Tauhid Ur Rahman and Ferdous, 2019).
The Operations Dashboards in ArcGIS Online provide customizable web applications for real-time visualization of resources, people, natural disasters, and events. These dashboards utilize graphs, gauges, maps, and other visual elements to monitor status, trends, and facilitate decision-making. The dashboard is structured into four layers: Data Preparation, Data Management, Methodology, and Application. The Data Preparation layer involves gathering and formatting data from various sources, including Esri Shapefiles and CSV files, as well as accessing data from the ArcGIS Living Atlas. The Data Management layer handles the organization and storage of uploaded data in ArcGIS Online Content. The Methodology layer focuses on functionality and user interface design, offering basic and composite functions for data interaction, visualization, and feature selection. The Application layer integrates all components, enabling geovisualization, spatiotemporal visualization, and interactive access to information on cyclone-affected areas, previous events, and fatalities.
A gridded analysis is performed with the construction of a 1-degree grid. Figure 2 is a plot of the maximum sustained wind recorded at each grid point. The highest maximum sustained wind (253.72–370.4 km/h) in the Southwest Indian Ocean (SWIO) is being experienced in 50°E and 90°E. Most of the maximum sustained wind experienced are classified as a Tropical Depression, Tropical Storm and a Category 1 cyclone. With the lowest maximum sustained wind being of the Category 5 cyclone.
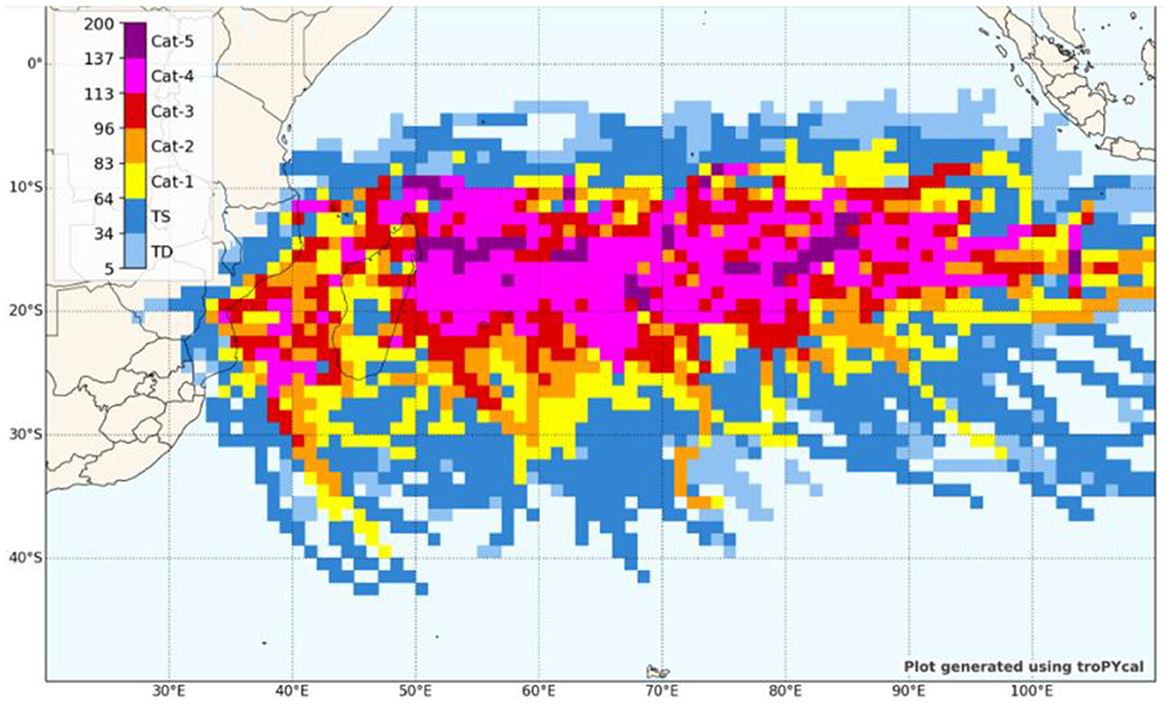
Figure 2. SWIO Average wind (km/h) for 1945–2022.
Figure 3 displays the number of storms in the SWIO for the period 1945 to 2022. The total number of cyclones within the region is estimated to be 865. The highest number of cyclones being experienced range between 45 to 50 storms and are located between the latitudes 40°E and 90°E. In the Eastern Highlands of Zimbabwe an estimated 5 cyclones have affected the area between 1945 and 2022.
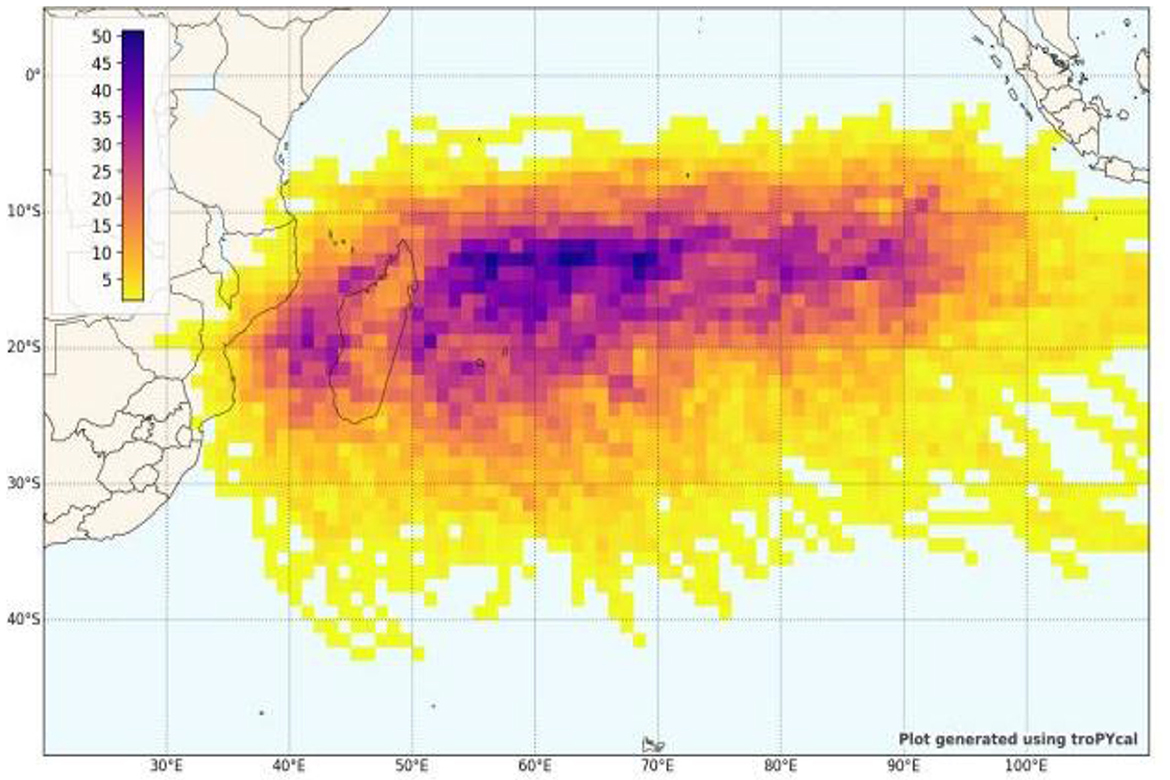
Figure 3. Number of storms in the SWIO for 1945–2022.
When the threshold is applied (≥37.04 km/h over 24 h) on the plot of total number of cyclones within the region the total number of rapidly intensifying storms per 1° grid box reduces significantly. The number of storms has significantly decreased with the increase in wind speed. The higher wind speed being experienced between latitudes 40°E and 90°E.
Figure 4 is a seasonal plot of TCs in the SWIO for the 1999–2000 season. A total of 10 TCs were observed in the basin and they were all named. Three of them were classified as Major TCs namely, cyclones Connie, Leone-Eline and Huddah which were given a category 4 classification. The Cyclone Leone-Eline was the only one to make landfall In Zimbabwe during the season.
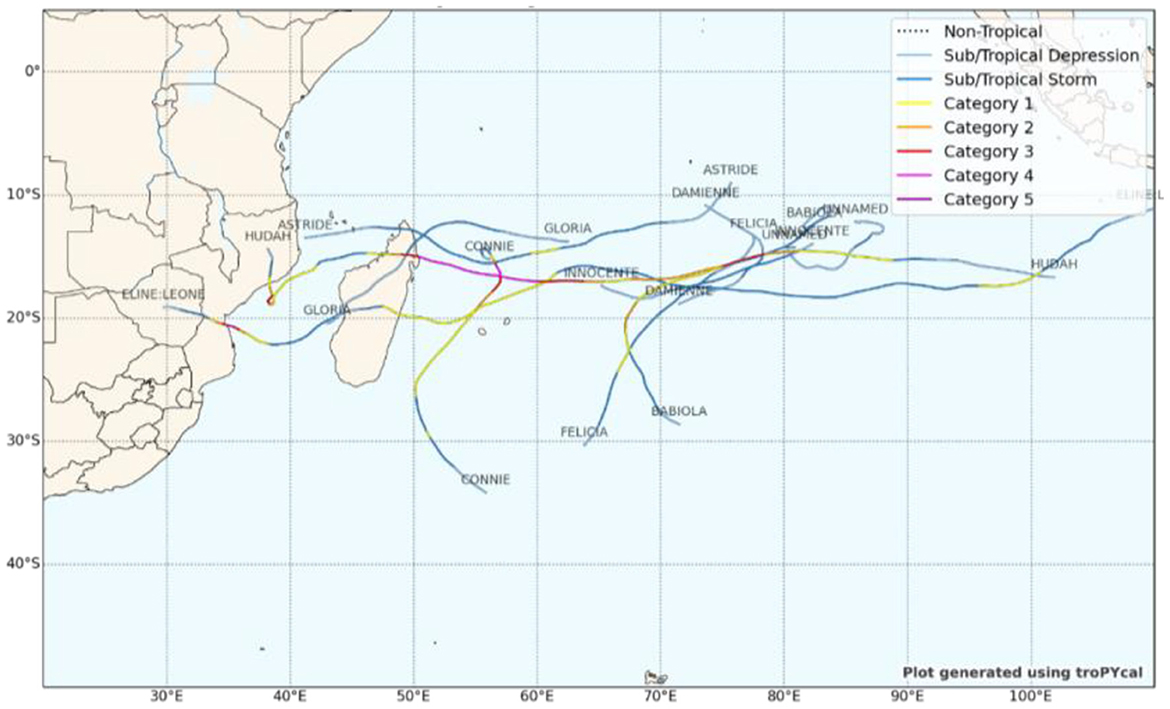
Figure 4. The 1999–2000 South Indian TC season.
The 2002–2003 season depicted in Figure 5 shows the occurrence of a total of 14 Storms, 13 of which were named. Météo-France, the meteorological agency in charge of designating cyclones in the SWIO, uses a specified set of criteria These criteria include intensity, which typically corresponds to when the cyclone's maximum sustained winds reach or are forecasted to reach 62 kilometers per hour, impact, which is expected to be potentially significant, and forecast track if it is expected to track within Météo-France's area of responsibility (World Meteorological Organization Tropical Cyclone Programme, 1983; Kuleshov, 2014). In the 2002–2003 season, 3 were also classified as Major TCs. These cyclones were Gerry Japhet and Kalunde, with cyclone Japhet making landfall in the study area.
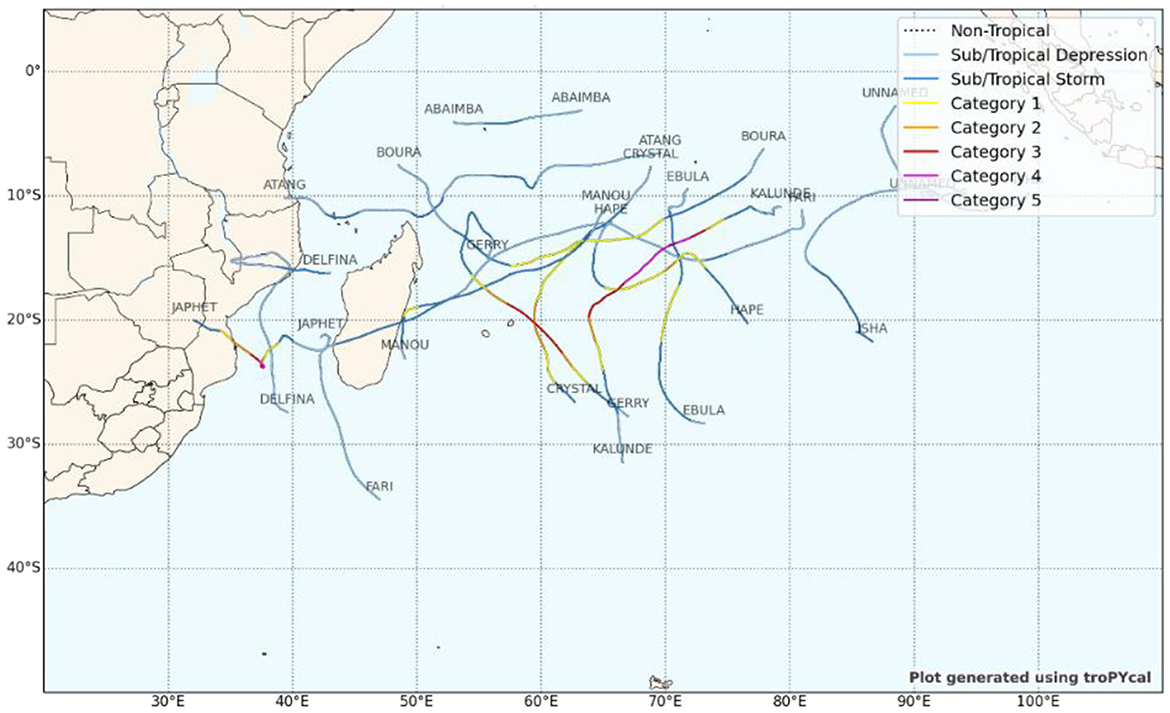
Figure 5. The 2002–2003 South Indian TC season.
Figure 6 shows the results for the 2018–2019 Season plot. This season had the highest total number of storms with 15, 14 of which were named and 11 being classified as Cyclones. 9 of these cyclones were classified as being major cyclones namely cyclones Alcide, Kenanga, Cilida, Gelena, Funani, Haleh, Idai, Joaninha, and Kenneth.
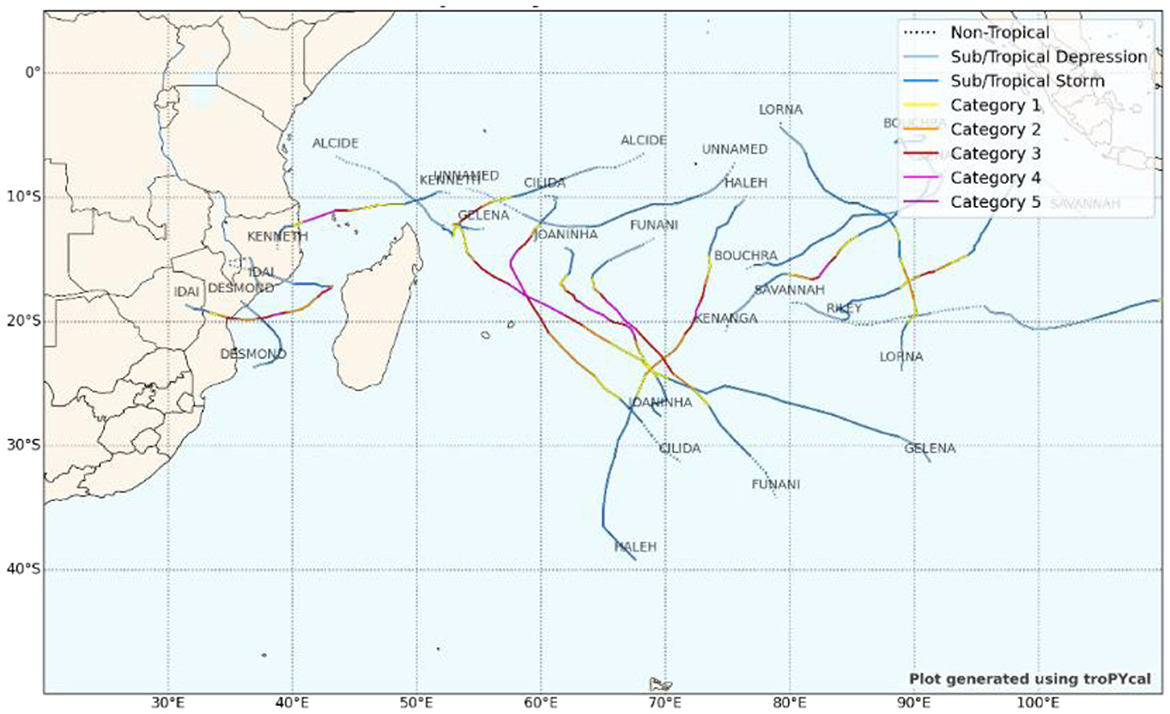
Figure 6. 2018–2019 South Indian TC season.
There is seen to be in increase in the number of TCs being observed in the basin throughout the years from the 10 recorded in the 1999–2000 season and the 15 recorded in the 2018–1019 season. The increase in in the TCs has also led to an increase in the intensities of the cyclones being experienced on season experiencing 9 major cyclones.
There has been recent evidence of increasing TC intensity in the South-West Indian Ocean basin, this increase has been linked to climate change and there is growing confidence that this trend will continue during the next century (Thompson et al., 2021). According to Vidya et al. (2020), the frequency and intensity of cyclones are directly related to rising sea surface temperatures (SSTs). Hence, the mapping of Historical TC occurrences is critical for disaster prevention since serious floods or landslide events are typically connected with heavy rainfall induced by the events (Jian et al., 2023).
A climatological analysis (Figure 7) exhibits the climatological correlation and distribution of wind and minimum mean sea level pressure (MSLP) of Cyclone Idai (2019). A TC's intensity has a direct relation to its central pressure; the lower the pressure, the more powerful the storm and its maximum sustained winds. Cyclone Idai began its life cycle with fairly typical wind-MSLP relationship, but ended up toward the end of the life cycle with an unusually high MSLP given the sustained wind speeds while maintaining its size.
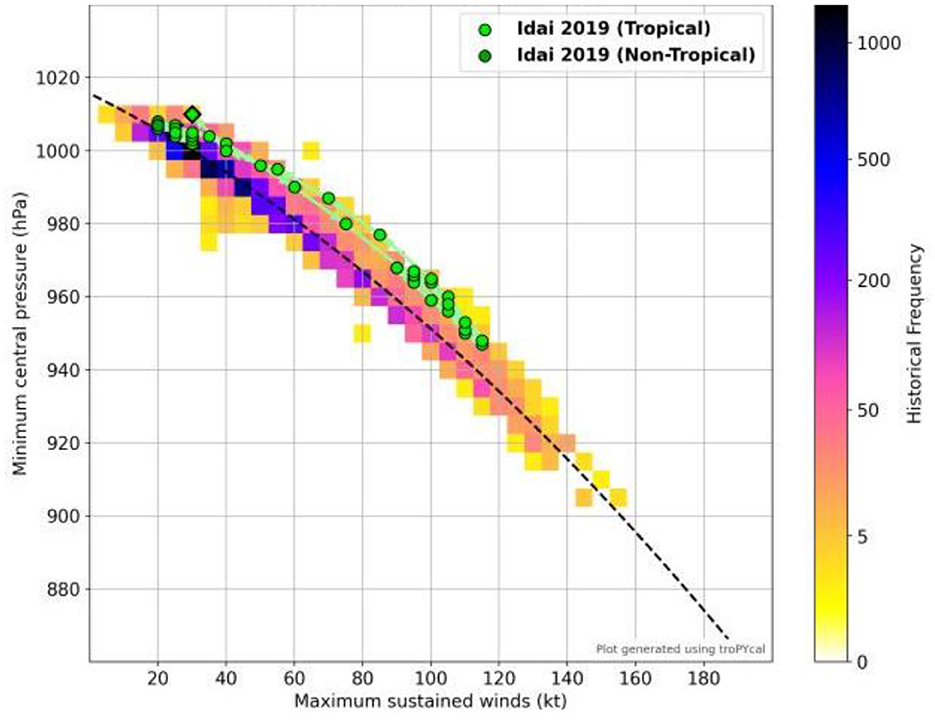
Figure 7. Tropical cyclone pressure vs. wind for cyclone Idai (2019).
Cyclone Idai had sustained winds of up to 119 km/h and a minimum mean central pressure of about 942 hPa as generated by the TroPYcal package, which would have classified the cyclone as a category 1 cyclone according to the Saffir Simpson Scale. However, this was significantly lower than the sustained winds of 160–180 km/h that were reported by categorizing the cyclone as a category 3 (Probst and Annunziato, 2019).
Figure 8 depicts the climatological correlation and distribution of Cyclone Freddy's maximum sustained wind and minimum mean sea level pressure (MSLP). (2023). The minimum sea level pressure (MSLP), which can be observed from aircraft reconnaissance flight level or measured directly using surface or dropwindsonde, is possibly the most accurate and dependable metric of tropical cyclone (TC) intensity. The destructive potential of TCs, on the other hand, is more closely tied to the maximum wind speed at or near the surface (Knaff and Zehr, 2007). The lowest central pressure was around 978 hPa, while the greatest sustained wind was an estimated 102 km/h, classifying the weather phenomenon as a Category 1 storm. This is significantly different from the Category 5 category that the cyclone received based on the observed 270 km/h sustained winds. The TroPYcal package appears to underestimate the intensity of the cyclones.
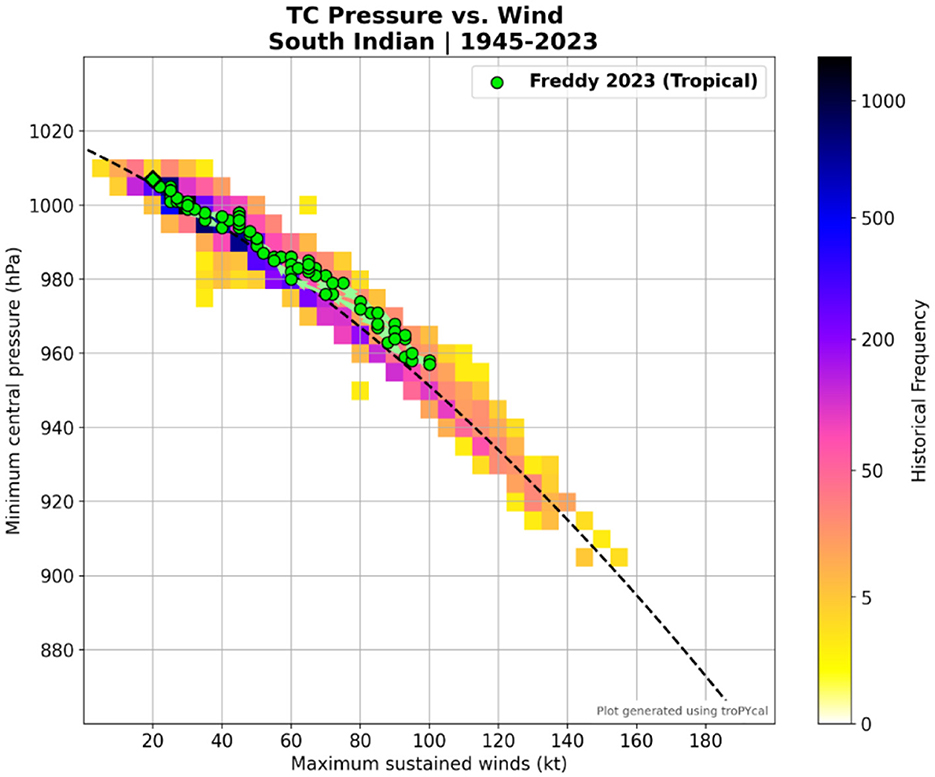
Figure 8. Tropical cyclone pressure vs. wind for cyclone Freddy (2023).
Various change detection analysis methods have been used in this study. The NDVI, MSAVI, NDMI and NDBI are performed on the pre- and post-disaster images of cyclones Japhet, Leone-Eline and Idai. The extent and magnitude of vegetation, aquatic bodies, and built-up areas were measured using indices (Rahaman and Esraz-Ul-Zannat, 2021). Due to the ease of use and availability of remote sensing, spectral indices have the potential to transform the way emergency planners prepare for and undertake variability mapping and damage assessments.
NDVI has been used to identify healthy vegetation areas from satellite images, and the threshold value for NDVI is 0.2, as values greater than this value indicate vegetation areas (Rahaman and Esraz-Ul-Zannat, 2021). The results showed a highest degree of change was detected by the significant abrupt decrease of approximately 16.68% in vegetated areas after the occurrence of cyclone Idai with a subsequent increase an estimated 11.68% in barren land. Table 3 shows cyclone Eline having significant increase in barren land of about 12.43% which corresponds to the 6.36% loss in dense vegetation and 17.85% loss in sparse vegetation. Cyclone Japhet experienced the least disruption with approximately 2.19% increase in barren land and about 2.46% loss in vegetation.
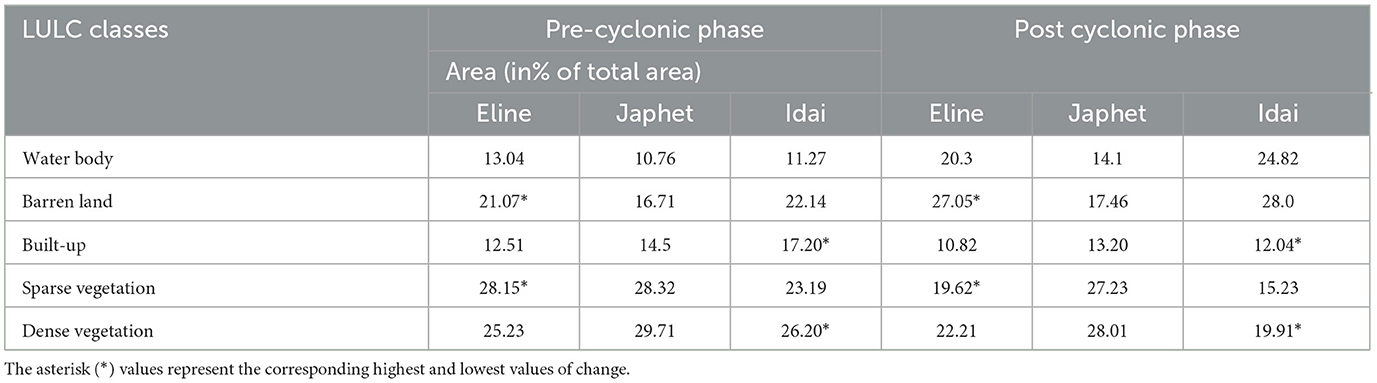
Table 3. NDVI statistics of the eastern highlands.
This destruction increases overall runoff load (Figure 9), the potential for increased flood hazards, and more sediments due to water erosion on hillslopes and rivers, which increases net soil erosion and water turbidity, resulting in reduced water quality and increased sediment load in surface waters in the watershed.

Figure 9. Cyclone Idai NDVI spatiotemporal pattern (A) Pre-cyclone; (B) Post cyclone.
The VTCI method results represented the sensations of heat that cause arduous effect and the identification of flooding occurrences across the study area. The soil moisture is an indication of the cyclonic flooding influence over the region. The results for the VTCI depict the flooding in the region (Table 4). The highest wetness post-cyclone was observed after cyclone Eline with 0.91 with the cyclone Japhet being the lowest observed with a VTCI of 0.74. These results also reflected the intensity of the cyclones. These results also correspond to the MNDWI and NDMI that show an increase in the water content of the affected areas.
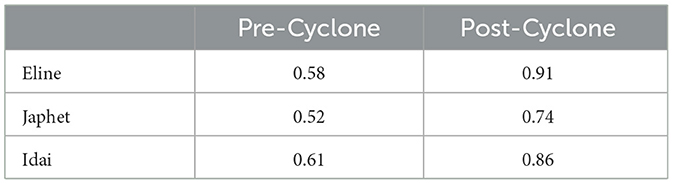
Table 4. VTCI statistics of the eastern highlands.
MSAVI can be used when it is important to reduce the influence of soil background and improve the dynamic range of plant signal, allowing for better detection of changes that have occurred. The MSAVI results indicate a negative change, which might be attributed to flooding generated by the cyclone due to destruction of vegetative cover. The MSAVI results (Figure 10) are consistent with the NDVI in that they show a decrease in vegetative cover and an increase in bare soils. The largest changes detected.
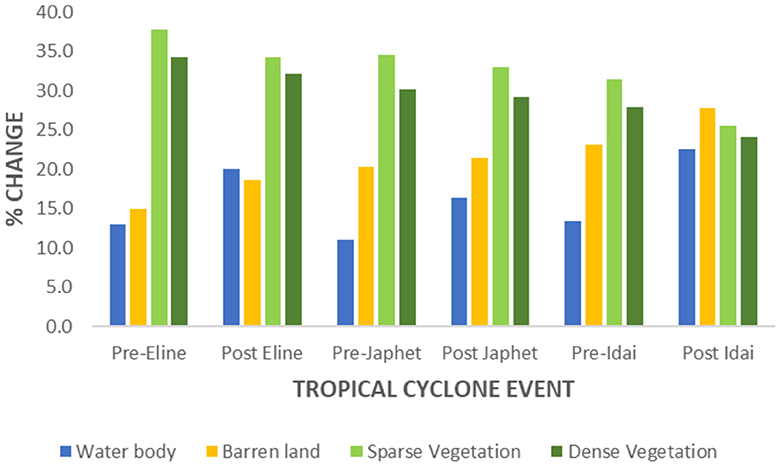
Figure 10. MSAVI statistics for the Eastern highlands.
The results suggest that cyclone Idai destroyed around 6.03% of the sparse vegetation, the largest percentage of the three cyclones, as well as a 3.81% loss in dense vegetation and a 4.69% rise in bare land. Cyclone Leone-Eline caused a small decrease in vegetative loss, with 61% in sparse vegetation, 2.04% in dense vegetation, and 3.60% in barren land. Cyclone Japhet caused the least amount of change, with 1.55% loss in sparse vegetation and 1.12% increase in bare land.
The NDWI analysis results (Table 5) show that there was an accumulation of inundated areas. Cyclone Idai showed the highest increase in moisture content with an increase of 15.11% and a corresponding decrease in dry areas of about 15.11% Cyclone Leone-Eline had an estimated increase 13.77% decrease in dry areas, and Cyclone Japhet had the least amount of inundation with about 8.46%.
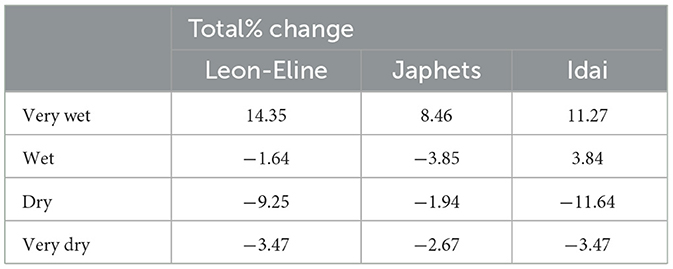
Table 5. NDWI statistics of the Eastern highlands.
Figures 11, 12 shows the increase in water content after the occurrence the TCs and the subsequent decrease in vegetated and built-up areas after the MNDWI is calculated. MNDWI increased the high reflectance of water by using Green wavelength and decreased the low reflectance of water features by using Mid-infrared wavelength. On this index, water area has high positive values, whereas other vegetation, soil, land area, and non-water area have zero to negative values (Halder et al., 2022).
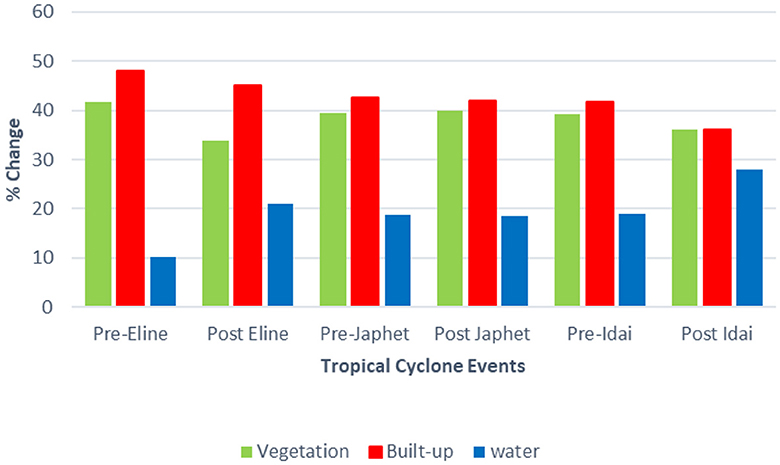
Figure 11. MNDWI statistics for the Eastern highlands.
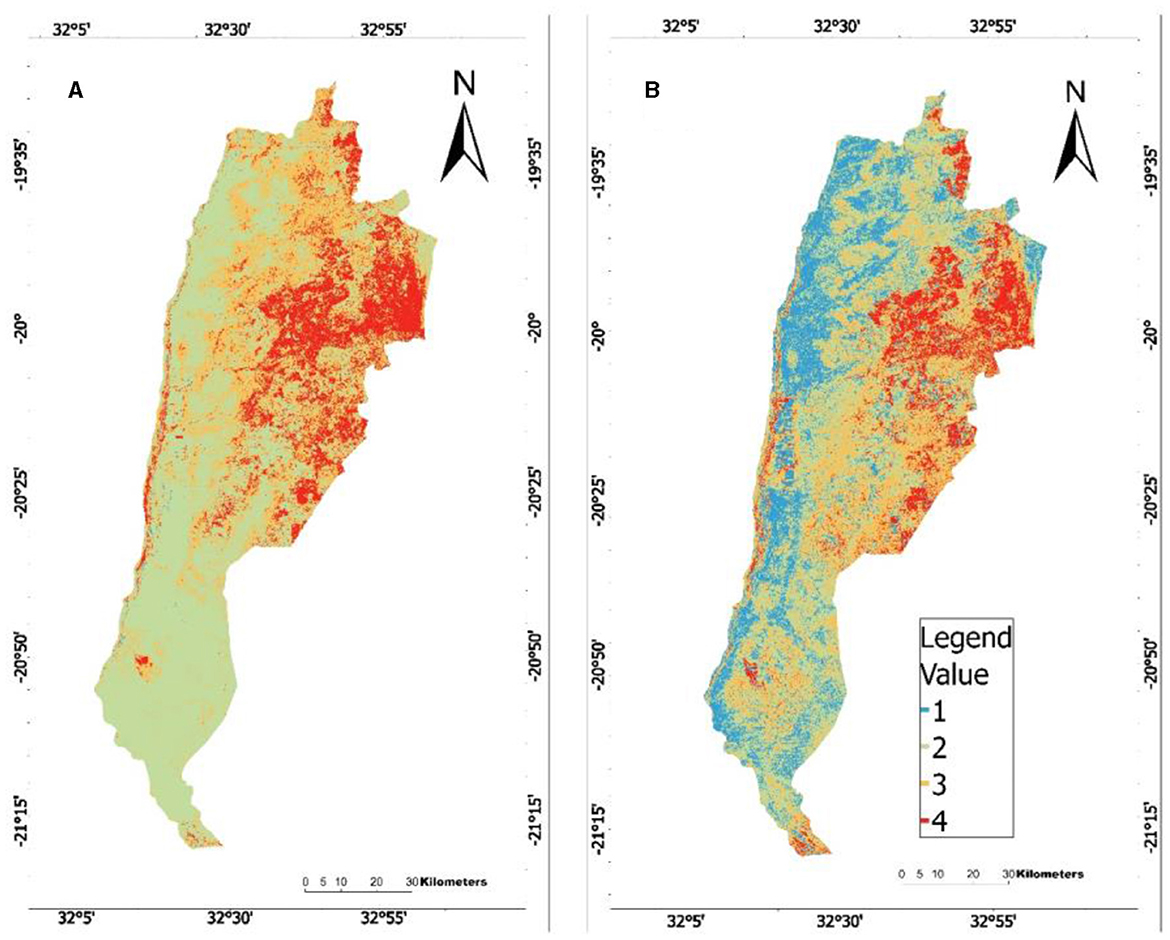
Figure 12. Cyclone Eline NDMI spatiotemporal pattern (A) Pre-cyclone; (B) post cyclone.
Cyclone Eline had the highest increase in water content at an estimated 10.74%. cyclone Idai resulted in about 8.98% increase and Japhet had an increase of approximately 1.9%. The increase in water content is an indication of the waterlogged areas due flooding.
However, the MNDWI Indices underestimates the vegetation loss caused by the TCs compared to the results for the NDVI results with Cyclone Idai, Japhet and Eline experiencing a decrease of 3.14%, 0.42%, and 7.91% respectively.
This can have negative environmental consequences such as soil and bank erosion, bed erosion, siltation, or landslides. It can cause vegetation damage, and pollutants carried by flood water can have an impact on water quality infrastructure damage. The results also correspond to those of the NDMI, which show a significant increase in the amount of moisture available.
The NDMI analysis results show that there was an accumulation of inundated areas. Cyclone Idai showed the highest increase in moisture content with an increase of 15.11% and a corresponding decrease in dry areas of about 15.11% Cyclone Leone-Eline had an estimated increase 13.77% decrease in dry areas, and Cyclone Japhet had the least amount of inundation with about 8.46%. The NDWI also provides an indication of which areas are likely to flood in the event of heavy and continuous rains. According to the analysis, areas along the river course, streams, and water surfaces are vulnerable to flooding (Twumasi et al., 2022). The NDMI of Cyclone Eline (Figure 12) shows a significant increase in vegetation water content after the event.
NDBI is a useful indice for identifying built-up areas from satellite images, with NDBI values ranging from 0.1 to 0.3 (Figure 13). After the occurrence of cyclone Idai, there is a significant decrease in the built-up environment as indicated by the NDBI. There was a significant decrease in the built-up area after cyclone Idai occurred. An estimated 13.725% decrease in infrastructure was experienced within the area. Ngangu in Ward 15 and Kopa in Ward 21 were the areas that suffered severe damage to infrastructure. There was also an estimated 11.30% decrease infrastructure was also experienced after the occurrence of cyclone Eline and the lowest decrease was from cyclone Japhet at approximately 5.25%. The incidence of cyclones may have been thought to be the cause of rising water depth in some locations. This has a wide range of socioeconomic consequences for health, politics, technology, social, economy, and education.
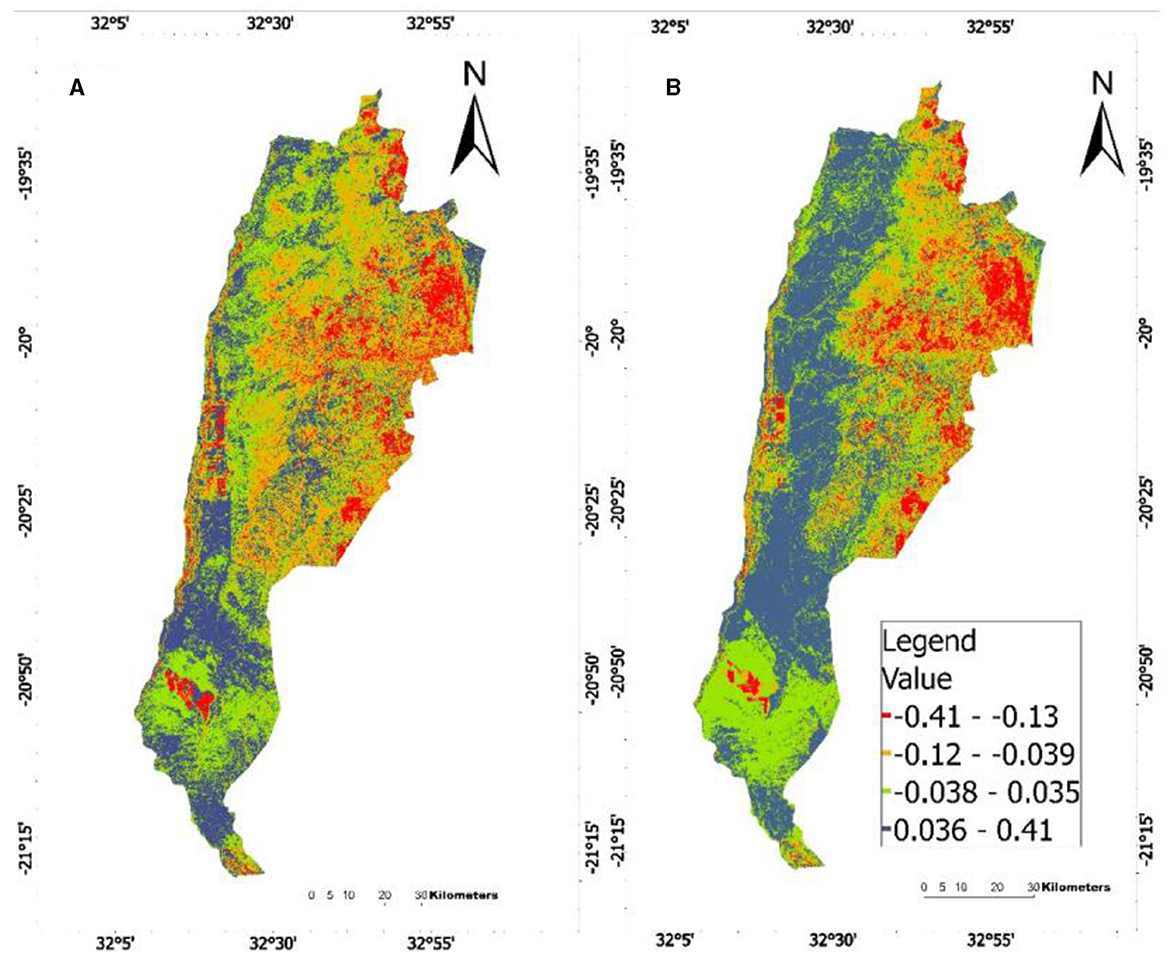
Figure 13. Cyclone Idai NDBI spatiotemporal pattern (A) Pre-cyclone; (B) post cyclone.
The Eastern Highlands Cyclone Dashboard was designed for a variety of stakeholders, including Eastern Highlands residents who are directly affected by the severe weather. The water managers or any other parties who are interested in the cyclonic events. When a user enters the interface, they can retrieve information on the most recent cyclone tracks, such as cyclone Freddy, and its route, as well as the affected locations in its path.
Figure 14 shows a geospatial dashboard which serves as a Disaster Management system for the Eastern Highlands of Zimbabwe. The objective of the platform is to provide the relevant stakeholders of affected TCs an overview of the impacts of TCs within the areas. In addition, people are given information regarding potential threats from current and future tropical cyclones. The Dashboard shows a map of the area it covers as well as statistics of previous cyclones such as the number of deaths, injuries and missing persons recorded.
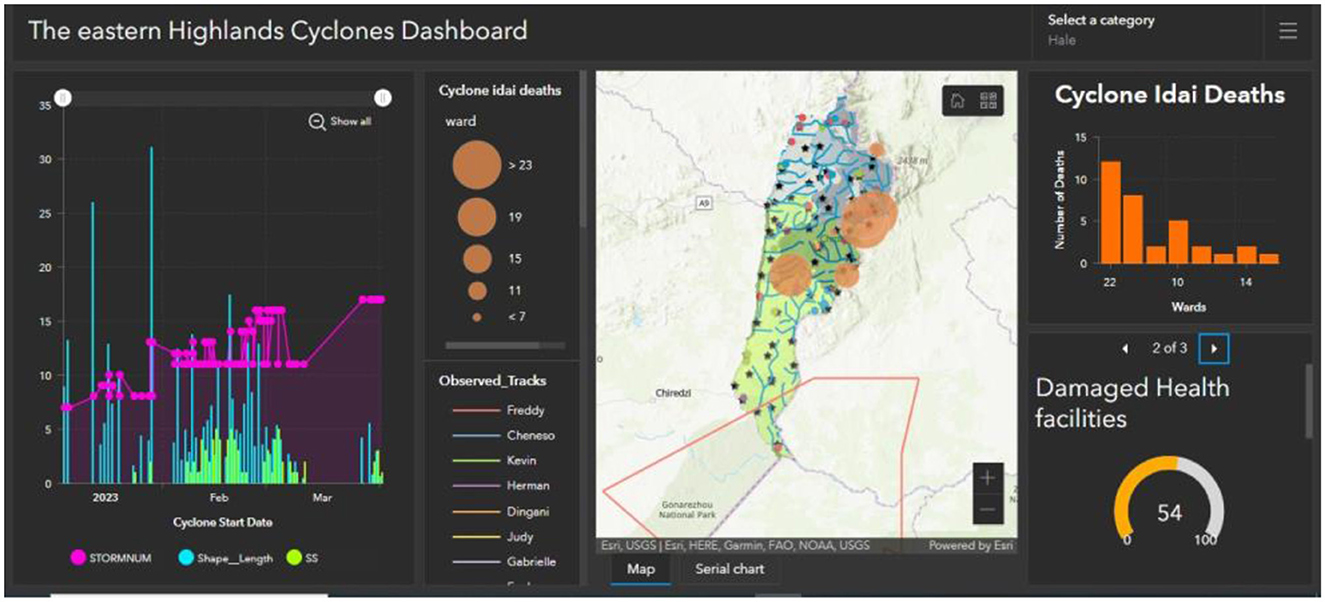
Figure 14. Operations Dashboard for the Eastern Highlands (link: https://www.arcgis.com/apps/dashboards/44858be328c9459d95cad2a995a79391).
A graph depicting the start dates of the TCs that occurred in the SWIO in 2023 is also included on the dashboard. The storm number (STORMNUM), which serves as the cyclone's identifier, the length of the cyclone, and the Saffir Simpsons scale value of the cyclone event.
Cyclone Freddy information that can be accessed by means of the Dashboard. The data includes the start and end dates of the Cyclone's Saffir Simpson scale (SS) at that location. The storm classification (STORMTYPE) also refers to the intensity of the cyclone at that time. This enables dashboard users to determine the strength of the cyclone in affected wards.
Another function of the Dashboard is a graph displaying historical data on cyclone Idai deaths which interacts with the map in the dashboard. The Deaths are recorded by wards and when selected, they zoom in to the ward and reveal the ward information and the number of deaths in the area.
In conclusion, this study highlights the feasibility and importance of utilizing satellite data for mapping the comparative variability of tropical cyclones (TCs) in the Chimanimani and Chipinge Districts. The findings reveal an increasing frequency and intensity of TCs in the Southwest Indian Ocean (SWIO) region. The NDVI and MSAVI indices provide valuable insights into the extent of vegetation damage caused by cyclones, with Cyclone Idai being the most destructive. The Operational Dashboard emerges as a crucial tool for disaster management, enabling stakeholders to identify and prepare areas at high risk of TC impacts. This study contributes to the understanding of TC patterns and facilitates informed decision-making for mitigating future cyclonic events. Further research and continuous monitoring are recommended to enhance the effectiveness of TC mapping and risk assessment strategies.
1. Long-term monitoring systems and trend analysis using spectral indices to track and analyze cyclone damage trends over time. This can contribute to a better understanding of the evolving patterns and impacts of cyclones.
2. Satellite imagery of higher resolution is important better definition of variability in areas that get affected by TCs.
3. Development of damage severity indices that can quantitatively assess the severity levels of cyclone damage, enabling prioritization of response and recovery efforts.
4. Application of machine learning techniques to automate the detection and classification of cyclone damage using spectral indices.
5. Integrating climate change projections into cyclone damage assessment methodologies. In cooperating future climate scenarios, including changes in cyclone intensity, frequency, and tracks, to better understand the potential impacts of climate change on cyclone-induced damage.
Publicly available datasets were analyzed in this study. This data can be found at: https://earthexplorer.usgs.gov/, https://www.ncei.noaa.gov/products/international-best-track-archive, and https://tropycal.github.io/tropycal/index.html.
M-GH: Data curation, Investigation, Methodology, Visualization, Writing – original draft. WG: Conceptualization, Supervision, Writing – review & editing. OM: Supervision, Writing – review & editing. DR: Supervision, Writing – review & editing.
The author(s) declare financial support was received for the research, authorship, and/or publication of this article. OWASA team provided financial support in carrying out the project.
I would like to express my heartfelt gratitude to the OWASA team for their financial assistance in carrying out the research project. I would also like to appreciate the opportunity I received from WaterNet to present my research at the 23rd WaterNet/WARFSA/GWP-SA Symposium on Integrated Water Resources Management for Sustainable Development in Eastern and Southern Africa.
The authors declare that the research was conducted in the absence of any commercial or financial relationships that could be construed as a potential conflict of interest.
All claims expressed in this article are solely those of the authors and do not necessarily represent those of their affiliated organizations, or those of the publisher, the editors and the reviewers. Any product that may be evaluated in this article, or claim that may be made by its manufacturer, is not guaranteed or endorsed by the publisher.
Ahammed, K. B., and Pandey, A. C. (2021). Characterization and impact assessment of super cyclonic storm AMPHAN in the Indian subcontinent through space borne observations. Ocean Coast. Manage. 205, 105532. doi: 10.1016/j.ocecoaman.2021.105532
Blake, H., Bermingham, F., Johnson, G., and Tabner, A. (2020). Mitigating the psychological impact of COVID-19 on healthcare workers: a digital learning package. Int. J. Environ. Res. Public Health. 17:2997. doi: 10.3390/ijerph17092997
Burg, T., and Lillo, S. P. (2021). “Tropycal: A Python package for analyzing tropical cyclones and more,” in 34th Conference on Hurricanes and Tropical Meteorology (AMS).
Camelo, J., and Mayo, T. (2021). The lasting impacts of the saffir-simpson hurricane wind scale on storm surge risk communication: the need for multidisciplinary research in addressing a multidisciplinary challenge. Weather Clim. Extr. 33, 100335. doi: 10.1016/j.wace.2021.100335
Chabwela, H. N. (1994). “Current threats to the wetlands of Zimbabwe,” Wetlands Ecology and Priorities for Conservation in Zimbabwe Gland, eds T. Matiza and S. A. Crafter (Geneva: IUCN).
Chatiza, K. (2019). Cyclone Idai in Zimbabwe: an analysis of policy implications for post-disaster institutional development to strengthen disaster risk management. doi: 10.21201/2019.5273
Chiimba, E. G., and Verne, J. (2022). Disaster communication beyond the state? Community organisations, informal information flows and the mediation of (mis)trust before and after Cyclone Idai in Zimbabwe. Int. J. Disaster Risk Reduct. 76, 103012. doi: 10.1016/j.ijdrr.2022.103012
Chittumuri, I., Rogers, S., Tesfayi, N., and Uniyal, N. (2023). Georgia Disasters: Evaluating the Impacts of Hurricane Irma on Georgia Heirs' Property Owners Using NASA Earth Observations.
Dube, K., and Nhamo, G. (2021). Tropical cyclones as an emerging global disaster risk and management issue. Cycl. Southern Africa Found. Fund. Topics 4, 3–16. doi: 10.1007/978-3-030-74262-1_1
Eberenz, S., Lüthi, S., and Bresch, D. N. (2021). Regional tropical cyclone impact functions for globally consistent risk assessments. Nat. Hazards Earth Syst. Sci. 21, 393–415. doi: 10.5194/nhess-21-393-2021
Halder, B, Jatisankar, B., Haitham Abdulmohsin, A., Maryam, H., Naser, S., Ali, A., et al. (2022). Delineating the crop-land dynamic due to extreme environment using landsat datasets: a case study. Agronomy 12:1268. doi: 10.3390/agronomy12061268
Hendricks, E., Wu, L., Wu, C.C., Didlake, A., and Wang, Y., (eds.). (2023). Tropical cyclone intensity and structure changes: theories, observations, numerical modeling and forecasting. Front. Earth Sci. 11:1275804. doi: 10.3389/feart.2023.1275804
Hoque, M. A. A., Phinn, S., Roelfsema, C., and Childs, I. (2018). Modelling tropical cyclone risks for present and future climate change scenarios using geospatial techniques. Int. J. Digit. Earth 11, 246–263. doi: 10.1080/17538947.2017.1320595
Hussain, M., Chen, D., Cheng, A., Wei, H., and Stanley, D. (2013). Change detection from remotely sensed images: From pixel-based to object-based approaches. ISPRS J. Photogramm. Remote Sens. 80, 91–106. doi: 10.1016/j.isprsjprs.2013.03.006
Jian, W., Lo, E. Y. M., Stojanovski, P., and Pan, T. C. (2023). Quantifying uncertainties in tropical cyclone wind hazard assessment due to synthetic track stochastic variability for Southeast Asia. Wea. Clim. Extrem. 41:100599. doi: 10.1016/j.wace.2023.100599
Jin, Q., Fan, X., Liu, J., Xue, Z., and Jian, H. (2020). Estimating tropical cyclone intensity in the South China Sea Using the XGBoost model and FengYun satellite images. Atmosphere 11:423. doi: 10.3390/atmos11040423
Joyce, J., Chang, N. B., Harji, R., et al. (2018). Cascade impact of hurricane movement, storm tidal surge, sea level rise and precipitation variability on flood assessment in a coastal urban watershed. Clim Dyn 51, 383–409. doi: 10.1007/s00382-017-3930-4
Kabir, M. J., Salam, M. A., Omar, M. I., Sarkar, M. A. R., Rahman, M. C., Chowdhury, A., et al. (2020). Impact of Super Cyclone Amphan on Agriculture and Farmers' Adaptation Strategies in the Coastal Region of Bangladesh. Available online at: http://hdl.handle.net/10419/243315
Knaff, J. A., Sampson, C. R., and Chirokova, G. (2017). A global statistical-dynamical tropical cyclone wind radii forecast scheme. Wea. Forecasting 32, 629–644. doi: 10.1175/WAF-D-16-0168.1
Knaff, J. A., and Zehr, R. M. (2007). Reexamination of tropical cyclone wind-pressure relationships. Weather Forecast. 22, 71–88. doi: 10.1175/WAF965.1
Knapp, K. R., Kruk, M. C., Levinson, D. H., Diamond, H. J., and Neumann, C. J. (2010). The International Best Track Archive for Climate Stewardship (IBTrACS): unifying tropical cyclone data. Bull. Am. Meteorol. Soc. 91, 363–376. doi: 10.1175/2009BAMS2755.1
Knutson, T. R., Chung, M. V., Vecchi, G., Sun, J., Hsieh, T.-L., and Smith, A. J. P. (2021). “ScienceBrief Review: Climate change is probably increasing the intensity of tropical cyclones,” in Critical Issues in Climate Change Science, eds. C. L. Quéré, P. Liss, and P. Forster. https://doi.org/10.5281/zenodo.4570334
Kossin, J., Emanuel, K., and Vecchi, G. (2014). The poleward migration of the location of tropical cyclone maximum intensity. Nature 509, 349–352. doi: 10.1038/nature13278
Kossin, J. P. (2018). A global slowdown of tropical-cyclone translation speed. Nature 558, 104–107. doi: 10.1038/s41586-018-0158-3
Kossin, J. P., Knapp, K. R., Olander, T. L., and Velden, C. S. (2020). Global increase in major tropical cyclone exceedance probability over the past four decades. Proc. Natl. Acad. Sci. 117, 11975–11980. doi: 10.1073/pnas.1920849117
Kruk, M. C., Gibney, E. J., Levinson, D. H., and Squires, M. (2010). A climatology of Inland winds from tropical cyclones for the Eastern United States. J. Appl. Meteor. Climatol. 49, 1538–1547. doi: 10.1175/2010JAMC2389.1
Kuleshov, Y. (2014). “Climate change and southern hemisphere tropical cyclones international initiative–progress since the first international conference on indian ocean tropical cyclones and climate change,” in Monitoring and Prediction of Tropical Cyclones in the Indian Ocean and Climate Change. Dordrecht: Springer, 18–32.
Kumar, S., Biswas, K., and Pandey, A. K. Will a tropical cyclone make landfall? Neural Comput. Appl. 35, 5807–5818 (2023). doi: 10.1007/s00521-022-07996-7
Li, J., Peng, B., Wei, Y., and Ye, H. (2021). Accurate extraction of surface water in complex environment based on Google Earth engine and sentinel-2. PloS ONE 16, e0253209. doi: 10.1371/journal.pone.0253209
Lu, D., Mausel, P., Brondízio, E., and Moran, E. (2004). Change detection techniques. Int. J. Remote Sens. 25, 2365–2401. doi: 10.1080/0143116031000139863
Mansour, S. (2019). Geospatial modelling of tropical cyclone risks to the southern Oman coasts. Int. J. Disaster Risk Reduc. 40, 101151. doi: 10.1016/j.ijdrr.2019.101151
Marks, F., Kappler, G., and Demaria, M. (2002). Development of a Tropical Cyclone Rainfall Climatology and Persistence (R-CLIPER) Model.
Martino, L., Ulivieri, C., Jahjah, M., and Loret, E. (2009). “Remote sensing and GIS techniques for natural disaster monitoring,” in Space Technologies for the Benefit of Human Society and Earth, ed. P. Olla (Dordrecht: Springer). doi: 10.1007/978-1-4020-9573-3_14
Mavhura, E. (2020). Learning from the tropical cyclones that ravaged Zimbabwe: policy implications for effective disaster preparedness. Nat. Hazards 104, 2261–2275. doi: 10.1007/s11069-020-04271-7
Muchaka, F. A., Gumindoga, W., Meck, L. M., and Gwitira, I. (2022). Landslide susceptibility modelling in Nyahode and Buzi sub-catchments of Zimbabwe. Water Prac. Technol. 17, 1535–1552. doi: 10.2166/wpt.2022.069
Otto, F. E., Zachariah, M., Wolski, P., Pinto, I., Nhamtumbo, B., Bonnet, R., et al. (2022). Climate change increased rainfall associated with tropical cyclones hitting highly vulnerable communities in Madagascar, Mozambique & Malawi. Mozambique Malawi 41.
Potter, C. (2014). Global assessment of damage to coastal ecosystem vegetation from tropical storms. Remote Sens. Lett. 5, 315–322. doi: 10.1080/2150704X.2014.902546
Probst, P., and Annunziato, A. (2019). Tropical Cyclone IDAI: Analysis of the Wind, Rainfall and Storm Surge Impact. Brussels: European Commission Joint Research Center.
Rahaman, M., and Esraz-Ul-Zannat, M. (2021). Evaluating the impacts of major cyclonic catastrophes in coastal Bangladesh using geospatial techniques. SN Appl. Sci. 3, 1–21. doi: 10.1007/s42452-021-04700-7
Ramos-Scharrón, C. E., Arima, E. Y., and Hughes, K. S. (2022). An assessment of the spatial distribution of shallow landslides induced by Hurricane María in Puerto Rico. Phys. Geography 43, 163–191. doi: 10.1080/02723646.2020.1801121
Schott, T., Landsea, C., and Hafele, G. (2019). The Saffir–Simpson Hurricane Wind Scale (SSHWS). Miami, FL: US Department of Commerce. National Hurricane Center. National Oceanic and Atmospheric Administration (NOAA) factsheet.
Sharma, S., Rempei, S., Raghab, R., and Mohammad Shamim Hasan, M. (2022). “Successive Cyclones Attacked the World's Largest Mangrove Forest Located in the Bay of Bengal under Pandemic”. Sustainability 14:5130. doi: 10.3390/su14095130
Tauhid Ur Rahman, M., and Ferdous, J. (2019). “Detection of environmental degradation of Satkhira District, Bangladesh through remote sensing indices” in Lecture Notes in Civil Engineering, Vol. 9. ed. B. Pradhan (Singapore: Springer). doi: 10.1007/978-981-10-8016-6_74
Thompson, C., Christelle, B., Soline, B., Pierre, T., and Joris, P. (2021). Projected characteristic changes of a typical tropical cyclone under climate change in the South West Indian Ocean. Atmosphere 12:232. doi: 10.3390/atmos12020232
Tiwari, G., Kumar, P., and Tiwari, P. (2022). The appraisal of tropical cyclones in the North Indian Ocean: an overview of different approaches and the involvement of Earth's components. Front. Earth Sci. 10:823090. doi: 10.3389/feart.2022.823090
Twumasi, Y. A., Merem, E. C., Namwamba, J. B., Asare-Ansah, A. B., Annan, J. B., Ning, Z. H., et al. (2022). Flood mapping in mozambique using copernicus sentinel-2 satellite data. Adv. Remote Sens. 11, 80–105. doi: 10.4236/ars.2022.113006
Vidya, J., Ravichandran, M., Murtugudde, R., Subeesh, M. P., Chatterjee, S., Neetu, S., et al. (2020). Increased cyclone destruction potential in the Southern Indian Ocean. Environ. Res. Lett. 16, 014027. doi: 10.1088/1748-9326/abceed
Wang, Y., and Wu, C. C. (2004). Current understanding of tropical cyclone structure and intensity changes - a review. Meteorol. Atmos. Phys. 87, 257–278. doi: 10.1007/s00703-003-0055-6
Keywords: Eastern Highlands, Operations Dashboard, remote sensing indices, environmental degradation, Cyclone Idai
Citation: Hungwe M-G, Gumindoga W, Manuel Baez Villanueva O and Rwasoka DT (2024) Comparative analysis of the variability and impacts of tropical cyclones in flood-prone areas of Zimbabwe. Front. Clim. 6:1291751. doi: 10.3389/fclim.2024.1291751
Received: 10 September 2023; Accepted: 19 February 2024;
Published: 20 May 2024.
Edited by:
Amos Tiereyangn Kabo-Bah, University of Energy and Natural Resources, GhanaReviewed by:
Lazarus Chapungu, University of South Africa, South AfricaCopyright © 2024 Hungwe, Gumindoga, Manuel Baez Villanueva and Rwasoka. This is an open-access article distributed under the terms of the Creative Commons Attribution License (CC BY). The use, distribution or reproduction in other forums is permitted, provided the original author(s) and the copyright owner(s) are credited and that the original publication in this journal is cited, in accordance with accepted academic practice. No use, distribution or reproduction is permitted which does not comply with these terms.
*Correspondence: More-Grace Hungwe, bW9yZ3JhY2VAZ21haWwuY29t
Disclaimer: All claims expressed in this article are solely those of the authors and do not necessarily represent those of their affiliated organizations, or those of the publisher, the editors and the reviewers. Any product that may be evaluated in this article or claim that may be made by its manufacturer is not guaranteed or endorsed by the publisher.
Research integrity at Frontiers
Learn more about the work of our research integrity team to safeguard the quality of each article we publish.