 Webster Gumindoga1*
 Chikumbutso Liwonde1
 Donald Tendayi Rwasoka1
 Pedzisai Kowe2Auther Maviza3
 James Magidi2Lloyd Chikwiramakomo1Moises de Jesus Paulo Mavaringana4Eric Tshitende5
- 1Construction and Civil Engineering Department, University of Zimbabwe, Harare, Zimbabwe
- 2Geomatics Department, Tshwane University of Technology, Pretoria, South Africa
- 3Faculty of Science, Global Change Institute, University of the Witwatersrand, Johannesburg, South Africa
- 4Divisão de Agricultura, Instituto Superior Politécnico de Manica, Manica, Mozambique
- 5Department of Natural Resources Management, Faculty of Agronomic Sciences and Environment, University of Kinshasa, Kinshasa, Democratic Republic of Congo
Floods are major hazard in Mzuzu City, Malawi. This study applied geospatial and hydrological modeling techniques to map flood incidences and hazard in the city. Multi-sensor [Sentinel 1, Sentinel 2, and Moderate Resolution Imaging Spectroradiometer (MODIS)] Normalized Difference Vegetation Index (NDVI) datasets were used to determine the spatio-temporal variation of flood inundation. Ground control points collected using a participatory GIS mapping approach were used to validate the identified flood hazard areas. A Binary Logistic Regression (BLR) model was used to determine and predict the spatial variation of flood hazard as a function of selected environmental factors. The Hydrologic Engineering Center's Hydrologic Modeling System (HEC-HMS) was used to quantify the peak flow and runoff contribution needed for flood in the city. The runoff and peak flow from the HEC-HMS model were subjected to extreme value frequency analysis using the Gumbel Distribution approach before input into the Hydrologic Engineering Center River Analysis System (RAS) (HEC-RAS). The HEC-RAS model was then applied to map flood inundated areas producing flood extents maps for 100, 50, 20, and 10-year return periods, with rain-gauge and Climate Prediction Center MORPHed precipitation (CMORPH) satellite-based rainfall inputs. Results revealed that selected MODIS and Sentinel datasets were effective in delineating the spatial distribution of flood events. Distance from the river network and urban drainage are the most significant factors (p < 0.05) influencing flooding. Consequently, a relatively higher flood hazard probability and/susceptibility was noted in the south-eastern and western-most regions of the study area. The HEC-HMS model calibration (validation) showed satisfactory performance metrics of 0.7 (0.6) and similarly, the HEC-RAS model significantly performed satisfactorily as well (p < 0.05). We conclude that bias corrected satellite rainfall estimates and hydrological modeling tools can be used for flood inundation simulation especially in areas with scarce or poorly designed rain gauges such as Mzuzu City as well as those affected by climate change. These findings have important implications in informing and/updating designs of flood early warning systems and impacts mitigation plans and strategies in developing cities such as Mzuzu.
1 Introduction
Urban flash floods are a rapid rise of water along a stream or low-lying sections of the urban area, usually caused by heavy rainfall (Jimme et al., 2016; Chang et al., 2021; Hamdy et al., 2023). Urban areas have a relatively higher risk of flash flooding due to the presence of large impervious areas and sometimes inefficient drainage system (Sowmya et al., 2015; Tomar et al., 2021). In addition, limited conveyance capacity of urban channels and rivers, as well as drains and decades of urban development without upgrading of the drainage infrastructure contributes to urban flooding (Pedersen et al., 2012; Otokiti et al., 2019; Haghbin and Mahjouri, 2023). Statistics from the International Disaster Database indicates that floods have the greatest damage potential of all natural disasters worldwide and affect the greatest number of people including those in vulnerable human settlements in southern African countries such as Mozambique, Zambia Zimbabwe and Malawi (Lumbroso, 2020).
Malawi faces a number of hazards, both natural and human made (Dewa et al., 2021; Chirwa, 2023). The intensity and frequency of disasters have been increasing in the face of climate change, population growth, urbanization and environmental degradation (Nhemachena et al., 2020). Between 2013/14 and 2015/2016 seasons, flash floods were recorded almost in all the major cities of Malawi (Government of Malawi, 2015; Makwinja et al., 2021). During the 2015/16 season about 1,300 households (representing 5,800 people) were affected by flash floods, with six fatalities and many others injured in Mzuzu City (Government of Malawi, 2015). These flash floods normally develop over a short period of time but cause extensive damage to life and property (Prama et al., 2020). Over and above the lack of advanced tools to deliver timely and accurate measurements, few studies on flood hazard and risk mapping have been carried out to in the city to guide decision making and mitigate against further loss of life and property (Abdelkarim et al., 2019). In this regard, geospatial tools and techniques have over the past decade taken center stage in augmenting scientific exploration and generation of new information on flooding.
Advances in key geospatial tools and data e.g., Geographic Information System (GIS), availability of remotely sensed data and high-resolution digital elevation models have greatly improved flood modeling (Ding et al., 2021; Sudalaimuthu et al., 2022). Integration between GIS software and hydrologic/hydraulic models assist in examining the risk of floods and greatly improve spatial data visualization of flood prone areas (Jiang and Yu, 2022). Thus, hydrologic/hydraulic models play an important role in improving a better understanding of the dynamics and behavior of fluvial systems (Chomba et al., 2021). However, most hydrological and hydraulic models are data driven and require spatially distributed information regarding topography, land cover and soils hence the development of alternative more robust forms of models (Damayanti, 2011; Ha and Bastiaanssen, 2023).
In recent years, there has been a rapid development and application of semi-distributed models such as the Hydrologic Engineering Center's Hydrologic Modeling System (HEC-HMS) and River Analysis System (HEC-RAS) to quantify the hydrologic and hydraulic dynamics of various river systems globally (Natarajan and Radhakrishnan, 2020). This has been further enhanced by the proliferation of high-quality quantitative data (e.g., topography, remotely-sensed imagery) and increasing computational power (Hunter et al., 2007; Fleischmann et al., 2019). However, data, end-user and computational constraints also need to be considered (Beven and Freer, 2001; Chomba et al., 2022). In order to select an appropriate model to use, one needs an in depth understanding of the model since each model has its own limitations and advantages (Beven and Freer, 2001; Chomba et al., 2022). This study therefore sort to demonstrate and test the application earth observation, GIS, hydrological and hydraulic modeling techniques to better understand the flash flood occurrences in Mzuzu City in Malawi from 2014 to 2016. This also entailed assessing the performance of satellite rainfall products and their suitability for flood modeling while developing an optimal hydrodynamic flood model for flood inundation extent for different return periods.
To this end, this study provides the needed precise and timely urban flood risk assessment information for developing improved flood early warning, preparedness and management plans in Mzuzu City, Malawi. Therefore, it also demonstrates how contemporary technologies may be used to help address challenges of flash floods in urban areas—over and above the potential to advance scientific knowledge the field of urban flood modeling.
2 Materials and methods
2.1 Study area
The study was conducted in the City of Mzuzu in Malawi. The city is located at −11.47° latitude and 34.02 longitude (Figure 1). The city covers a total land area of 143.8 km2 (Gondwe and Manda, 2021). The city had a population of 219,988 in 2018 (National Statistical Office, 2008) and an estimated population of 273,018 in 2023. Approximately 85% of the city is covered by built-up areas and < 15% is covered by green areas. The area receives an average annual rainfall of ~1,225 mm/year. The highest average rainfall is experienced in March, while the least rainfall falls in August. The average monthly temperature is 18.1 °C, with a mean monthly maximum of 22.0 °C mostly experienced in November. The city is predominantly underlain by alluvial and colluvial deposits with the higher elevation areas composed of metamorphic gneiss. The soils are mainly ferruginous in the low-lying areas and drained by the Lunyangwa River and the Ching'ambo stream.
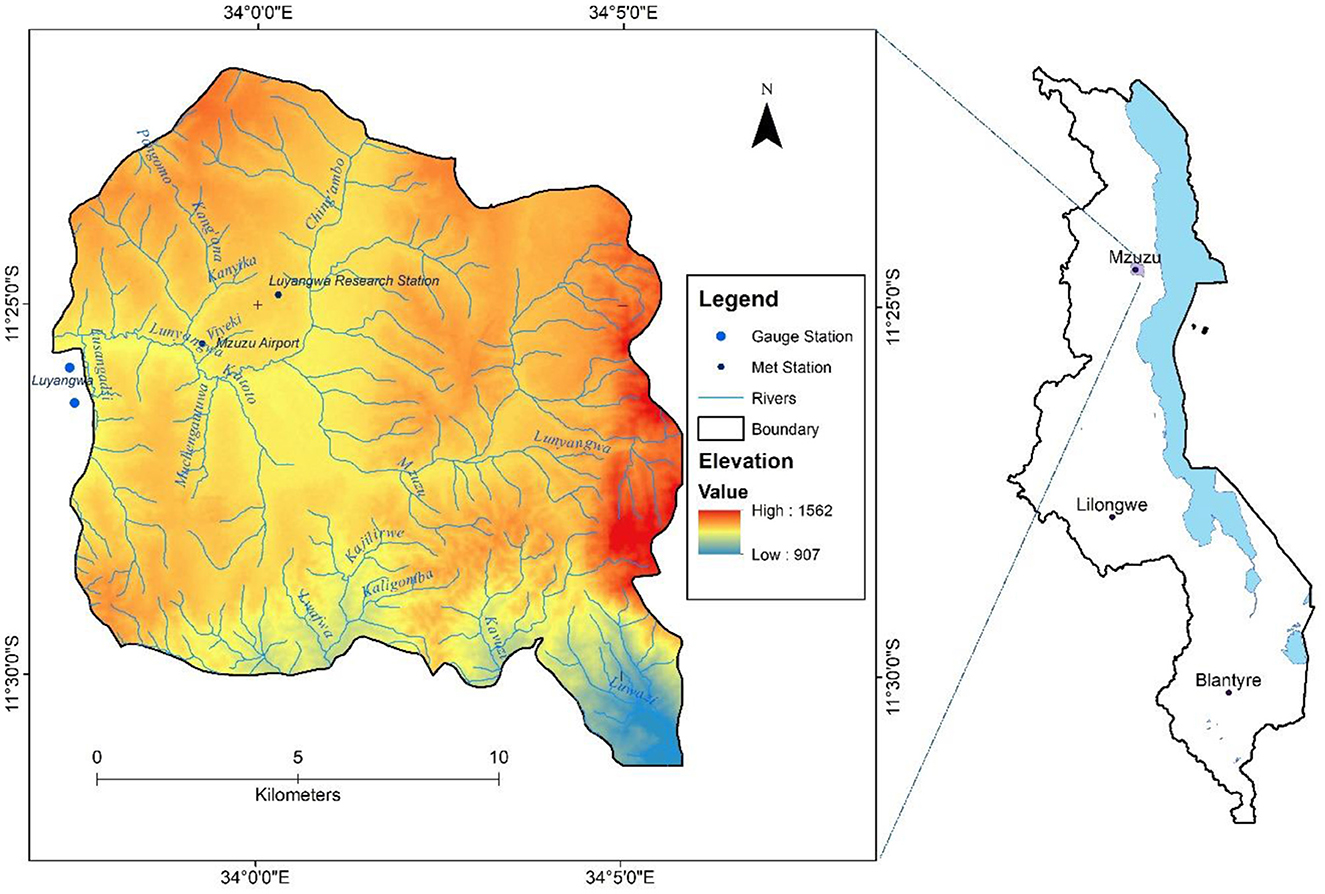
Figure 1. Mzuzu City showing main rivers and meteorological stations.
2.2 Gauge based and satellite rainfall estimates
Time series of daily rainfall data (2010–2015) from Mzuzu Airport meteorological station were obtained. Climate Prediction Center MORPHed precipitation (CMORPH) time series data (2010–2015) with a 30-min temporal resolution at a 0.25° (~28 km) spatial resolution were used. Satellite image data were downloaded from the GeoNETCAST in situ and Online Data (ISOD). Toolbox through the ILWIS 3.72 software (http://52north.org/downloads/). CMORPH was aggregated to daily time step to match with recording time step of gauge-based observations.
2.3 Runoff data
Daily runoff data for Lunyangwa River at MophoJere (07418) flow gauging station for October 2008 to June 2015 was solicited from the Department of Water of Malawi. The rainfall and runoff daily time-step dataset had missing values of ~1 to 2 days per month and thus the mean value gap-filling method (which estimates the symmetric distribution mean and standard deviation) was employed to complete the datasets (Sivapalan et al., 2003; Trubilowicz, 2016). The original (raw) time series with gaps were then correlated with the gap-filled time series to check error level.
2.4 Rainfall data performance evaluation against gauged based observations
2.4.1 Evaluation using standard statistics
To evaluate the performance of the satellite rainfall estimates, six continuous statistics were used. These were, the Mean Error or Bias, Mean Absolute Error (MAE), the Root Mean Square Error (RMSE), the Correlation Coefficient (R), the Relative Bias (RB) and the Nash Sutcliffe Efficiency (NSE). Detailed descriptions of the standard statistics are found in Gumindoga et al. (2019; 2020).
2.4.2 Rainfall occurrence detection statistics
The categorical rainfall occurrence detection statistics included Probability of Detection (POD), False Alarm Ratio (FAR), Frequency Bias Index (FBI) and the Critical Success Index (CSI) as shown on Equations (1)–(4), respectively.
where, A, B, C, and D represent hits, false alarms and misses respectively.
2.5 Bias formulation and estimation
The spatial-temporal bias correction method was applied in this study as described by Habib et al. (2014) and modified for southern African basins by Gumindoga et al. (2016). The bias was corrected for individual rain gauge stations at daily time step implying that bias correction varies in space and over time and is based on the use of the BFSTB factor. The time window used in this study was selected as 7 days with a minimum 3 mm gauge rainfall accumulation. This was derived at after several time windows and thresholds were tested but were giving poor results. For rainfall accumulation < 3 mm, no bias correction was applied for that specific time window.
2.6 Mapping the spatial variation of flash flood hazard and risks
Moderate Resolution Imaging Spectroradiometer (MODIS) and Sentinel 1 and 2 satellite images were used in this study.
2.6.1 MODIS data acquisition
Thirty-six (36) NDVI images of Moderate Resolution Imaging Spectroradiometer (MODIS) on-board the National Aeronautics and Space Admiration (NASA)'s Terra and Aqua satellites, acquired at 250 m resolution from MODIS Rapid Response System (https://lance-modis.eosdis.nasa.gov) were used as main input to map flood inundated areas in this study. MODIS images were used because the Terra and Aqua view the entire earth's surface every 1–2 days which gives them the ability to track all flood events and also the ease to access them because of their open data policy (Dao and Liou, 2015). Images were obtained for the wet season i.e., January to April for the years 2016, 2015, and 2014 based on ground observations that Mzuzu City often experiences flash floods during this period. To separate water and non-water areas, an ILWIS water extraction algorithm was used, with the resulting map mosaicked to the Mzuzu city boundary shapefile thus creating a flood extent map (Ticehurst et al., 2014; Teng et al., 2017). The implemented algorithm for water extraction is the following:
- red_222 = Mzuzu__3
- green_222 = Mzuzu__2
- blue_222 = Mzuzu__1
- water_red_222 = IFF (red_222 = 154, 1, 0)
- water_green_222 = IFF (green_222>210, 0, IFF (green_222 < 180, 0, 1))
- water_blue_222 = IFF (blue_222 < 200, 0, 1)
- water_222 = water_red_222+water_green_222
- flood_222 = IFF (water_222>1, 1, ?)
2.6.2 Sentinel-1 data acquisition
Sentinel-1 C-band Synthetic Aperture Radar (SAR) data from the Copernicus Sentinel-1 mission (Torres et al., 2017) was used in this study due to its sensitivity to water surfaces and all-weather capabilities (Huang et al., 2018). The data was acquired same period as the MODIS data. Google Earth Engine (GEE) (Kumar and Mutanga, 2018) was used to catalog search, filter, acquire, preprocess and analyse the imagery for the study area and study period. The dual Vertical-Horizontal (VH) polarization was selected for its enhanced sensitivity to land surface roughness and change. Both the ascending and descending passes were applied to capture comprehensive spatial information. Pre-processing of the SAR images involved the speckle filtering functions after Rana and Suryanarayana (2019), to improve floodwater classification. A threshold approach was used to differentiate the flooded and non-flooded areas for comparative analysis between the before and after events.
2.6.3 Sentinel-2 data acquisition
To complement MODIS images as well as Sentinel-1C Synthetic Aperture Radar (SAR) data, 4 optical Sentinel-2 images of 20 m resolution were acquired and used as input to map the flood affected areas. The images were acquired from Sentinels Scientific Data Hub web portal (https://scihub.copernicus.eu/dhus/#/). The images were obtained on 4th and 6th of January 2015 and 4th and 20th of April, 2016. Sentinel Application Platform 5.0 was used for processing the datasets i.e., all pre and post processes such as calibration using the backscatter coefficient, image filtering and band maths calculation to separate water and non-water areas were executed therein.
2.6.4 Digital elevation model
A 30 m resolution Digital Elevation Model (DEM) was acquired from the United States Geological Survey (USGS)'s EarthExplorer website (https://earthexplorer.usgs.gov/) and used to create a slope layer for the study area. The slope is a significant geomorphological feature that influences a region's steepness and flatness which is key factor to consider in flood modeling. The DEM was also manipulated to prepare the distance from rivers, elevation, and drainage density layers maps and furthermore used to generate drainage and flow accumulation maps through DEM-hydroprocessing method in ILWIS software.
2.6.5 Environmental variables
An overview and description of the environmental variables used in predicting flood hazards in the study area is presented below. These include elevation, distance from rivers, slope, and vertical channel height.
a) Elevation: A Digital Elevation Model (DEM) was used to calculate flow direction, flow accumulation, and drainage density. Furthermore, the drainage network and catchment segmentation were extracted and some compound indices were calculated to provide further hydrological model input (Maathuis and Wang, 2006). Flow accumulation estimates the amount of water that is available for runoff that concentrates and accumulates in river channels (Roy and Mistri, 2013). The flow accumulation data were used in defining watershed boundaries and stream networks (Mutelo, 2013).
b) Slope: This was calculated as a percentage with a pixel size of 30 m using Equation (5): Slope _ 100 _ HYP_DFDX_DFDY_/30 (5) where: HYP = the hypotenuse, DFDX = change in the horizontal direction and DFDY = change in the vertical direction. SLOPEPCT is the output map name of the slope map in percentages.
c) Vertical channel distance: The DEM was used to derive the height of each place in the study area above or below the nearest channel bed level. The channel base elevations were interpolated to form a channel height layer that, if subtracted from the DEM, produces the vertical distance to the closest channel of each location in the study area (Murwira and Schmidt-Murwira, 2005). To do this, a segment map of all rivers was converted to a point map. In the ILWIS environment, elevation values were then assigned to the point map of rivers using the map value command. The point map was then interpolated to get a channel height layer of the study area using the universal Kriging interpolation technique. Lastly, the channel height layer was subtracted from the DEM to produce the vertical channel distance.
2.6.6 Generation of water and non-water random points
Random points representing flooded and non-flooded areas were generated using QGIS 2.10.1 software. For each flood day, a total of 50 random points representing non-water areas and 50 random points representing water areas were generated. Pixels depicting water presence were coded “1” while the non- water presence were coded “2” (Nharo et al., 2019). This data was used as an input for the Binary Logistic Regression. Environmental variables such as distance from the river, slope, elevation, land cover and vertical channel distance were added to the table using the MAPVALUE function in ILWIS. A binary logistic regression technique was used in Statistical Package for the Social Sciences (SPSS) to derive a function that links water presence or absence to each of the environmental variables. The following binary logistic (Equation 5) was used:
where P = probability of flooding, a = ß value for the constant, b is the Beta value (ß) for the environmental variable, and x is the environmental variable (e.g., elevation).
2.7 Development of flood hazard maps
Flood probability maps were developed in ILWIS using the binary logistic (Equation 5) and reclassified into four flood hazard classes. To obtain the value ranges of the classes, histograms of the probability maps classes were used. The four hazard classes were “Very low hazard,” “Low hazard,” “High hazard,” and “Very high hazard” after Gumindoga et al. (2014).
Using the logistic regression model, the spatial relationship between flood occurrence and factors influencing flooding were assessed. The SPSS data analysis tool was used to calculate the Pearson's correlations between flooding and each environmental factor. The coefficients obtained from SPSS and each environmental factor were used in the formulation of the multiple logistic regression model where all the significant factors were combined. Thereon, the multinomial regression model was developed by combining all the factors to obtain the probability of flooding as shown in Equation (6).
where P is the estimated probability of flooded areas. The value of Z was obtained using Equation (6). The mathematical equation was formulated as shown in Equation (7).
2.8 HEC-HMS model calibration and validation
The HEC-HMS was employed in simulating runoff and peak flows. The model simulates rainfall-runoff and routing processes in both natural and controlled systems. It is designed to be applicable in a wide range of geographic areas for solving the widest possible range of problems. This includes large river basin water supply and flood hydrology, and small urban or natural watershed runoff hence its preference and suitability in this current study (Scharffenberg and Fleming, 2008). Hydrographs produced by the model are used directly or in conjunction with other tools for studies of water availability, urban drainage, flow forecasting, future urbanization impact, reservoir spillway design, flood damage reduction, floodplain regulation, and systems operation (Feldman, 2000). The HEC-HMS “continuous” simulation approach was adopted and simultaneously done for each subcatchment by adopting the same HEC-HMS model components. These components include a model for: computing runoff volume or loss rate (Deficit and Constant), overland flow and interflow transformation in an ungauged catchment (the Snyder Unit Hydrograph), precipitation and evapotranspiration (Gage Weights and Monthly Average, respectively) and routing of reach and reservoir (Muskingum method and Outflow Curve, respectively). The datasets used in catchment delineation, transformation method, landuse/cover classification were obtained from remote sensing, whereas routing (reach and reservoir) and loss method parameters were derived from both literature and remote sensing. Only the loss and transformation were calibrated (USACE, 2000, 2008), using streamflow data.
HEC-HMS has models for calculating runoff volume or loss rate (Deficit and Constant), precipitation and evapotranspiration (Gauge Weights and Monthly Average, respectively), overland flow and interflow transformation in an ungauged catchment, and reservoir and reach routing (Muskingum method and Outflow Curve, respectively). While routing (reach and reservoir) and loss technique parameters were generated from both literature and remote sensing, the datasets utilized for catchment delineation, transformation method, and landuse/cover categorization were from remote sensing. Using streamflow data, only the transformation and loss were calibrated (USACE, 2000, 2008).
The HEC-HMS model has successful applications in many African Basins. Gumindoga et al. (2016) used the HEC-HMS model in simulating runoff in an ungauged catchment in the Upper Manyame Catchment of Zimbabwe. Nharo et al. (2019) also used the HEC-HMS model for flood modeling in Mbire District of Zimbabwe. In Kigali, Rwanda, Manyifika (2015) used HEC-HMS in modeling urban floods.
2.8.1 Basin model creation
A basin model was created using the catchment and drainage network which were derived from DEM hydro processing in ILWIS software. For the study area, three sub basins of Ching'ambo, Lunyangwa upper stream and Lunyangwa downstream were used for the model.
The SCS Unit Hydrograph was selected in estimating direct runoff. Runoff depends on soil infiltration rates hence soil data was considered as an important factor in the model development (Fleming and Brauer, 2016). Soils helped to explain the loss method through their infiltration rates. The predominant soils in the study area are the alluvial and colluvial deposits with the higher ground composed of metamorphic gneiss. The Muskingum method was used as a routing method for the stream flow through the channel reaches. “K” and “X” are parameters depending on the channel and flow characteristics. The model was manually calibrated using October 2008 to September 2010 flow datasets. The calibration process was done through fitting the base flow recession, and then the peak flows and finally the runoff volumes. The validation was done using flow data for October 2010 to September 2012. There are a number of performance criteria such as Bias, Nash Sutcliffe Efficiency (NSE) and Relative Volume Error (RVE) and that were used for calibration. We refer to Gumindoga et al. (2014) for detailed descriptions of the equations. Bias ranges from −10 to 10 with best value of 0. NSR ranges from –∞ to 1 with best value of 1. RVE ranges from –∞ and +∞ with best value of 0.
Daily stream flow observations for the period 1st October, 2008 to 30th September, 2010 using stream flows at gauge station 07418 were used to calibrate the model. The trial-and-error procedure was applied where model parameters are manually changed and optimized in order to best simulate the stream flow observed. Optimization was done through changing one parameter at a time for each model run to control the effect on model behavior and performance. The performance of the model was evaluated with objective functions of Nash-Sutcliffe Efficiency and the volumetric errors.
2.9 Extreme value analysis
In hydrology, the Gumbel distribution is frequently used to simulate the frequency of extreme events, such as maximum annual floods thus it was adopted in this study to determine the recurrence period and magnitude of extreme flood events by analyzing historical flood data in the study area. The possible severity of flooding is better understood thanks to this statistical analysis, which also influences decisions on infrastructure design and flood risk management.
In order to prepare flows needed for the HEC-RAS model, the design runoff for points of interest in the Mzuzu city was determined using the Gumbel method. The generation of return floods for maximum rainfall/runoff for selected catchments was carried out for 100, 50, 20 and 10-year return periods (see Equations 8, 9).
where y = Gumbel variate, T = return period (years).
The flood discharge (x) for each Gumbel variate and associated return period was computed using Equation (9).
where x = flood discharge (m3/s), x = mean peak flow (m3/s), s = standard deviation, y = Gumbel variate, y and σ are the mean and standard deviation for the Gumbel variate, respectively.
2.10 Hydraulic modeling principles using the HEC-RAS hydraulic model
Hydraulic Modeling using HEC-RAS: The River Analysis System (RAS) from the Hydrologic Engineering Center (HEC) is a popular software programme for hydraulic modeling of river systems, which includes bridge/culvert design and floodplain study. The HEC-RAS hydraulic model has wide use in Southern African catchments of Manyame (Muvuti, 2021), Runde and Save catchments. The model has been successfully applied in other international basins and regions in India such as Ghed (Trambadia et al., 2023), Purna River (Pathan et al., 2022a,b), Vishwamitiri River basin (Shah et al., 2022), Ozat River basin in Gujarat (Trambadia et al., 2023).
HEC-RAS needs input data on flow characteristics, water surface profiles, and boundary conditions, including exceptional flood events, in the context of flood modeling. When extreme occurrences (such peak flows obtained from the Gumbel distribution) are statistically analyzed and used as input for HEC-RAS simulations, the relationship between Gumbel extreme value and HEC-RAS hydraulic modeling becomes relevant. In order to mimic the hydraulic behavior of rivers and floodplains under extreme flood circumstances, HEC-RAS uses the estimated extreme event data, which includes peak flow rates and water surface elevations.
Hydraulic modeling, unlike hydrologic modeling, simulates the movement of fluid flow from one place to another. Variables of interest include fluid velocity and depth of flow. The HEC-RAS v.5.0 software along with the ArcGIS extension, RasMapper were used for hydraulic simulations. Flow characteristics from HEC-RAS are able to simulate depth, flow and velocity with time and location. Data required for steady uniform hydraulic modeling is primarily, topographic data, friction data, boundary conditions, design runoff for return periods of interest as well as validation data. A Triangulated Irregular Network (TIN) and contours were created from the high resolution (ASTER 30 m) DEM. Geometric layers such as the stream centerline, bank lines, flowpath centerlines and cross section cut lines were created from the TIN and aerial photographs from Google Earth. Using the QGIS Bing Aerial plug-in, the river centerline, banks which are edges of the river, flow lines which are flood plain extents and cross sections, were digitized.
Water surface elevations are simulated using the 2D Saint-Venant equations or the 2D diffusion wave equation as solved by the HEC-RAS, version 5. Detailed descriptions of the model equations are found in HEC-RAS manuals as well as Pathan et al. (2021, 2022b).
The model was calibrated using the Manning's roughness coefficient and data associated with the lower flowrate. The calibrated coefficients were then used in the validation process using data associated with the second, higher flowrate. An n-value was first estimated based on consultation with field observations, textbook guidelines and Google Earth images. Model validation was performed by running the model at the high flowrate with the calibrated n-values. The computed water surface profile was compared to the measured profile and P and D were determined. The actual validation of the HEC-RAS flood inundated areas was further done using flood areas mapped using the MODIS NDVI images as well as Sentinel 1 and 2 images.
The model was then exported from ArcView into the HEC-RAS software, and in the Geometry Data menu, verification was made, regarding the quality of the data. The Manning's coefficient was defined as 0.035 for the riverbanks and 0.030 for the main channel. The maximum flows were based on the rainfall data. The maximum rainfall was estimated using the Gumbel's statistical distribution. The peak flow rate was predicted for the different return periods. Flows were provided to the model for the 5, 10-, 20-, 50, and 100-year recurrence interval.
Once the HEC-RAS model was complete, output data was exported to Geographical Information System (GIS). HEC-GeoRAS was used to compile the data into useful graphical output such as floodplain polygon shapefiles.
3 Results and discussion
3.1 Performance of CMORPH satellite rainfall estimates in Mzuzu City
The mean, standard deviation, the maximum and sum of the gauged and CMORPH rainfall estimates for the period 2010–2015 indicates an underestimation of rainfall by the CMORPH (Table 1). As expected, the minimum recorded rainfall for both the CMORPH and gauge estimates were 0.0 mm/day. These results are consistent with results in the Zambezi basin by Gumindoga et al. (2016) and Omondi (2017) in the Kabompo River basin in Zambia, where CMORPH product was underestimating rainfall.
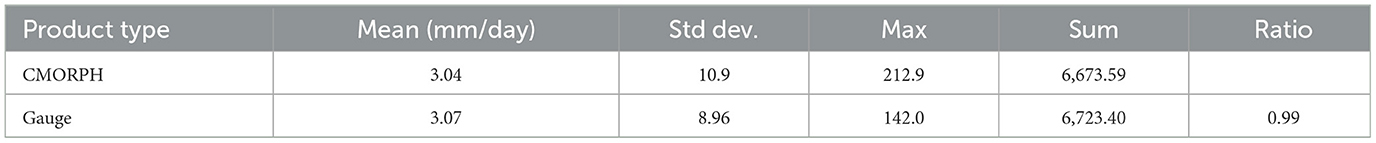
Table 1. Summary of statistics of gauge and CMORPH rainfall (2010–15).
The detection skill scores are presented in Figure 2 CMORPH satellite underestimated the frequency of rainfall at 0.9 for Mzuzu airport (FBI < 1). The probability of detection (POD) was 0.6, which indicate that 60% of the observed rain events were correctly detected by CMORPH. The lower values for FAR indicates that around 30% of the CMORPH retrievals were not observed on the ground or did not occur. The CSI of 0.47 indicates that almost 50% of the rain events observed on the ground or estimated by CMORPH were correctly estimated.
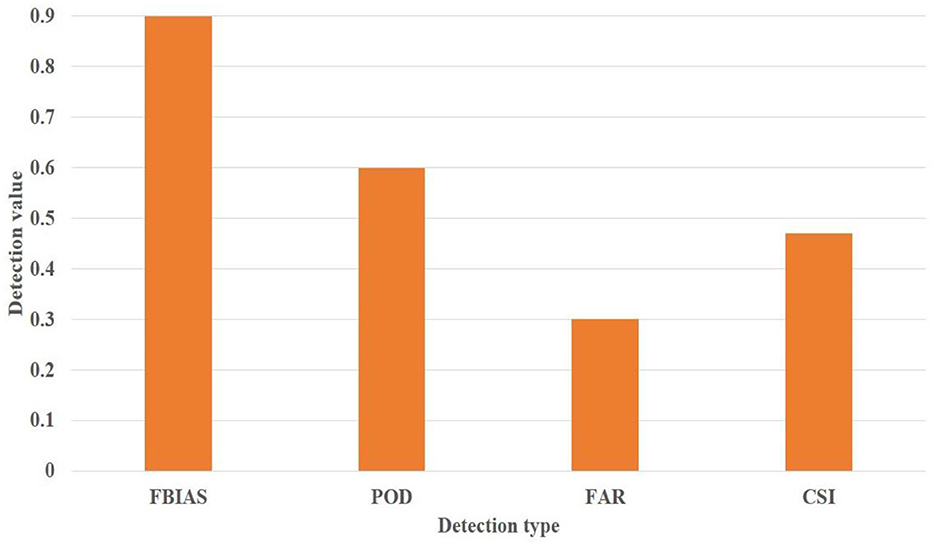
Figure 2. Detection skill score for CMORPH rainfall.
These results are similar to the results got by Ringard et al. (2015) where POD by CMORPH rainfall was around 70% while False Alarm Ratio was 30%.
Results in Table 2 indicates an RMSE of 12.96 mm/day while 0.51 was obtained for correlation coefficient which measures the degree of linear association between the estimated and observed distributions. An “R” value of exactly +1 indicates a perfect positive fit, while value of exactly −1 indicates a perfect negative fit. A bias of −0.04 mm/day was obtained, 4.40 for Mean Absolute Error while for NSE a value of −1.06 were obtained.

Table 2. Statistical indices for CMORPH satellite rainfall performance.
3.2 Seasonal comparisons
During the dry season (May to October), CMORPH is underestimating rainfall by 85% as shown in Figure 3A while during the wet season (November to April), there is an 18% overestimation of the precipitation by CMORPH as shown in Figure 3B.
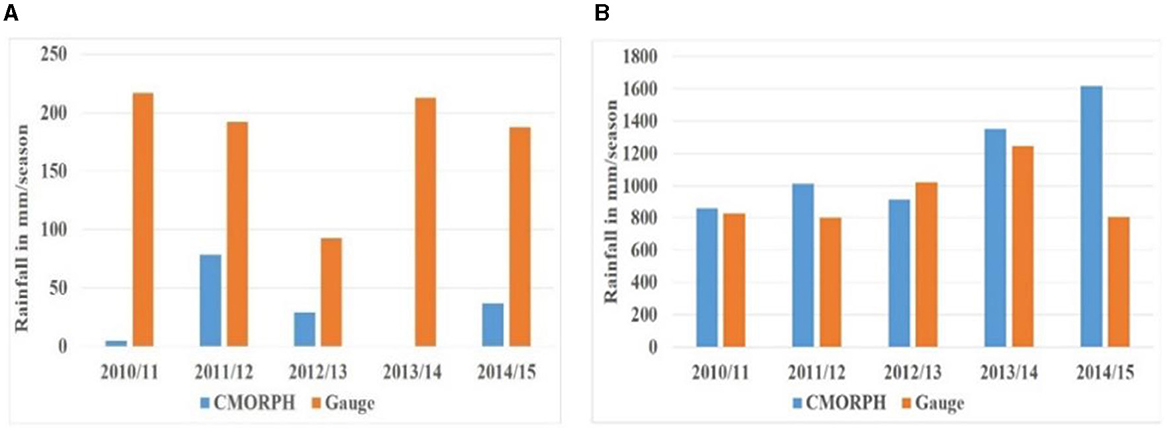
Figure 3. Dry (A) and Wet (B) season CMORPH—Rain gauge data comparison (May to Oct).
The years 2010 and 2013 shows an underestimation of CMORPH as compared to gauge. Further analysis on the annual rainfall totals indicated an overestimation of the CMORPH rainfall as compared to the rain gauge rainfall by 2.5%. These findings are consistent with the findings by Serrat-Capdevila et al. (2016) that CMORPH was overestimating rainfall by over 30% in Central African region in which Malawi belongs.
3.3 Effects of bias correction
After applying the bias correction on the daily rainfall values, the RMSE improved from 12.96 to 8.61 mm/day, however the mean rainfall estimates for Mzuzu airport deteriorated from 3.04 to 2.54 mm/day against the mean of the gauge which is 3.07 mm/day. Likewise, the NSE moved from −1.06 to −0.62.
3.4 Satellite based flood mapping for MODIS as well as Sentinel 1 and Sentinel 2 (SAR)
Flood maps and estimated flooded areas for Mzuzu City for both MODIS NDVI and Sentinel 1 images are presented in Figure 4. The accumulated flood extent of 32.2 km2 was observed on the19th of April, 2014 and recorded the highest flood inundated area from all the acquired images MODIS or Sentinel. During the 2016 floods, the highest inundated area of 26.1 km2 was recorded on the 10th of April with rainfall amount of 344 mm received from the 3rd to 10th April 2016. It can be noted that the floods waters can be seen to have receded on the April 15 image, which has an inundation area of 1.7 km2. During the 2015 floods, the peak on the 6th of April, having an inundated area of 7.5 km2. Sentinel-1 images were used to map floods for the 8th of April 2016 and the 5th of January 2015.
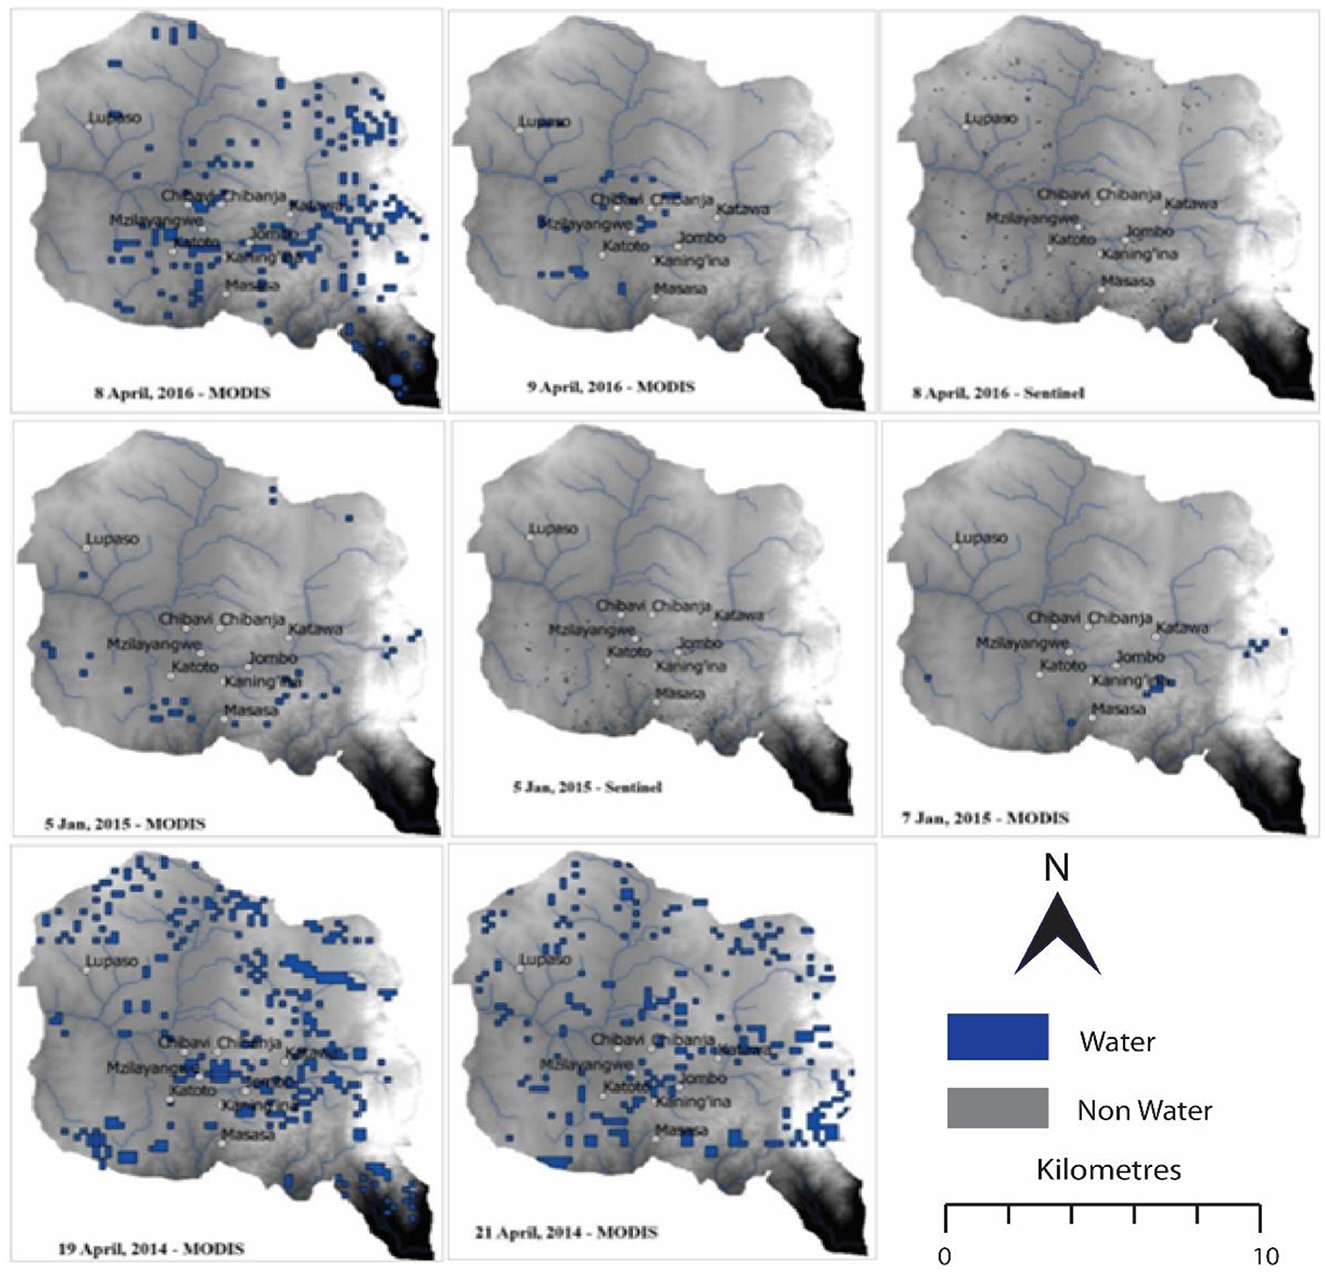
Figure 4. The spatial and temporal variation of floods in Mzuzu city from 2014 to 2016.
The flood mapping obtained from the use of MODIS NDVI and Sentinel-2 images is an indication of successful use of radar and optical satellite images. This study findings are in line with findings by Ahamed and Bolten (2017) on the effectiveness of using MODIS NDVI images for flood mapping in similar environments. Revilla-Romero et al. (2015) in their study using global flood events concluded that satellite remote sensing provides useful near real-time flood information that can be useful for risk management which is also demonstrated in the current study.
Figure 5 shows the area covered by water before the floods. The area covered by water before and after the floods was 0.57695 and 0.9428 km2 respectfully, which shows a +0.36585 km2 (i.e., +63.41%) change over the study period. Comparing the area with floods MODIS image is showing more area covered by floods than the sentinel 1 image.
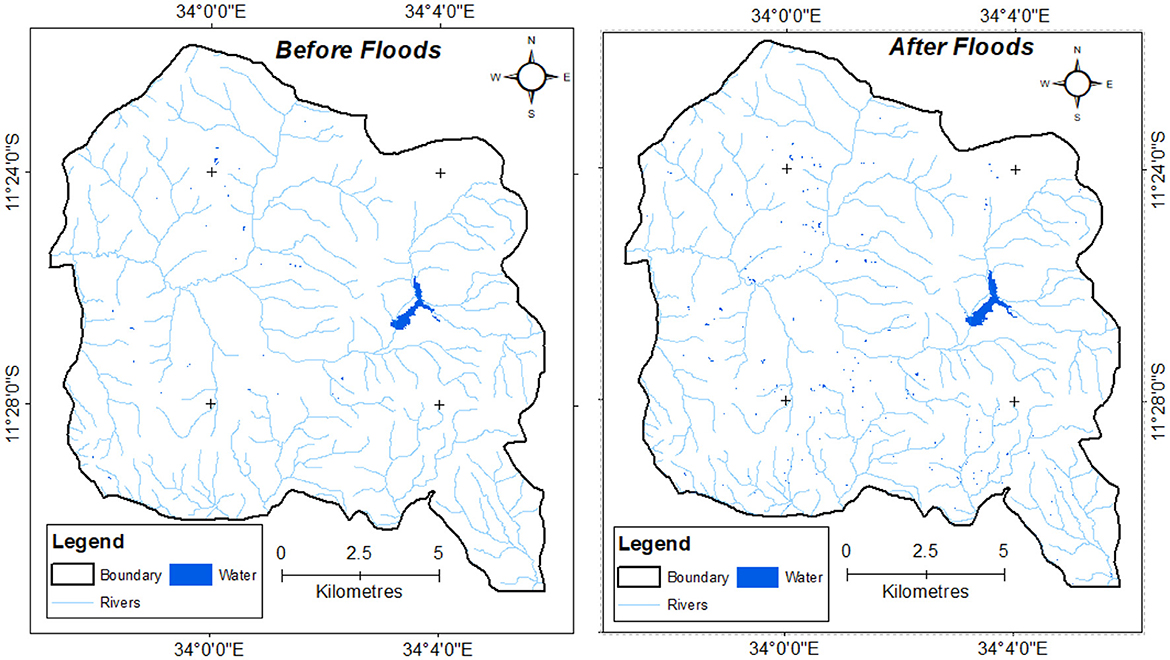
Figure 5. Area covered by water before and after floods using Sentinel 1 Synthetic Aperture Radar image for the study area environmental factors that affect flooding.
In this study, a number of environmental factors that affect flooding were assessed; these are vertical channel distance, slope, elevation and distance from a river.
3.5 Distance from rivers and open water bodies
Figure 6 shows the relationship between the probability of occurrence of flooding and distance from a river. The results are showing that areas which are close to a river have a high probability of up to 86% flooding than areas that are away from rivers and open water bodies. The relationship between probability of flooding (P) and distance from the river was obtained using Equation (10).
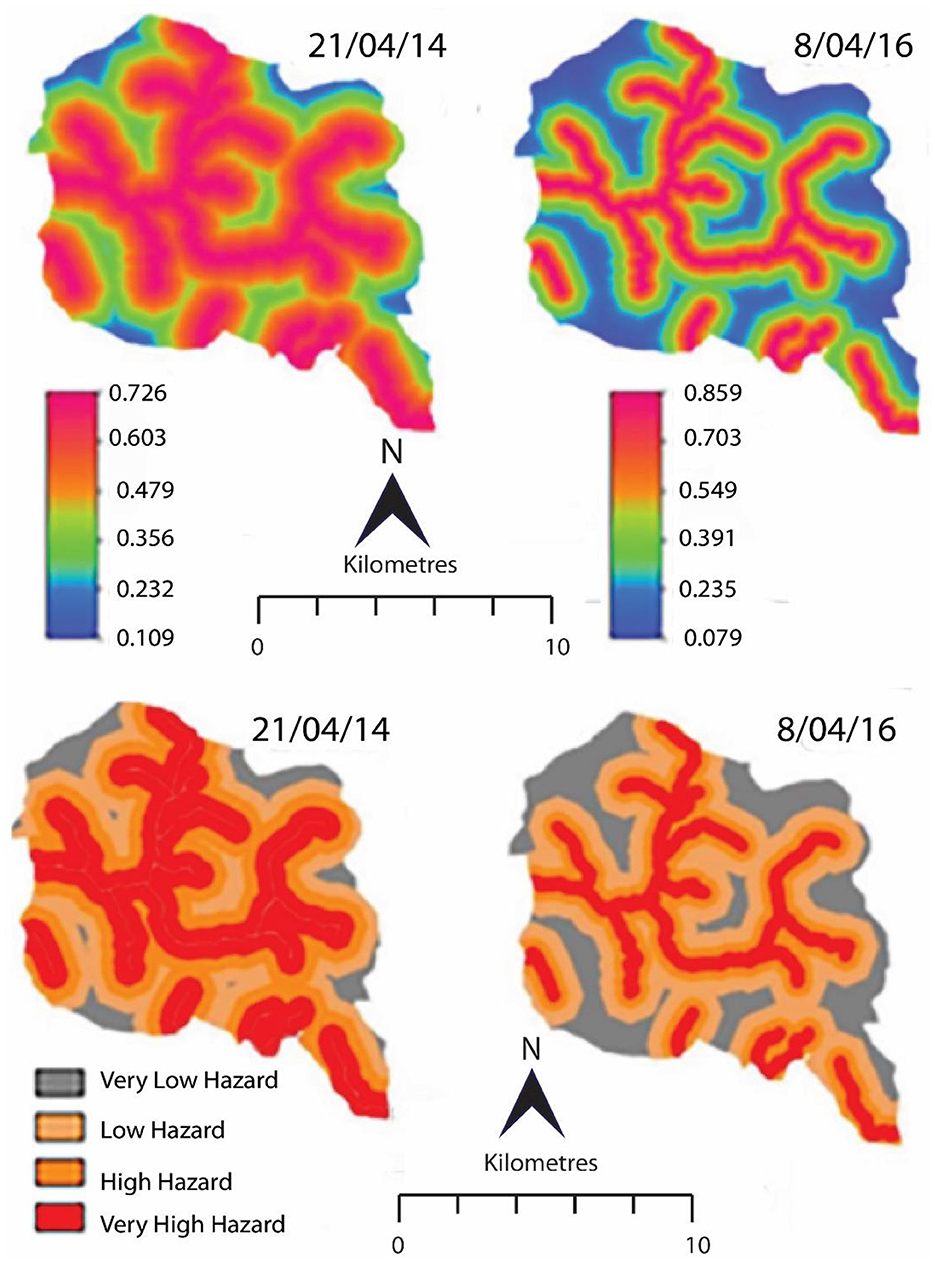
Figure 6. Flood probability and flood hazard with variation to distance to stream network.
The flood hazard maps developed as a function of a distance away from a stream network as well as urban drainage shows that for areas that are close to the stream network and urban drainage have more flood hazard than areas that are away.
3.5.1 Elevation and slope
Runoff movement is from higher to lower elevations and therefore slope influences the amount of surface runoff and infiltration. Flat areas associated with low elevation may flood quicker than areas in higher elevation with a steeper slope. In this study, high-elevation areas are in the eastern side of the city, where the slope is also steeper (Figure 7).
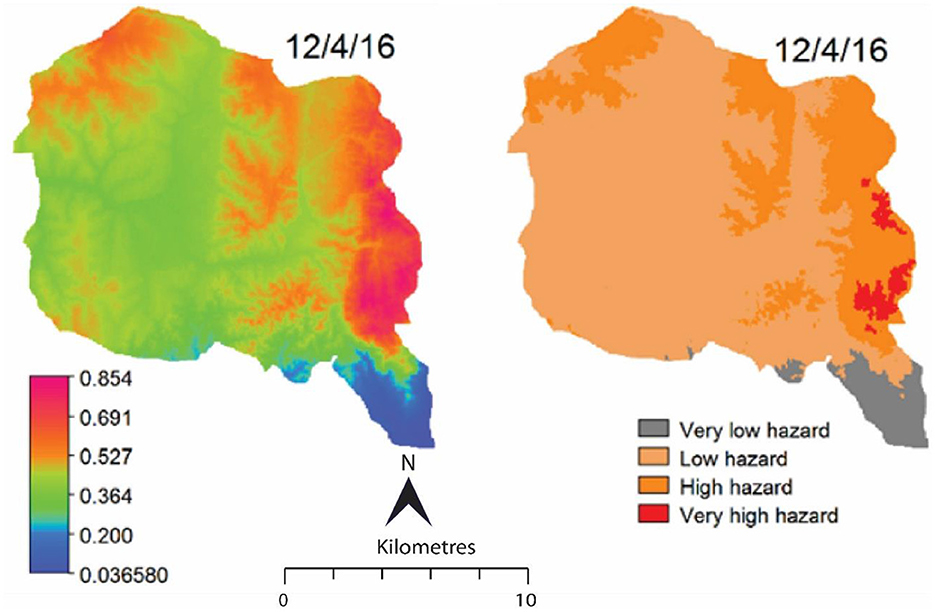
Figure 7. Probability and flood hazard maps with variation in elevation.
3.5.2 Vertical channel distance
Figure 8 shows that the probability of a point being flooded is higher for a point with lower height above channel base and lower for a point with high height above the channel base. Equations (11), (12) were applied to the height above channel base maps in ILWIS to determine the probability (P) of an area being inundated with water in a flood event.
where VCD is the Vertical Channel Distance.
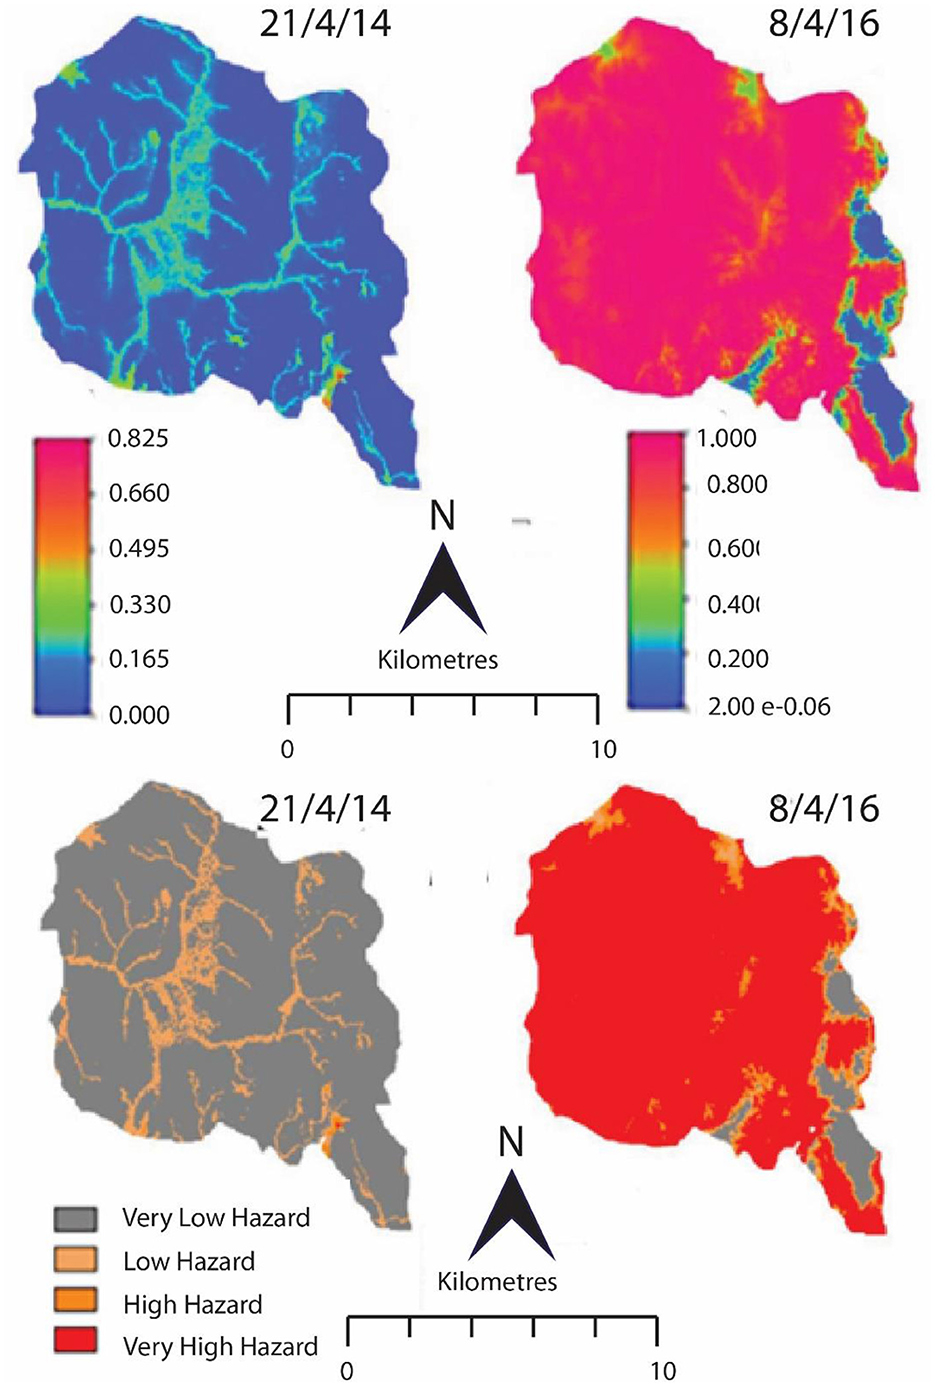
Figure 8. Flood probability and hazard maps with variation to vertical channel distance.
Likewise, areas that have a low vertical channel height have a high hazard to flooding than areas that have a high vertical channel height. Distance from rivers and the vertical channel distance were the most significant factors that affected flooding in the area. Distance from the rivers was significant in 9 out of the 21 flood days while the vertical channel distance was significant in 6 of the 21 flood days.
Flood probability and hazard maps obtained after combining multiple environmental factors show that most parts of the city fall in the high to very high flood hazard category (Figure 9). This puts people and their property at risk in case of flooding. The map obtained can be used to guide decision making and planning in as far as area suitability for infrastructure development in the city is concerned.
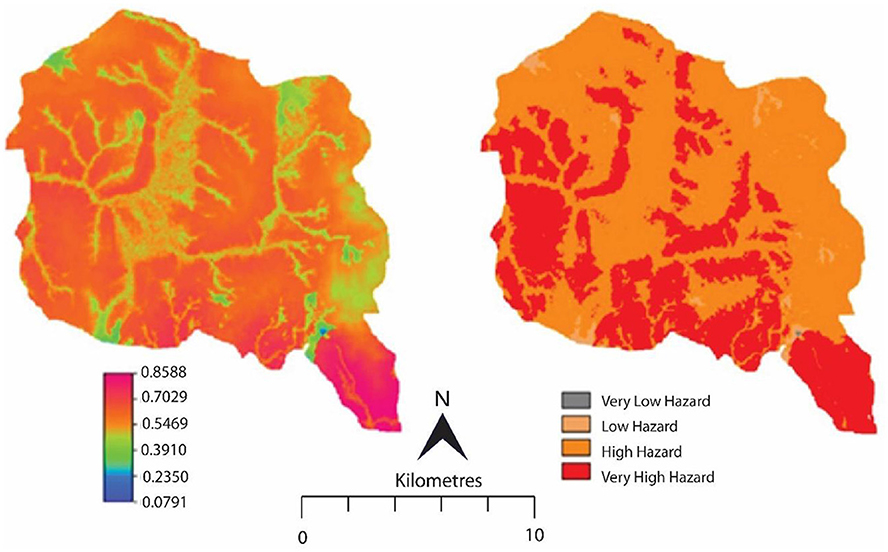
Figure 9. Flood probability and hazard maps combining multiple environmental factors.
3.6 Calibration and validation of HEC-HMS model
Figure 10 shows that HEC-HMS model reproduced the observed patterns of the peaks as well as the rising and falling limbs during the calibration period. However, the model overestimated the simulated flows. The observed flows were 10.5*107 m3 against the simulated flows of 11.3*107 m3. The Nash Sutcliffe (NS) model efficiency that determines the goodness of fit between simulated and observed values is 70%, which is within the acceptable ranges. Furthermore, the Relative Volume Error (RVE) used for quantifying the volume errors is −6.9 % and suggest a good performance error since it is within the acceptable ranges of −10 to 10% (Castellarin et al., 2004). The Bias was 0.12 mm/day which was satisfactory.
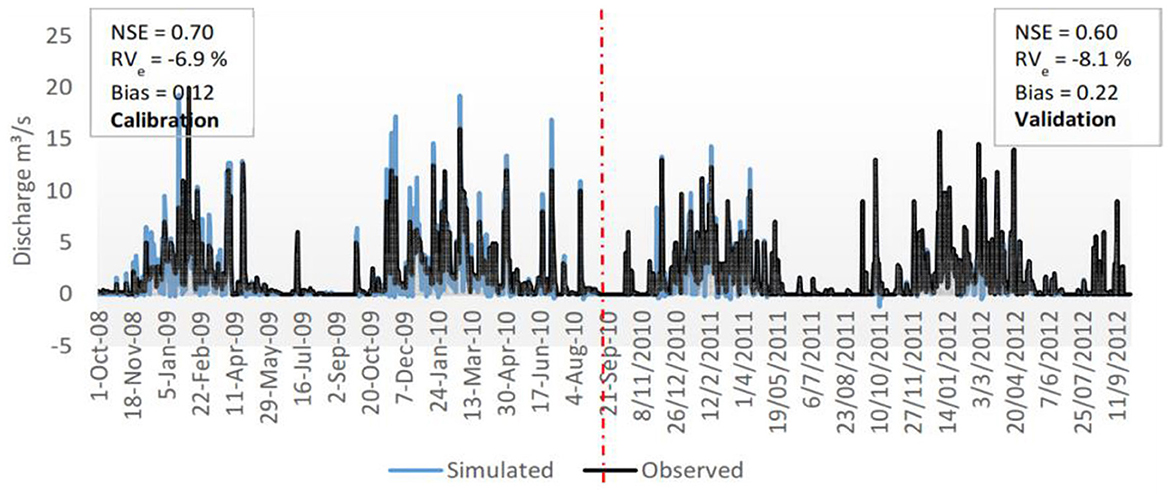
Figure 10. Model calibration and validation.
Model validation used flow from 1st of October to 30th of September 2012. For model validation, the optimized model parameter set by the calibration is used. Validation results indicate satisfactory model performance with the objective function values for NSE 60% and for RVE is −8.1%. The observed outflows were 9.6*107 m3 while the simulated flows were 8.8 *107 m3. This shows that the model is underestimated the simulated flows.
3.7 Model simulation for flood modeling with satellite estimate forcing
CMORPH rainfall estimates were used as an input in the HEC-HMS as a forcing to evaluate how the observed hydrograph can be simulated. The bias corrected CMORPH estimates used were from 1st of October 2010 to 30th of June 2014. Evaluation of the model performance in terms of the objective functions shows very good model performance. The volumetric error is small (RVE = −4.1%) suggesting very good model performance in terms of capturing observed stream flow volume. The model performance is also good in reproducing the pattern of the observed hydrograph (NSE = 0.66) as in Figure 11.
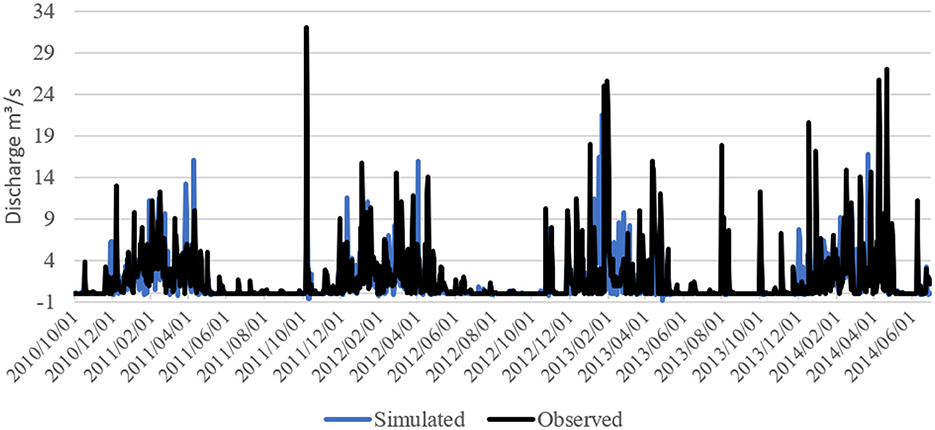
Figure 11. Model simulation using CMORPH rainfall estimates.
3.8 Flood routing using HEC-RAS
Flood routing was based on the statistically predicted flows using the Gumbel distribution, steady flow simulations which were performed for the return periods of 10, 20, 50, 100 years. Flows that were produced from the return periods are as in Table 3.
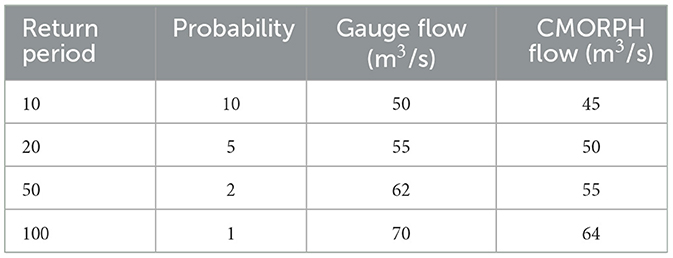
Table 3. Gumbel distribution flows.
Figure 12 shows that as the return period increases, the spatial extent of the flooded area also increases in both the CMORPH and gauge rainfall simulations. The largest inundation was caused by the 100-year return period. From the obtained results using gauge rainfall for simulation, for a 100-year flood return period, the model simulated 135 m as reach length of the flood with a flooded area of 2.3 km2. This had an average inundation depth of 0.98 m, with some areas experiencing a maximum depth of 1.5 m, which mainly occurred within the lower parts of the study area. The 50-year flood return period simulated 125 m as a reach length with a flooded area of 2.07 km2 with an average inundation depth of 0.65 m with some areas experiencing a maximum depth of 1.3 m. The same case applied to the 20-year return period which simulated 122 m as the reach length with a flooded area of 1.8 km2 an average inundation depth of 0.56 m with some areas experiencing a maximum depth of 1.25 m. The 10-year return period had a flood inundated area of 1.63 km2 with a simulated reach of 111 m.
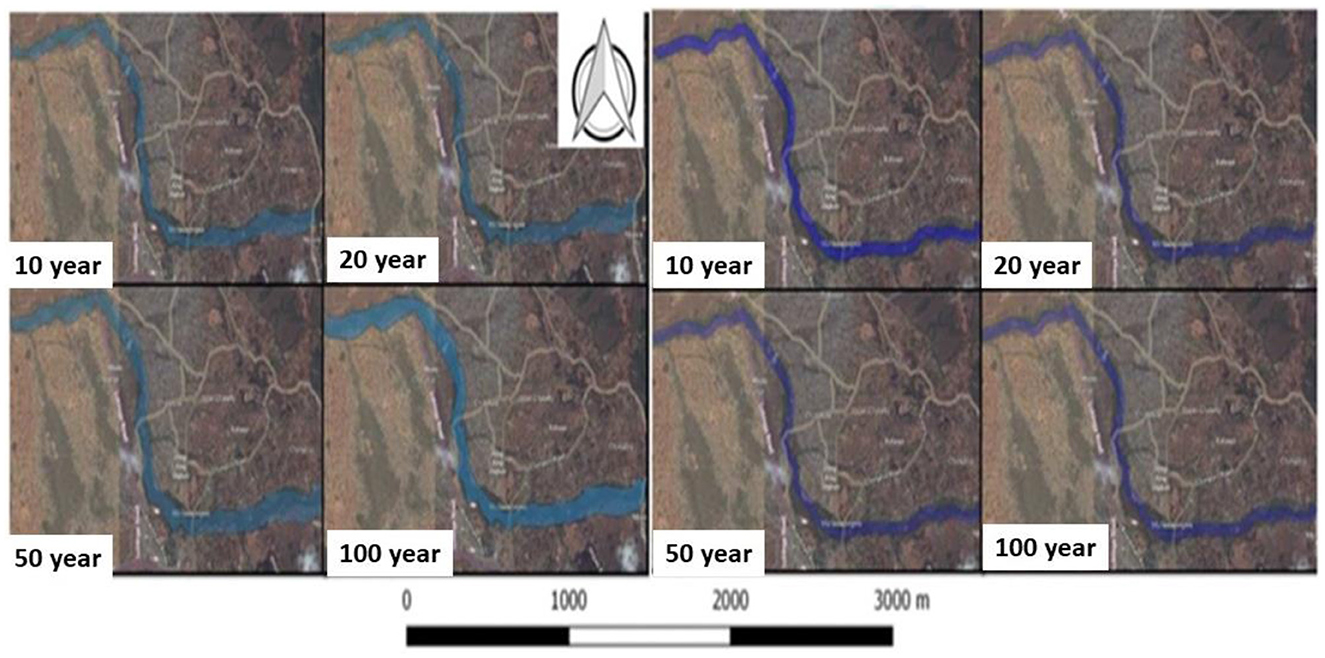
Figure 12. Different flood return periods using gauge rainfall (Left) and CMORPH (Right).
Using CMORPH satellite rainfall, a 100-year flood return period, the model simulated 125 m as a reach length and 1.83 km2 as a flood inundated area. The 50-year flood return period simulated 101 m as a reach length with a flooded area of 1.68 km2. The same case applied to the 20-year return period which simulated 93 m as the reach length with a flooded area of 1.41 km2 while the 10-year return period had a flood inundated area of 1.21 km2 with a simulated reach of 85 m. The obtained results agree with the area results obtained which showed that CMORPH satellite rainfall obtained in the study area underestimated rainfall when compared to the gauge rainfall.
3.9 Elements at risk
Table 4 shows the elements affected by using different flood return periods for the gauged and CMORPH rainfall. From the results it can be seen that residential houses are at risk for all the return periods. This indicates a high risk for people as most of their homes were directly within flood zones. On verification of the model, elements at risk from the model were verified with ground control points. A Root Mean Square Error of 0.45 was obtained (with a p-value of 0.05) showing that the model agrees with the ground control points obtained.
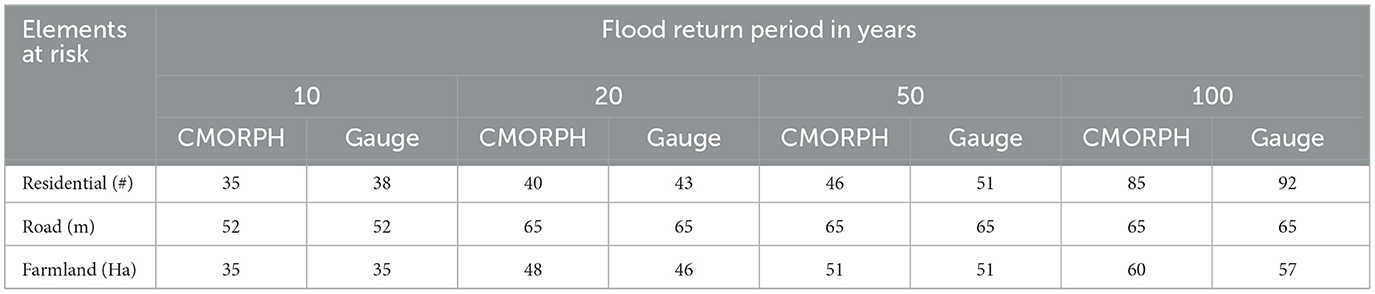
Table 4. Elements at risk.
4 Conclusions and recommendations
4.1 Conclusions
The main objective of the study was to predict flood hazards and model flood inundation in the Mzuzu city of Malawi. The spatial analytical techniques presented are an effective method of hazard mapping and delimitation of flood-prone zones in the study area. By validating hydraulic modeling techniques with satellite based approaches for flood mapping, the results of this study give insights into priority areas for flood management in the Mzuzu City. Five conclusions which can be drawn are
i. MODIS and Sentinel 1 and 2 imagery shows satisfactory competence in mapping the spatial distribution of flood events with distance from the river network and urban drainage being significant factors (p<0.05) affecting flooding in Mzuzu city of Malawi.
ii. A relatively higher flood hazard probability and/susceptibility was noted in the south-eastern and western-most regions of the study area.
iii. CMORPH rainfall data can be used for flood inundation simulation satisfactorily especially in areas with scarce or poorly designed rain gauges such as Mzuzu City. When used for hydrological and flood extent simulation, the bias corrected satellite rainfall can significantly improve model efficiency.
iv. HEC-HMS model calibration and validation produced satisfactory model performance (NSE) = 0.7 and 0.6, respectively thus providing useful information (peak discharge) for flood routing and flood extent forecasting in Mzuzu city following extreme value analysis.
v. The validation of HEC-RAS model with GCPs produced a satisfactory significant level p < 0.05. The flood inundation maps produced in this study can be used as a basis for development of a local flood early warning system to help mitigate adverse impacts of flood disasters in Mzuzu. Overall, the study shows that flood inundation extents produced by MODIS and Sentinel satellite products and hydraulic modeling techniques match, thus proving the reliability of indirect scientific approaches in disaster mapping and prevention.
4.2 Recommendations
i. A higher resolution DEM is recommended for detailed characterization of the urban terrain to improve the accuracy of the flood inundation mapping.
ii. Techniques for integrating multiple satellite rainfall products can be used. It is possible that one product—CMORPH in this instance—is insufficient for characterizing the rainfall in the research area.
iii. The Mzuzu City authorities are recommended to make sure that residential and commercial buildings are not located in regions with the highest risk of flooding by using the flood hazard maps and adhering to specific zoning laws from the river. The aforementioned data can be used by the local government to inform the public and other interested parties about the reasons behind the non-development of certain land adjacent to rivers and streams. This can help avoid illegal settlements, where people buy land without understanding the variables that increase their risk of flooding, and increase public awareness.
iv. More research may be done in the city to lessen the harm that floods cause by examining the influence of climate change on flood susceptibility and evaluating the efficacy of flood mitigation strategies.
Data availability statement
The raw data supporting the conclusions of this article will be made available by the authors, without undue reservation.
Author contributions
WG: Conceptualization, Methodology, Writing—original draft. CL: Software, Supervision, Validation, Writing—original draft, Writing—review & editing. DR: Conceptualization, Formal analysis, Methodology, Writing—review & editing. PK: Investigation, Methodology, Supervision, Validation, Writing—review & editing. AM: Conceptualization, Formal analysis, Methodology, Writing—review & editing. JM: Formal analysis, Investigation, Methodology, Software, Writing—review & editing. LC: Methodology, Writing—review & editing, Software. MM: Validation, Writing—review & editing, Conceptualization, Methodology. ET: Software, Supervision, Validation, Writing—review & editing.
Funding
The author(s) declare financial support was received for the research, authorship, and/or publication of this article. This research was funded by WaterNet, a capacity-building initiative for integrated water resources management in eastern and southern Africa.
Acknowledgments
The authors wish to thank WaterNet who sponsored this research as part of an MSc thesis work.
Conflict of interest
The authors declare that the research was conducted in the absence of any commercial or financial relationships that could be construed as a potential conflict of interest.
Publisher's note
All claims expressed in this article are solely those of the authors and do not necessarily represent those of their affiliated organizations, or those of the publisher, the editors and the reviewers. Any product that may be evaluated in this article, or claim that may be made by its manufacturer, is not guaranteed or endorsed by the publisher.
References
Abdelkarim, A., Gaber, A. F., Youssef, A. M., and Pradhan, B. (2019). Flood hazard assessment of the urban area of Tabuk City, Kingdom of Saudi Arabia by integrating spatial-based hydrologic and hydrodynamic modeling. Sensors 19:1024. doi: 10.3390/s19051024
Ahamed, A., and Bolten, J. D. (2017). A MODIS-based automated flood monitoring system for southeast asia. Int. J. Appl. Earth Observ. Geoinf. 61, 104–117. doi: 10.1016/j.jag.2017.05.006
Beven, K., and Freer, J. (2001). Equifinality, data assimilation, and uncertainty estimation in mechanistic modelling of complex environmental systems using the GLUE methodology. J. Hydrol. 249, 11–29. doi: 10.1016/S0022-1694(01)00421-8
Castellarin, A., Galeati, G., Brandimarte, L., Montanari, A., and Brath, A. (2004). Regional flow-duration curves: reliability for ungauged basins. Adv. Water Resour. 27, 953–965. doi: 10.1016/j.advwatres.2004.08.005
Chang, T.-Y., Chen, H., Fu, H.-S., Chen, W.-B., Yu, Y.-C., Su, W.-R., et al. (2021). An operational high-performance forecasting system for city-scale pluvial flash floods in the southwestern plain areas of Taiwan. Water 13:405. doi: 10.3390/w13040405
Chirwa, J. A. (2023). The challenge of doing participatory communication in disaster risk reduction in Malawi. Global Media J. 21, 1–11.
Chomba, I. C., Banda, K. E., Winsemius, H. C., Chomba, M. J., Mataa, M., Ngwenya, V., et al. (2021). A review of coupled hydrologic-hydraulic models for floodplain assessments in Africa: opportunities and challenges for floodplain wetland management. Hydrology 8:44. doi: 10.3390/hydrology8010044
Chomba, I. C., Banda, K. E., Winsemius, H. C., Eunice, M., Sichingabula, H. M., and Nyambe, I. A. (2022). Integrated hydrologic-hydrodynamic inundation modeling in a groundwater dependent tropical floodplain. J. Human Earth Fut. 3, 237–246. doi: 10.28991/HEF-2022-03-02-09
Damayanti, F. (2011). Hydrodynamic modeling for flood hazard assessment in telomoyo catchment, Central Java, Indonesia (Master Thesis). Gadjah Mada University and Faculty of Geo-information Science and Earth Observation, University of Twente, Twente, Netherlands.
Dao, P. D., and Liou, Y.-A. (2015). Object-based flood mapping and affected rice field estimation with Landsat 8 OLI and MODIS data. Remote Sens. 7, 5077–5097. doi: 10.3390/rs70505077
Dewa, O., Makoka, D., and Ayo-Yusuf, O. A. (2021). Assessing capacity and implementation status of the disaster risk management strategy for health and community disaster resilience in Malawi. Int. J. Disast. Risk Sci. 12, 673–688. doi: 10.1007/s13753-021-00369-z
Ding, L., Ma, L., Li, L., Liu, C., Li, N., Yang, Z., et al. (2021). A survey of remote sensing and geographic information system applications for flash floods. Remote Sens. 13:1818. doi: 10.3390/rs13091818
Feldman, A. D. (2000). Hydrologic Modeling System HEC-HMS Technical Reference Manual, March 2000. Davis, CA: Hydrologic Engineering Center.
Fleischmann, A., Paiva, R., and Collischonn, W. (2019). Can regional to continental river hydrodynamic models be locally relevant? A cross-scale comparison. J. Hydrol. X 3:100027. doi: 10.1016/j.hydroa.2019.100027
Fleming, M., and Brauer, T. (2016). Hydrologic Modeling System, HEC-HMS, Quick Start Guide. US Army Corps of Engineers Institute for Water Resources Hydrologic Engineering Center. Available online at: https://www.hec.usace.army.mil/software/hec-hms/documentation/HEC-HMS_QuickStart_Guide_4.2.pdf (accessed October 14, 2019).
Gondwe, J., and Manda, M. (2021). Localizing children's play spaces through the child friendly city lens: reframing tools for children's inclusivity in Mzuzu City, Malawi. J. Inclus. Cit. Built Environ. 1, 81–88.
Government of Malawi G.. (2015). Malawi 2015 Floods Post Disaster Needs Assessment Report. Malawi: Government of Malawi Lilongwe.
Gumindoga, W., Rientjes, T., Haile, A., Makurira, H., and Reggiani, P. (2016). Bias correction schemes for CMORPH satellite rainfall estimates in the Zambezi River Basin. Hydrol Earth Syst Sci Discuss. 1–36. doi: 10.5194/hess-2016-33
Gumindoga, W., Rientjes, T. H. M., Haile, A. T., and Dube, T. (2014). Predicting streamflow for land cover changes in the Upper Gilgel Abay River Basin, Ethiopia: a TOPMODEL based approach. Phys. Chem. Earth 76–78, 3–15. doi: 10.1016/j.pce.2014.11.012
Gumindoga, W., Rientjes, T. H. M., Haile, A. T., Makurira, H., and Reggiani, P. (2019). Performance evaluation of CMORPH satellite precipitation product in the Zambezi Basin. Int. J. Remote Sens. 40, 1–20. doi: 10.1080/01431161.2019.1602791
Gumindoga, W., Rientjes, T. H. M., Reggiani, P., Makurira, H., and Haile, A. T. (2020). Hydrologic evaluation of bias corrected CMORPH rainfall estimates at the headwater catchment of the Zambezi River. Phys. Chem. Earth 115:102809. doi: 10.1016/j.pce.2019.11.004
Ha, L. T., and Bastiaanssen, W. G. (2023). Determination of spatially-distributed Hydrological Ecosystem Services (HESS) in the Red River Delta using a calibrated SWAT model. Sustainability 15:6247. doi: 10.3390/su15076247
Habib, E., Haile, A. T., Sazib, N., Zhang, Y., and Rientjes, T. (2014). Effect of bias correction of satellite-rainfall estimates on runoff simulations at the source of the Upper Blue Nile. Remote Sens. 6, 6688–6708. doi: 10.3390/rs6076688
Haghbin, S., and Mahjouri, N. (2023). Quantifying and improving flood resilience of urban drainage systems based on socio-ecological criteria. J. Environ. Manage. 339:117799. doi: 10.1016/j.jenvman.2023.117799
Hamdy, O., Abdelhafez, M. H. H., Touahmia, M., Alshenaifi, M., Noaime, E., Elkhayat, K., et al. (2023). Simulation of urban areas exposed to hazardous flash flooding scenarios in Hail City. Land 12:353. doi: 10.3390/land12020353
Huang, W., DeVries, B., Huang, C., Lang, M. W., Jones, J. W., Creed, I. F., et al. (2018). Automated extraction of surface water extent from Sentinel-1 data. Remote Sens. 10:797. doi: 10.3390/rs10050797
Hunter, N. M., Bates, P. D., Horritt, M. S., and Wilson, M. D. (2007). Simple spatially-distributed models for predicting flood inundation: a review. Geomorphology 90, 208–225. doi: 10.1016/j.geomorph.2006.10.021
Jiang, W., and Yu, J. (2022). Impact of rainstorm patterns on the urban flood process superimposed by flash floods and urban waterlogging based on a coupled hydrologic–hydraulic model: a case study in a coastal mountainous river basin within southeastern China. Nat. Hazards 112, 301–326. doi: 10.1007/s11069-021-05182-x
Jimme, M. A., Bashir, A., and Adebayo, A. A. (2016). Spatial distribution pattern and terrain analysis of urban flash floods and inundated areas in Maiduguri Metropolis, Borno State, Northeast, Nigeria. J. Geogr. Inf. Syst. 8:108. doi: 10.4236/jgis.2016.81011
Kumar, L., and Mutanga, O. (2018). Google Earth Engine applications since inception: Usage, trends, and potential. Remote Sens. 10:1509. doi: 10.3390/rs10101509
Lumbroso, D. (2020). Flood risk management in Africa. J. Flood Risk Manag. 13. doi: 10.1111/jfr3.12612
Maathuis, B. H. P., and Wang, L. (2006). Digital elevation model based hydro-processing. Geocarto Int. 21, 21–26. doi: 10.1080/10106040608542370
Makwinja, R., Kaunda, E., Mengistou, S., and Alamirew, T. (2021). Impact of land use/land cover dynamics on ecosystem service value—a case from Lake Malombe, Southern Malawi. Environ. Monit. Assess. 193, 1–23. doi: 10.1007/s10661-021-09241-5
Manyifika, M. (2015). Diagnostic Assessment on Urban Floods Using Satellite Data and Hydrologic Models in Kigali, Rwanda. Enschede: University of Twente. Available online at: http://essay.utwente.nl/84041/1/manyifika.pdf (accessed September 7, 2021).
Murwira, A., and Schmidt-Murwira, K. S. (2005). A GIS and Remote Sensing Based Flood Warning System for Muzarabani: Zambezi Catchment. Department of Geography and Environmental Science, University of Zimbabwe.
Mutelo, M. A. (2013). An Understanding of Variations in the Area Extent of Lake Lyambezi: Perspective for Water Resources Management (MSc thesis). University of Zimbabwe. Available online at: http://ir.uz.ac.zw/bitstream/handle/10646/1395/UZ_IWRM_MUTELO_Thesis_2013_Final.pdf;jsessionid=708A8B9DCBFEEF886D0555202F418EC2?sequence=1
Muvuti, T. (2021). Hydrodynamic simulation of rainfall-induced flooding in cities of low-and middle-income countries: a case study of Harare (Doctoral dissertation). Loughborough University.
Natarajan, S., and Radhakrishnan, N. (2020). An integrated hydrologic and hydraulic flood modeling study for a medium-sized ungauged urban catchment area: a case study of Tiruchirappalli City Using HEC-HMS and HEC-RAS. J. Inst. Eng. 101, 381–398. doi: 10.1007/s40030-019-00427-2
Nharo, T., Makurira, H., and Gumindoga, W. (2019). Mapping floods in the middle Zambezi Basin using earth observation and hydrological modeling techniques. Phys. Chem. Earth 114:102787. doi: 10.1016/j.pce.2019.06.002
Nhemachena, C., Nhamo, L., Matchaya, G., Nhemachena, C. R., Muchara, B., Karuaihe, S. T., et al. (2020). Climate change impacts on water and agriculture sectors in Southern Africa: threats and opportunities for sustainable development. Water 12:2673. doi: 10.3390/w12102673
Omondi, C. K. (2017). Assessment of Bias Corrected Satellite Rainfall Products for Streamflow Simulation: A TOPMODEL Application in the Kabompo River Basin, Zambia. Enschede: University of Twente.
Otokiti, K. V., Akinola, O., and Adeniji, K. N. (2019). Geospatial mapping of flood risk in the coastal megacity of Nigeria. Am. J. Geophys Geochem. Geosyst. 5, 129–138.
Pathan, A., Agnihotri, P. G., Patel, D. P., and Prieto, C. (2022a). Mesh grid stability and its impact on flood inundation through (2D) hydrodynamic HEC-RAS model with special use of Big Data platform—a study on Purna River of Navsari city. Arab. J. Geosci. 15:659. doi: 10.1007/s12517-022-09813-w
Pathan, A., Kantamaneni, K., Agnihotri, P., Patel, D., Said, S., and Singh, S. K. (2022b). Integrated flood risk management approach using mesh grid stability and hydrodynamic model. Sustainability 14:16401. doi: 10.3390/su142416401
Pathan, A. I., Agnihotri, P. G., Patel, D., and Prieto, C. (2021). Identifying the efficacy of tidal waves on flood assessment study—A case of coastal urban flooding. Arab. J. Geosci. 14:2132. doi: 10.1007/s12517-021-08538-6
Pedersen, A. N., Mikkelsen, P. S., and Arnbjerg-Nielsen, K. (2012). Climate change-induced impacts on urban flood risk influenced by concurrent hazards. J. Flood Risk Manag. 5, 203–214. doi: 10.1111/j.1753-318X.2012.01139.x
Prama, M., Omran, A., Schröder, D., and Abouelmagd, A. (2020). Vulnerability assessment of flash floods in Wadi Dahab Basin, Egypt. Environ. Earth Sci. 79, 1–17. doi: 10.1007/s12665-020-8860-5
Rana, V. K., and Suryanarayana, T. (2019). Evaluation of SAR speckle filter technique for inundation mapping. Remote Sens. Appl. Soc. Environ. 16:100271. doi: 10.1016/j.rsase.2019.100271
Revilla-Romero, B., Hirpa, F. A., Pozo, J. T., Salamon, P., Brakenridge, R., Pappenberger, F., et al. (2015). On the use of global flood forecasts and satellite-derived inundation maps for flood monitoring in data-sparse regions. Remote Sens. 7, 15702–15728. doi: 10.3390/rs71115702
Ringard, J., Becker, M., Seyler, F., and Linguet, L. (2015). Temporal and spatial assessment of four satellite rainfall estimates over French Guiana and North Brazil. Remote Sens. 7, 16441–16459. doi: 10.3390/rs71215831
Roy, S., and Mistri, B. (2013). Estimation of peak flood discharge for an ungauged river: a case study of the Kunur River West Bengal. Geogr. J. 2013:214140. doi: 10.1155/2013/214140
Scharffenberg, W. A., and Fleming, M. J. (2008). Hydrologic Modeling System HEC-HMS User's Manual. Davis, CA: Hydrologic Engineering Center.
Serrat-Capdevila, A., Merino, M., Valdes, J. B., and Durcik, M. (2016). Evaluation of the performance of three satellite precipitation products over Africa. Remote Sens. 8:836. doi: 10.3390/rs8100836
Shah, Z., Saraswat, A., Samal, D., and Patel, D. P. (2022). A single interface for rainfall-runoff simulation and flood assessment – a case of new capability of HEC-RAS for flood assessment and management. Arab. J. Geosci. 15:1526. doi: 10.1007/s12517-022-10721-2
Sivapalan, M., Takeuchi, K., Franks, S., Gupta, V., Karambiri, H., Lakshmi, V., et al. (2003). IAHS Decade on Predictions in Ungauged Basins (PUB), 2003–2012: shaping an exciting future for the hydrological sciences. Hydrol. Sci. J. 48, 857–880. doi: 10.1623/hysj.48.6.857.51421
Sowmya, K., John, C., and Shrivasthava, N. (2015). Urban flood vulnerability zoning of Cochin City, southwest coast of India, using remote sensing and GIS. Nat. Hazards 75, 1271–1286. doi: 10.1007/s11069-014-1372-4
Sudalaimuthu, K., Jesudhas, C. J., Ramachandran, U., Somanathan, A. K., Ganapathy, S., and Jeyakumar, R. B. (2022). Development of digital elevation model for assessment of flood vulnerable areas using Cartosat-1 and GIS at Thamirabarani river, Tamilnadu, India. Environ. Qual. Manag. 32, 75–85. doi: 10.1002/tqem.21842
Teng, J., Jakeman, A. J., Vaze, J., Croke, B. F., Dutta, D., and Kim, S. (2017). Flood inundation modelling: a review of methods, recent advances and uncertainty analysis. Environ. Model. Softw. 90, 201–216. doi: 10.1016/j.envsoft.2017.01.006
Ticehurst, C., Guerschman, J. P., and Chen, Y. (2014). The strengths and limitations in using the daily MODIS open water likelihood algorithm for identifying flood events. Remote Sens. 6, 11791–11809. doi: 10.3390/rs61211791
Tomar, P., Singh, S. K., Kanga, S., Meraj, G., Kranjči,ć, N., ?urin, B., et al. (2021). GIS-based urban flood risk assessment and management—a case study of Delhi National Capital Territory (NCT), India. Sustainability 13:12850. doi: 10.3390/su132212850
Torres, R., Navas-Traver, I., Bibby, D., Lokas, S., Snoeij, P., Rommen, B., et al. (2017). “Sentinel-1 SAR system and mission,” in 2017 IEEE Radar Conference (RadarConf) (IEEE), 1582–1585.
Trambadia, N. K., Patel, D. P., Patel, V. M., and Gundalia, M. J. (2023). Development of 2D hydrodynamic modeling for inundation assessment and flood early warning system: a case of depressed Ghed region, India. Water Pract. Technol. 1:13. doi: 10.2166/wpt.2023.145
Trubilowicz, J. W. (2016). Hydrometeorology and Streamflow Response During Rain-on-Snow Events in a Coastal Mountain Region. University of British Columbia.
USACE (2000). HEC-HMS Hydrologic Modeling System User's Manual. Davis, CA: Hydrologic Engineering Center.
Keywords: binary logistic regression, climate change, flood hazard, HEC-HMS, HEC-RAS, satellite rainfall products
Citation: Gumindoga W, Liwonde C, Rwasoka DT, Kowe P, Maviza A, Magidi J, Chikwiramakomo L, Mavaringana MdJP and Tshitende E (2024) Urban flash floods modeling in Mzuzu City, Malawi based on Sentinel and MODIS data. Front. Clim. 6:1284437. doi: 10.3389/fclim.2024.1284437
Received: 28 August 2023; Accepted: 15 April 2024;
Published: 21 May 2024.
Edited by:
Amos Tiereyangn Kabo-Bah, University of Energy and Natural Resources, GhanaReviewed by:
Guy Jean-Pierre Schumann, University of Bristol, United KingdomDhruvesh Patel, Pandit Deendayal Energy University, India
Copyright © 2024 Gumindoga, Liwonde, Rwasoka, Kowe, Maviza, Magidi, Chikwiramakomo, Mavaringana and Tshitende. This is an open-access article distributed under the terms of the Creative Commons Attribution License (CC BY). The use, distribution or reproduction in other forums is permitted, provided the original author(s) and the copyright owner(s) are credited and that the original publication in this journal is cited, in accordance with accepted academic practice. No use, distribution or reproduction is permitted which does not comply with these terms.
*Correspondence: Webster Gumindoga, d2d1bWluZG9nYUBnbWFpbC5jb20=