 Daniel Osgood1*
 S. Lucille Blakeley1*Souha Ouni2
 Markus Enenkel3
 Melody Braun1Thierry Lebel4
 Alessandra Giannini1,5
- 1Columbia Climate School, International Research Institute for Climate and Society, Columbia University, Palisades, NY, United States
- 2Willis Towers Watson, New York, NY, United States
- 3World Bank, Washington, DC, United States
- 4Institut des Géosciences de l’Environment, Université Grenoble Alpes, Grenoble, France
- 5Laboratoire de Météorologie Dynamique, Sorbonne Université (CNRS), Paris, France
Introduction: Weather-based index insurance is a financial instrument which allows smallholder farmers to protect themselves against climate shocks such as droughts and floods. In many cases, insurance indices are based on one or more earth observation datasets (e.g., rainfall, soil moisture, vegetative health) which are partly covering periods of more than 40 years. While remote sensing products and their associated data have improved over this time, understanding the historical climate variability and trends remains an essential piece in ensuring the development of indexes that best represent farmers’ risks. From a practical perspective, shortening time series to limit the risk of understudied climate variability, such as the Atlantic Multidecadal Variability, sometimes seems to be a quick solution. However, shorter time series jeopardize the overall robustness of the index. Therefore, understanding the links between climate variability, index design, and implications for farmers is key. Weather-based index insurance products in Sahelian West Africa usually face a challenge in robustly quantify underlying climatic decadal variation in seasonal rainfall.
Methods: This study analyzes the influence of decadal shifts in rainfall patterns in Sahelian West Africa, in particular Senegal, on index insurance calibration and design, concluding with practical recommendations for the next generation of drought risk finance instruments in the region.
Results: Our findings indicate that decadal variability has not led to a clear decrease in payouts in recent years compared to earlier years, despite an overall increase in seasonal rainfall. Rather, we find that interannual variability has increased which may be a more critical factor for assessing farmers’ agricultural risk than the increase in total rainfall.
Discussion: Focusing on key moments of the cropping calendar in the design of an index shows that an increase in the total average rainfall per season does not result in fewer payouts.
1 Introduction
Although there is strong evidence of decadal (10-yearly) rainfall variability in West Africa, in total amount of rainfall (Nicholson, 2013; Lebel and Ali, 2009), in interannual variability (Salack et al., 2013; Sanogo et al., 2015), in seasonal timing (Biasutti, 2013; Biasutti and Sobel, 2009; Salack et al., 2013; Sanogo et al., 2015), and in daily distribution (Giannini, 2015; Panthou et al., 2014; Salack et al., 2013), it is unclear how this variability impacts agricultural households. In-situ observations show that, compared to the 1950s and 1960s, the 1970s and 1980s were significantly drier, with total rainfall recovering in the 2000s (Lebel and Ali, 2009; Nicholson, 2005). There are satellite observations from the 1980s onwards, which have been used for a variety of applications. With the understanding that the rainfall was scarce in the 1980s but a subsequent rebound of rainfall in the 2000s onwards, it makes sense to assume that this increase in seasonal rainfall totals is beneficial to farmers. However, given that multiple, simultaneous changes may be occurring in daily variability and seasonality, it is important to question if the decadal shifts unambiguously benefit agriculture.
We know that the timing, distribution, and variability of rainfall within the season are as or even more important for the agricultural outcome than the seasonal total rainfall (FAO, 1986, 1979, 1977; Schwarzwald et al., 2021; Senay and Verdin, 2001; Verdin and Klaver, 2002). These impacts of climate on agriculture are also mediated by non-climatic factors like soil type and planting practices. We cannot observe these factors directly in data poor environments, and model-based approaches to conceptualizing them often make faulty assumptions. But, we do have some indication of which weather features the local Market deems as important-this is reflected in the design of the weather index insurance. Weather index insurance, intended to capture agricultural risk, is an application that is intimately linked to climate, with payouts driven by rainfall averages, timing, and variability. Therefore, rainfall indexes may offer insights about the relative importance of different climate processes, if insurance payouts cover the losses that are important to agriculture. Insurance companies do not themselves know how to rigorously account for the effects of climate variability, and a passive assumption among index insurance experts is that the observed long-term decadal variability in West Africa will result in unambiguously larger payouts in the early, drier part of the satellite estimate records of rainfall (the 1980s), with fewer and smaller payouts during the more recent period (the 2000s/2010s). Weather index insurance offers a concise summary of the agriculturally relevant local weather features. Through using the rainfall indexes, we contribute to the knowledge gap of how to robustly account for climate variability that may be difficult to quantify and include in the insurance policy. We use indexes, often used for insurance, to address whether a general increase in seasonal rainfall has unambiguously lead to increased rainfall during key moments of the season.
An insurance index is meant to approximate agricultural drought by measuring rainfall deficit during the agriculturally important times of the season and determining which years were the driest in historical perspective. Those years represent the times in which rainfall was measurably poor enough to merit a payout, according to the insurance companies. Index insurance is a relatively new approach that provides payouts based on formulas (indexes) of rainfall or other measurements, as opposed to direct assessment of yield losses (Barnett and Mahul, 2007; Chantarat et al., 2007). This innovation, intended to broaden the reach of agricultural insurance to smallholder farmers by reducing assessment costs and perverse incentives, provides a direct, quantitative link between climate data and farmer impacts, through its formula explicitly relating rainfall to the insurance payouts. In an active commercial insurance project, such as our case study, the details of the formula are hotly negotiated between farmers, insurance companies, scientists, international organizations, and government agencies through iterated participatory processes (Greatrex et al., 2015; Hellmuth et al., 2009; Michler et al., 2022; Osgood et al., 2018). For insurance, the participatory discussions, negotiations, and in some cases, brinkmanship must adequately reconcile concerns for sales to move forward, and insurance to be purchased.
Processes relevant to losses are discussed in relation to agricultural calendar and practices, including seasonal rainfall timing, total rainfall amounts, and daily rainfall variability. Although there are many formulations that index insurance can take, this paper will focus on effectively targeting two dominant seasonal vulnerabilities, through two windows of coverage (1) moisture deficit or delays at the beginning of the agricultural season, around sowing and establishment, and (2) moisture deficit or early cessation during the particularly vulnerable flowering and grain filling late part of the rainy season. The overall focus is to verify whether historical satellite data used over the years in the project insurance formula would have resulted in payouts during the two windows in historical years in which agricultural losses occurred according to multiple sources. If a well-known, critical historical drought year is missed, the evidence why it should not have paid out must be overwhelming for consensus that the insurance data and formulas are appropriate (Benami et al., 2021; Enenkel et al., 2019; Osgood et al., 2018). Clearly, since this is not a controlled scientific process, there are biases and limitations to the accuracy and objectiveness of the index formula and parameters as a representation of the impacts of climate on agriculture. However, it does provide a unique and useful perspective in a form that is straightforward to apply in analyses. It is a formula that has survived the trial by fire of intense, repeated negotiations in which the livelihoods of farmers and insurers alike are at stake, and which may provide useful insights to be used to complement more models, or yield based research approaches to understand the agricultural implications of decadal processes that may be developed with limited data and may not adequately reflect farmer preferences and choices.
The index formula allows us to compare average payouts (often called historical burn cost)1 over different time periods as an imperfect metric of the damage inflicted by rainfall to agriculture over that time period. If the characteristics of rainfall during one time period lead to higher payouts than during another time period, it not only increases a higher insurance price, but it is also a signal that the rainfall patterns during the higher payout period are more destructive to agriculture. In this way, although we are framing the question around index insurance, by using a rainfall index similar to the ones used in index insurance, we are in fact using the index as a parameter to better understand the structure of the rainy season itself. We discuss a range of climate processes on the decadal timescale addressing questions particularly relevant to insurance, performing a range of analyses as well as comparisons of the average payouts resulting from the index formula.
For the sake of clarity, we explore the simplest difference possible, dividing our 30-year rainfall climatology in half and comparing the modern 15 years (2000–2016) with the older years (1983–1999) in our analyses and diagnostics. If insurance payouts unambiguously decrease on average in the 15 modern years, that would indicate unambiguously reduced rainfall risk to agriculture from the insurance perspective. We investigate two of the most critical times of the season, the early sowing/establishment, and the later flowering/grain filling. Impacts in either are critical for agriculture, and may provide different insights into valuable climate processes to study.
In our simple diagnostics, we find that the hypothesis that payouts are unambiguously lower in the modern time period does not hold, with the early part of the season actually having a higher average payout-and higher price than during the initial, supposedly drier initial years. We also find that the primary driver appears to be increases in interannual variability for the initial part of the season. Although there is more rainfall on average, an increase in variance may be a more important change, one that increases the farmers’ risk. Acknowledging that we are not performing formal tests, and that the average payouts may be driven by a small number of extreme events, we check if the unanticipated results are simply driven by decadal biases in the satellite estimates used for the insurance, or if they are driven by differences in spatial scale between climate studies and the insurance project region. Finding that the unanticipated higher average payout for the early part of the season is robust across regional differences, satellite estimates, and rain gauge data, we explore if they appear to be driven by changes in seasonality, daily variability/intensity, and interannual variability, the primary effects described in the climate literature.
2 Background
2.1 Smallholder farmers and insurance
Since there are around 570 million small farms (<2 ha) on this planet (Lowder et al., 2016), it is critical to understand the relationship between smallholder farmers and climate processes. Family farms operate 75% of the global agricultural land and supply around 80% of the food consumed in developing countries (Lowder et al., 2021; WFP, 2019, 2020). Climate variability poses risk both in the immediate destruction of crops, and also in the longer-term impacts from risk making it unsafe for farmers (and lenders) to invest in productive assets, which can keep farmers trapped in low productivity systems (Greatrex et al., 2015).
Particularly in regions that lack a high density of quality controlled in-situ observations, satellite data are a crucial source of information for both the design of the indices and their scaling up to larger regions. Satellite data, particularly satellite-derived rainfall estimates, are the backbone of index parameterization and calibration. Validated with farmers and local expert information on agricultural calendar and historical bad years, they help to define the most sensitive periods during the season (windows) to be covered by the insurance, usually 30–40 days around sowing and flowering time. We follow the example of an index insurance product in Senegal (WFP, 2019) with related indexes in Ethiopia, Malawi, Zambia, Mozambique, and other countries (WFP, 2020). If a historically calibrated threshold of rainfall is reached, the payouts start (trigger) linearly until reaching a second threshold (exit), at which level the payouts are 100% of the sum insured. However, index insurance is not only sensitive to the timing of the windows or the correct estimation of rainfall amounts. In the case of drought index insurance, daily or weekly variability is important. Daily or dekadal (10-daily) “caps” are used as a mechanism to address the impact of high intensity short-term rainfall events. Any rainfall above the cap for a day or dekad is discarded from the rainfall sum for a window. Without caps, isolated severe rainfall events during otherwise dry years could drastically reduce the payouts, while the crops are mostly not able to use the moisture surplus due to runoff or evaporation.
Figure 1 depicts the crop calendar for the main crops in Central East and Southeast Senegal, as reported by farmers in the insurance design participatory processes. Staple crops are usually planted between June and mid-July. The harvest takes place between mid-September and mid-November.
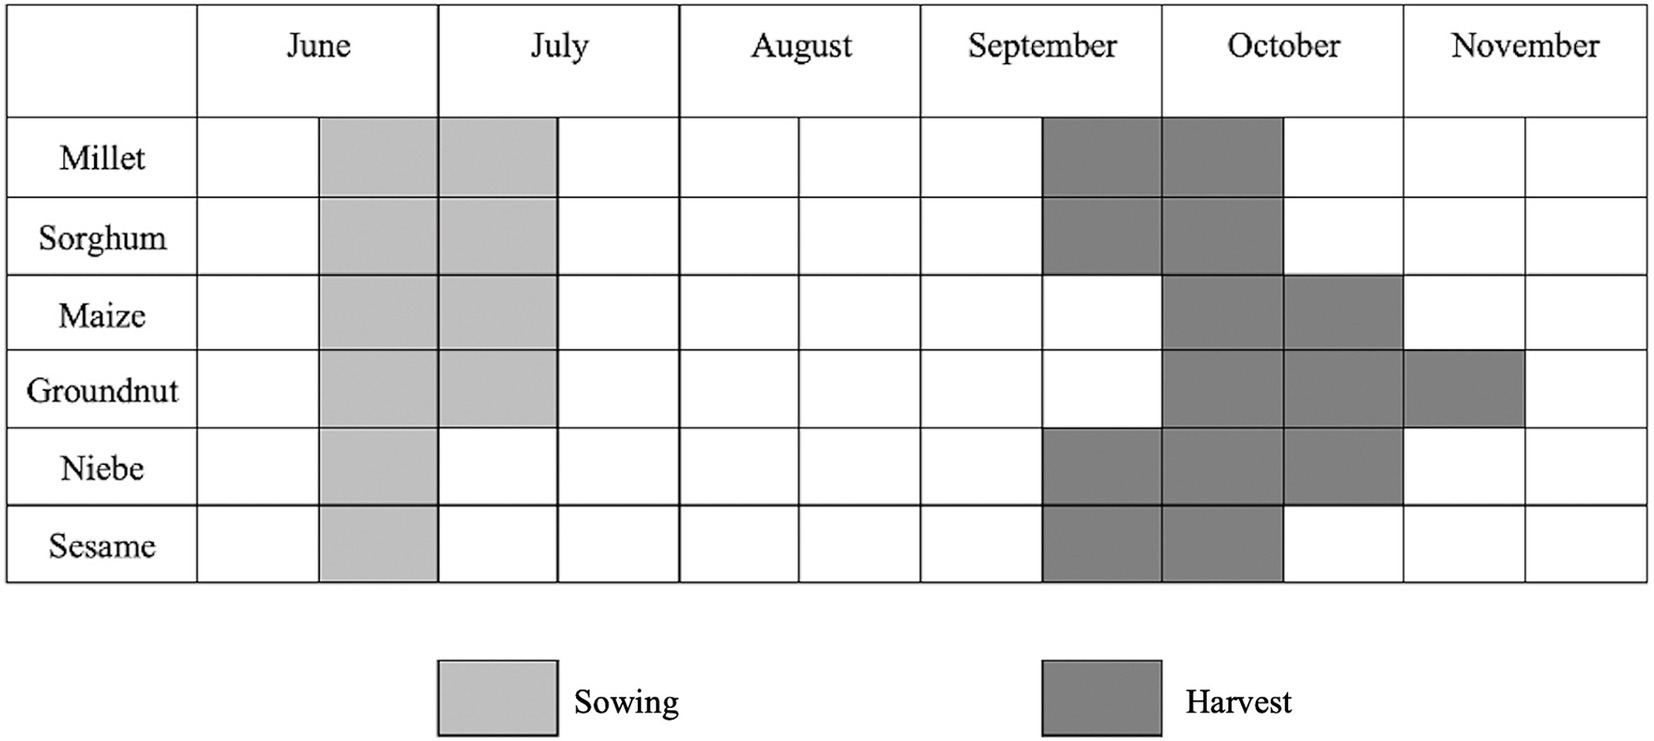
Figure 1. Crop Calendar reported by farmers interviewed in the Tambacounda region of Senegal. The light gray box highlights the sowing period, from mid-June to mid-July for Millet, Sorghum, Maize, and Groundnut, and July for Niebe and Sesame. The dark gray box highlights the harvest period, mid-September to mid-October for Millet, Sorghum, Niebe, and Sesame, the month of October for Maize, and the month of October to mid-November for Groundnut.
Participatory processes are used comprehensively throughout the index design process to engage farmers into the co-development of products that correspond to their needs and their context (Greatrex et al., 2015). Games and participatory exercises are used to improve farmer’s literacy on insurance, understand their agricultural practices and preferences to adjust the parameters and structure of the index formula, using the community’s seasonal vulnerability and recollection of historical extreme shocks (Osgood et al., 2018). Games have also been used to study questions such as farmer preferences for different insurance products and demand (Carter et al., 2008; Clarke et al., 2012; McPeak et al., 2010; Norton et al., 2014; Vasilaky et al., 2020, 2019).
The R4 Rural Resilience Initiative that we study was launched by the World Food Program and Oxfam America in 2011, to develop four complementary risk management strategies: risk reduction, through asset creation and improved resource management; Risk transfer through weather index insurance; prudent Risk taking through livelihood diversification and microcredit; and Risk reserves, through savings. Initially targeting under 14,000 farmers in Ethiopia, R4 has scaled to reach over 87,000 farmers across Ethiopia, Kenya, Malawi, Senegal, Zambia, and Zimbabwe in 2018, among which 55% are women (WFP, 2019, p. 4). Under its risk transfer component, insurance-for-asset schemes allow farmers to cover their insurance premium with their labor. Insurance is intended to unlock productive opportunities by providing access to better credit rates and supporting investment in inputs and strategies that improve agricultural productivity and resilience. In 2017, around $6.6 million of micro-insurance protection against extreme weather shocks was provided to R4 participants, and $1.5 million of insurance payouts were generated across R4 countries (WFP, 2019).
In Senegal, the R4 insurance project is implemented in the Tambacounda region, identified as the box in Figure 2. The Figure also depicts the Senegal and Sahelian regions utilized in later analyses.
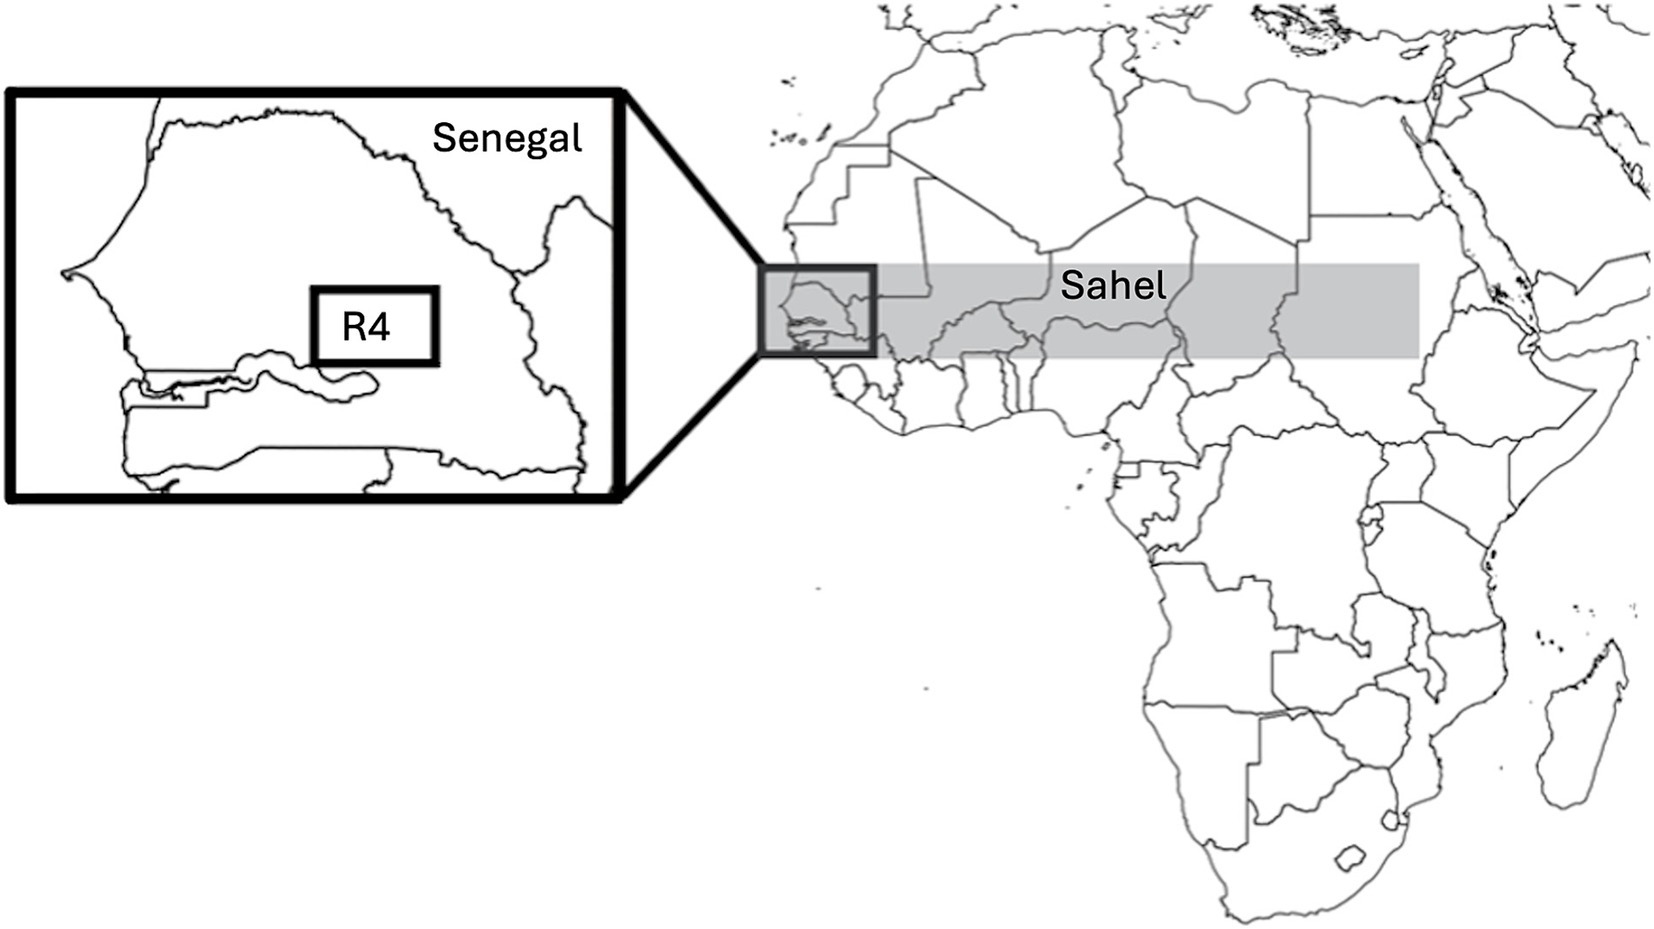
Figure 2. This is a map of the regions of interest: Tambacounda (15°15’W–13°15’W; 13°30’N–14°45’N rectangle on the left), Senegal, without the arid regions in the northern part of the country (17°30’W–11°24’ W; 12°18’N–16°42’N), and wider Sahel (18°W–33°E; 13°N–19°N, shaded in gray).
2.2 Climate processes
The Sahel is on the semi-arid southern shore of the Sahara (Giannini, 2015). The climate in the Sahel is sensitive to global oceanic conditions (Folland et al., 1986; Giannini et al., 2003). The outstanding multi-decadal variations observed over the course of the 20th century—the alternation of the anomalously wet 1950s and 1960s, persistent drought in the 1970s and 1980s, and the most recent epoch of partial recovery (Ali and Lebel, 2009; Nicholson, 2005)—have been partially attributed to the influence of human emissions of aerosols and greenhouse gasses on sea surface temperatures (Giannini and Kaplan, 2019). Year-to-year variations, e.g., drought associated with the occurrence of the warm phase of the El Niño-Southern Oscillation (ENSO), can be exacerbated or mitigated by the background tendency toward wet or dry (Giannini et al., 2003; Janicot et al., 1996; Ward and Ward, 1998).
In this study we focus on the period from 1983 to 2016, which we split into two contrasted periods. The initial period, from 1983 to 1999, starts with the two driest years in the century and climbs up to a partial recovery—partially because total annual rainfall does not attain the levels of the wet mid-century epoch. The modern period, from 2000 to 2016, is dominated by year-to-year variability.
The historical influence of human emissions, however, is not prolog to a future return to drought. Persistent drought in the 1970s and 1980s is understood to have resulted from the unique post-World War II combination of aerosols cooling the North Atlantic (Booth et al., 2012) and greenhouse gasses warming the global tropical oceans (Held et al., 2005). The reduction in aerosol pollution around the North Atlantic in the 1990s is consistent with the current basin-wide warming trend, which contrasts the drying influence of the global tropics (Giannini et al., 2013). The more recent generation of IPCC scenarios more coherently associates warming with wetting across the Sahel (Biasutti, 2013), with the exception of the very westernmost longitudes encompassing Senegal. However, whether the total amount of rainfall increases or decreases is overpowered by projections of a seasonal shift, with a delay in the onset of the season that is made up for by more abundant rainfall later in the season (Biasutti, 2013; Biasutti and Sobel, 2009; Marvel et al., 2020). Based on probabilistic projections of production impacts from climate change, a decrease in yields for West African staple crops (e.g., groundnut, yam) is estimated (Lobell et al., 2008). In simulations of index insurance on climate model data, extreme cases of climate change can make index insurance unaffordable (Siebert, 2015). In addition, (Mills, 2005) states that climate change might also have “adverse impacts on insurance affordability and availability,” for instance due to increasing weather-related losses. Decadal processes and their impact on the accuracy of index insurance targeting yields in West Africa has been investigated, finding that utilizing additional indicators beyond rainfall (such as evaporative demand) may be worthwhile (Blakeley et al., 2020).
Changes expected from warming have begun to emerge. Le Barbé and Lebel (1997) attribute the observed difference in total rainfall between the wet and dry historical periods to a decline in the number of rainy days. In contrast, an increase in the intensity in daily rainfall is detectable in the most recent recovery (Giannini et al., 2013; Panthou et al., 2018; Chagnaud et al., 2022). Salack et al. (2013) find changes in the timing of the most extreme dry spells, occurring at the beginning and at the end of the rainy season, that are consistent with the timing of onset in our modern period being delayed, as in the dry historical period, and the timing of the demise also occurring later, as in the wet historical period. Sanogo et al. (2015) find a trend toward a delay in the demise of the rainy season that is more robust than any change in the onset date. The lengthening of the season might be attributed to the Inter-Tropical Convergence Zone (ITCZ) lingering longer in the poles due to climate change (Biasutti and Sobel, 2009). However, there is also significant evidence that decadal processes may also impact the length of the rainy season, with the positive (negative) phase of the AMO associated with a northward (southward) shift of the ITCZ, resulting in more (less) rainfall in the Sahel (García‐García and Ummenhofer, 2015).
Focusing on Senegal, based on a network of rainfall stations, Ali and Lebel (2009) and Lebel and Ali (2009) find significant trends in total rainfall that question the rainfall recovery over the western Sahel (15°W–10°W) indicating that the region, which encompasses Senegal, has stayed comparatively drier than the central Sahel after the 1990s. Consistently, Giannini et al. (2013) show that the number of rainy days at stations in Senegal has not increased since the drought period as much as daily rainfall intensity has, especially since 2000.
Given the evidence from the climate investigations for the Sahel, it is worthwhile to explore relationships between climate and agriculture relating to increased amounts of rainfall, increases in daily variability, and shifts in seasonal timing.
3 Materials and methods
3.1 Datasets
Since the R4 insurance project directly utilizes the Africa Rainfall Climatology, Version 2 (ARC2), it is a central dataset utilized in our analyses. Documented by Novella and Thiaw (2013) it is provided by the National Oceanic and Atmospheric Administration (NOAA) and available for the African continent from 1983 to present on a 0.1° grid. ARC2 is based on two input data sources: 3-hourly infrared data from a geostationary satellite (Meteosat) and quality-controlled in-situ observations from the GTS (Global Telecommunication System) network. The gauge observations are used as daily accumulated rainfall. In contrast to CHIRPS (described below), ARC2 is available without the monthly delay. With regard to data quality, a summer dry bias over West and East Africa has been detected. A validation study, which compared ARC2 to Tropical Rainfall Measuring Mission (TRMM, Version 7) and RFE2 over Western Uganda (Diem et al., 2014) showed that ARC2 tended to overestimate rainfall at all in-situ stations, but underestimated boreal-summer rainfall at the station in Uganda’s North. In general, ARC2 performed much better with regard to seasonal totals than for daily, 10-daily or monthly averages.
The Climate Hazards Group Infrared Precipitation with Stations (CHIRPS) precipitation dataset merges satellite measurements with a much larger set of station observations and a long-term mean field to produce pentadal (5-day) estimates of precipitation (Funk et al., 2015). These data run from 1981-present, and extend from 50S to 50 N over all longitudes at a 0.05-degree spatial resolution. While a preliminary product is produced with short latency (3-days) utilizing only a subset of available station data, the production-level dataset is available in the middle of the following month. These data have been shown to well capture the observed spatial and temporal variability in rainfall, as captured by independent station data (Katsanos et al., 2016). CHIRPS is designed primarily for drought monitoring applications, but has also been successfully used in running crop models, land surface models and as an independent variable in human health studies.
The daily Global Telecommunication System (GTS) station precipitation and temperature data from the Climate Prediction Center, station 8707 (Tambacounda) provides ground-based rain gauge data for the station within the study area GTS (2022).
The Global Historical Climatology Network-Daily (GHCN-Daily) dataset integrates daily climate observations. Containing station-based measurements from land-based stations worldwide for precipitation measurement as well as other meteorological elements (NCEI, 2022). This study uses the GHCN Tambacounda station:
Name of the station: SG000061687.
Location: 13.7670, −13.6830, 50.0.
Region: Tambacounda, Senegal.
Network affiliation: GSN 61687.
3.2 Methods
The methods approach taken in this paper is to compare rainfall during the initial (1983–1999) and modern (2000–2016) time periods using a series of increasingly specific criteria, in order to understand the ways in which the climate has or has not shifted between these time periods, and whether any such “decadal” shifts have been consequential to agricultural risk as measured in index insurance. We analyze the seasonal rainfall totals, the rainfall totals during the windows (or periods of interest, see below for more details) with and without caps (see below for more information) and the dry-day counts (or number of days with <1 mm of rainfall).
We start under the initial hypothesis that the rainfall has unambiguously increased from the 1980s to the present day. Framing our questions under this hypothesis, we first ask whether normalized rainfall during the agriculturally important times of the year has increased, as measured by comparison of index insurance’s average historical payouts (historical burn) over each period. This is our key metric of decadal change; to unpack it further, we then present similar comparisons of periods for the seasonal total rainfall, as well as the sub-seasonal (daily) and interannual variability in rainfall. Finally, to understand the degree to which artifacts of ARC2/CHIRPS data processing might be driving our findings, we compare our results to those derived from ground-based data sources.
All of these investigations use a time series from 1983 to 2016, which we split into the initial (1983–1999) and modern (2000–2016) years for the purposes of our “decadal” comparisons. ARC2 data is primarily used throughout for the comparisons, as it was the dataset used to calculate commercial insurance payouts in the R4 project at the time. CHIRPS data is also used for comparison in the seasonal rainfall comparisons, while GHCN daily rain gauge data was used in the ground data sources. The spatial scale of the ARC2 data is a time series of the pixel for the insurance calculations, the sub-seasonal (daily) variations, annual variability, and comparison to the ground-based data. The GHCN data is from the Tambacounda rain gauge station. Finally, the CHIRPS data and the ARC2 datasets are evaluated at the R4 project region, Senegal region, and the larger Sahelian region in the Rainfall averages across seasons and the “Satellite data diagnostic” sections.
For insurance calculations, we apply the insurance formula for the index insurance sold in 2016 for the early (sowing/establishment) window and late (flowering/grain filling) window, defined as dekads 18–21 (a dekad is a 10-day period, dekads 18–21 correspond to June 21–July 31), and dekads 25–29 (corresponding to September 1–October 20) respectively. The index is calculated through summing the dekadal (10-day) rainfall amount. One could add a daily cap, in this study any cap added would be 8 mm, meaning 8 mm of rainfall for a day would be counted, any rainfall above that amount would be disregarded. Then those dekadal totals are added together for the “window” (either early, June 21–July 31; or late, September 1–October 20). This window total is compared against a trigger, the starting point for payouts, and an exit, the point at which a full payout is issued. The trigger and exit are analogous with frequency of payouts-more frequent payouts are associated with the trigger (in this case 1 in 5 years receiving a payout), and less frequent payouts are associated with the exit (in this case 1 in 10 years receiving a full payout). The burn rate is the total average payouts that happen over a given observation period, typically the time series of the data used to calculate the index itself. The historical burn rate ideally should match the losses experienced by the farmer purchasing the insurance, which is used as a robustness test by comparing farmers’ self-reported bad years. Rainfall deficit during a window is calculated as a rainfall total sum which is less than the trigger will result in a payout; between the trigger and exit is a partial payout, less than the exit is a total payout. A daily cap of 8 mm was applied to ARC2 data in the initial “Results” section, the “Sub-seasonal/daily variability” section, and the “Annual variability” section, but was removed when comparing to other datasets as this cap was calibrated for ARC2 data.
For the validation against ground-based data, we compare results derived from GHCN rain gauge data to results derived from remote sensing data aggregated at various scales (the pixel of the rain gauge as well as the administrative levels mentioned above).
In order to determine if daily variability drives the unanticipated results, we remove the daily variability feature of the index (the cap) from the insurance formula and recalculate the prices with the ARC2 satellite estimates used for the official insurance payouts. We perform t-tests of the means and a Kolmogorov–Smirnov test of the distributions of rainfall for the R4 region, Senegal, and Sahel distributions of rainfall, conduct correlations of the time series from the satellite data, and analyze the variance of the rain gauge and satellite data.
4 Results
Table 1 presents the average payouts (burn cost) for the initial and modern years, averaged over all of the villages in the project. The average over the full available climatology is also provided, for comparison. Payouts calculated by the index formula are in the form of percent of maximum possible payout for the early window, dekads 18–21 (early in the agricultural season), and the late window, dekads 25–29 (late in the agricultural season).
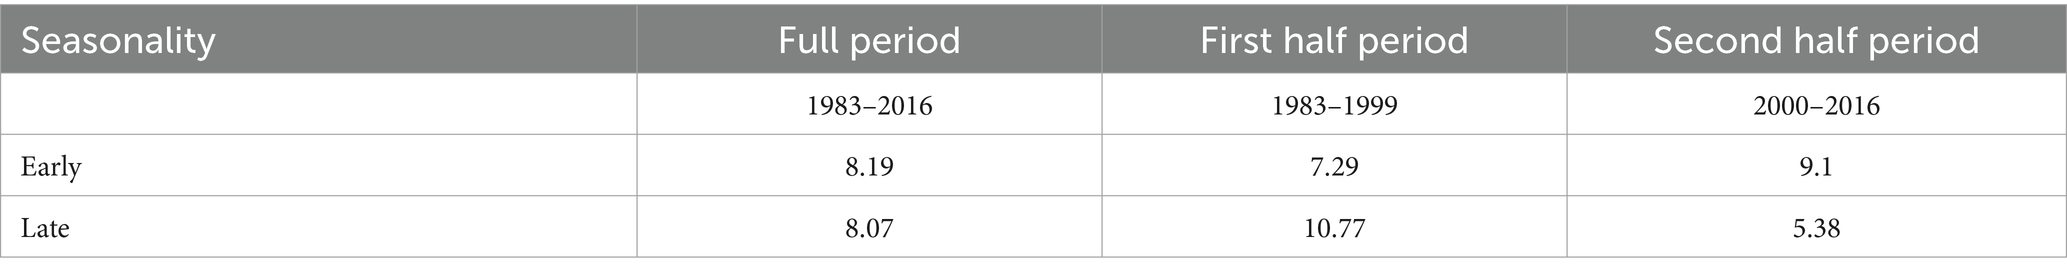
Table 1. Average payout percentage (historical burn) comparison, calculated as the official contract was calculated with the official data source (ARC2).
The hypothesis, as stated earlier in this paper, that payouts are unambiguously lower does not hold. Instead of having a lower average payout, the early window for the modern (2000–2016) period has a higher average payout than during the initial, supposedly drier initial years.
This suggests that for the initial sowing and establishment, the agricultural situation may have actually worsened, as opposed to improving, from the “perspective” of the insurance. For the later season flowering/grain filling months, the average payouts are dramatically lower in the modern years, consistent with a greening of the Sahel that is beneficial to agriculture during the latter part of the season. In a simple average of the prices over the two parts of the season, the late season decreases dominate. We also compare averages by payout village to the averages by pixels of the insurance project, as some villages are in the same pixel, therefore providing that pixel with increased weighting. Results are qualitatively similar, with the modern early window having higher payouts, although the magnitude of changes is decreased, indicating that the magnitude may be partially driven by the density of villages within pixels.
The results reported in this paper were a surprise to the R4 insurance project, which performed similar analysis for insurance price negotiations. Project partners were concerned that because of decadal variation, the price in the current wetter period would be artificially high due to droughts in Decades past that might not be reflective of the current climate situation. They were negotiating with insurance companies to include fewer of the initial years in price calculations. However, in the pricing calculations for the package at that time, inclusion of the additional, drier years in the 1980s decreased the premium as opposed to increasing it, as anticipated. This paper was inspired by that surprise.
This simple diagnostic illustrates that we cannot assume that the multi-decadal variation unambiguously benefits agriculture, and that the multiple processes clearly have mixed effects, with net impacts on agriculture depending heavily on the relative vulnerability of agriculture over different months of the season.
4.1 Rainfall averages across seasons, increases in spatial domain, and datasets
To understand what drives the changes in prices, we begin by first investigating seasonal rainfall totals. Figure 3 presents the rainfall estimates for the initial and modern time periods averaged by dekad (10-day period) over the growing season in the R4 region of Tambacounda. In these figures, the early and late vulnerable periods of the season are highlighted.
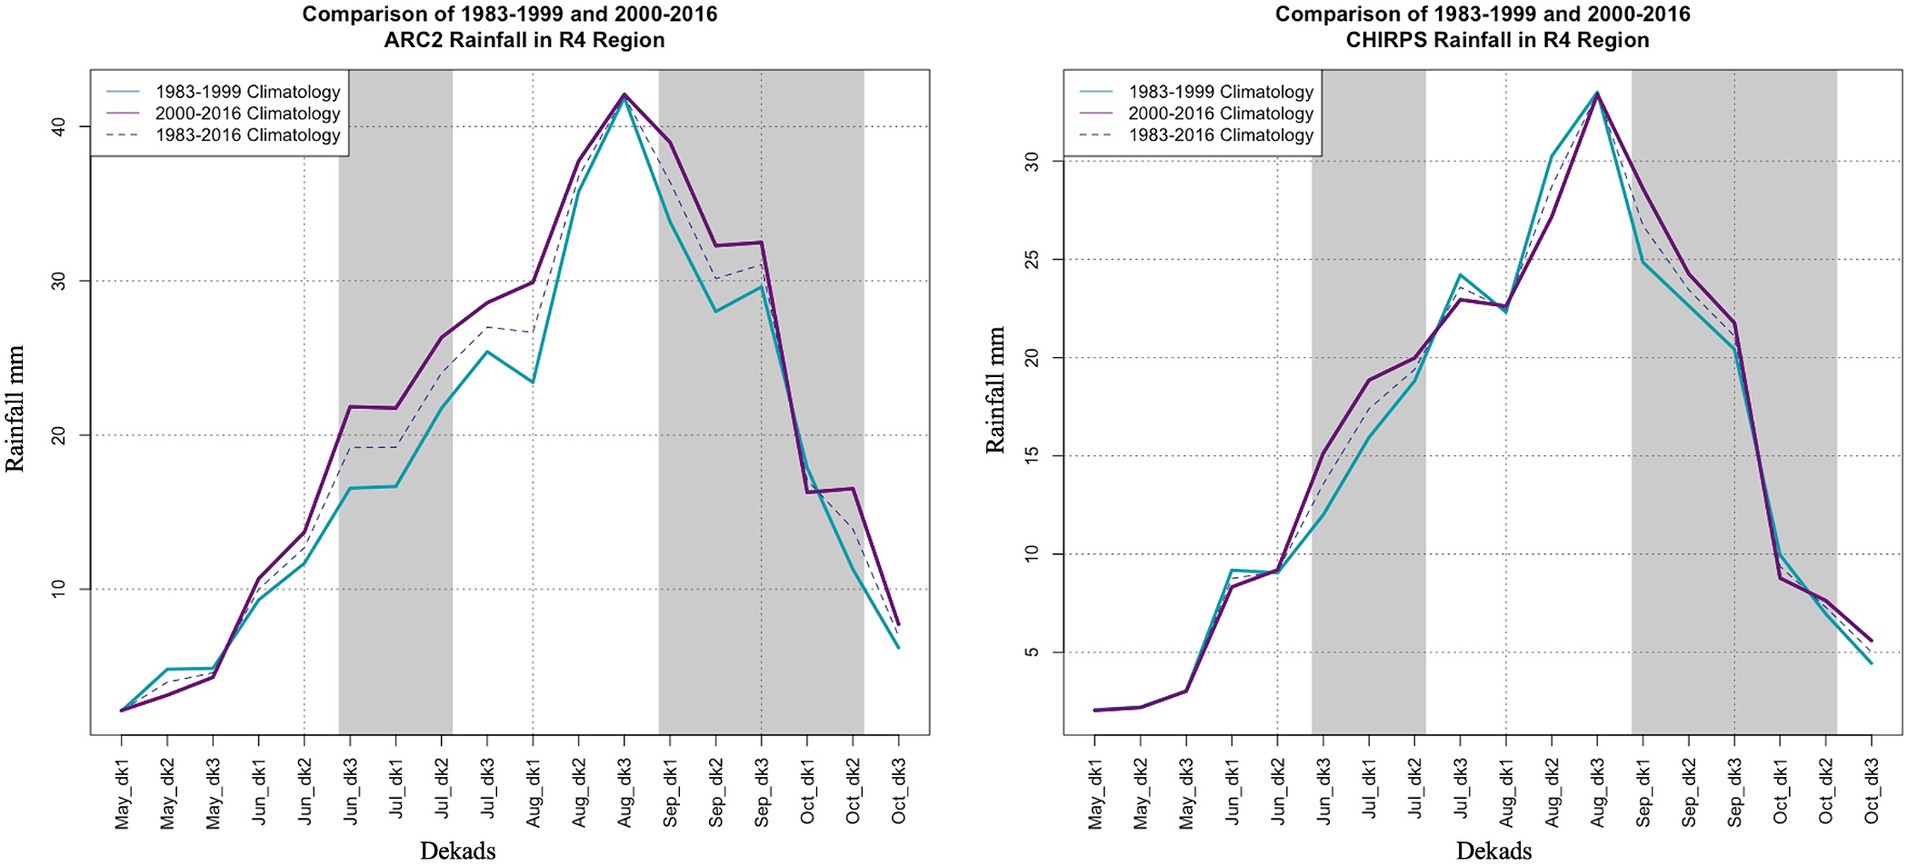
Figure 3. ARC2 (left) and CHIRPS (right) climatology from 1983 to 1999 (blue line), 2000–2016 (purple) and 1983–2016 (dotted line) for the Tambacounda region, R4 region (15°15’W–13°15’W, 13°30’N–14°45’N), in Central Senegal; areas shaded in grey highlight the insurance windows, the June–July window being the early window and the September–October window being the late window.
For both satellite estimates, the sowing period has substantially higher rainfall in modern years for the early window for both satellite sources, with both satellite data estimates reflecting rainfall. The average rainfall increase is more clearly evident in the early and mid-part of the season, and less evident in the later part of the season which was the seasonal timing that had lower insurance costs in 2000–2016. Additionally, we conducted a t-test of the means and a Kolmogorov–Smirnov test of distributions for both satellite datasets across the Sahel, Senegal, and R4 regions between the 1983–1999 and 2000–2016 periods and found that all were significantly different. These results are in line with the literature, stating that the 1980s and 1990s had substantially less rainfall than the subsequent 2000–2010s. Results of this test can be found in the appendix.
As can be seen in Tables 2, 3, the actual rainfall totals and rainfall daily averages echo the figures, with higher rainfall in modern years in both seasonal windows, and are qualitatively consistent across the two satellite rainfall estimate datasets. Because rainfall is consistently higher on average in the years from 2000 to 2016, the higher prices do not appear to be driven by decreases in average rainfall.
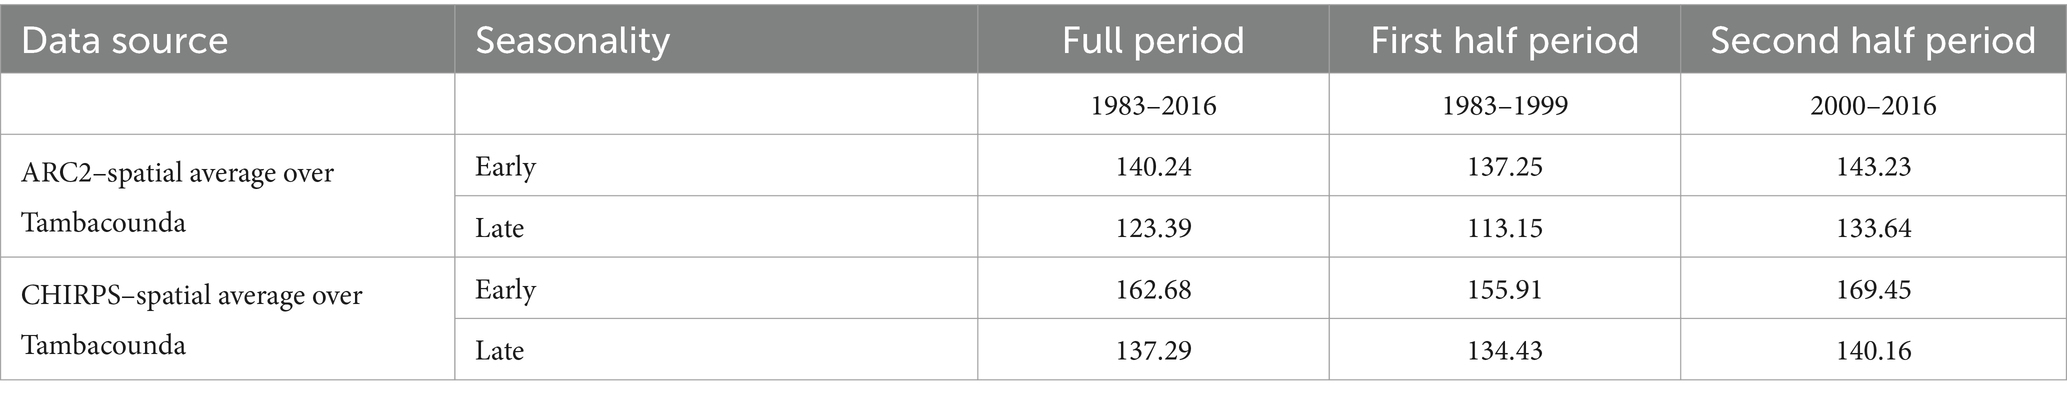
Table 2. Total rainfall for early and late windows over R4 region by dataset.
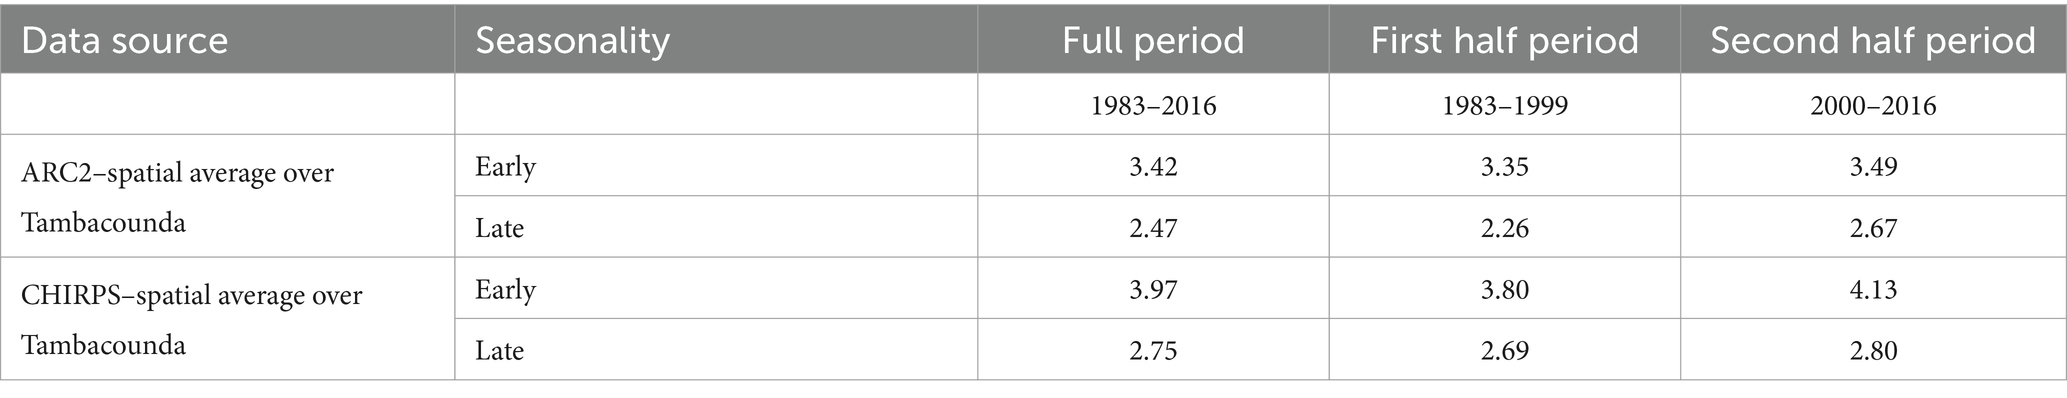
Table 3. Average daily rainfall for early and late windows over the R4 region by dataset.
Similarly, increases in mean rainfall are evident if we expand the spatial extent of the averages to across the larger Sahelian region, consistent with the increases in averages reflected in the climate literature. We repeat the seasonal rainfall calculations across the increased spatial scales of the Sahel (Figure 4) and Senegal (Figure 5), with both satellite estimates showing similar increases in averages as at the insurance spatial scale.
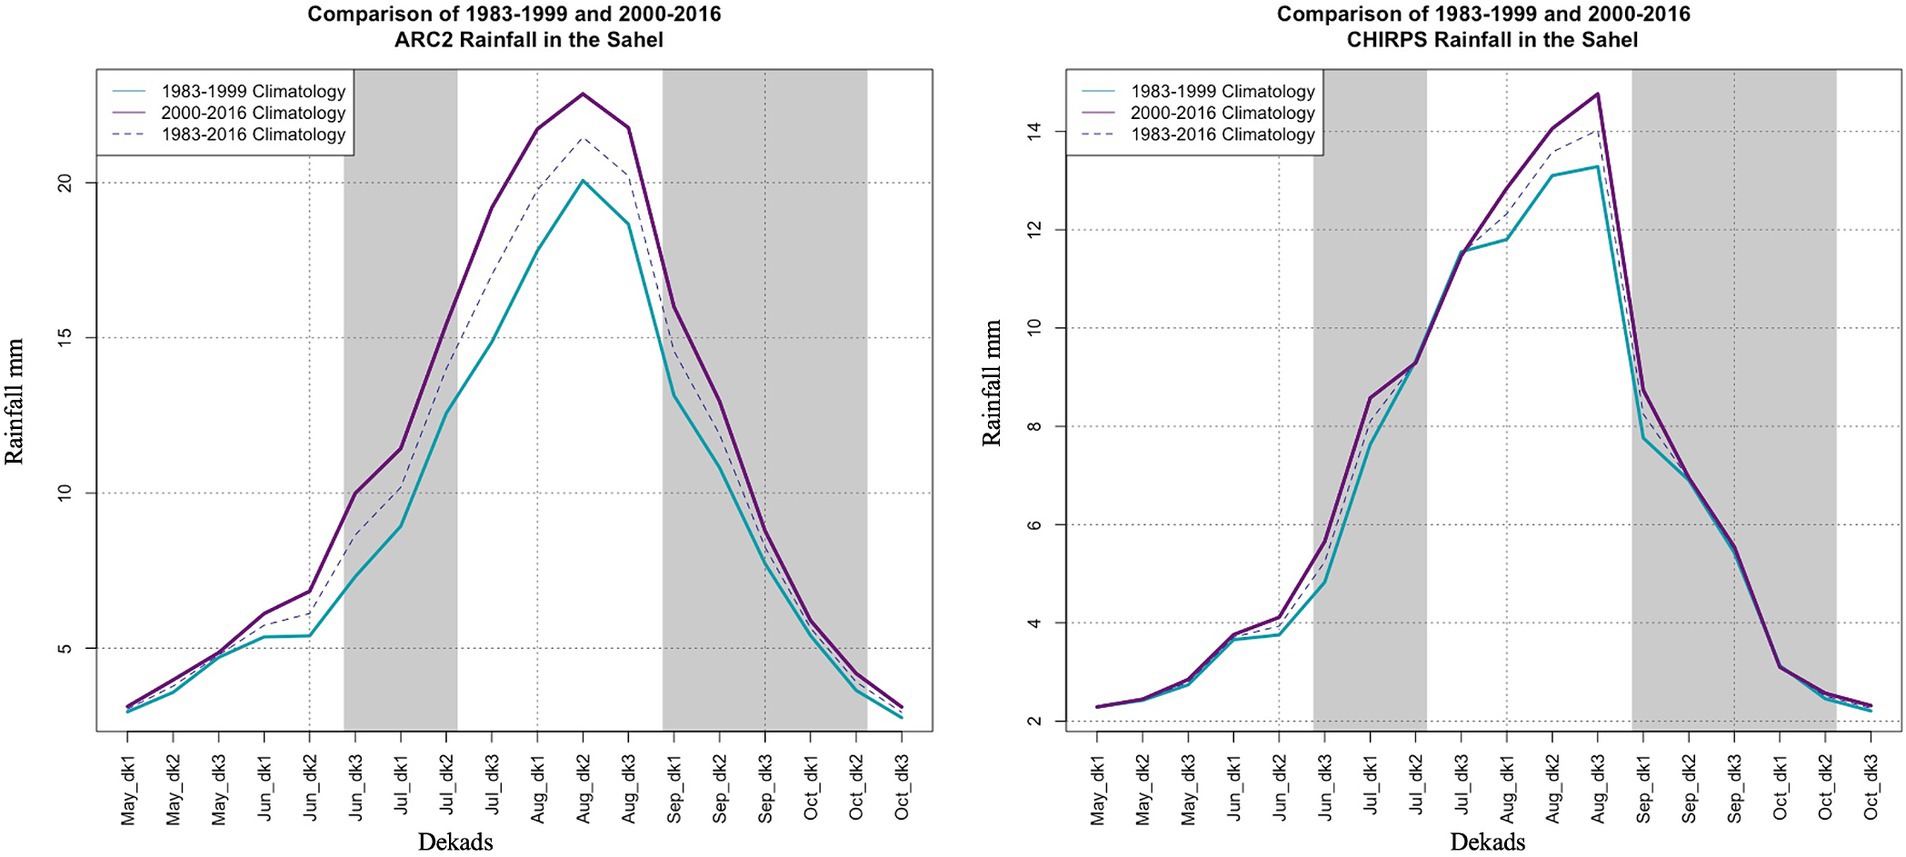
Figure 4. ARC2 (left) and CHIRPS (right) climatology from 1983–1999 (blue line), 2000–2016 (purple) and 1983–2016 (dotted line) for the Sahel. The Sahel is (18°W-33°E; 13°N-19°N). The areas shaded in grey highlight the early and late insurance windows.
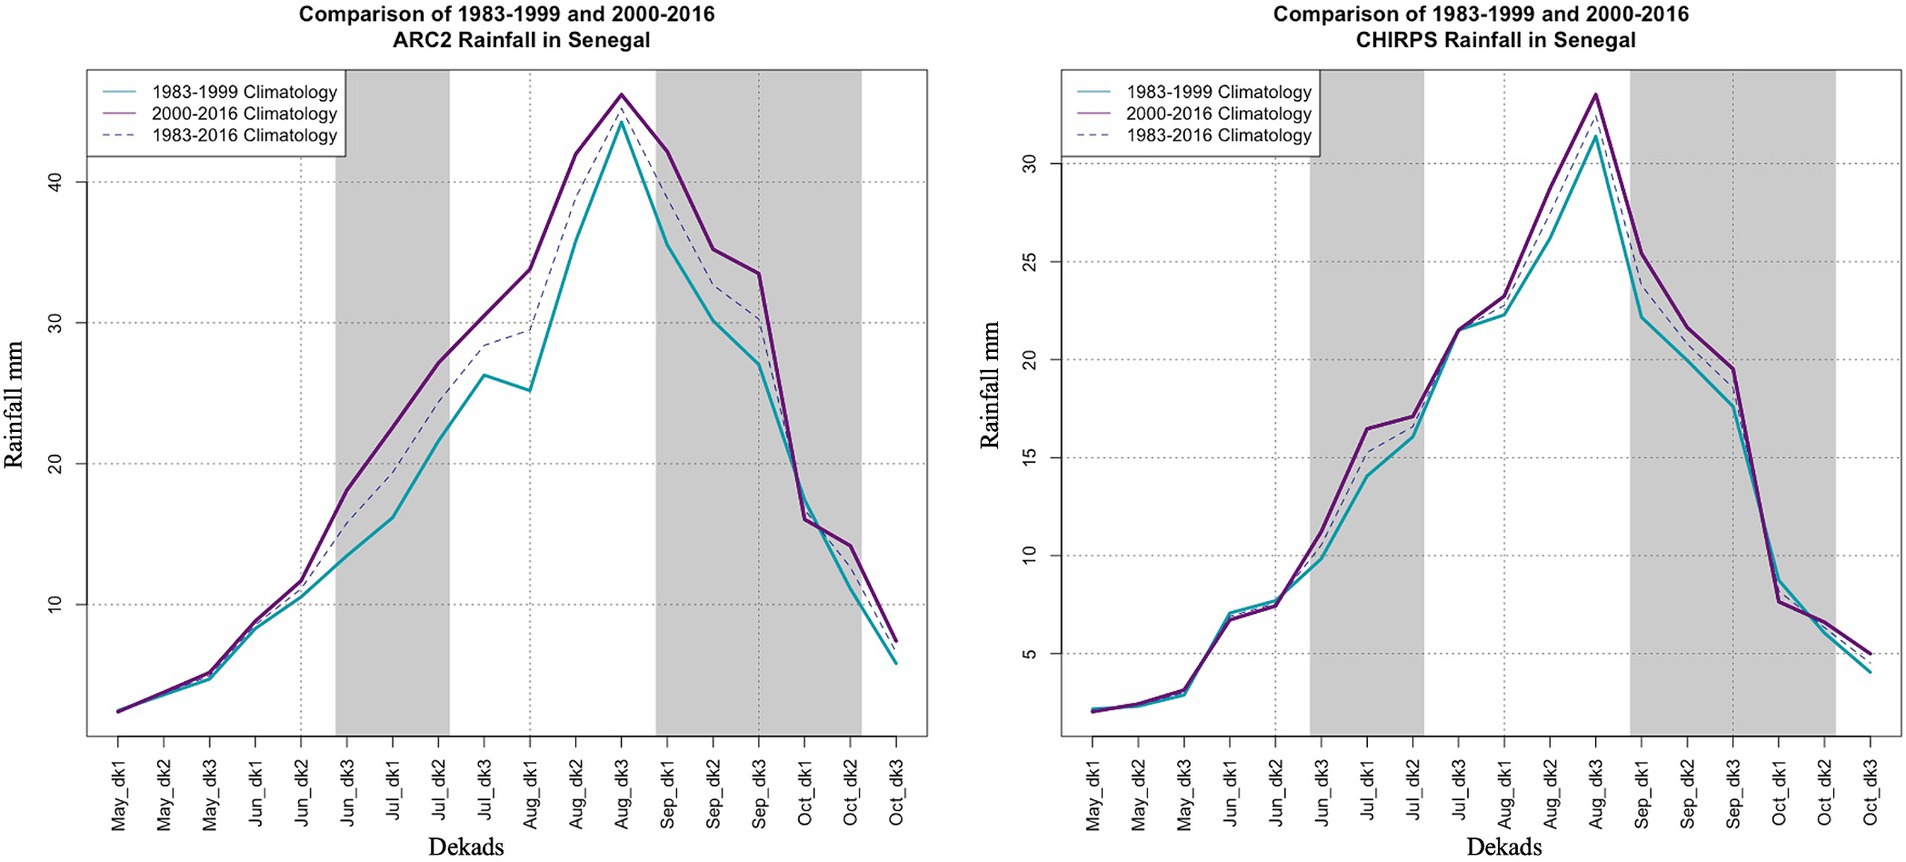
Figure 5. ARC2 (left) and CHIRPS (right) climatology from 1983–1999 (blue line), 2000–2016 (purple) and 1983–2016 (dotted line) for Senegal (17°30’W–11°24’W; 12°18’N–16°42’N), areas shaded in grey highlight the early and late insurance windows.
4.2 Sub-seasonal/daily variability
One compelling possibility that could drive increases in modern insurance prices could be increases in sub-seasonal or daily variability. Daily variability in rainfall is a well-established threat to agriculture, due to constraints such as soil water storage (FAO, 1986, 1979, 1977; Senay and Verdin, 2001; Verdin and Klaver, 2002). The parameters for addressing daily variability are hotly debated in the insurance design process. We therefore explore evidence of sub-seasonal variability increasing over time.
When we look at a sub-seasonal breakdown of rainfall events, we do see some evidence of changes in the number of dry days in the late window of the growing season. The dry-day count is the sum of days with <1 mm of estimated rainfall in a time window. Figure 6 shows an average increase of ~5 dry days between the old and the modern period.
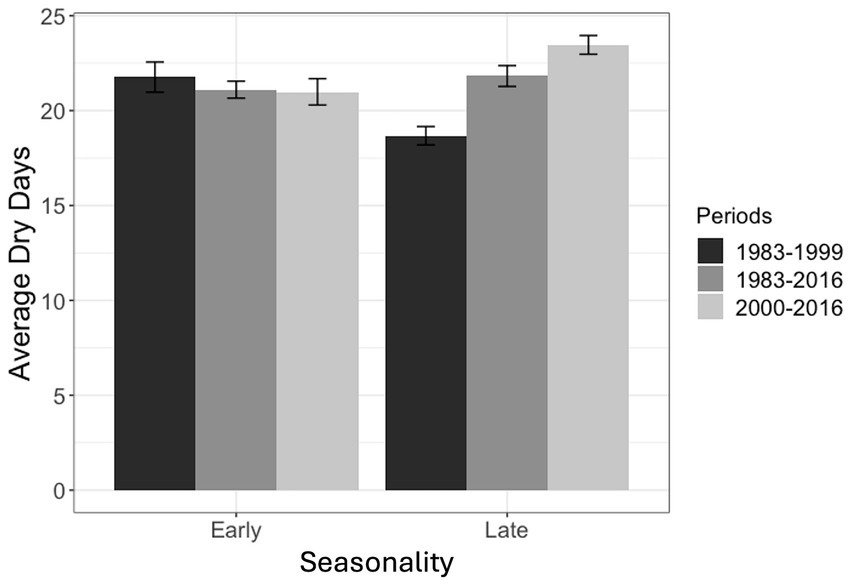
Figure 6. Total number of days in the early and late window (seasonality) with <1 mm of estimated rainfall, averaged across R4, using ARC2 Data, with the first half period in dark gray, the climatology in medium gray, and the second half period in light gray.
Table 4 presents the updated calculations based on removing the cap and recalculating the payouts. The finding of higher prices for the early window in the modern times is still quite evident, even with the daily filter removed. As an increase is observed with both a daily cap and no daily cap, we can infer that there are not isolated, high rainfall events driving the difference in prices. Therefore, daily rainfall is not the primary driver of the unanticipated results.
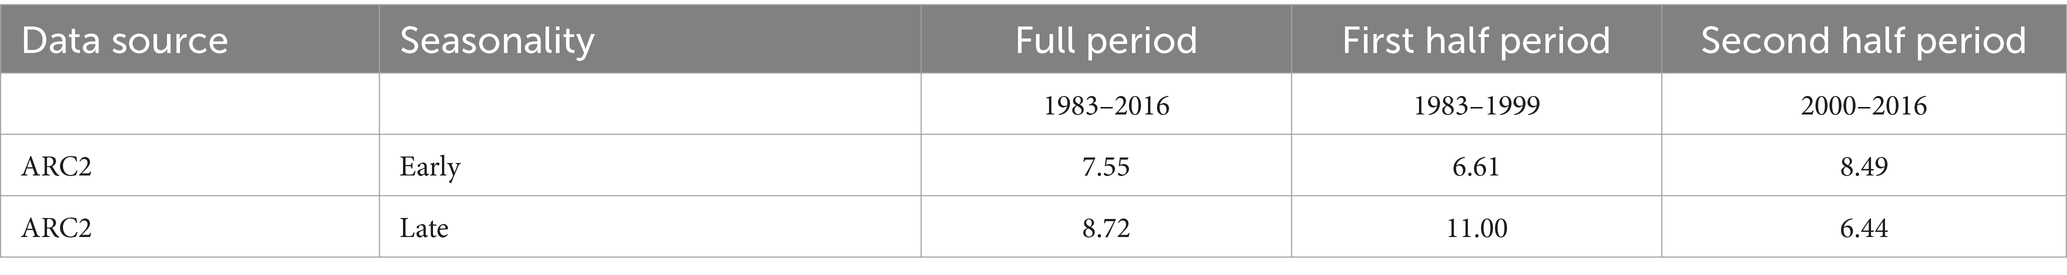
Table 4. Average payout (historical burn) comparison, payouts calculated with an index that had no daily cap for ARC2 data.
4.3 Annual variability
Because insurance and agricultural risk is largely driven by shocks and variability, we next explore the role of annual rainfall variability in driving increases in insurance payouts. Table 5 presents a comparison of the variance in rainfall, which we use as a proxy for annual rainfall variability, by part of the season across the different time periods. The year-to-year rainfall variance has increased in both windows for the modern period, particularly for the early window which showed higher prices.
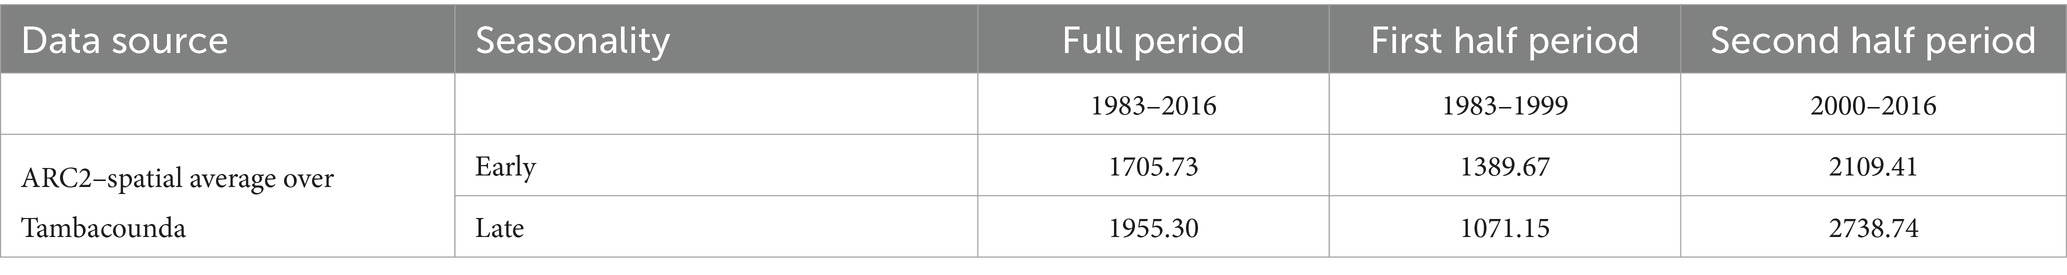
Table 5. Variance of rainfall using ARC2 rainfall estimates, no daily cap.
Clearly, increases in year-to-year variance are driving the increased prices seen in the insurance. However, in the insurance we do not see both windows increasing in price, only the early one.
Interestingly, when we include the daily cap, the index feature to address daily variability prior to calculating the variance, we see that the adjusted year to year variance mimics the prices of the insurance, as the daily filter leads to less year-to-year variance in the late window in modern times as compared to the filtered late window from 1983 to 1999 (Table 6). Therefore, it appears that the changes in price, and associated risk as negotiated by farmers, is driven by changes in year-to-year variance that interact with changes in daily variability.
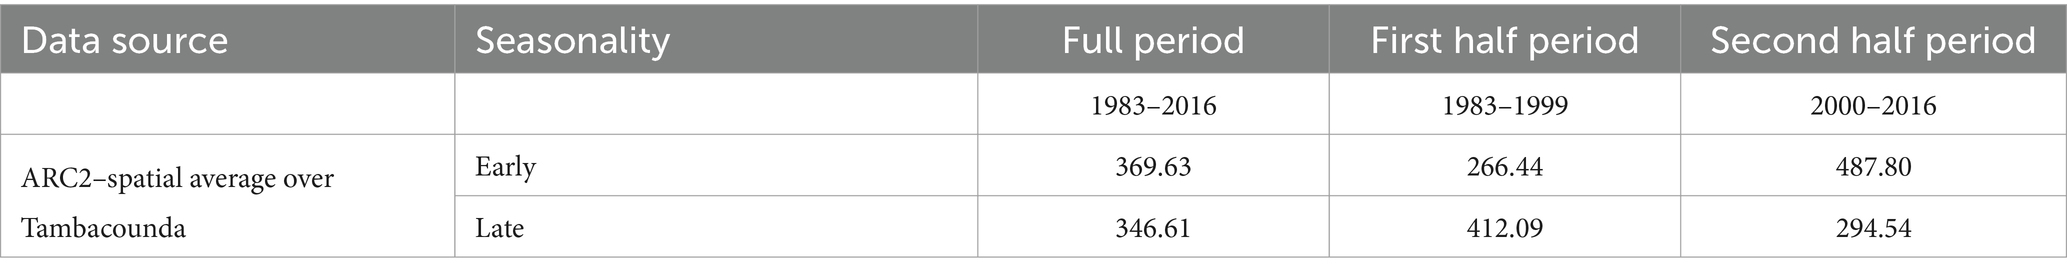
Table 6. Variance of rainfall calculated after processing with daily cap of 8 mm using ARC2 rainfall estimates.
4.4 Evidence of changes through ground data sources
As the insurance payouts are calculated using satellite rainfall estimates with known biases that vary over decadal timescales (Diem et al., 2014), and unknown potential biases in variance and daily variability, it is important to check if we see unambiguous improvements in ground based rain gauge measurements of rainfall. Unanticipated results may be driven by artifacts of the remote sensing estimation process, and not evident on the ground.
It is necessary to note that rain gauge data, although useful for point information, has its own set of limitations. Rain gauge data is representative of a specific location, and cannot be used to determine rainfall of other locations (even at a distance of only 10 km away). This is because the nature of rainfall is mostly convective (Grimes et al., 1999), resulting in highly discrete distributions (Grimes and Pardo-Igúzquiza, 2010). Although satellites are not replacements for on-the-ground measurements, they are able to capture information about larger spatial scales, due to their measurement of cloud distribution instead of point information.
We perform a rain gauge diagnostic on the GHCN daily rain gauge in the study region, which provides continuously reported data over our study period.
Table 7 presents the payouts if the insurance is calculated specifically using the Tambacounda GHCN rain gauge. Because the rain gauge represents a single point, it is likely that the insurance payouts averaged over the entire region would be different. For the sake of comparison, we also provide the ARC2 based satellite estimate calculations for the single pixel that the rain gauge falls within. The insurance product is calibrated for the rain gauge and the pixel using the same techniques as used for the commercial insurance project in other locations. Note that the daily cap, which was calibrated for ARC2 based on farmer matching with bad years, may not be appropriate for the rain gauge, due to calibration issues.
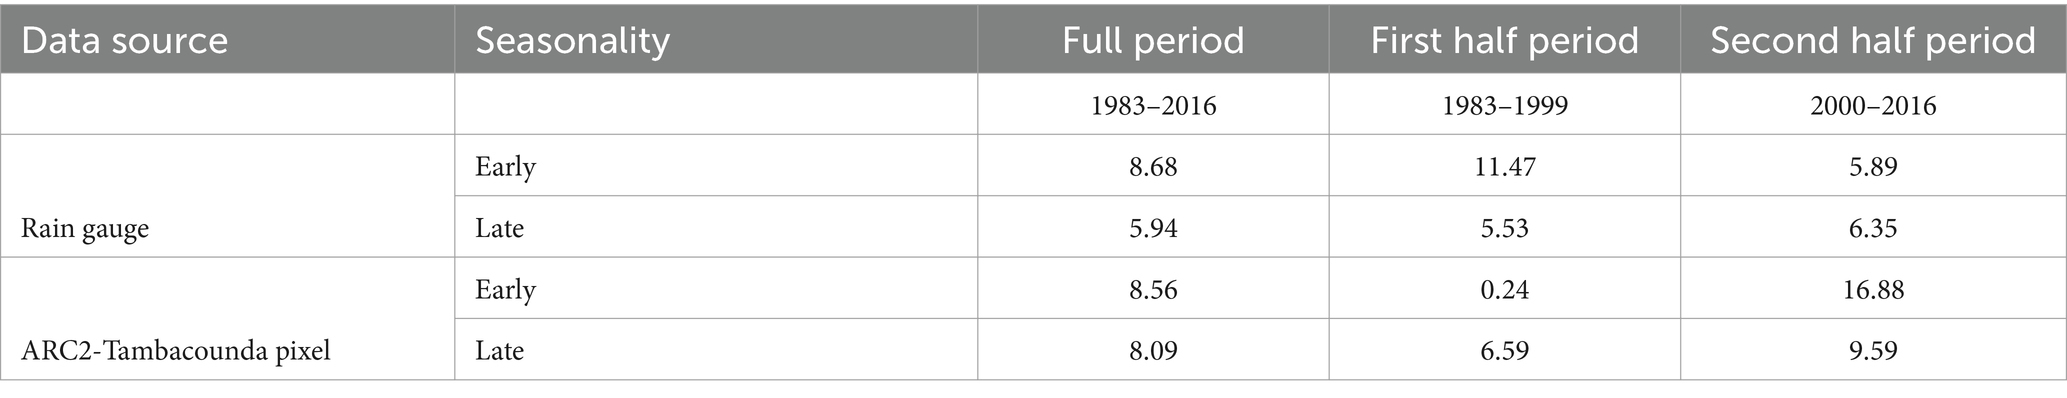
Table 7. Average payout comparison between Rain gauge and ARC2 with an 8 mm daily cap.
The payouts are not unambiguously lower for the modern years. The table presents a substantial amount of variation in the average payouts between the periods, with the rain gauge reflecting higher payouts in modern years for the late window (as opposed to the early window from the ARC2 regional average). The ARC2 driven payouts for the single pixel are higher in modern times for both the early and late window. This highlights that one cannot simply assume that agriculture has unambiguously benefitted from increases in rainfall in modern Decades, evidenced in both satellite estimates as well as ground observations. Complexities in the multiple climate process are therefore important to take into account when relating climate to agriculture. Critically, it is important to further develop remote sensing products that are robust and well calibrated for not only mean rainfall, but year to year variance, seasonality, and daily variability.
This is further underscored as we explore the seasonality mean and variance across the rain gauge and multiple satellite estimates at that pixel, as depicted in Tables 8, 9. Note that because the 8 mm cap used in the index was manually calibrated to specific ARC2 levels, it is unlikely to be appropriate for other data sources. It has therefore been omitted from further calculations.
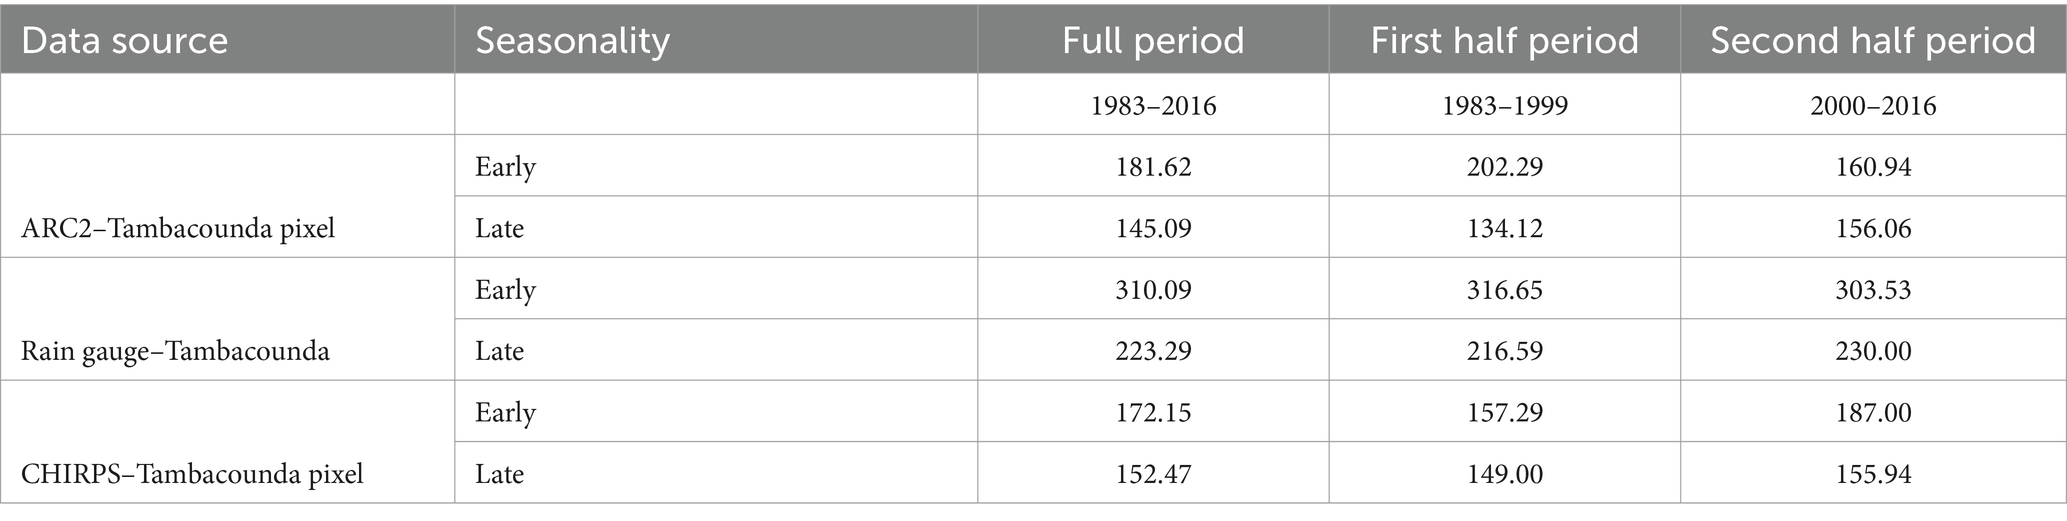
Table 8. Average payout comparison between Rain gauge, ARC2, and CHIRPS without 8 mm daily cap.
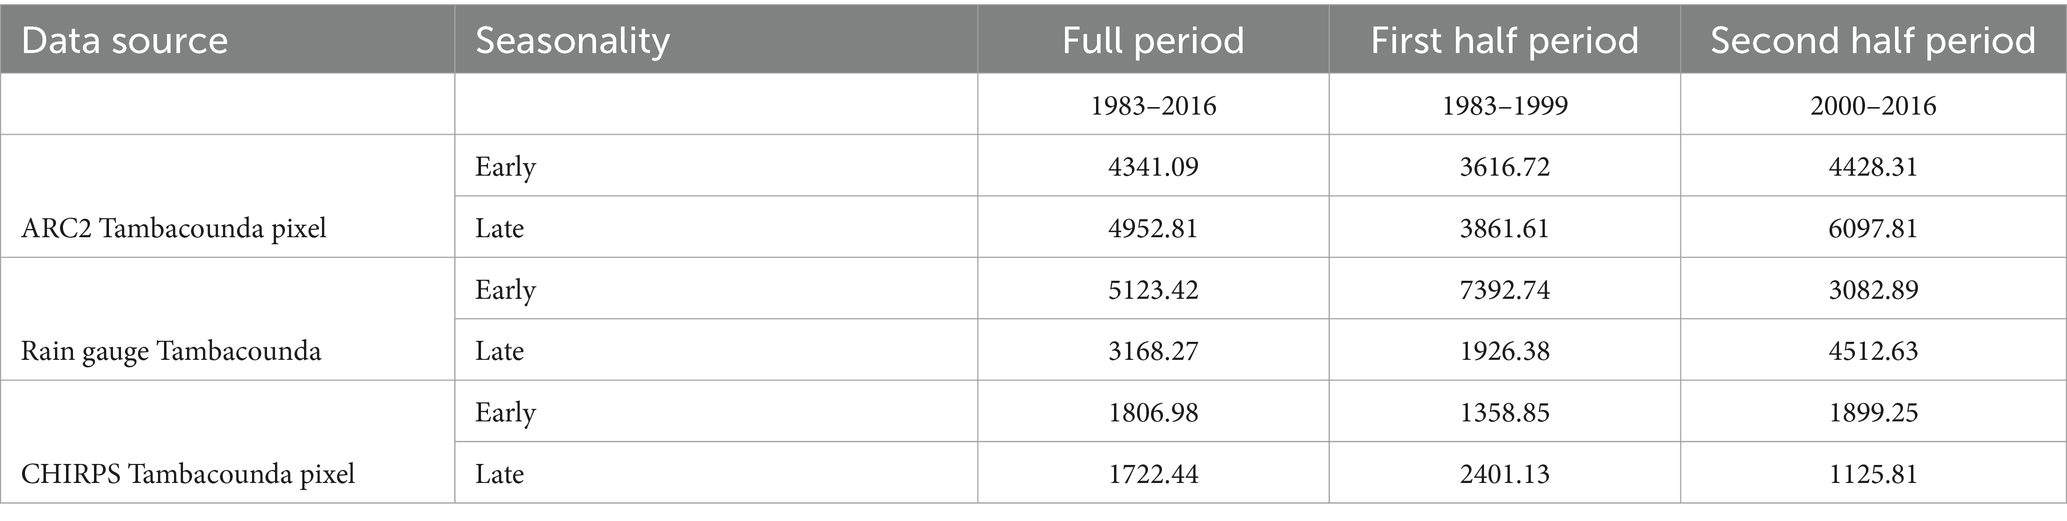
Table 9. Comparison of variance of rainfall between Rain gauge, ARC2, and CHIRPS.
Given the heterogeneity in changes across the time periods between the rain gauge and different remote sensing estimates, the robustness of satellite rainfall estimates across Decades is important to improve for index insurance applications.
4.4.1 Satellite data diagnostic
We more formally compare ARC2 with CHIRPS by correlating the two satellite estimates pixel by pixel. Table 10 demonstrates the correlation coefficient of standardized monthly anomalies for CHIRPS/ARC2 rainfall from 1983 to 1999 and 2000–2016. While the correlation coefficient of seasonal anomalies (not shown) does not result in significant differences, the monthly correlations show both spatial and temporal differences in the Tambacounda region (blue rectangle in Figure 7).
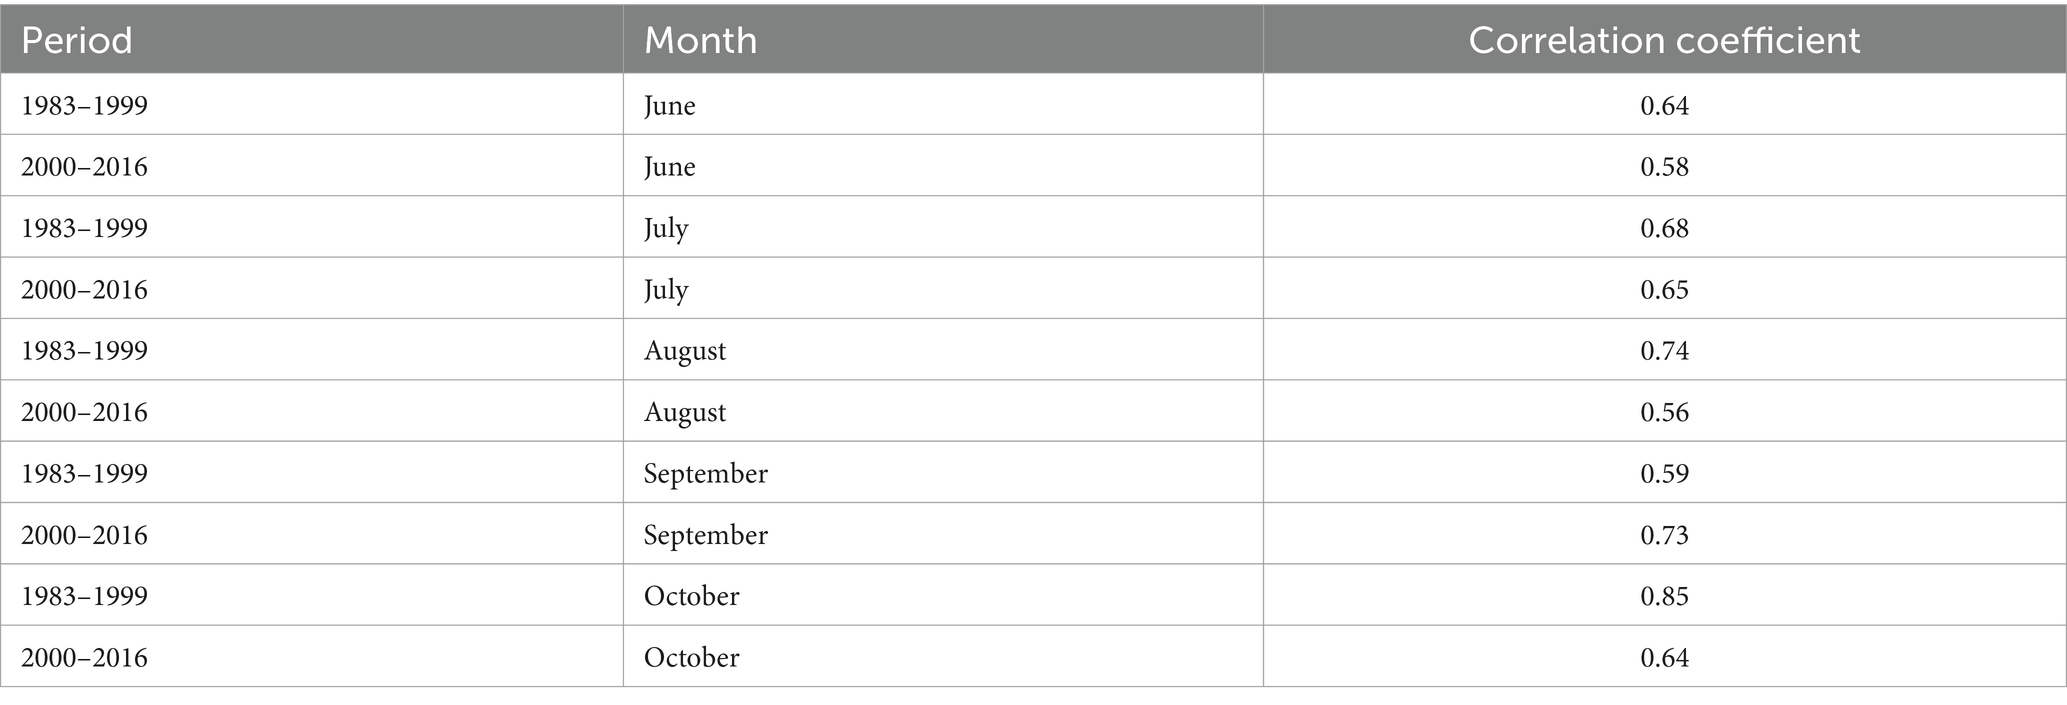
Table 10. Correlation coefficients for monthly CHIRPS/ARC2 anomalies in Tambacounda.
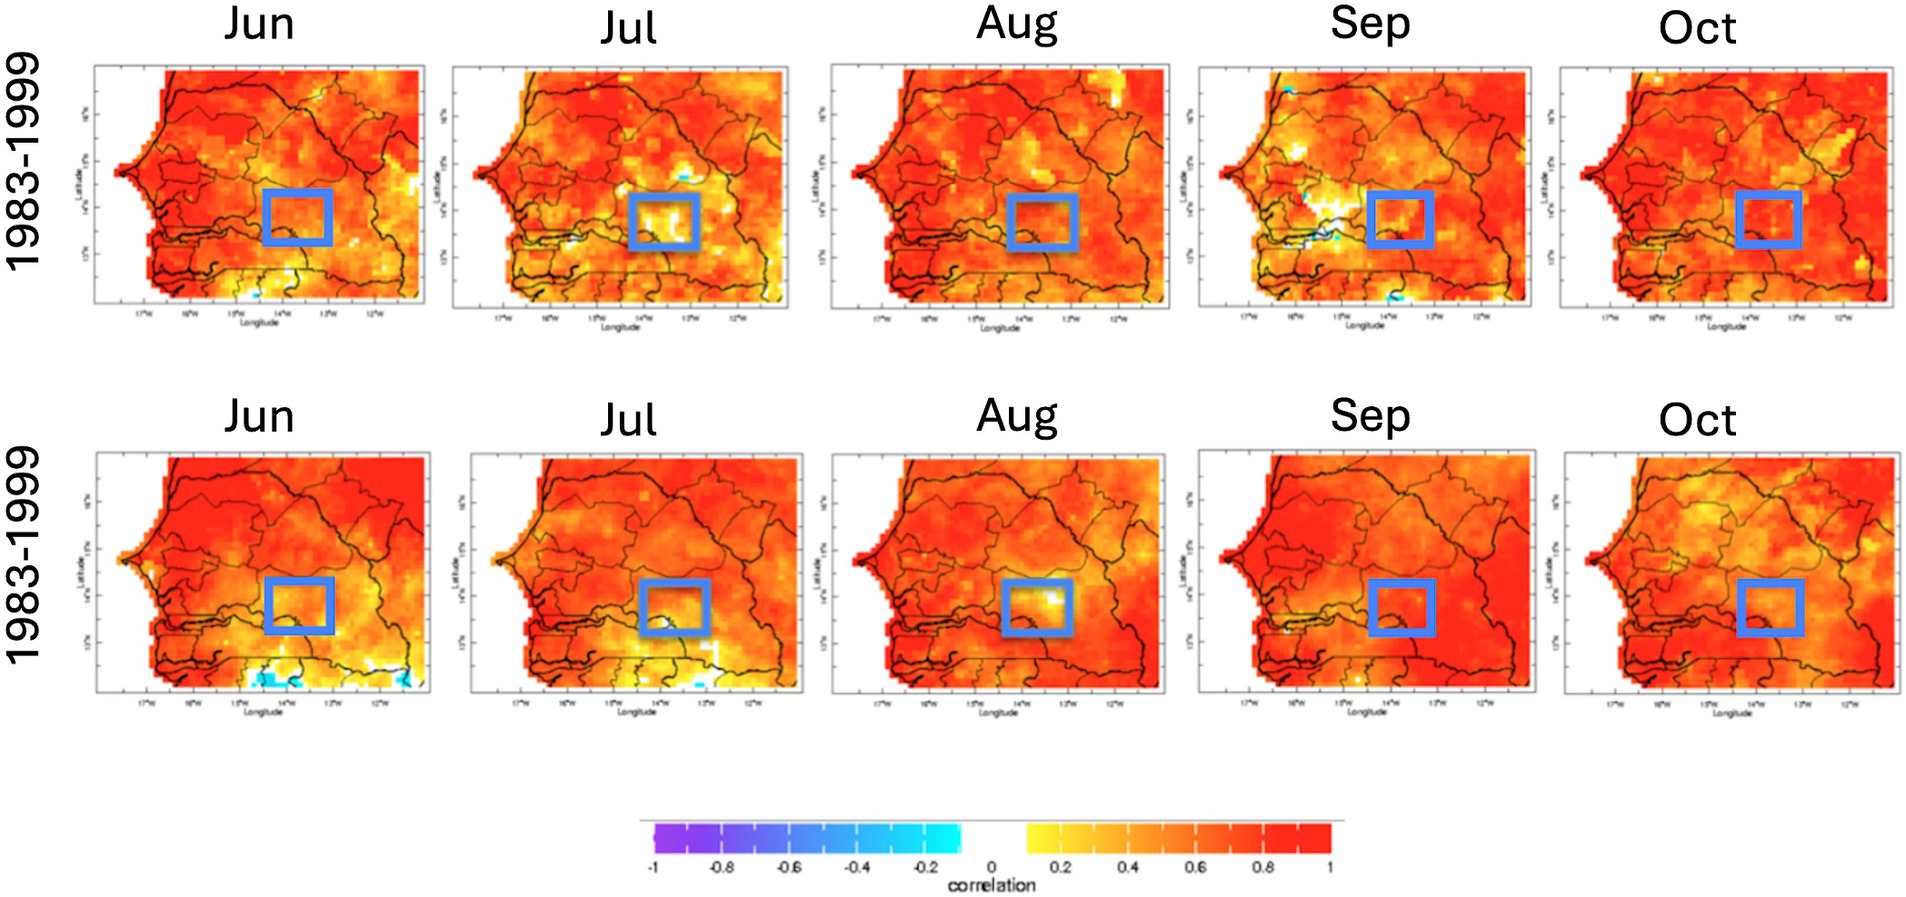
Figure 7. Correlation of standardized CHIRPS and ARC2 anomalies from 1983 to 1999 (top row) and 2000–2016 (bottom row) by months June, July, August, September, and October. The blue rectangle shows the Tambacounda, or R4, region.
Despite a low (near zero) correlation coefficient for the 1983–1999 period in July, we observe the largest differences for the Tambacounda region during the middle and the end of the season.
As shown in Table 10, the correlation coefficient is higher in August (R = 0.74) and October (R = 0.85) for the 1983–1999 period than for the 2000–2016 period (R = 0.56 and R = 0.64), but lower in September (R = 0.59 vs. R = 0.73).
Clearly, it is important to address issues in remote sensing calibration related to anomalies, seasonality, variability, and long-term stability, not only to understand long term climate processes, but also to provide more relevant and robust insurance payouts. Calibrations focused simply on averages are unlikely to be adequate. Although averages could be useful for better understanding crop yield outcomes, index insurance is focused on when crops fail due to weather or climate shocks. As a result, measures and calibrations based on the lowest quartile of rainfall are more appropriate for improving index insurance tools as opposed to averages, medians, or other measures.
5 Conclusion
We have found that when analyzing the rainfall data (regardless of source), there has not been a decrease in payouts corresponding with an increase in seasonal rainfall totals over the study period, as would be expected. When we include the full time series of rainfall for both rain gauges and satellite data, the payout rate is not radically greater than using only the second half of the time series. As such, including the 1980s in an index insurance product in Senegal does not arbitrarily increase the final price. Rather, in this specific case, the interannual variance of rainfall is more important for determining payouts. Although there have been many studies focusing solely on the rainfall variability across the Decades in West Africa, the implications for how this may affect applications had been relatively scarce. This study contributes to better understanding what the decadal variability means for index insurance projects in the region.
We use the formula for a commercially available index insurance product to compare average payouts over two time periods as an imperfect metric of the damage inflicted by rainfall to agriculture over that time period, with higher payouts being a signal that the rainfall patterns are more destructive to agriculture. Naïve assumptions can lead to overly conservative (expensive) insurance pricing when insurers do not have realistic, climate science driven information (Osgood et al., 2012).
Unambiguous improvements are not found when we analyze the specific parts of the season used for the index design. On average across the R4 project, using the official payout formula and data source, instead of having a lower average payout, the early window for the modern (2000–2016) period has a higher average payout than during the supposedly drier initial years. This suggests that for the initial sowing and establishment, the agricultural situation may have actually worsened, as opposed to improving, from the “perspective” of the insurance. Although we see mean rainfall has generally increased during the critical times of the agricultural season across datasets for both the R4 region and the larger Sahel, consistent with Nicholson (2013) and Lebel and Ali (2009), year to year variance appears to have increased as well, echoing Salack et al. (2013), and Sanogo et al. (2015). It appears that the changes in price, and associated risk as negotiated by farmers, is driven primarily by changes in year-to-year variance with some interactions with changes in daily variability.
Similarly, insurance payouts are not unambiguously lower in calculations based on rain gauges, also related to increases in variance, suggesting that it is likely actual climate phenomena that are driving the process and it is not completely the artifact of remote sensing estimation processes, which have in some cases been demonstrated to have biases that shift with decadal timescales (Diem et al., 2014). However, which specific prices increase or decrease varies with data source, and location, underscoring the importance of work to more effectively calibrate remote sensing estimation methodologies not only for average rainfall, but year-to-year variance, and sub-seasonal/daily variation for estimates that are stable across the Decades.
Using an index during the key moments of the season to capture poor cropping conditions shows that the recent increase in rainfall observed in the R4 region and the Sahel does not result in fewer payouts in the second half of the data relative to the first half of the data. The assumption that farming in the current rainfall regime is subject to less agricultural risk through drought does not hold. Farmers currently do demand a safety net for poor rainfall during the onset and cessation of the season, and using an index insurance product that targets these key moments is a possible tool to compliment farmers’ risk management portfolios. While the interannual variability does seem to have increased, interestingly the payouts are not clustered around the 1980s, so a simplistic decadal bias correction would not address the interannual variability in the insurance. The onset and cessation of the rainfall season exhibit similar ramp ups/downs as they have in the past, indicating that the Atlantic Multidecadal Variability may not need to be incorporated into the loading costs for this part of the season. Additionally, when considering the construction of an index, the different datasets available can impact the payout structure, meaning that different datasets may be better suited for capturing the drought risk. In order to best target farmer needs, farmers should be consulted and included in the creation and discussion of the index.
Data availability statement
Publicly available datasets were analyzed in this study. This data can be found at: https://iridl.ldeo.columbia.edu/SOURCES/.NOAA/.NCEP/.CPC/.FEWS/.Africa/.DAILY/.ARC2/.daily/.est_prcp/ https://iridl.ldeo.columbia.edu/SOURCES/.UCSB/.CHIRPS/.v2p0/.dekad/.prcp/.
Author contributions
DO: Conceptualization, Supervision, Writing – original draft. SB: Formal analysis, Methodology, Writing – review & editing. SO: Formal analysis, Investigation, Methodology, Writing – original draft. ME: Formal analysis, Writing – review & editing. MB: Investigation, Writing – original draft. TL: Methodology, Supervision, Writing – review & editing. AG: Methodology, Supervision, Writing – review & editing.
Funding
The author(s) declare that financial support was received for the research, authorship, and/or publication of this article. This work was funded by ACToday, the first of Columbia University’s World Projects.
Conflict of interest
OS was employed by the Willis Towers Watson.
The remaining authors declare that the research was conducted in the absence of any commercial or financial relationships that could be construed as a potential conflict of interest.
Publisher’s note
All claims expressed in this article are solely those of the authors and do not necessarily represent those of their affiliated organizations, or those of the publisher, the editors and the reviewers. Any product that may be evaluated in this article, or claim that may be made by its manufacturer, is not guaranteed or endorsed by the publisher.
Footnotes
1. ^When referring to the burn cost, we are focusing uniquely on the aspect of the mean of the payouts. Some also refer to this as expected losses. We are not focusing on the loading costs, which includes administrative costs and the costing of uncertainty that is baked into the premiums.
References
Ali, A., and Lebel, T. (2009). The Sahelian standardized rainfall index revisited. Int. J. Climatol. 29, 1705–1714. doi: 10.1002/joc.1832
Barnett, B. J., and Mahul, O. (2007). Weather index insurance for agriculture and rural areas in lower-income countries. Am. J. Agric. Econ. 89, 1241–1247. doi: 10.1111/j.1467-8276.2007.01091.x
Benami, E., Jin, Z., Carter, M. R., Ghosh, A., Hijmans, R. J., Hobbs, A., et al. (2021). Uniting remote sensing, crop modelling and economics for agricultural risk management. Nat. Rev. Earth Environ. 2, 140–159. doi: 10.1038/s43017-020-00122-y
Biasutti, M. (2013). Forced Sahel rainfall trends in the CMIP5 archive. J. Geophys. Res. Atmospheres 118, 1613–1623. doi: 10.1002/jgrd.50206
Biasutti, M., and Sobel, A. H. (2009). Delayed Sahel rainfall and global seasonal cycle in a warmer climate. Geophys. Res. Lett. 36:23. doi: 10.1029/2009GL041303
Blakeley, S. L., Sweeney, S., Husak, G., Harrison, L., Funk, C., Peterson, P., et al. (2020). Identifying precipitation and reference evapotranspiration trends in West Africa to support drought insurance. Remote Sens. 12:2432. doi: 10.3390/rs12152432
Booth, B. B., Dunstone, N. J., Halloran, P. R., Andrews, T., and Bellouin, N. (2012). Aerosols implicated as a prime driver of twentieth-century North Atlantic climate variability. Nature 484, 228–232. doi: 10.1038/nature10946
Carter, M. R., Barrett, C. B., Boucher, S., Chantarat, S., and Galarza, F. (2008). Insuring the never before insured: explaining index insurance through financial education games. BASIS Brief 7, 1–8. doi: 10.2139/ssrn.1845513
Chagnaud, G., Panthou, G., Vischel, T., and Lebel, T. (2022). A synthetic view of rainfall intensification in the west African Sahel. Environ. Res. Lett. 17:044005. doi: 10.1088/1748-9326/ac4a9c
Chantarat, S., Barrett, B. C., Mude, G. A., and Turvey, G. C. (2007). Using weather index insurance to improve drought response for famine prevention. Am. J. Agric. Econ. 89, 1262–1268. doi: 10.1111/j.1467-8276.2007.01094.x
Clarke, D., Das, N., de Nicola, F., Hill, R. V., Kumar, N., and Mehta, P., (2012). “The value of customized insurance for farmers in rural Bangladesh,” in IFPRI discussion papers 1202, International Food Policy Research Institute (IFPRI). Available at: https://citeseerx.ist.psu.edu/document?repid=rep1&type=pdf&doi=84a920cd06bac77b06853586d5d047c28b182b92
Diem, J. E., Hartter, J., Ryan, S. J., and Palace, M. W. (2014). Validation of satellite rainfall products for Western Uganda. J. Hydrometeorol. 15, 2030–2038. doi: 10.1175/JHM-D-13-0193.1
Enenkel, M., Osgood, D., Anderson, M., Powell, B., McCarty, J., Neigh, C., et al. (2019). Exploiting the convergence of evidence in satellite data for advanced weather index insurance design. Weather Clim. Soc. 11, 65–93. doi: 10.1175/WCAS-D-17-0111.1
Folland, C. K., Palmer, T. N., and Parker, D. E. (1986). Sahel rainfall and worldwide sea temperatures, 1901–85. Nature 320, 602–607. doi: 10.1038/320602a0
Funk, C., Peterson, P., Landsfeld, M., Pedreros, D., Verdin, J., Shukla, S., et al. (2015). The climate hazards infrared precipitation with stations—a new environmental record for monitoring extremes. Sci. Data 2:150066. doi: 10.1038/sdata.2015.66
García‐García, D., and Ummenhofer, C. C. (2015). Multidecadal variability of the continental precipitation annual amplitude driven by AMO and ENSO. Geophys. Res. Lett. 42, 526–535. doi: 10.1002/2014GL062451
Giannini, A. (2015). Hydrology: climate change comes to the Sahel. Nat. Clim. Chang. 5, 720–721. doi: 10.1038/nclimate2739
Giannini, A., and Kaplan, A. (2019). The role of aerosols and greenhouse gases in Sahel drought and recovery. Clim. Chang. 152, 449–466. doi: 10.1007/s10584-018-2341-9
Giannini, A., Salack, S., Lodoun, T., Ali, A., Gaye, A. T., and Ndiaye, O. (2013). A unifying view of climate change in the Sahel linking intra-seasonal, interannual and longer time scales. Environ. Res. Lett. 8:024010. doi: 10.1088/1748-9326/8/2/024010
Giannini, A., Saravanan, R., and Chang, P. (2003). Oceanic forcing of Sahel rainfall on interannual to interdecadal time scales. Science 302, 1027–1030. doi: 10.1126/science.1089357
Greatrex, H., Hansen, J., Garvin, S., Diro, R., Blakeley, S., Le Guen, M., et al. (2015). Scaling up index insurance for smallholder farmers: recent evidence and insights. CCAFS Rep. 14–16, 19–21, 22–27.
Grimes, D. I., and Pardo-Igúzquiza, E. (2010). Geostatistical analysis of rainfall. Geographical Anal. 42, 136–160. doi: 10.1111/j.1538-4632.2010.00787.x
Grimes, D. I. F., Pardo-Iguzquiza, E., and Bonifacio, R. (1999). Optimal areal rainfall estimation using raingauges and satellite data. J. Hydrol. 222, 93–108. doi: 10.1016/S0022-1694(99)00092-X
GTS. (2022). Africa weather and climate. Available at: https://www.cpc.ncep.noaa.gov/products/international/africa/africa.shtml (Accessed January 13, 2022).
Held, I. M., Delworth, T. L., Lu, J., Findell, K. U., and Knutson, T. R. (2005). Simulation of Sahel drought in the 20th and 21st centuries. Proc. Natl. Acad. Sci. 102, 17891–17896. doi: 10.1073/pnas.0509057102
Hellmuth, M. E., Osgood, D. E., Hess, U., Moorhead, A., and Bhojwani, H. (2009). Index insurance and climate risk: Prospects for development and disaster management (working paper). Palisades, NY: International Research Institute for Climate and Society.
Janicot, S., Moron, V., and Fontaine, B. (1996). Sahel droughts and ENSO dynamics. Geophys. Res. Lett. 23, 515–518. doi: 10.1029/96GL00246
Katsanos, D., Retalis, A., and Michaelides, S. (2016). Validation of a high-resolution precipitation database (CHIRPS) over Cyprus for a 30-year period. Atmospheric Res. 169, 459–464. doi: 10.1016/j.atmosres.2015.05.015
Le Barbé, L., and Lebel, T. (1997). Rainfall climatology of the HAPEX-Sahel region during the years 1950-1990. J. Hydrol. 189, 43–73. doi: 10.1016/S0022-1694(96)03154-X
Lebel, T., and Ali, A. (2009). Recent trends in the central and Western Sahel rainfall regime 1990–2007. J. Hydrol. 375, 52–64. doi: 10.1016/j.jhydrol.2008.11.030
Lobell, D. B., Burke, M. B., Tebaldi, C., Mastrandrea, M. D., Falcon, W. P., and Naylor, R. L. (2008). Prioritizing climate change adaptation needs for food security in 2030. Science 319, 607–610. doi: 10.1126/science.1152339
Lowder, S. K., Sánchez, M. V., and Bertini, R. (2021). Which farms feed the world and has farmland become more concentrated? World Dev. 142:105455. doi: 10.1016/j.worlddev.2021.105455
Lowder, S. K., Skoet, J., and Raney, T. (2016). The number, size, and distribution of farms, smallholder farms, and family farms worldwide. World Dev. 87, 16–29. doi: 10.1016/j.worlddev.2015.10.041
Marvel, K., Biasutti, M., and Bonfils, C. (2020). Fingerprints of external forcing agents on Sahel rainfall: aerosols, greenhouse gases, and model-observation discrepancies. Environ. Res. Lett. 15:084023. doi: 10.1088/1748-9326/ab858e
McPeak, J., Chantarat, S., and Mude, A. (2010). Explaining index-based livestock insurance to pastoralists. Agric. Finance 70, 333–352. doi: 10.1108/00021461011088477
Michler, J. D., Viens, F. G., and Shively, G. E. (2022). Risk, crop yields, and weather index insurance in village India. J. Agric. Appl. Econ. Assoc. 1, 61–81. doi: 10.1002/jaa2.9
Mills, E. (2005). Insurance in a climate of change. Science 309, 1040–1044. doi: 10.1126/science.1112121
NCEI. (2022). Global historical climatology network - daily. Available at: https://www.ncei.noaa.gov/access/metadata/landing-page/bin/iso?id=gov.noaa.ncdc:C00861 (Accessed January 13, 2022).
Nicholson, S. (2005). On the question of the “recovery” of the rains in the west African Sahel. J. Arid Environ. 63, 615–641. doi: 10.1016/j.jaridenv.2005.03.004
Nicholson, S. E. (2013). The west African Sahel: a review of recent studies on the rainfall regime and its interannual variability. ISRN Meteorol. 2013, 1–32. doi: 10.1155/2013/453521
Norton, M., Osgood, D., Madajewicz, M., Holthaus, E., Peterson, N., Diro, R., et al. (2014). Evidence of demand for index insurance: experimental games and commercial transactions in Ethiopia. J. Dev. Stud. 50, 630–648. doi: 10.1080/00220388.2014.887685
Novella, N. S., and Thiaw, W. M. (2013). African rainfall climatology version 2 for famine early warning systems. J. Appl. Meteorol. Climatol. 52, 588–606. doi: 10.1175/JAMC-D-11-0238.1
Osgood, D., Powell, B., Diro, R., Farah, C., Enenkel, M., Brown, M. E., et al. (2018). Farmer perception, recollection, and remote sensing in weather index insurance: an Ethiopia case study. Remote Sens. 10:1887. doi: 10.3390/rs10121887
Osgood, D., Shirley, K. E., and Toman, M. (2012). “The value of information in index insurance for farmers in Africa” in The value of information: Methodological frontiers and new applications in environment and health. eds. R. Laxminarayan and M. K. Macauley (Dordrecht: Springer Netherlands), 1–18.
Panthou, G., Lebel, T., Vischel, T., Quantin, G., Sane, Y., Ba, A., et al. (2018). Rainfall intensification in tropical semi-arid regions: the Sahelian case. Environ. Res. Lett. 13:064013. doi: 10.1088/1748-9326/aac334
Panthou, G., Vischel, T., and Lebel, T. (2014). Recent trends in the regime of extreme rainfall in the Central Sahel. Int. J. Climatol. 34, 3998–4006. doi: 10.1002/joc.3984
Salack, S., Giannini, A., Diakhaté, M., Gaye, A. T., and Muller, B. (2013). Oceanic influence on the sub-seasonal to interannual timing and frequency of extreme dry spells over the West African Sahel. Clim. Dyn. 42, 189–201. doi: 10.1007/s00382-013-1673-4
Sanogo, S., Fink, A. H., Omotosho, J. A., Ba, A., Redl, R., and Ermert, V. (2015). Spatio-temporal characteristics of the recent rainfall recovery in West Africa. Int. J. Climatol. 35, 4589–4605. doi: 10.1002/joc.4309
Schwarzwald, K., Poppick, A., Rugenstein, M., Bloch-Johnson, J., Wang, J., McInerney, D., et al. (2021). Changes in future precipitation mean and variability across scales. J. Clim. 34, 2741–2758. doi: 10.1175/JCLI-D-20-0001.1
Senay, G. B., and Verdin, J. (2001). “Evaluating the performance of a crop water balance model in estimating regional crop production,” in Proceedings of the Pecora. Vol 15.
Siebert, A. (2015). Assessing the viability of index insurance as an adaptation tool in a changing climate context: Case study in the west African Sahel. New Brunswick, NJ: Rutgers The State University of New Jersey-New Brunswick.
Vasilaky, K., Diro, R., Norton, M., McCarney, G., and Osgood, D. (2019). Can education unlock scale? The demand impact of educational games on a large-scale unsubsidised index insurance programme in Ethiopia. J. Dev. Stud. 56, 361–383. doi: 10.1080/00220388.2018.1554207
Vasilaky, K., Senz, S. M., Stanimirova, R., and Osgood, D. (2020). Perceptions of farm size heterogeneity and demand for group index insurance. Games 11, 15–20. doi: 10.3390/g11010015
Verdin, J., and Klaver, R. (2002). Grid cell-based crop water accounting for the famine early warning system. Hydrol. Process. 16, 1617–1630. doi: 10.1002/hyp.1025
Ward, M. N., and Ward, M. N. (1998). Diagnosis and short-Lead time prediction of summer rainfall in tropical North Africa at interannual and Multidecadal timescales. J. Clim. 11, 3167–3191. doi: 10.1175/1520-0442(1998)011<3167:DASLTP>2.0.CO;2
Keywords: climate variability, West Africa, drought, index insurance, smallholder farmers, remote sensing, disaster risk management
Citation: Osgood D, Blakeley SL, Ouni S, Enenkel M, Braun M, Lebel T and Giannini A (2024) Climate variability through the lens of applied weather index insurance in Senegal-a novel perspective on the implications of decadal variation. Front. Clim. 6:1281623. doi: 10.3389/fclim.2024.1281623
Edited by:
Ross Maidment, University of Reading, United KingdomReviewed by:
Daniel Andres Rodriguez, Federal University of Rio de Janeiro, BrazilSajanika Sivanu, Independent Researcher, Bonn, Germany
Copyright © 2024 Osgood, Blakeley, Ouni, Enenkel, Braun, Lebel and Giannini. This is an open-access article distributed under the terms of the Creative Commons Attribution License (CC BY). The use, distribution or reproduction in other forums is permitted, provided the original author(s) and the copyright owner(s) are credited and that the original publication in this journal is cited, in accordance with accepted academic practice. No use, distribution or reproduction is permitted which does not comply with these terms.
*Correspondence: Daniel Osgood, ZG8yMTI2QGNvbHVtYmlhLmVkdQ==; S. Lucille Blakeley, cy5sdWNpbGxlLmJsYWtlbGV5QGNvbHVtYmlhLmVkdQ==