
94% of researchers rate our articles as excellent or good
Learn more about the work of our research integrity team to safeguard the quality of each article we publish.
Find out more
ORIGINAL RESEARCH article
Front. Clim., 18 December 2023
Sec. Climate, Ecology and People
Volume 5 - 2023 | https://doi.org/10.3389/fclim.2023.1303337
This article is part of the Research TopicSeagrasses and Climate Change: Challenges and OpportunitiesView all 6 articles
 Stefanie R. Ries1
 Ellika Faust1†
 Kerstin Johannesson1
 Per R. Jonsson1
 Per-Olav Moksnes2
 Ricardo T. Pereyra1
 Marlene Jahnke1*
Zostera marina (eelgrass) is a foundation species in coastal zones in the northern hemisphere. Eelgrass is declining across its distribution, a trend likely to accelerate under climate change. In Sweden, eelgrass is a species of particular concern in management and conservation. Here, we provide information on genetic variation, an important component for the potential persistence and adaptation of any species in a changing environment. In particular, the steep salinity gradient over which eelgrass is distributed along the Swedish coast (26 psu on the west coast to 5 psu on the east coast) calls for a better understanding of genetic diversity, connectivity, and potential for local adaptation. To assess genetic variation and population genetic structure, we genotyped individuals with 2,138 single nucleotide polymorphisms (SNPs) from 15 eelgrass meadows spanning the whole Swedish distribution. We found a geographic population genetic structure from west to east parallel to the salinity gradient and with a clear genetic break at the entrance to the Baltic Sea. Meadows along the low salinity east coast consisted of a few or only one clone. Eelgrass on the west coast had higher genotypic richness, higher genetic variation, and showed population differentiation on smaller geographic scales. With their low genetic variation, the east coast meadows are especially threatened amidst global changes. Lack of sexual reproduction and the capacity to generate new genotypes is an issue that needs to be seriously considered in management and conservation. In addition, the lack of sexual reproduction renders clonal eelgrass less likely to recover and recolonize after disturbance, and more challenging to restore. The here provided information on genetic clusters, clonality, and genetic variation can be included for prioritizing meadows for conservation and for identifying meadows for restoration purposes. Most importantly, genetic monitoring is urgently needed to assess temporal genetic changes of eelgrass along the Swedish coast and elsewhere facing climate change.
The seagrass Zostera marina (eelgrass) is a foundation species in coastal areas in the northern hemisphere and provides several important ecosystem services (Moore and Short, 2006; Boström et al., 2014). For instance, eelgrass meadows serve as fish nurseries (Bertelli and Unsworth, 2014; Kennedy et al., 2018), provide essential habitats for various marine organisms (Orth et al., 1984; Lilley and Unsworth, 2014), play an essential role in maintaining water quality (Moksnes et al., 2018; Reusch et al., 2021), and provide long-term storage of nitrogen and carbon (Röhr et al., 2016; Moksnes et al., 2021). Eelgrass meadows are declining worldwide, driven by various threats, mainly anthropogenic activities and climate change (Waycott et al., 2009; Boström et al., 2014). Along the Swedish west coast and in the southern Baltic Sea up to the islands of Öland and Gotland eelgrass is commonly found on shallow (<6 m) soft sediment bottoms, forming large, often monospecific meadows. Further north - up to the archipelago of Stockholm - it is less common and found in mixed meadows with limnic flowering plants (Boström et al., 2003, 2014). Eutrophication in combination with overfishing has been identified as the main driver for the historic losses in Swedish waters (Moksnes et al., 2008; Baden et al., 2010; Eriksson et al., 2023) and remaining meadows are in addition threatened by increasing small-scale coastal exploitation (Eriander et al., 2017). Future predicted drivers for eelgrass loss along the Swedish coast are direct or indirect effects of decreasing salinity and increasing temperature caused by climate change (Torn et al., 2020; Jeffery et al., 2023).
Sweden is surrounded by two central water bodies, in the east the Baltic Sea, and the west the Skagerrak-Kattegat, which are connected by the Öresund (Snoeijs-Leijonmalm et al., 2017; Figure 1). A steep salinity gradient between the Baltic Sea (east coast) and the Skagerrak-Kattegat (west coast) ranges from 3 to 26 psu (Snoeijs-Leijonmalm et al., 2017; HELCOM, 2018; Figure 1B). Due to its low sea surface salinity, the east coast presents a particularly demanding habitat for marine species. As the critical salinity growth level for eelgrass is about 5 psu, eelgrass is already at the edge of the species range along the east coast (Boström et al., 2003). Predicted freshening is likely to push eelgrass over its tolerance limit, which has been modeled to result in its disappearance from large parts of the Baltic Sea (HELCOM, 2013; Törnqvist et al., 2019). Warming and increasing frequency and intensity of marine heatwaves may further affect Swedish eelgrass, given that high temperatures reduce shoot growth and may result in shoot loss after marine heatwaves (Bergmann et al., 2010; Sawall et al., 2021; Wernberg et al., 2023). Therefore, it is important to develop a foundational understanding of the contemporary status of eelgrass meadows, encompassing key aspects such as population differentiation and genetic variation. This knowledge is important for predicting resilience, prioritizing conservation strategies, and establishing a baseline for tracking temporal changes (Evans et al., 2017).
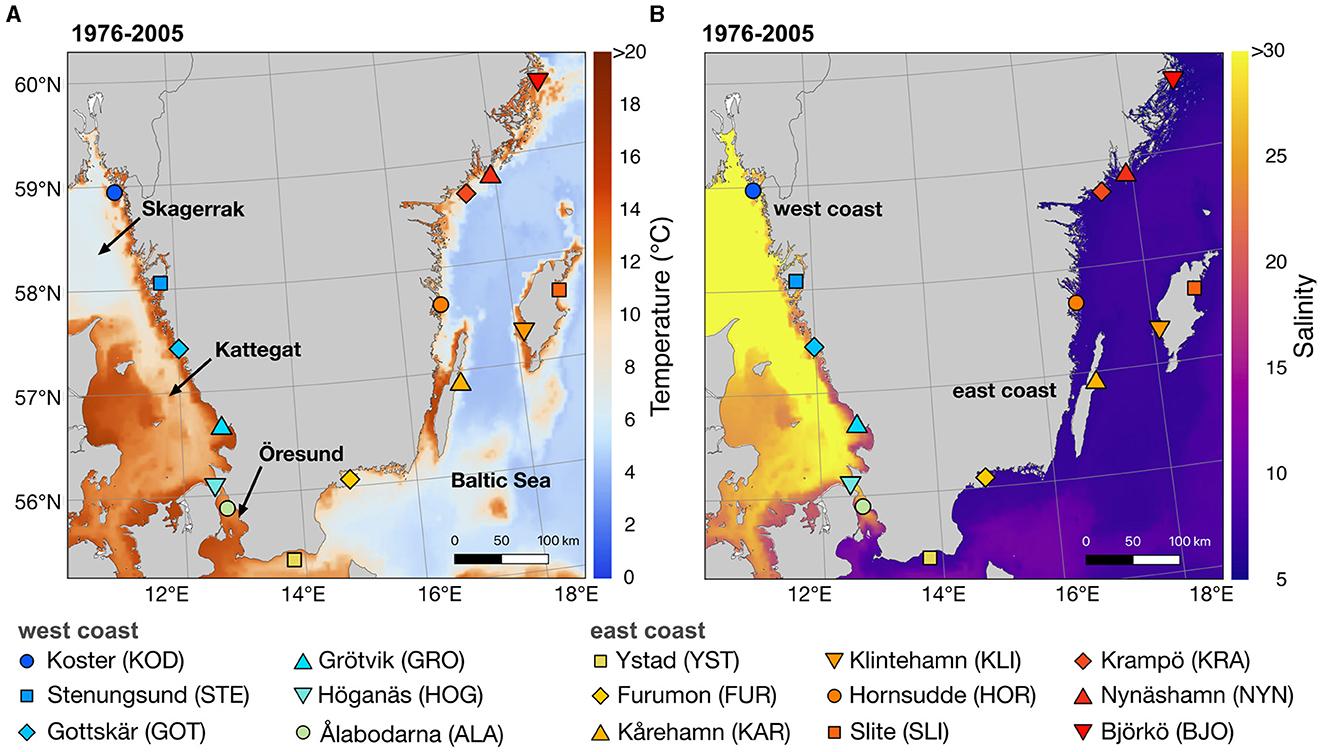
Figure 1. Map of the 15 sampling sites along the Swedish coast covering the Swedish eelgrass distribution, which is limited to ca. 60 N along the Swedish Baltic coast. (A) shows the modeled average sea surface temperature along the Swedish coast over the period May to September over three decades (1976–2005) and (B) shows the modeled average sea surface salinity over the period May to September (1976–2005) for the upper 3 m of the water column.
Like many flowering plants, eelgrass reproduces sexually through flowering and seed production, but also reproduces clonally through vegetative growth via horizontal rhizome extension (Ackerman, 2006). Many meadows exhibit high levels of sexual reproduction, but several others are composed of a single large clone (Reusch et al., 1999; Olsen et al., 2004; Becheler et al., 2010; Reusch and Boström, 2011; Jahnke et al., 2018, 2020). In the Baltic Sea, a high dominance of clonal reproduction has been reported, where large eelgrass clones were estimated to be more than 1,000 years old (Reusch et al., 1999; Yu et al., 2020). Moreover, flowering shoots are rarely seen in the northern part of the Baltic Sea (Boström, 1995; Möller and Martin, 2007). Clonality may be advantageous when colonizing a new area and during range expansions (Rafajlović et al., 2017; Pereyra et al., 2023) and might favor survival in extreme environments (Edgeloe et al., 2022), but in terms of conservation a high dominance of clonal reproduction is generally seen as a disadvantage, particularly under global change (Pipithkul et al., 2021). Nevertheless, some ancient clones have persisted for centuries to millennia, and due to their presumed high fitness in the local environment are referred to as all-purpose-genotypes. However, the extent of their adaptability and/or persistence under climate change remains uncertain. Impacts of clonality on genetic variation and species survival are currently mostly studied using conceptual approaches, but high rates of sexual reproduction are more efficient at purging deleterious mutations, and forming new genotypes by recombination, aspects which will likely aid in adaptation under a changing environment (Otto and Lenormand, 2002; Orive et al., 2017). Assessing the number of clones in a population (also referred to as genotypic richness) is therefore one important level of genetic variation that provides the building blocks for a species to persist and adapt in a changing environment (Ehlers et al., 2008; Reynolds et al., 2016). As loss of genetic variation represents a threat in itself, by making organisms more vulnerable to environmental changes (Exposito-Alonso et al., 2022), spatiotemporal genetic monitoring assessments are being initiated (Schwartz et al., 2007). The aim of such spatiotemporal monitoring programs is to detect changes in genetic variation in response to climate change, conservation actions, or anthropogenic activities (Schwartz et al., 2007; Gaitán-Espitia and Hobday, 2021). Establishing a baseline of current genetic variation in a given geographic region is a crucial part of detecting genetic changes and it serves as a reference point to evaluate conservation efforts (Sandström et al., 2019). Genetic diversity assessments not only assist in assessing changes, but also provide valuable information for prioritization in marine spatial planning for protection and restoration (Jahnke et al., 2020).
Eelgrass shoots were collected from 15 locations along the Swedish west (Skagerrak-Kattegat and Öresund) and east coasts (Baltic Sea) spanning the entire Swedish distribution of eelgrass (Figure 1; Supplementary Table 1). Salinity and temperature during sampling were measured at most sites (Supplementary Table 1) and surface (top 3m) temperature and salinity mean for the summer periods 1976–2005 for each sampling site were retrieved from the regional climate model RCA4-NEMO (Gröger et al., 2019) with a horizontal resolution of 3.7 km (2 NM). Sampling was conducted between June and September 2020–2022 in shallow-water meadows (1–4 meters deep). The 15 sampling sites were selected based on their geographic position along a salinity gradient from the west to the east coast of Sweden and at approximately similar geographic distances (mean distance along the coastline between sampling sites was ca. 100 km). At each location, 19–20 shoots were collected by snorkeling in a “roughly linear swim” sampling one shoot every 1.5 m to minimize the probability of sampling the same clone (Arnaud-Haond et al., 2007; Jahnke et al., 2017, 2019). On the shore, four to five pieces of 2 cm leaf fragments from the clean inner leaves near each leaf sheath were collected, and epiphytes were removed with a scalpel. Samples were placed in bags and directly stored at −20°C and freeze-dried before DNA extraction. Ca. 2 cm of leaf tissue was ground with a mixer-mill (Retsch MM 301) in 1.5 ml Eppendorf tubes with tungsten beads (4 min at 30 Hz). The NucleoSpin ® Plant II kit (Macherey-Nagel) was used to extract genomic DNA of 298 samples, followed by sodium-acetate precipitation.
The restriction-site-associated DNA (RAD) sequencing method 2b-RAD was used to generate SNPs (single nucleotide polymorphisms; Wang et al., 2012). 2b-RAD libraries were digested, ligated, and amplified following an adapted protocol (by Wang et al., 2012; https://github.com/z0on/2bRAD_denovo). In brief, for the digest, 50 ng of DNA was fragmented with the restriction endonuclease enzyme BcgI (New England BioLabs). Fragments were then ligated with adapters and barcoded, followed by amplification. The amplified fragments were extracted from a 2% agarose gel and cleaned with the NucleoSpin ® Gel and PCR Clean-up kit (Macherey-Nagel). Four different pools of a total of 283 samples (15 samples were discarded, because of insufficient DNA quality), including 23 technical replicates (i.e., some individuals from each meadow for which library preparations were replicated twice independently to asses sequencing errors), were sequenced on the Illumina Novaseq 6000 platform, generating 50-bp sequences at the Science for Life Laboratory (SciLifeLab) - SNP&SEQ Technology Platform at Uppsala University, Sweden.
Bioinformatic analysis followed a modified de novo pipeline from Mikhail Matz, available at https://github.com/z0on/2bRAD_denovo, and carried out on the Rackham cluster of the Swedish National Infrastructure for Computing (SNIC). The samples presented here were analyzed in conjunction with data from 34 more sampling sites in the region to extract a consistent set of SNPs across previous (Faust and Jahnke, 2023) and ongoing genomic studies and to avoid potential discrepancies in genetic diversity estimates derived from different SNPs sets. Due to the short read nature of 2b-RAD reads, only forward reads were used. PCR duplicates and restriction sites were removed with a custom Perl script, low-quality bases (Q15) were trimmed with cutadapt 4.0 (Martin, 2011), and reads shorter than 25bp were removed. Trimmed reads were mapped to the eelgrass genome assembly v.3.1. (Ma et al., 2021; https://bioinformatics.psb.ugent.be/gdb/zostera/) using local alignment in bowtie2 (Langmead and Salzberg, 2012). For SNP calling, the Genome Analysis Toolkit (GATK 3.8-0; McKenna et al., 2010) was used, implementing a minDP = 3 filter (minimum depth for a genotype call) before variant quality score recalibration (VQSR). Replicates with a missingness above 25 % and a heterozygosity discovery rate higher or equal 90 % were filtered out prior to this analysis. VQSR used SNPs identically genotyped among 72 technical replicates from the conjugated data set including the remaining 18 technical replicates presented here as well as 54 additional technical replicates from 34 additional sampling sites (2,668 SNPs; transition/transversion ratio: 2.479; truth sensitivity: 99 %) as “true” variants to generate a training model to allow estimation of the probability of a SNP to be “true” and recalibrate quality scores. Using vcftools 0.1.16 (Danecek et al., 2011), an initial filter to remove individuals with high missingness (>40%) was applied, followed by a filter selecting loci with maximum heterozygosity of 50% and at least genotyped in 90% of individuals (retaining 9,069 out of a possible 13,243 SNPs). A harsh genotyping cut-off was used to aim for the best quality and avoid null alleles that affected RAD loci (Ruocco et al., 2022). Additional filtering for individuals with a missingness of >25 % was performed. The final dataset used in most analyses below consisted of 241 successfully sequenced individuals (after removing the 18 technical replicates) genotyped with 2,138 polymorphic loci.
The first step in the genomic analysis of facultatively sexually reproducing species is the assessment of clonality. To distinguish clonemates from non-clonemates, we identified multilocus lineages (MLLs), i.e., clones with relatively small genetic distances which stem from somatic mutations and genotyping errors. As this is a crucial step in the analysis, we performed several complementary analyses to corroborate the results (see below). All analyses were carried out for 241 individuals and 18 technical replicates to establish error thresholds. To determine the cut-off threshold for identifying an MLL, we calculated pairwise genetic distances between samples using the function “bitwise.dist” (Hamming distance, or the number of differences between two alleles) and constructed dendrograms using the WPGMA (weighted pair group method with arithmetic mean) method with the R package “poppr 2.9.4” (Kamvar et al., 2014). To assign clones to MLLs, we calculated the maximum genetic distance cut-off using the maximum distance of the 18 technical replicates (7% of all samples) as a threshold (0.01543499; Supplementary Figure 1). Individuals with genetic distances below the set threshold were considered to belong to the same MLL and only one individual from each MLL was kept for further analyses filtering with the “poppr 2.9.4” package function “mlg.filter.”
To confirm the number of multilocus lineages established through the Hemming distance we also calculated the pairwise genetic similarity index (SH), following Yu et al. (2022). SH is calculated by dividing the number of genetic markers where two samples are identically heterozygous (Nsh) with the number of heterozygous loci (NHet) from two samples (X1 and X2; Yu et al., 2022; pipeline available at https://github.com/leiyu37/Detecting-clonemates).
We further corroborated the presence and level of clonality by testing the presence of linkage disequilibrium (LD) using the standardized index association rd (Agapow and Burt, 2001) for each sampling site by calculating the association with the expectation that linkage disequilibrium is lower when excluding clonemates from the analysis (81 MLLs - the slightly higher number identified based on genetic distances) compared to assessing all sampled shoots. The R package “poppr 2.9.4” was used to measure linkage disequilibrium (LD) using the average pairwise LD of 999 randomly chosen variant nucleotide sites with one hundred replicates. We also calculated the inbreeding coefficient (FIS) to measure the excess of heterozygotes indicated by negative values of FIS. Clonality is expected to deviate from HWE, and including clone mates is expected to result in strongly negative FIS values (Allendorf et al., 2022). We calculated FIS = {1 − [mean (Ho)/mean (uHe “unbiased expected heterozygosity”)]} per locality for the dataset only containing unique genotypes (n = 81) and the dataset including all samples (n = 241) using “gl.report.heterozygosity” embedded in the R package “dartR 2.9.7” (Gruber et al., 2018; Mijangos et al., 2022).
Once MLLs had been established, genotypic richness (R) - the inverse of clonality-was calculated according to Dorken and Eckert (2001): R = (number of MLLs-1) / (number of samples-1) for each meadow, each identified genetic cluster (see below) and each coast (Figure 1). Genotypic richness values were then plotted as a heatmap, using the R package “wingen 1.1.0” (Bishop et al., 2023). We excluded the site Gottskär (GOT) from the interpolated heatmap because of the low number of successfully sequenced samples at this site (Table 1).
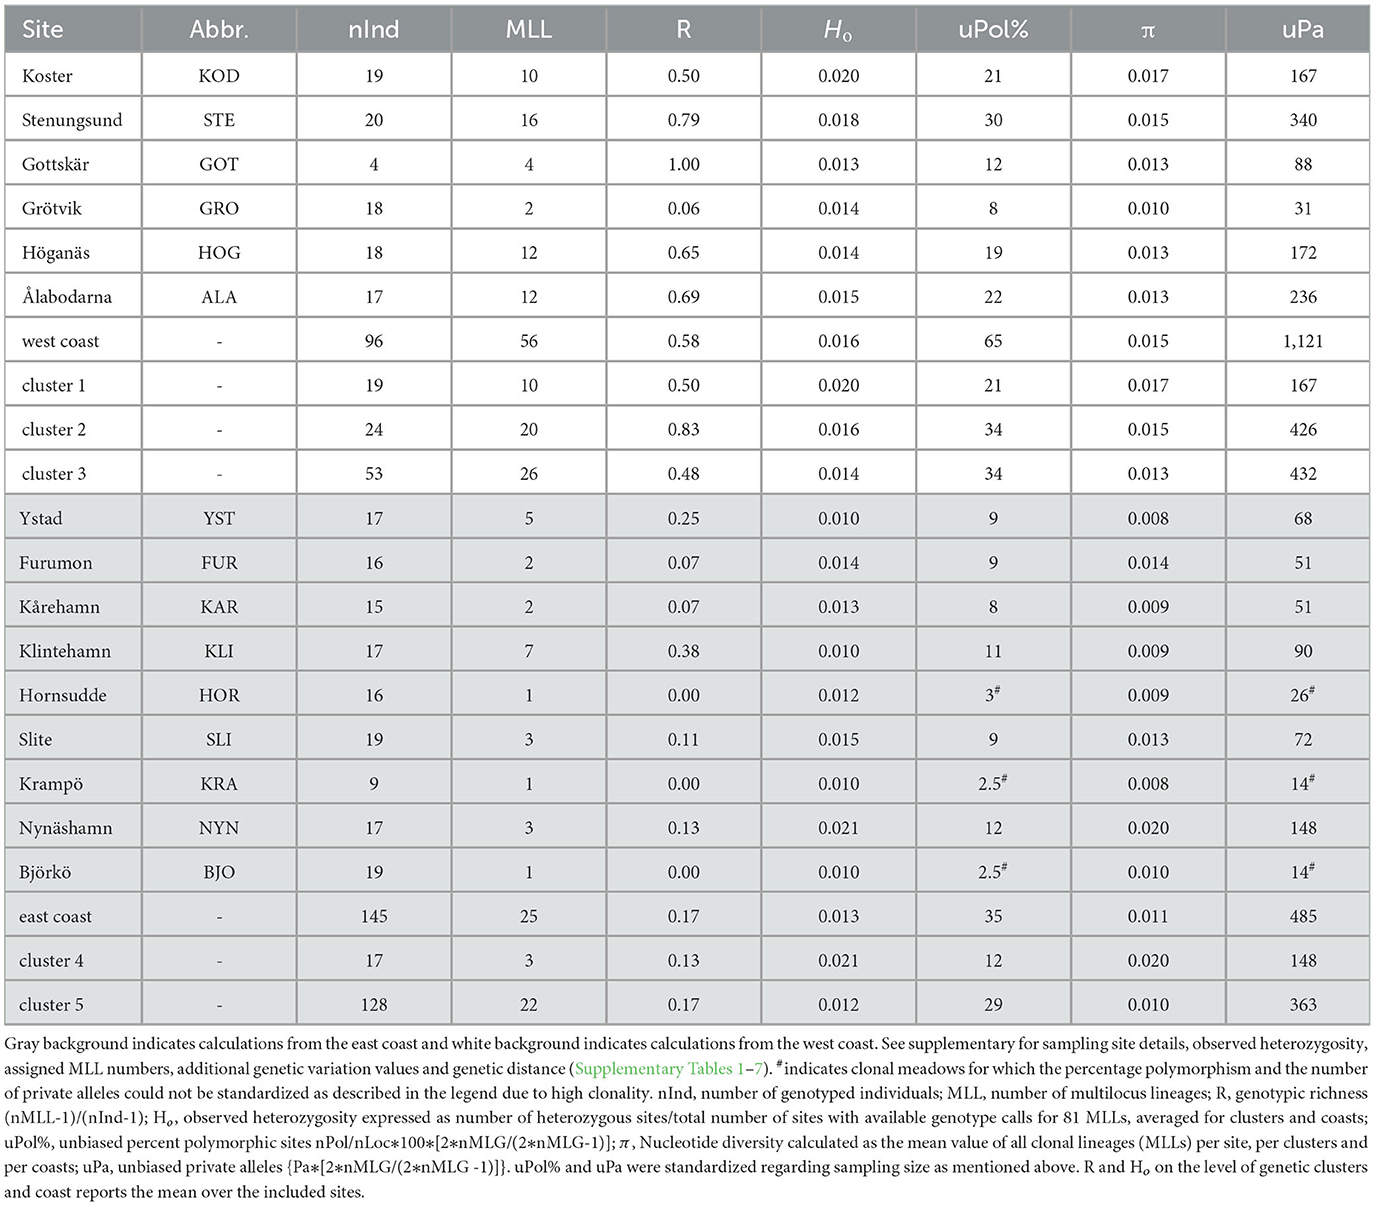
Table 1. Genetic variation of eelgrass for the 15 assessed sites, the east and west coast, and the five identified genetic clusters.
To detect population structure and to describe the genetic differentiation among MLLs and eelgrass meadows, we performed a principal component analysis (PCA) with the R package “ade4 1.7-22” (Chessel et al., 2004; Dray et al., 2007) and used the R package “LEA 3.8.0” (Frichot and François, 2015) using the “snmf” function. LEA analyses were run three times per K for 1-15 maximum number of ancestral populations (K). The most likely number of clusters was evaluated by plotting the cross-entropy for the different numbers of ancestral populations (Supplementary Figure 2) and visually inspecting admixture plots for several Ks. Additionally, we investigated the relationship between pairwise FST and sea distance, salinity distance and temperature distance between sampling sites separately using Mantel tests with the R package “ncf” (Bjornstad, 2009) with 100,000 replicates (Supplementary Tables 2, 3). Sea distances without crossing land were calculated in the R package “marmap” (Pante and Simon-Bouhet, 2013) using a minimum depth constraint of −0.5 m (Supplementary Table 2). At five sampling sites, coordinates had to be marginally adjusted as the map resolution wrongly assigned them to have a positive depth. Salinity and temperature values were retrieved for each sampling site from an ensemble of 3D ocean circulation models (Gröger et al., 2019), and distances between two sites were calculated by subtracting one salinity/temperature from the other (Supplementary Table 3). Pairwise Weir and Cockerham's FST was calculated among sites using the “dartR 2.9.7” package. For the FST analysis, we removed clones, to prevent a strong increase of FST with the proportion of clones (Balloux et al., 2003), but note that the low number of MLLs at some sites renders FST values unreliable for these sites as FST compares intra- with inter-site variation.
Genetic diversity is a broad term encompassing several measures that quantify genetic variability within and among populations, including nucleotide diversity, heterozygosity, and percentage of polymorphic loci (Hughes et al., 2008; Allendorf et al., 2022). To estimate genetic diversity, we calculated polymorphic sites (Pol) and private alleles (Pa) using the MLL data set (n = 81) based on all 2,138 SNPs, using the functions “isPoly,” embedded in “adegenet 2.1.10” (Jombart, 2008; Jombart and Ahmed, 2011) and “private_alleles()” in “poppr 2.9.4.” To obtain unbiased estimates, the percent of polymorphic (uPol%) and private alleles (uPa) were standardized relative to the number of MLLs (Table 1). To assess nucleotide diversity and heterozygosity, we used a dataset of 5,771 loci including the 2,138 loci as well as monomorphic sites. The rationale for including monomorphic sites was to avoid underestimating heterozygous sites and their derived estimates. Observed heterozygosity (Ho = number of heterozygous sites/total number of sites with available genotype calls, customized script “individualHET.py”) and nucleotide diversity (π) were calculated following Yu et al. (2022; https://github.com/leiyu37/populationGenomics_ZM). π was calculated after filtering for missingness (resulting in 1,513 SNPs for 241 individuals and 2,092 SNPs for the 81 MLLs; also see Supplementary Table 4 for Ho filtered for missingness). The “–max-missing” function was used where no missing data was allowed (defined by 1), embedded in “vcftools 0.1.16” (Danecek et al., 2011). To display different genetic variation parameters on maps, we used the R package “wingen 1.1.0.” Finally, the above-mentioned genetic variation parameters were also calculated for each coast and genetic cluster separately, as well as for the dataset including all 241 samples.
Out of 241 samples genotyped with 2,138 polymorphic loci, we detected 79–81 MLLs among the 15 sampling sites (Table 1; Figure 2; Supplementary Figure 3 for full names). The identity of the 79 MLLs calculated with the SH index were identical to the Hemming distance calculation. The package poppr additionally identified two samples (NYN-11 and SLI-05) as belonging to MLLs (Supplementary Table 5). Notably, no clones were shared between the sampling sites. Assessment of LD and FIS further confirmed that our chosen clonal threshold was meaningful: LD was consistently lower at each meadow for the datasets of MLLs compared to all samples, except for the meadow Slite (SLI; Figure 2C; Supplementary Table 6). FIS was consistently closer to zero for the data sets containing only MLLs at each meadow, except for Ålabodarna (ALA), where FIS did not change considerably (Figure 2D; Supplementary Table 6). After removing clones, the FIS values were close to zero, except for three sites, which still had considerably negative FIS values [Grötvik (GRO), Slite (SLI) and Nynäshamn (NYN)]. The meadows on the east coast showed a slightly higher excess of heterozygotes (FIS = −0.064) than the west coast (FIS = −0.054). Basing estimates of clonality on the higher established estimate of 81 MLLs, genotypic richness was generally higher on the west coast (R = 0.58) than on the east coast (R = 0.17; Table 1). Complete clonal dominance (R = 0) were found at Hornsudde (HOR), Krampö (KRA), and Björkö (BJO), all located in the northern part of the eelgrass distribution along Sweden's east coast (Table 1; Figure 1). Only one meadow on the west coast had low genotypic richness [Grötvik (GRO); R = 0.06]. The number of SNP differences within MLLs, which may be the result of somatic mutations or technical artifacts is generally low (Supplementary Table 7). On a meadow level, we observed the highest differences within an MLL at Ålabodarna (ALA; 1.08 %), Koster (KOD; 0.7 %), and Hornsudde (HOR; 0.78%). The lowest differences were found in the MLLs of Grötvik (GRO; 0.17 %) and Furumon (FUR; 0.07 %).
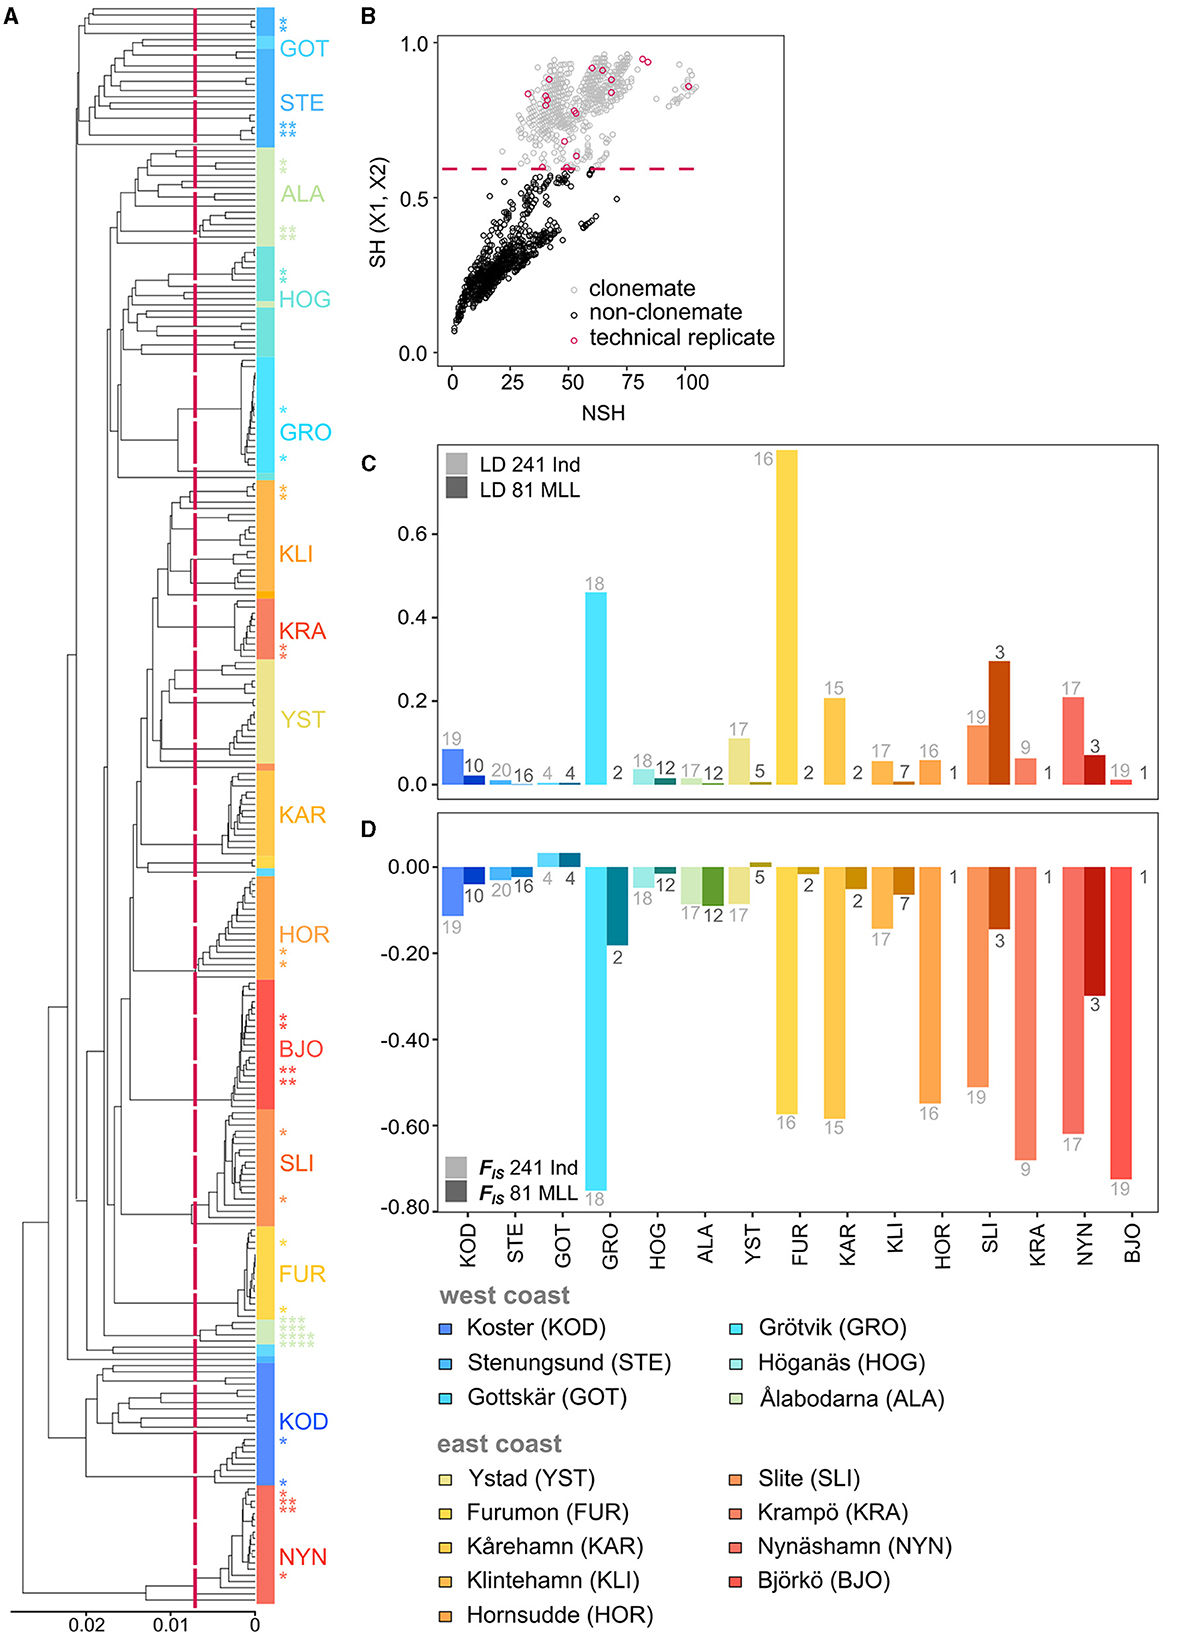
Figure 2. (A) WPGMA dendrogram based on bitwise distance between 259 genotyped eelgrass samples from 15 different sampling sites along the Swedish coasts. Shades of blue indicate samples from the west coast, and shades of red represent samples from the east coast. The dotted line shows the threshold (0.01543499) to distinguish MLLs from sequencing errors. Individuals with nodes to the right of the threshold belong to the same MLL. Stars show technical replicates of each sampling site and the number of stars indicates matching pairs. The colors represent the sampling sites. (B) Detected clonemates of the 259 samples with the SH index. (C) Linkage disequilibrium (LD) and (D) inbreeding coefficient (FIS) values for 241 samples and for 81 MLLs. Numbers above/below the bars indicate the number of samples (light gray) and the number of MLLs per site (dark gray). FIS could not be calculated for meadows consisting of less than two MLLs and LD could not be calculated for meadows consisting of less than three MLLs.
The PCA (Figure 3) of unique MLLs showed a gradient of genetic differentiation among meadows following the west-to-east coast (see Supplementary Figure 4 for PCA with 241 individuals). The horseshoe-shaped genetic differentiation was also along the environmental gradient of salinity. Within and among site differentiation was higher in the two Northern-most meadows - Koster and Stenungsund - than all remaining meadows combined (Figure 3). Genetic differentiation (FST; Supplementary Table 2) was significantly correlated with sea distance (p < 0.05) but with a low r2 of 0.18. There was no significant relationship between FST and salinity or temperature along the entire coastline, but there was a significant relationship along the steep salinity gradient for the six sites from the west coast (r2 = 0.52, p = 0.03). FST values on the east coast were less meaningful, due to a low number of MLLs within sampling sites, which can artificially inflate FST values. The cluster analysis confirmed these patterns with a gradient of differentiation between the east and west coasts (Figure 4). The most supported number of ancestral populations (K = 5; Figure 4; Supplementary Figure 2) showed stronger structuring along the west coast by separating the west coast into three clusters (dark blue, blue, light blue), but little genetic structure on the east coast (Figures 4B, D). All but one Baltic meadow belongs to one genetic cluster (yellow), except Nynäshamn, which forms its own cluster (red; Figures 4B, D). Investigating higher Ks did not lead to ecologically or evolutionary meaningful clusters (but see Supplementary Figure 5 for K = 2 to K = 10).
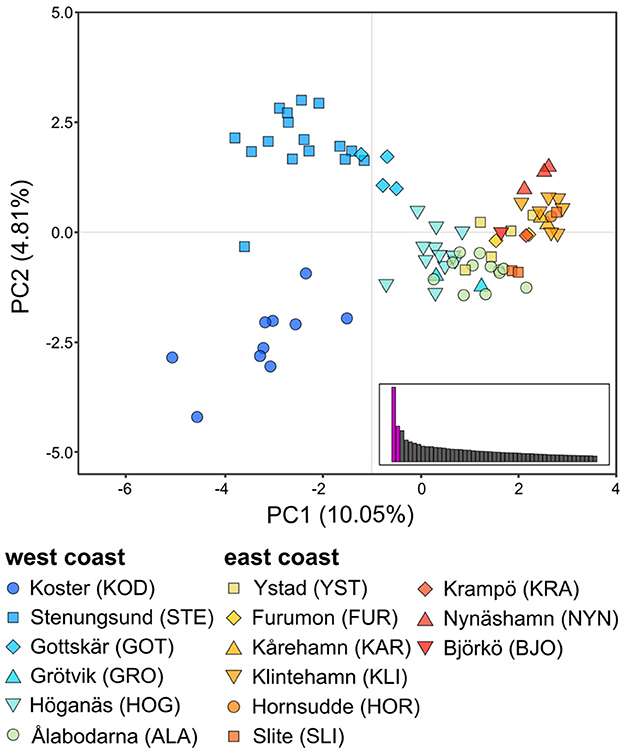
Figure 3. The first (PC1) and second (PC2) components of the principal component analysis (PCA) of 81 eelgrass multilocus lineages (MLLs, i.e., clonal lineages) from 15 sampling sites along the Swedish coast. Each dot represents one individual and the symbol and color indicate its sampling site. Individuals from the west coast are colored in shades of blue, and individuals from the east coast are colored in shades of red. Barplots for eigenvalues of the first 50 PCAs are displayed, with PC1 and PC2 in purple.
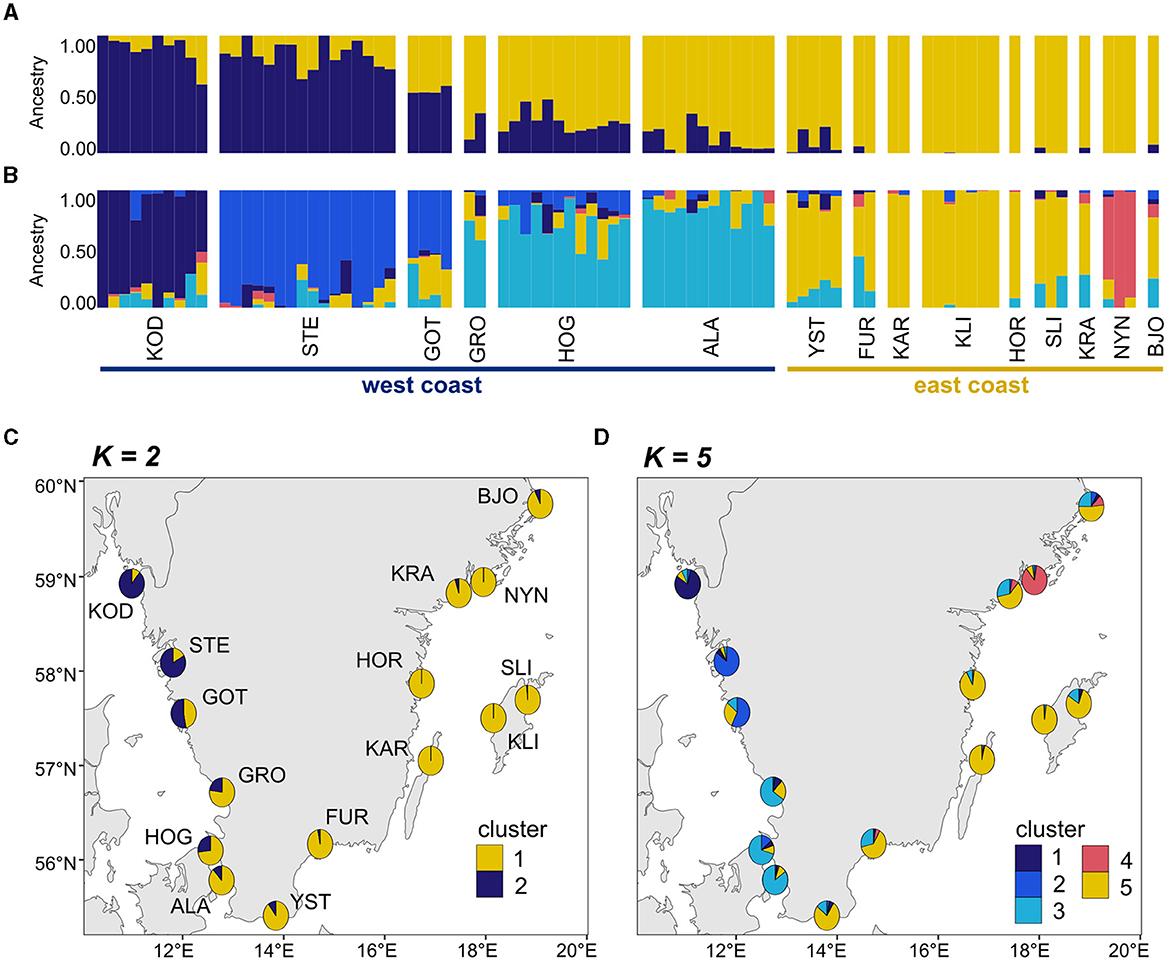
Figure 4. Genetic cluster analysis of the 81 MLLs collected at 15 eelgrass meadows. In the admixture plots, each individual is represented by a vertical line on the x-axis where the color segmentation shows the individual's estimated ancestry into one of the genetic clusters. The numbers of ancestral populations shown in (A) are K = 2 and in (B) K = 5. K = 5 represents the most likely number of ancestral populations according to the cross-entropy criterion (Supplementary Figure 2). Pie charts summarize the admixture coefficients for each sampling site and project them onto a map (C) showing K = 2 and (D) showing K = 5. Acronyms of sampling sites are described in Figure 1.
Like genotypic richness (Figure 5A) the genetic diversity patterns among the 81 MLLs differed between the two coasts, with generally higher genetic variation on the west coast. East coast meadows demonstrated lower percentage of polymorphic sites (percentage of uPol; 35 %) than the west coast with 65 % (Table 1; Figure 5B). The levels of private alleles (Pa), i.e., alleles that are exclusive to a meadow, were twice as high along the west coast (Table 1; Figure 5C). Observed heterozygosity (Ho) was very low throughout (ranging from 0.01 to 0.021; Table 1). Nucleotide diversity was generally higher along the west coast (Figure 5D), but the highest values were found in the east coast meadow Nynäshamn (NYN; 0.020; Table 1; Figure 5D), followed by the west coast meadow Koster (KOD; 0.017). The five lowest values were found along the east coast.
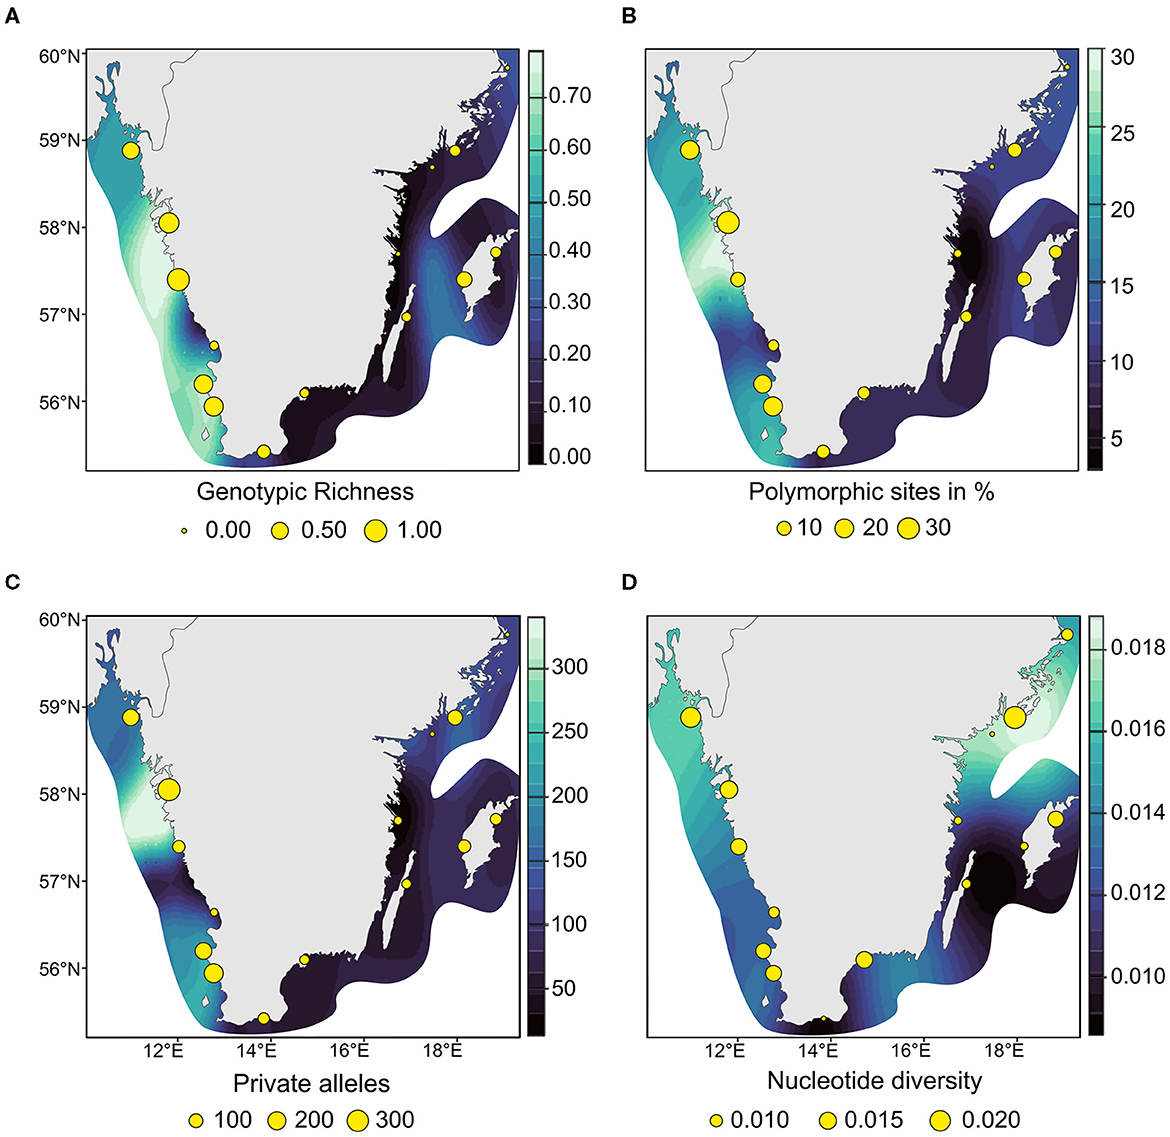
Figure 5. Interpolated heatmaps of clonality and genetic diversity of the 81 multilocus lineages of eelgrass along the Swedish coast. (A) genotypic richness calculated with R = {[number of multilocus lineages (nMLL)-1]/[number of individuals (nInd)-1]}. (B) The number of unbiased polymorphic sites in percent {nPol/nLoc*100*[2*nMLL/(2*nMLL-1)]}; (C) the number of unbiased private alleles per sampling site {nPa*[2*nMLL/(2*nMLL-1)]}; and (D) the values of nucleotide diversity. Bright blue indicates higher and darker blue indicates lower genetic variation.
Eelgrass provides many ecosystem services and represents a priority species in conservation in Sweden (Posledovich et al., 2021), yet there are large gaps in our knowledge of the species' clonality and genetic variation. Here we provide a first population genomic assessment of eelgrass along the entire Swedish distribution, focusing on genetic variation, genetic differentiation, and clonality. We show that there is gradually increasing population differentiation from west to east and along the steep salinity gradient along the Swedish west coast. We show that along the Swedish east coast, several of the sampling sites comprised only one clone, and others were dominated by a small number of clones. Surviving in a rapidly changing environment can be challenging for organisms (Harley et al., 2006; Cossellu and Nordberg, 2010; Phair et al., 2020), especially for sessile organisms like seagrass with a relatively long generation time and low effective population size due to clonality. The potential to adapt rapidly to environmental changes is usually strongly correlated to the amount of available genetic variation (Barrett and Schluter, 2008), making eelgrass meadows with lower genetic variation along the Swedish east coast particularly vulnerable to global change. When aiming to prevent further losses of eelgrass in the short and long term, it is important to carry out spatiotemporal assessments of genetic variation, as declining genetic variation likely reduces the potential to adapt to a changing environment. We here provide a baseline for future temporal monitoring of the genetic variation of Swedish populations of eelgrass and include a description of genetic clusters and clonal meadows. This information is also instrumental for immediate management actions, such as identifying meadows that need conservation measures, and meadows that are good candidates for targeting as donor material or recipient sites in restoration efforts.
Previous to our analysis, large and locally dominant clones of eelgrass have been found around Åland in the northern Baltic Proper and Greifswalder Bodden at the German coast in the Baltic Sea (Reusch et al., 1999; Gonciarz et al., 2014; Yu et al., 2020), and no or rare flowering had been reported from the Baltic Sea (Boström, 1995; Boström et al., 2014; Salo, 2014). Our assessment of clonality using genomic methods and investigating the species' whole distributional area along the Swedish coast largely corroborate and extend these findings to much of the species' Baltic Sea distribution. We show that along the Swedish coast of the Baltic Sea, several of the sampling sites comprised only one clone, and others were dominated by a small number of clones. However, no clones were shared among the sampled meadows. When looking at differences among multiple clonemates, we found they differed on average at nine sites out of the 2,138 SNPs (0.40%). If we interpret these differences as an indication of the age of each clone, this would for instance suggest that the oldest clones were found at the west coast meadow Ålabodarna, despite the higher clonal reproduction on the east coast.
Compared to previous studies, genotypic richness (the number of different clones) was generally low in all 15 Swedish meadows assessed. A recent genomic assessment over the entire distribution of eelgrass, in both the Pacific and Atlantic, only detected a small percentage of clonemates (9%; Yu et al., 2023), as well as previous genetic assessments, based on microsatellites, along the Kattegat, Skagerrak and Southern Baltic Sea (Jahnke et al., 2018, 2020; Martínez-García et al., 2021). A high incidence of clonality in the Baltic Sea has previously been shown in other species (e.g., macroalgae; Bergström et al., 2003; Johannesson and André, 2006; Pereyra et al., 2023). A potential explanation for the high incidence of clonality in multiple facultative sexual species in the Baltic Sea is that under extreme conditions, environmental factors may be unsuitable for one or several stages of sexual reproduction. Sexual reproduction may be lost, and simultaneously clonal growth is favored, as shown for instance in the land plant Iris hexagona (Eckert, 2000; Tobler et al., 2006). Indeed, although flowering eelgrass and seed germination have been observed at as low as 5 psu in the Baltic Sea (Boström, 1995; Salo, 2014; Salo et al., 2014), this salinity level might be too low for successful seed ripening or seedling establishment. In such a scenario, clonality might increase survival in these extreme environments (Edgeloe et al., 2022), and be especially competitive during colonization and range expansions into such environments (Rafajlović et al., 2017; Pereyra et al., 2023). Indeed, the Baltic Sea turned marine only recently (~8,000 years ago) and has been colonized since then by marine species such as eelgrass (Snoeijs-Leijonmalm et al., 2017). The observed patterns may therefore be explained by the recent colonization of the Baltic Sea and the fact that clonality increases the temporal persistence of founder events through strong dominance of the initial colonizers hindering subsequent colonization (De Meester et al., 2002; Waters et al., 2013). The west coast meadows in contrast showed in general higher levels of sexual reproduction. Nevertheless, the extant of clonality of some west coast meadows is comparably high to east coast meadows - despite the marine environment and likely more historic colonization history of the west coast. Clearly, local factors play a role in the incidence of clonality as well. For instance, the meadow Grötvik has a high incidence of clonality, which may similarly be explained by recent colonization, as this is a very small (<1 ha) and isolated meadow located within a recreational marina along an otherwise exposed stretch of coast with no recorded eelgrass presence. The meadow at Koster also has relatively low genotypic diversity - however without obvious links to a more recent colonization history, which highlights the complexity of identifying drivers of clonality on the local level. An important extra advantage of clonal reproduction in modular plants like eelgrass is that during clonal reproduction, new apical shoots, responsible for propagation, stay physically connected for some time to the “king” - the leading apical shoot of the clone (Ruocco et al., 2021) and allow resource/risk sharing under unfavorable conditions (Bricker et al., 2018; Ruocco et al., 2021; Arriesgado et al., 2023). Other widespread mechanisms for clonal dominance are hybridization and/or polyploidy (Bengtsson, 2009), which are the mechanisms for the switch to clonality in the seagrass Posidonia australis (Edgeloe et al., 2022). However, neither this study nor more detailed genomic assessments have detected signs of hybridization or polyploidy in eelgrass (Yu et al., 2020, 2023).
We observed significant genetic differentiation with increasing spatial distance and detected a clear genetic separation between the east and west coast, as well as additional structuring within each coast. The Öresund on the west coast marks a genetic barrier between west and east coast meadows, as seen for many species (Johannesson and André, 2006; Johannesson et al., 2020). The salinity gradient in the sound is very steep and has been suggested as a barrier to gene flow in many species through divergent selection and variation in salinity adaptation (Johannesson et al., 2020). Along the west coast, we identified three genetic clusters in a similar pattern of genetic differentiation as we reported previously using microsatellites (Jahnke et al., 2018). Along the Swedish east coast, all but one meadow - Nynäshamn - grouped as one genetic cluster. This very distinct meadow outside Nynäshamn was identified as genetically isolated and had high heterozygosity and nucleotide diversity. Interestingly, this location was previously identified to host genetically distinct populations of another marine species, the isopod Idothea balthica, a grazer that is commonly found on eelgrass and brown algae in the Baltic Sea (Pereyra et al., 2013; De Wit et al., 2020). A possible explanation may be high amounts of ship traffic in the area with frequent ferry and container ship connections to Estonia, Gotland, Latvia, Germany and Poland. As Nynäshamn is the most differentiated location of all meadows assessed here (Figure 2), Nynäshamn is alternatively a relic population of old founding individuals of the entire region or represents a more recent colonization.
Genetic diversity quantifies the variability within populations and is likely influenced by the prevalence of clonality in seagrass populations (Jueterbock et al., 2020; Procaccini et al., 2023). Field and mesocosm experiments designed to test for relationships between genetic diversity and ecosystem function in seagrasses have shown that not only clonality but also allelic richness and/or heterozygosity are important for positive population dynamics and ecosystem services (Reynolds et al., 2012). Here we found that heterozygosity, polymorphic sites, and nucleotide diversity were generally lower on the Swedish east coast compared to the west coast - in line with clonality patterns. Relatively high genetic diversity values were previously observed along the Swedish west coast (Jahnke et al., 2018, 2020; Martínez-García et al., 2021; Duffy et al., 2022) based on microsatellites. However, recent whole genome studies indicate a generally low genetic variation of eelgrass in the Atlantic compared to the Pacific (Yu et al., 2022) due to colonization bottleneck events (Jahnke et al., 2020; Duffy et al., 2022; Yu et al., 2023). Our values for π and Ho were in the same order of magnitude as reported in Yu et al. (2023) for Atlantic populations. Notably, one Swedish site (Torseröd) was included in Yu et al. (2023) and our closest site, Stenungsund is ca. 70 km sea distance away and has approximately twice as high Ho and π values (Supplementary Table 8). We believe that this discrepancy is mostly driven by the number of MLLs/individuals assessed overall and per site, the filtering settings and the different number of SNPs. Within our dataset, we observed generally lower genetic diversity of eelgrass along the Swedish east coast - in line with the lower genotypic richness reported for eelgrass here and lower genetic variation over a wide range of taxa in the Baltic Sea described previously (Johannesson and André, 2006).
One of our key findings is the high degree of clonality in the Baltic Sea. The resulting potential lack of successful sexual reproduction along the Swedish east coast likely has an impact on the ecology and management of eelgrass compared to populations with sexual reproduction. If there was an absolute lack of sexual reproduction it would imply: (1) No seed bank that can help the natural recovery of a meadow after damage or total loss resulting in a higher risk of long-term losses after disturbance; (2) The lack of dispersing reproductive shoots reduces the potential for recolonization after losses. (3) Lack of viable seeds also means that seedlings cannot help to speed up the growth of planted eelgrass during restoration resulting in slower recovery and a higher risk of failure during restoration. (4) The high clonality and low genetic diversity also implies that Baltic eelgrass might be less resilient and able to adapt to dominant local stressors (e.g., eutrophication affecting light and oxygen levels, etc.) in addition to those associated with climate change (see below). However, it is worth noting that certain clonal meadows in the Baltic Sea have endured for a long period. While we cannot predict the future persistence of clonal eelgrass meadows eelgrass is less exposed to Labyrinthula spp. in the low salinity of the Baltic Sea, which was linked to the eelgrass wasting disease, that decimated eelgrass in the Atlantic in the 1930s (Jakobsson-Thor et al., 2019). Plasticity has likely played an important role in how these clonal meadows have survived past and ongoing stressors. Preserving thriving eelgrass meadows, whether they exhibit high genetic diversity or are clonal must be a priority. When attempting restoration, donor material needs to be selected with care to achieve increase cover, density and persistence. In summary, since natural recolonization and restoration are inherently more challenging along the Swedish east coast, it is imperative that management focuses on protecting existing meadows.
Climate change adds another dimension to the vulnerable situation of Baltic eelgrass and the importance of mapping and monitoring the genetic and genotypic diversity. Climate change is a threat to eelgrass, particularly in the Baltic Sea where eelgrass is predicted to disappear from large areas (Törnqvist et al., 2019) as (1) temperature is increasing rapidly (Reusch et al., 2018); (2) salinity is predicted to decrease (Kniebusch et al., 2019); (3) eelgrass is at the edge of the species range (Boström et al., 2003); and (4) sexual reproduction rates are low (Möller and Martin, 2007) and clonality dominant (Reusch et al., 1999). In addition to a biodiversity loss over large spatial areas (Lambers, 2015), climate change will likely result in more common extreme environments and species range shifts (Germain and Lutz, 2020). Reproductive modes are rather dynamic systems responding to such changes, and a lack of sexual reproduction likely has deep demographic consequences, affecting population expansions, recolonization and adaptation (Eckert et al., 2016; Fouqueau and Roze, 2021). Eelgrass meadows in regions currently displaying substantial genetic variation such as the Öresund, could experience shifts toward dominance in clonal reproduction. Several field and mesocosm experiments have shown that a high incidence of clonality in eelgrass generally negatively influences resistance to disturbances (Hughes and Stachowicz, 2004; Evans et al., 2017), ecosystem recovery (Reusch et al., 2005) and productivity (Hughes et al., 2008). Moreover, sexual reproduction with drifting flowering shoots is essential for the availability of propagules (Jahnke et al., 2017) dispersed with ocean currents (Jahnke and Jonsson, 2022). Maintaining the resilience of coastal ecosystems and their ecosystem functions under climate change is among the aims of several international agreements including the Kunming-Montreal Global Biodiversity Framework (UN, 2022). Therefore, temporal genetic monitoring (Schwartz et al., 2007) of eelgrass is crucial for detecting such changes (Sandström et al., 2019). Our data provides a genetic baseline and transparent data for stakeholders (Pärli et al., 2021) that can be used for future spatiotemporal genetic monitoring (Phair et al., 2021).
The data provided here is also of relevance for eelgrass restoration actions currently steeply increasing during the UN decade of restoration (Ward and Beheshti, 2023) and supported by the Global Biodiversity Framework decided on in 2022 (UN, 2022). It is documented that genetic and in particular genotypic diversity correlate with successful seagrass restoration (Reynolds et al., 2012; Evans et al., 2017) and that genetic variability of donor sites is crucial for the success of seagrass transplantation projects (Reynolds et al., 2012). Here we provide information on meadows with high genotypic and genetic diversity and define different genetic clusters. We suggest choosing donor sites from the same genetic cluster with high genotypic and genetic diversity in the local context. Because it is challenging to foresee the exact effects of introduced genetic material on the local adaptation of the transplant sites and surrounding meadows, it is important to select sites for transplantation carefully. Due to recent progress in seascape genomics (Selkoe et al., 2016) and genomic offset (Rellstab et al., 2021), there is potential for improved identification of donor material with strong adaptation traits, which could enhance resistance to predicted environmental conditions under climate change.
The 2b-RAD raw sequences (fastq) are openly available on NCBI's sequence read archive (SAR) (BioProject PRJNA1043091, accession numbers: SAMN38331216 - SAMN38331474). The protocol for the 2b-RAD library preparations and the bioinformatic pipeline can be found at https://github.com/stefanieries/2bRAD_Swedish_eelgrass. R scripts for genetic diversity analysis, differentiation analysis, and IBD analysis, and vcf files (2,138 SNPs: 241 individuals and 81 MLLs; 5,771 SNPs: 241 individuals and 81 MLLs) can be found at 10.17044/scilifelab.24610356.
SR: Formal analysis, Investigation, Methodology, Validation, Visualization, Data curation, Writing – original draft. EF: Validation, Investigation, Data curation, Writing – review & editing. KJ: Conceptualization, Investigation, Funding acquisition, Writing – review & editing. PJ: Conceptualization, Investigation, Supervision, Funding acquisition, Visualization, Writing – review & editing. P-OM: Conceptualization, Investigation, Supervision, Funding acquisition, Writing – review & editing. RP: Conceptualization, Investigation, Methodology, Validation, Writing – review & editing. MJ: Conceptualization, Supervision, Formal analysis, Funding acquisition, Validation, Writing – original draft, Writing – review & editing.
The author(s) declare financial support was received for the research, authorship, and/or publication of this article. This study was funded by Swedish Research Council FORMAS (Grant No: 2020-008) and from funding for genetic monitoring from the Swedish Agency for Marine and Water Management (Grant No: 1717-22). The work was performed within the Linnaeus Centre for Marine Evolutionary Biology (https://www.gu.se/en/cemeb-marineevolutionary-biology) and the multidisciplinary research program Zorro (https://www.gu.se/en/research/zorro). MJ also wishes to acknowledge support through the Carl XVI Gustafs 50-årsfond för vetenskap, teknik och miljö, BalticWaters2030, The Royal Swedish Academy of Sciences and Stiftelsen Birgit och Birger Wåhlströms Minnesfond för den bohuslänska havs- och insjömiljön.
We want to thank the following people who contributed to sampling and laboratory work: Matilda Rasmussen, Henrik Möller, Swantje Enge, Bo Johannesson, Lydia Williams, and Maja Billman. Sequencing was performed by the SNP&SEQ Technology Platform in Uppsala. The facility was part of the National Genomics Infrastructure (NGI) Sweden and Science for Life Laboratory. The SNP&SEQ Platform was also supported by the Swedish Research Council and the Knut and Alice Wallenberg Foundation.
The authors declare that the research was conducted in the absence of any commercial or financial relationships that could be construed as a potential conflict of interest.
KJ declared that they were an editorial board member of Frontiers, at the time of submission. This had no impact on the peer review process and the final decision.
All claims expressed in this article are solely those of the authors and do not necessarily represent those of their affiliated organizations, or those of the publisher, the editors and the reviewers. Any product that may be evaluated in this article, or claim that may be made by its manufacturer, is not guaranteed or endorsed by the publisher.
The Supplementary Material for this article can be found online at: https://www.frontiersin.org/articles/10.3389/fclim.2023.1303337/full#supplementary-material
Ackerman, J. D. (2006). “Sexual reproduction of seagrasses: pollination in the marine context,” in Seagrasses: Biology, Ecology and Conservation, eds A. W. D. Larkum, R. J. Orth, and C. M. Duarte (Dordrecht: Springer Netherlands), 89–109. doi: 10.1007/1-4020-2983-7_4
Agapow, P.-M., and Burt, A. (2001). Indices of multilocus linkage disequilibrium. Mol. Ecol. Notes 1, 101–102. doi: 10.1046/j.1471-8278.2000.00014.x
Allendorf, F. W., Funk, W. C., Aitken, S. N., Byrne, M., Luikart, G., and Antunes, A. (2022). Conservation and the Genomics of Populations (3rd Edition). Oxford: Oxford University Press. doi: 10.1093/oso/9780198856566.003.0001
Arnaud-Haond, S., Duarte, C. M., Alberto, F., and Serrão, E. A. (2007). Standardizing methods to address clonality in population studies. Mol. Ecol. 16, 5115–5139. doi: 10.1111/j.1365-294X.2007.03535.x
Arriesgado, D. M., Kurokochi, H., Arriesgado, E. M., Roa, E. C., Gonzales, R. C., Bucay, D. M., et al. (2023). Clonal diversity and recruitment strategy of the two dominant seagrass species cymodocea rotundata and enhalus acoroides in the southern philippines. Aquat. Bot. 187:103646. doi: 10.1016/j.aquabot.2023.103646
Baden, S., Boström, C., Tobiasson, S., Arponen, H., and Moksnes, P. -O. (2010). Relative importance of trophic interactions and nutrient enrichment in seagrass ecosystems: a broad-scale field experiment in the Baltic–Skagerrak area. Limnol. Oceanogr. 55, 1435–1448. doi: 10.4319/lo.2010.55.3.1435
Balloux, F., Lehmann, L., and de Meeûs, T. (2003). The population genetics of clonal and partially clonal diploids. Genetics 164, 1635–1644. doi: 10.1093/genetics/164.4.1635
Barrett, R. D. H., and Schluter, D. (2008). Adaptation from standing genetic variation. Trends Ecol. Evol. 23, 38–44. doi: 10.1016/j.tree.2007.09.008
Becheler, R., Diekmann, O., Hily, C., Moalic, Y., and Arnaud-Haond, S. (2010). The concept of population in clonal organisms: mosaics of temporally colonized patches are forming highly diverse meadows of Zostera marina in Brittany. Mol. Ecol. 19, 2394–2407. doi: 10.1111/j.1365-294X.2010.04649.x
Bengtsson, B. O. (2009). “Asex and evolution: a very large-scale overview,” in Lost Sex: The Evolutionary Biology of Parthenogenesis, eds I. Schön, K. Martens, and P. Dijk (Dordrecht: Springer Netherlands), 1–19. doi: 10.1007/978-90-481-2770-2_1
Bergmann, N., Winters, G., Rauch, G., Eizaguirre, C., Gu, J., Nelle, P., et al. (2010). Population-specificity of heat stress gene induction in northern and southern eelgrass Zostera marina populations under simulated global warming. Mol. Ecol. 19, 2870–2883. doi: 10.1111/j.1365-294X.2010.04731.x
Bergström, L., Bruno, E., Eklund, B., and Kautsky, L. (2003). Reproductive strategies of Ceramium tenuicorne near its inner limit in the brackish Baltic Sea. Bot. Mar. 46, 125–131. doi: 10.1515/BOT.2003.013
Bertelli, C. M., and Unsworth, R. K. F. (2014). Protecting the hand that feeds us: seagrass (Zostera marina) serves as commercial juvenile fish habitat. Mar. Pollut. Bull. 83, 425–429. doi: 10.1016/j.marpolbul.2013.08.011
Bishop, A. P., Chambers, E. A., and Wang, I. J. (2023). Generating continuous maps of genetic diversity using moving windows. Methods Ecol. Evol. 14, 1175–1181. doi: 10.1111/2041-210X.14090
Bjornstad, O. N. (2009). Ncf: Spatial Nonparametric Covariance Functions. R package version 1.1-3. http://www.r-project.org/ Available online at: https://cir.nii.ac.jp/crid/1574231874752919040 (accessed July 31, 2023).
Boström, C. (1995). Flowering and fruit-bearing Zostera marina. Åland, northern Baltic Sea. Mem. Soc. Fauna Flora Fenn. 71, 7–9.
Boström, C., Baden, S., Bockelmann, A. -C., Dromph, K., Fredriksen, S., Gustafsson, C., et al. (2014). Distribution, structure and function of Nordic eelgrass (Zostera marina) ecosystems: implications for coastal management and conservation. Aquat. Conserv. 24, 410–434. doi: 10.1002/aqc.2424
Boström, C., Baden, S. P., and Krause-Jensen, D. (2003). “The seagrasses of Scandinavia and the Baltic Sea,” in World Atlas of Seagrasses: Present Status and Future Conservation, eds E. P. Green and F. T. Short (Berkeley, CA: University of California Press).
Bricker, E., Calladine, A., Virnstein, R., and Waycott, M. (2018). Mega clonality in an aquatic plant—a potential survival strategy in a changing environment. Front. Plant Sci. 9:435. doi: 10.3389/fpls.2018.00435
Chessel, D., Dufour, A. B., and Thioulouse, J. (2004). The ade4 Package - I: One-Table Methods. Available online at: http://thioulouse.fr/ref/ade4-Rnews.pdf (accessed March 16, 2023).
Cossellu, M., and Nordberg, K. (2010). Recent environmental changes and filamentous algal mats in shallow bays on the Swedish west coast — a result of climate change? J. Sea Res. 63, 202–212. doi: 10.1016/j.seares.2010.01.004
Danecek, P., Auton, A., Abecasis, G., Albers, C. A., Banks, E., DePristo, M. A., et al. (2011). The variant call format and VCFtools. Bioinformatics 27, 2156–2158. doi: 10.1093/bioinformatics/btr330
De Meester, L., Gómez, A., Okamura, B., and Schwenk, K. (2002). The monopolization hypothesis and the dispersal–gene flow paradox in aquatic organisms. Acta. Oecol. 23, 121–135. doi: 10.1016/S1146-609X(02)01145-1
De Wit, P., Jonsson, P. R., Pereyra, R. T., Panova, M., André, C., and Johannesson, K. (2020). Spatial genetic structure in a crustacean herbivore highlights the need for local considerations in Baltic Sea biodiversity management. Evol. Appl. 13, 974–990. doi: 10.1111/eva.12914
Dorken, M. E., and Eckert, C. G. (2001). Severely reduced sexual reproduction in northern populations of a clonal plant, Decodon verticillatus (Lythraceae). J. Ecol. 89, 339–350. doi: 10.1046/j.1365-2745.2001.00558.x
Dray, S., Dufour, A. B., and Chessel, D. (2007). The ade4 package-II: two-table and K-table methods. R News 7, 47–52.
Duffy, J. E., Stachowicz, J. J., Reynolds, P. L., Hovel, K. A., Jahnke, M., Sotka, E. E., et al. (2022). A Pleistocene legacy structures variation in modern seagrass ecosystems. Proc. Natl. Acad. Sci. USA. 119:e2121425119. doi: 10.1073/pnas.2121425119
Eckert, C. G. (2000). Contributions of autogamy and geitonogamy to self-fertilization in a mass-flowering, clonal plant. Ecology 81, 532–542. doi: 10.1890/0012-9658(2000)0810532:COAAGT2.0.CO
Eckert, C. G., Dorken, M. E., and Barrett, S. C. H. (2016). Ecological and evolutionary consequences of sexual and clonal reproduction in aquatic plants. Aquat. Bot. 135, 46–61. doi: 10.1016/j.aquabot.2016.03.006
Edgeloe, J. M., Severn-Ellis, A. A., Bayer, P. E., Mehravi, S., Breed, M. F., Krauss, S. L., et al. (2022). Extensive polyploid clonality was a successful strategy for seagrass to expand into a newly submerged environment. Proc. R. Soc. B Biol. Sci. 289:20220538. doi: 10.1098/rspb.2022.0538
Ehlers, A., Worm, B., and Reusch, T. B. H. (2008). Importance of genetic diversity in eelgrass Zostera marina for its resilience to global warming. Mar. Ecol. Prog. Ser. 355, 1–7. doi: 10.3354/meps07369
Eriander, L., Laas, K., Bergström, P., Gipperth, L., and Moksnes, P.-O. (2017). The effects of small-scale coastal development on the eelgrass (Zostera marina L.) distribution along the Swedish west coast – ecological impact and legal challenges. Ocean Coast. Manag. 148, 182–194. doi: 10.1016/j.ocecoaman.2017.08.005
Eriksson, B. K., Bergström, U., Govers, L. L., and Eklöf, J. S. (2023). “Trophic cascades in coastal ecosystems,” in Reference Module in Earth Systems and Environmental Sciences (Elsevier). doi: 10.1016/B978-0-323-90798-9.00006-8
Evans, S. M., Vergés, A., and Poore, A. G. B. (2017). Genotypic diversity and short-term response to shading stress in a threatened seagrass: does low diversity mean low resilience? Front. Plant Sci. 8:1417. doi: 10.3389/fpls.2017.01417
Exposito-Alonso, M., Booker, T. R., Czech, L., Gillespie, L., Hateley, S., Kyriazis, C. C., et al. (2022). Genetic diversity loss in the anthropocene. Science 377, 1431–1435. doi: 10.1126/science.abn5642
Faust, E., and Jahnke, M. (2023). Genetic Baseline of Eelgrass Genetic Diversity and Connectivity in Västra Götaland. Länsstyrelsen Västra Götaland.
Fouqueau, L., and Roze, D. (2021). The evolution of sex along an environmental gradient. Evolution 75, 1334–1347. doi: 10.1111/evo.14237
Frichot, E., and François, O. (2015). LEA: an R package for landscape and ecological association studies. Methods Ecol. Evol. 6, 925–929. doi: 10.1111/2041-210X.12382
Gaitán-Espitia, J. D., and Hobday, A. J. (2021). Evolutionary principles and genetic considerations for guiding conservation interventions under climate change. Glob. Chang. Biol. 27, 475–488. doi: 10.1111/gcb.15359
Germain, S. J., and Lutz, J. A. (2020). Climate extremes may be more important than climate means when predicting species range shifts. Clim. Change 163, 579–598. doi: 10.1007/s10584-020-02868-2
Gonciarz, M., Wiktor, J., Tatarek, A., Wegleński, P., and Stanković, A. (2014). Genetic characteristics of three Baltic Zostera marina populations. Oceanologia 56, 549–564. doi: 10.5697/oc.56-3.549
Gröger, M., Arneborg, L., Dieterich, C., Höglund, A., and Meier, H. E. M. (2019). Summer hydrographic changes in the Baltic Sea, Kattegat and Skagerrak projected in an ensemble of climate scenarios downscaled with a coupled regional ocean–sea ice–atmosphere model. Clim. Dyn. 53, 5945–5966. doi: 10.1007/s00382-019-04908-9
Gruber, B., Unmack, P. J., Berry, O. F., and Georges, A. (2018). dartr: an R package to facilitate analysis of SNP data generated from reduced representation genome sequencing. Mol. Ecol. Resour. 18, 691–699. doi: 10.1111/1755-0998.12745
Harley, C. D. G., Randall Hughes, A., Hultgren, K. M., Miner, B. G., Sorte, C. J. B., Thornber, C. S., et al. (2006). The impacts of climate change in coastal marine systems. Ecol. Lett. 9, 228–241. doi: 10.1111/j.1461-0248.2005.00871.x
HELCOM (2013). “Climate change in the Baltic Sea Area: HELCOM thematic assessment in 2013,” in Baltic Sea Environment Proceedings. Available online at: https://www.helcom.fi/wp-content/uploads/2019/10/BSEP137.pdf
Hughes, A. R., Inouye, B. D., Johnson, M. T. J., Underwood, N., and Vellend, M. (2008). Ecological consequences of genetic diversity. Ecol. Lett. 11, 609–623. doi: 10.1111/j.1461-0248.2008.01179.x
Hughes, A. R., and Stachowicz, J. J. (2004). Genetic diversity enhances the resistance of a seagrass ecosystem to disturbance. Proc. Natl. Acad. Sci. USA. 101, 8998–9002. doi: 10.1073/pnas.0402642101
Jahnke, M., Casagrandi, R., Melià, P., Schiavina, M., Schultz, S. T., Zane, L., et al. (2017). Potential and realized connectivity of the seagrass Posidonia oceanica and their implication for conservation. Divers. Distrib. 23, 1423–1434. doi: 10.1111/ddi.12633
Jahnke, M., D'Esposito, D., Orrù, L., Lamontanara, A., Dattolo, E., Badalamenti, F., et al. (2019). Adaptive responses along a depth and a latitudinal gradient in the endemic seagrass Posidonia oceanica. Heredity 122, 233–243. doi: 10.1038/s41437-018-0103-0
Jahnke, M., and Jonsson, P. R. (2022). Biophysical models of dispersal contribute to seascape genetic analyses. Philos. Trans. R. Soc. Lond. B. Biol. Sci. 377:20210024. doi: 10.1098/rstb.2021.0024
Jahnke, M., Jonsson, P. R., Moksnes, P. -O., Loo, L. -O., Nilsson Jacobi, M., and Olsen, J. L. (2018). Seascape genetics and biophysical connectivity modelling support conservation of the seagrass Zostera marina in the Skagerrak-Kattegat region of the eastern North Sea. Evol. Appl. 11, 645–661. doi: 10.1111/eva.12589
Jahnke, M., Moksnes, P. -O., Olsen, J. L., Serra Serra, N., Nilsson Jacobi, M., Kuusemäe, K., et al. (2020). Integrating genetics, biophysical, and demographic insights identifies critical sites for seagrass conservation. Ecol. Appl. 30:e02121. doi: 10.1002/eap.2121
Jakobsson-Thor, S., Toth, G. B., and Pavia, H. (2019). Seagrass wasting disease along a naturally occurring salinity gradient. Mar. Ecol. Prog. Ser. 614, 67–77. doi: 10.3354/meps12911
Jeffery, N., Vercaemer, B., Stanley, R., Kess, T., Dufresne, F., and Wong, M. (2023). Variation in genomic vulnerability to climate change across temperate populations of eelgrass (Zostera marina). Authorea Preprints. doi: 10.22541/au.167291318.80887192/v2
Johannesson, K., and André, C. (2006). Life on the margin: genetic isolation and diversity loss in a peripheral marine ecosystem, the Baltic Sea. Mol. Ecol. 15, 2013–2029. doi: 10.1111/j.1365-294X.2006.02919.x
Johannesson, K., Le Moan, A., Perini, S., and André, C. (2020). A Darwinian laboratory of multiple contact zones. Trends Ecol. Evol. 35, 1021–1036. doi: 10.1016/j.tree.2020.07.015
Jombart, T. (2008). adegenet: a R package for the multivariate analysis of genetic markers. Bioinformatics 24, 1403–1405. doi: 10.1093/bioinformatics/btn129
Jombart, T., and Ahmed, I. (2011). Adegenet 1.3-1: new tools for the analysis of genome-wide SNP data. Bioinformatics 27, 3070–3071. doi: 10.1093/bioinformatics/btr521
Jueterbock, A., Bostrom, C., Coyer, J. A., Olsen, J. L., Kopp, M., Dhanasiri, A. K. S., et al. (2020). The seagrass methylome is associated with variation in photosynthetic performance among clonal shoots. Front. Plant Sci. 11:571646. doi: 10.3389/fpls.2020.571646
Kamvar, Z. N., Tabima, J. F., and Grünwald, N. J. (2014). Poppr: an R package for genetic analysis of populations with clonal, partially clonal, and/or sexual reproduction. PeerJ. 2:e281. doi: 10.7717/peerj.281
Kennedy, L. A., Juanes, F., and El-Sabaawi, R. (2018). Eelgrass as valuable nearshore foraging habitat for juvenile pacific salmon in the early marine period. Mar. Coast. Fish. 10, 190–203. doi: 10.1002/mcf2.10018
Kniebusch, M., Meier, H. E. M., and Radtke, H. (2019). Changing salinity gradients in the Baltic sea as a consequence of altered freshwater budgets. Geophys. Res. Lett. 46, 9739–9747. doi: 10.1029/2019GL083902
Lambers, J. H. R. (2015). Ecology. extinction risks from climate change. Science 348, 501–502. doi: 10.1126/science.aab2057
Langmead, B., and Salzberg, S. L. (2012). Fast gapped-read alignment with Bowtie 2. Nat. Methods 9, 357–359. doi: 10.1038/nmeth.1923
Lilley, R. J., and Unsworth, R. K. F. (2014). Atlantic Cod (Gadus morhua) benefits from the availability of seagrass (Zostera marina) nursery habitat. Glob. Ecol. Conserv. 2, 367–377. doi: 10.1016/j.gecco.2014.10.002
Ma, X., Olsen, J. L., Reusch, T. B. H., Procaccini, G., Kudrna, D., Williams, M., et al. (2021). Improved chromosome-level genome assembly and annotation of the seagrass, Zostera marina (eelgrass). F1000Res. 10, 289. doi: 10.12688/f1000research.38156.1
Martin, M. (2011). Cutadapt removes adapter sequences from high-throughput sequencing reads. EMBnet.J. 17, 10–12. doi: 10.14806/ej.17.1.200
Martínez-García, L., Hansson, B., and Hollander, J. (2021). Assessment of local genetic structure and connectivity of the common eelgrass Zostera marina for seagrass restoration in northern Europe. Mar. Ecol. Prog. Ser. 664, 103–116. doi: 10.3354/meps13658
McKenna, A., Hanna, M., Banks, E., Sivachenko, A., Cibulskis, K., Kernytsky, A., et al. (2010). The genome analysis toolkit: a mapreduce framework for analyzing next-generation DNA sequencing data. Genome Res. 20, 1297–1303. doi: 10.1101/gr.107524.110
Mijangos, J. L., Gruber, B., Berry, O., Pacioni, C., and Georges, A. (2022). dartR v2: An accessible genetic analysis platform for conservation, ecology and agriculture. Methods Ecol. Evol. 13, 2150–2158. doi: 10.1111/2041-210X.13918
Moksnes, P. -O., Eriander, L., Infantes, E., and Holmer, M. (2018). Local regime shifts prevent natural recovery and restoration of lost eelgrass beds along the Swedish west coast. Estuaries Coasts 41, 1712–1731. doi: 10.1007/s12237-018-0382-y
Moksnes, P. -O., Gullström, M., Tryman, K., and Baden, S. (2008). Trophic cascades in a temperate seagrass community. Oikos 117, 763–777. doi: 10.1111/j.0030-1299.2008.16521.x
Moksnes, P. -O., Röhr, M. E., Holmer, M., Eklöf, J. S., Eriander, L., Infantes, E., et al. (2021). Major impacts and societal costs of seagrass loss on sediment carbon and nitrogen stocks. Ecosphere 12:e03658. doi: 10.1002/ecs2.3658
Möller, T., and Martin, G. (2007). Distribution of the eelgrass Zostera marina L. in the coastal waters of Estonia, NE Baltic Sea. Est. J. Ecol. 56, 270–277. doi: 10.3176/eco.2007.4.04
Moore, K. A., and Short, F. T. (2006). “Zostera: biology, ecology, and management,” in Seagrasses: Biology, Ecology and Conservation, eds A. W. D. Larkum, R. J. Orth, and C. M. Duarte (Dordrecht: Springer Netherlands), 361–386. doi: 10.1007/1-4020-2983-7_16
Olsen, J. L., Stam, W. T., Coyer, J. A., Reusch, T. B. H., Billingham, M., Boström, C., et al. (2004). North Atlantic phylogeography and large-scale population differentiation of the seagrass Zostera marina L. Mol. Ecol. 13, 1923–1941. doi: 10.1111/j.1365-294X.2004.02205.x
Orive, M. E., Barfield, M., Fernandez, C., and Holt, R. D. (2017). Effects of clonal reproduction on evolutionary lag and evolutionary rescue. Am. Nat. 190, 469–490. doi: 10.1086/693006
Orth, R. J., Heck, K. L., and van Montfrans, J. (1984). Faunal communities in seagrass beds: a review of the influence of plant structure and prey characteristics on predator-prey relationships. Estuaries 7, 339–350. doi: 10.2307/1351618
Otto, S. P., and Lenormand, T. (2002). Resolving the paradox of sex and recombination. Nat. Rev. Genet. 3, 252–261. doi: 10.1038/nrg761
Pante, E., and Simon-Bouhet, B. (2013). marmap: a package for importing, plotting and analyzing bathymetric and topographic data in R. PLoS ONE 8:e73051. doi: 10.1371/journal.pone.0073051
Pärli, R., Lieberherr, E., Holderegger, R., Gugerli, F., Widmer, A., and Fischer, M. C. (2021). Developing a monitoring program of genetic diversity: what do stakeholders say? Conserv. Genet. 22, 673–684. doi: 10.1007/s10592-021-01379-6
Pereyra, R. T., Huenchuñir, C., Johansson, D., Forslund, H., Kautsky, L., Jonsson, P. R., et al. (2013). Parallel speciation or long-distance dispersal? lessons from seaweeds (fucus) in the baltic sea. J. Evol. Biol. 26, 1727–1737. doi: 10.1111/jeb.12170
Pereyra, R. T., Rafajlović, M., De Wit, P., Pinder, M., Kinnby, A., Töpel, M., et al. (2023). Clones on the run: the genomics of a recently expanded partially clonal species. Mol. Ecol. 32, 4209–4223. doi: 10.1111/mec.16996
Phair, N. L., Nielsen, E. S., and von der Heyden, S. (2021). Applying genomic data to seagrass conservation. Biodivers. Conserv. 30, 2079–2096. doi: 10.1007/s10531-021-02184-w
Phair, N. L., Toonen, R. J., Knapp, I. S. S., and von der Heyden, S. (2020). Anthropogenic pressures negatively impact genomic diversity of the vulnerable seagrass Zostera capensis. J. Environ. Manage. 255:109831. doi: 10.1016/j.jenvman.2019.109831
Pipithkul, S., Ishizu, S., Shimura, A., Yokochi, H., Nagai, S., Fukami, H., et al. (2021). High clonality and geographically separated cryptic lineages in the threatened temperate coral, Acropora pruinosa. Front. Mar. Sci. 8:668043. doi: 10.3389/fmars.2021.668043
Posledovich, D., Ekblom, R., and Laikre, L. (2021). Mapping and Monitoring Genetic Diversity in Sweden a Proposal for Species, Methods and Costs. Available online at: https://www.naturvardsverket.se/globalassets/media/publikationer-pdf/6900/978-91-620-6959-9.pdf
Procaccini, G., Dattolo, E., and Ruocco, M. (2023). Genetic diversity and connectivity in the Mediterranean seagrass Posidonia oceanica: state of art and future directions. Cah. Biol. Mar. 105–114. doi: 10.21411/CBM.A.18AC84C1
Rafajlović, M., Kleinhans, D., Gulliksson, C., Fries, J., Johansson, D., Ardehed, A., et al. (2017). Neutral processes forming large clones during colonization of new areas. J. Evol. Biol. 30, 1544–1560. doi: 10.1111/jeb.13124
Rellstab, C., Dauphin, B., and Exposito-Alonso, M. (2021). Prospects and limitations of genomic offset in conservation management. Evol. Appl. 14, 1202–1212. doi: 10.1111/eva.13205
Reusch, T. B. H., and Boström, C. (2011). Widespread genetic mosaicism in the marine angiosperm Zostera marina is correlated with clonal reproduction. Evol. Ecol. 25, 899–913. doi: 10.1007/s10682-010-9436-8
Reusch, T. B. H., Boström, C., Stam, W. T., and Olsen, J. L. (1999). An ancient eelgrass clone in the Baltic. Mar. Ecol. Prog. Ser. 183, 301–304. doi: 10.3354/meps183301
Reusch, T. B. H., Dierking, J., Andersson, H. C., Bonsdorff, E., Carstensen, J., Casini, M., et al. (2018). The Baltic Sea as a time machine for the future coastal ocean. Sci. Adv. 4:eaar8195. doi: 10.1126/sciadv.aar8195
Reusch, T. B. H., Ehlers, A., Hämmerli, A., and Worm, B. (2005). Ecosystem recovery after climatic extremes enhanced by genotypic diversity. Proc. Natl. Acad. Sci. USA. 102, 2826–2831. doi: 10.1073/pnas.0500008102
Reusch, T. B. H., Schubert, P. R., Marten, S.-M., Gill, D., Karez, R., Busch, K., et al. (2021). Lower Vibrio spp. abundances in Zostera marina leaf canopies suggest a novel ecosystem function for temperate seagrass beds. Mar. Biol. 168, 149. doi: 10.1007/s00227-021-03963-3
Reynolds, L. K., DuBois, K., Abbott, J. M., Williams, S. L., and Stachowicz, J. J. (2016). Response of a habitat-forming marine plant to a simulated warming event is delayed, genotype specific, and varies with phenology. PLoS ONE 11:e0154532. doi: 10.1371/journal.pone.0154532
Reynolds, L. K., Waycott, M., McGlathery, K. J., Orth, R. J., and Zieman, J. C. (2012). Eelgrass restoration by seed maintains genetic diversity: case study from a coastal bay system. Mar. Ecol. Prog. Ser. 448, 223–233. doi: 10.3354/meps09386
Röhr, M. E., Boström, C., Canal-Vergés, P., and Holmer, M. (2016). Blue carbon stocks in Baltic Sea eelgrass (Zostera marina) meadows. Biogeosciences 13, 6139–6153. doi: 10.5194/bg-13-6139-2016
Ruocco, M., Entrambasaguas, L., Dattolo, E., Milito, A., Marín-Guirao, L., and Procaccini, G. (2021). A king and vassals' tale: molecular signatures of clonal integration in Posidonia oceanica under chronic light shortage. J. Ecol. 109, 294–312. doi: 10.1111/1365-2745.13479
Ruocco, M., Jahnke, M., Silva, J., Procaccini, G., and Dattolo, E. (2022). 2b-RAD genotyping of the seagrass Cymodocea nodosa along a latitudinal cline identifies candidate genes for environmental adaptation. Front. Genet. 13:866758. doi: 10.3389/fgene.2022.866758
Salo, T. (2014). From Genes to Communities: Stress Tolerance in Eelgrass (Zostera marina). Available online at: https://www.doria.fi/handle/10024/99028 (accessed October 27, 2023).
Salo, T., Pedersen, M. F., and Boström, C. (2014). Population specific salinity tolerance in eelgrass (Zostera marina). J. Exp. Mar. Biol. Ecol. 461, 425–429. doi: 10.1016/j.jembe.2014.09.010
Sandström, A., Lundmark, C., Andersson, K., Johannesson, K., and Laikre, L. (2019). Understanding and bridging the conservation-genetics gap in marine conservation. Conserv. Biol. 33, 725–728. doi: 10.1111/cobi.13272
Sawall, Y., Ito, M., and Pansch, C. (2021). Chronically elevated sea surface temperatures revealed high susceptibility of the eelgrass Zostera marina to winter and spring warming. Limnol. Oceanogr. 66, 4112–4124. doi: 10.1002/lno.11947
Schwartz, M. K., Luikart, G., and Waples, R. S. (2007). Genetic monitoring as a promising tool for conservation and management. Trends Ecol. Evol. 22, 25–33. doi: 10.1016/j.tree.2006.08.009
Selkoe, K. A., D'Aloia, C. C., Crandall, E. D., Iacchei, M., Liggins, L., Puritz, J. B., et al. (2016). A decade of seascape genetics: contributions to basic and applied marine connectivity. Mar. Ecol. Prog. Ser. 554, 1–19. doi: 10.3354/meps11792
Snoeijs-Leijonmalm, P., Schubert, H., and Radziejewska, T. (2017). Biological Oceanography of the Baltic Sea. Dordrecht: Springer Dordrecht doi: 10.1007/978-94-007-0668-2
Tobler, M. A., Van Zandt, P. A., Hasenstein, K. H., and Mopper, S. (2006). Growth and reproduction of a clonal plant in response to salinity and florivory. Wetlands 26, 803–812. doi: 10.1672/0277-5212(2006)26803:GAROAC2.0.CO
Torn, K., Peterson, A., and Herkül, K. (2020). Predicting the impact of climate change on the distribution of the key habitat-forming species in the NE Baltic Sea. J. Coast. Res. 95, 177–181. doi: 10.2112/SI95-035.1
Törnqvist, O., Jonsson, P. R., and Hume, D. (2019). Climate refugia in the Baltic Sea: modelling future important habitats by using climate projections. Pan Baltic Scope Project. Available online at: http://www.panbalticscope.eu/wp-content/uploads/2020/02/PBS-Report-Climate-Refugia-in-the-Baltic-Sea_final.pdf
UN (2022). Kunming-Montreal Global Biodiversity Framework. Available online at: https://www.cbd.int/doc/c/e6d3/cd1d/daf663719a03902a9b116c34/cop-15-l-25-en.pdf
Wang, S., Meyer, E., McKay, J. K., and Matz, M. V. (2012). 2b-RAD: a simple and flexible method for genome-wide genotyping. Nat. Methods 9, 808–810. doi: 10.1038/nmeth.2023
Ward, M., and Beheshti, K. (2023). Lessons learned from over thirty years of eelgrass restoration on the US West Coast. Ecosphere 14:e4642. doi: 10.1002/ecs2.4642
Waters, J. M., Fraser, C. I., and Hewitt, G. M. (2013). Founder takes all: density-dependent processes structure biodiversity. Trends Ecol. Evol. 28, 78–85. doi: 10.1016/j.tree.2012.08.024
Waycott, M., Duarte, C. M., Carruthers, T. J. B., Orth, R. J., Dennison, W. C., Olyarnik, S., et al. (2009). Accelerating loss of seagrasses across the globe threatens coastal ecosystems. Proc. Natl. Acad. Sci. USA. 106, 12377–12381. doi: 10.1073/pnas.0905620106
Wernberg, T. S., Thomsen, M. K., Baum, J. J., Bishop, M. J., Bruno, J. F., Coleman, M. A., et al. (2023). Impacts of Climate Change on Marine Foundation Species. Ann. Rev. Mar. Sci. doi: 10.1146/annurev-marine-042023-093037. [Epub ahead of print].
Yu, L., Boström, C., Franzenburg, S., Bayer, T., Dagan, T., and Reusch, T. B. H. (2020). Somatic genetic drift and multilevel selection in a clonal seagrass. Nat. Ecol. Evol. 4, 952–962. doi: 10.1038/s41559-020-1196-4
Yu, L., Khachaturyan, M., Matschiner, M., Healey, A., Bauer, D., Cameron, B., et al. (2023). Ocean current patterns drive the worldwide colonization of eelgrass (Zostera marina). Nat. Plants 9, 1207–1220. doi: 10.1038/s41477-023-01464-3
Keywords: Baltic Sea, climate change, clonality, conservation genomics, eelgrass, genetic diversity, temporal genetic monitoring, 2b-RAD
Citation: Ries SR, Faust E, Johannesson K, Jonsson PR, Moksnes P-O, Pereyra RT and Jahnke M (2023) Genetic structure and diversity of the seagrass Zostera marina along a steep environmental gradient, with implications for genetic monitoring. Front. Clim. 5:1303337. doi: 10.3389/fclim.2023.1303337
Received: 27 September 2023; Accepted: 13 November 2023;
Published: 18 December 2023.
Edited by:
Hung Manh Nguyen, Ben-Gurion University of the Negev, IsraelReviewed by:
Jessica Pazzaglia, Anton Dohrn Zoological Station Naples, ItalyCopyright © 2023 Ries, Faust, Johannesson, Jonsson, Moksnes, Pereyra and Jahnke. This is an open-access article distributed under the terms of the Creative Commons Attribution License (CC BY). The use, distribution or reproduction in other forums is permitted, provided the original author(s) and the copyright owner(s) are credited and that the original publication in this journal is cited, in accordance with accepted academic practice. No use, distribution or reproduction is permitted which does not comply with these terms.
*Correspondence: Marlene Jahnke, bWFybGVuZS5qYWhua2VAZ3Uuc2U=
†Present address: Ellika Faust, Department of Fish Ecology and Evolution, Centre of Ecology, Evolution and Biogeochemistry, EAWAG Swiss Federal Institute of Aquatic Science and Technology, Kastanienbaum, Switzerland
Disclaimer: All claims expressed in this article are solely those of the authors and do not necessarily represent those of their affiliated organizations, or those of the publisher, the editors and the reviewers. Any product that may be evaluated in this article or claim that may be made by its manufacturer is not guaranteed or endorsed by the publisher.
Research integrity at Frontiers
Learn more about the work of our research integrity team to safeguard the quality of each article we publish.