 Reisch Vanel Attipo
 Innocent Joachim Emvoulou
95% of researchers rate our articles as excellent or good
Learn more about the work of our research integrity team to safeguard the quality of each article we publish.
Find out more
ORIGINAL RESEARCH article
Front. Clim. , 20 December 2023
Sec. Climate Risk Management
Volume 5 - 2023 | https://doi.org/10.3389/fclim.2023.1281433
This manuscript assesses the vulnerability to flooding between June and August 2010 in Lomé, Togo. To this end, we administered a survey to 312 inhabitants of different areas affected by flooding. The flood risk assessment methodology is based on the analysis of socio-economic indicators, risk exposure indicators, sensitivity indicators and indicators relating to the recovery capacity of flood victims. The analyses showed that 61.5% of respondents had no perception of the risk, compared with 38% who were aware of a very low level of risk compared with 2010. In addition, 84.2% of people living in areas vulnerable to flooding said they were not aware of the risk of flooding in their area. The government's assistance consisted of emergency supplies (food, medicines and temporary accommodation) for the most vulnerable sections of the population. The relevance of this research is not limited to understanding vulnerability to flooding, as it also brings new clarity to the relationship between urban management and socio-economic challenges. This research shows that vulnerability has been exacerbated by socio-economic insecurity and the inadequacy of sanitation facilities.
Cities are particularly vulnerable to natural hazards. These events generate costs and consequences for residents that are of growing concern to local and national authorities (Barroca et al., 2005). They expose the weaknesses of the prevention system and the vulnerability of local authorities to risks, and raise the question of the relevance and effectiveness of prevention measures. There is often a striking contrast between the resources deployed to understand the hazard and the paucity of work on vulnerability, defined as “the measure of the damaging consequences of flooding on the issues at stake” or “the fragility of a socio-economic system as a whole in the face of risk” (Hubert and Ledoux, 1999).
Globally, and particularly in Africa, floods are among the most frequent and damaging natural disasters, making flood risk a central issue in terms of knowledge development, assessment and management. Overall, the risks associated with flooding have increased over the last few decades, with the greatest increase before other natural disasters (CRED, 2005). The increase in extreme precipitation due to climate change is increasing the risk of flooding (Milly et al., 2002). Urban sprawl, the occupation of watercourse nests, the protection of plant cover, the upkeep of catchment areas and the maintenance of sewage works deserve very special attention. Indeed, once the runoff capacity of these surfaces is affected, this increases the flow of runoff and consequently leads to major flooding.
Flood risk is defined as the combination of the probability of flooding occurring and the potential negative consequences. By analogy, the hazard is therefore a random natural phenomenon, i.e. a physical event characterized by a probability, which may relate to occurrence or intensity, such as the height or speed of the flow (Gleyze, 2000). Vulnerability is then related to the potential negative consequences (Gleyze, 2001; Leneveu and Laville, 2012). Vulnerability is then generally characterized by the propensity for damage (D'Ercole, 1994; Ledoux, 1996; de Richemond and Reghezza, 2010). Unfortunately, many studies on the analysis of vulnerability to flooding focus on one aspect and this research will opt for a holistic approach in order to better explain the problem.
While the assessment of vulnerability was initially limited to an evaluation of the degree of damage for a given hazard (Reghezza, 2006), since 1980 it has been enriched by the three concepts of exposure, sensitivity of issues and adaptive capacity (Brooks and Adger, 2003; Turner et al., 2003; Reghezza et al., 2012). For Meesner and Meyne (2006), in the context of assessing vulnerability to flooding, the concept of exposure is made up of two indicators. The first concerns the exposure of an element to a risk in terms of proximity to a river, the elevation of the area and the frequency of flooding, and the second focuses on the general characteristics of flooding such as speed, flood height, duration and sedimentation.
The sensitivity indicator measures the impact of flood depth and duration on a specific location (e.g. a building). Also, the awareness and preparedness of people living in potentially vulnerable areas about the risk involved, the ability to protect themselves against flooding and the ability to cope with the consequences of flooding. The indicator on adaptive capacity looks at general information such as poverty level, level of education, gender and age. Thus, vulnerability in this research is considered to be the difference between a community's capacity to adapt and its sensitivity and exposure to a hazard.
In 2007 and 2010, devastating floods caused by torrential rains affected several areas of Togo. The damage to infrastructure was considerable, as was the loss of human life. The exceptional rainfall generated significant run-off, as well as overflowing retention basins and the major and minor beds of all the watercourses that irrigate the country.
The 2010 rainy seasons were very wet in Togo. The torrential rains caused significant material damage and loss of life. They were accompanied by violent winds and caused flooding, the extent of which varied from one area to another throughout the country. The situation was particularly serious in the city of Lomé and the surrounding area, as well as in the prefectures of Lacs, Yoto, Bas Mono and, to some extent, Kpendjal. This above-normal rainfall has also led to exceptional flooding of the main rivers, notably the Mono, Zio and Haho. The impact on the town also included a collapsed bridge, roads impassable for more than 24 h, schools closed for weeks and several families left homeless. It took around a month for social life to return to normal. As a result, certain factors that make people vulnerable to flooding and the rising water table led to flooding between June and October 2010 in the above-mentioned areas, prompting the government and its partners to take swift action. Given its severity and impact on the city, it seems necessary to understand the causes of this vulnerability in order to learn from it and use it as feedback.
Based on the results of the most recent public assessment (Rapport PDNA, 2010), it appear that a lack of knowledge or partial consideration of territorial vulnerabilities leads to poor planning choices. Feedback from experience and expert reports (Rapport PDNA, 2010) emphasize that, over the next 10 years, risk management will have to take account of vulnerability studies as an essential basis for defining the objectives of territorialized risk management.
The aim of this research is to analyze the vulnerability of the city of Lomé during the 2010 floods in order to better identify not only the causes of this vulnerability, but also to understand the relationship between urban management and socio-economic conditions. It opts for a holistic approach based on three pillars: exposure, sensitivity and adaptive capacity.
One of Togo's five (5) administrative areas, the Maritime Region, is home to the country's capital, Lomé. The commune of Lomé was originally positioned between the Aflao border to the west, the lagoon to the north, the Atlantic Ocean to the south, and the settlement of Bè to the east. Its boundaries in 2010 were the oil refinery to the east, the Atlantic Ocean to the south, the Groupement Togolais d'Assurances (GTA) to the north, and the border between Ghana and Togo to the west. With 1,477,660 people living there, the conurbation has a total area of 333 km2, of which 30 km2 is in the lagoon zone. The population of the city has increased to 2,188,376 today, covering 425.6 km2 (Figure 1).
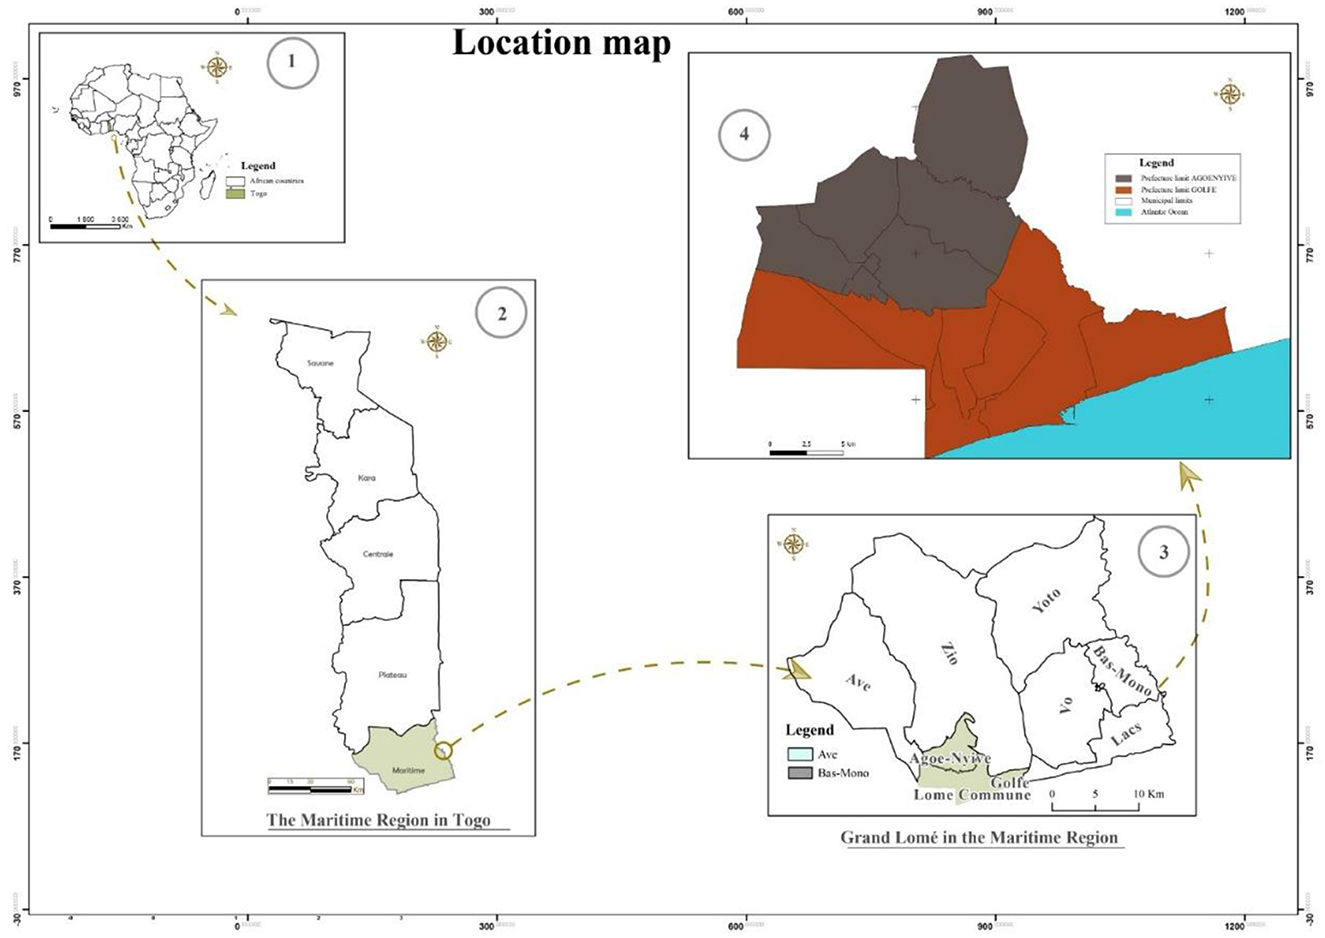
Figure 1. Map of Lomé. Source: Author's own creation.
The river system consists of the Zio and the Lomé lagoon system. The Zio, 176 km long, has its source in the Dayes plateau in Togo, where annual cumulative rainfall is between 1,200 and 1,400 millimeters. It is the main tributary of Lake Togo, due to its large flow and permanent discharge. At its mouth, its average flow is estimated at 9.9 m3/s (Figure 2).
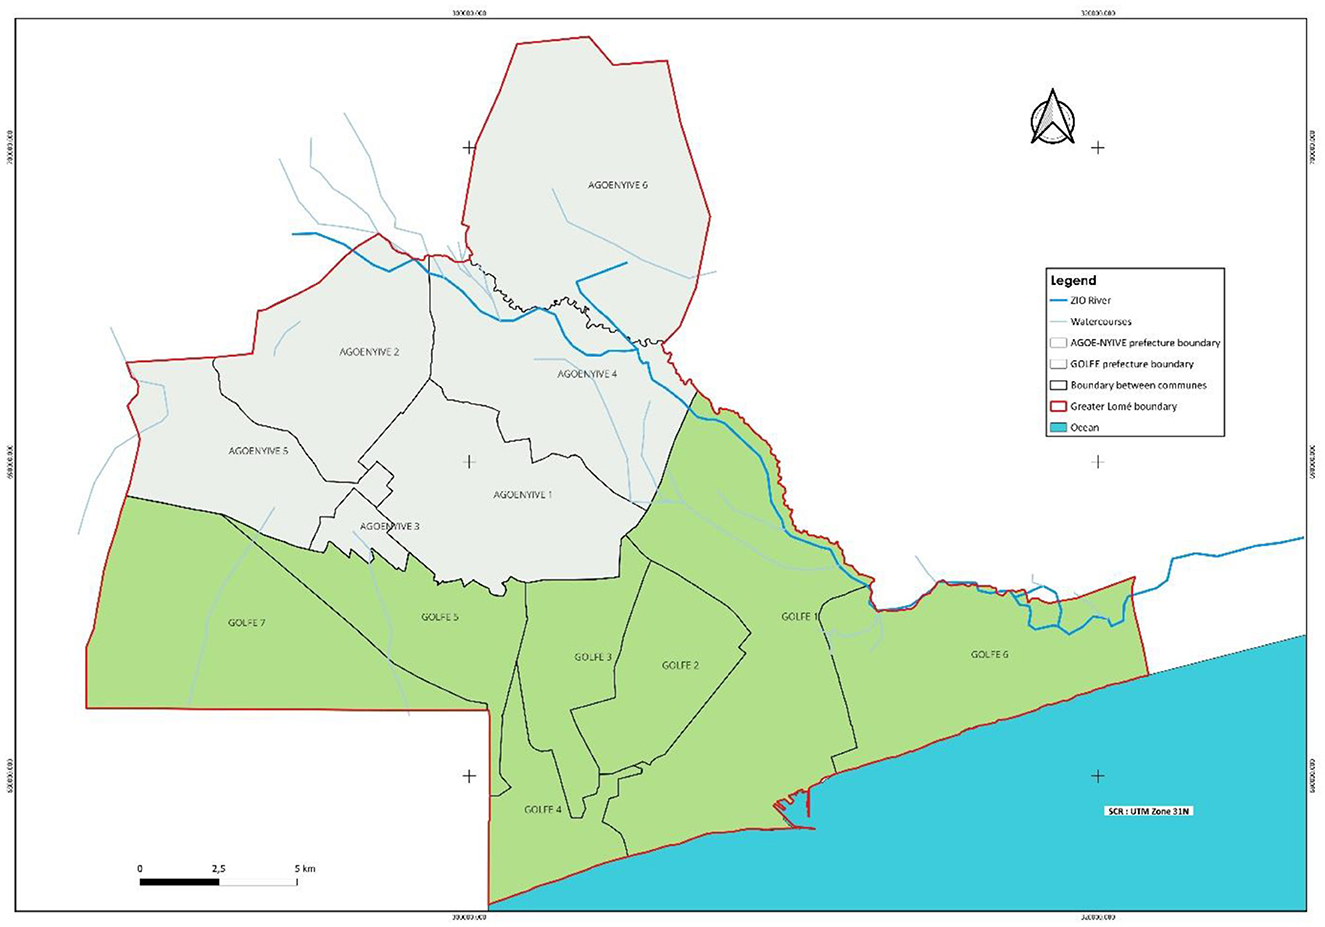
Figure 2. Hydrographic network of Greater Lomé. Source: Author's own creation.
Torrential rains severely affected togo in 2010. The city of Lomé and its outlying areas were not spared. The impact is considerable. As a result, flooding occurred between June and October 2010 in the above-mentioned areas, prompting the government and its partners to take swift action. Rainfall in June 2010 was 365.1 mm, compared with a normal average of 184.4 mm over the 30-year period from 1971 to 2000. In September 2010, the city of Lomé recorded 205 mm of rain compared with a normal 64 mm, i.e. an excess of 314% (Rapport PDNA, 2010).
The table above gives a summary description of the 2010 floods in the country (Table 1).
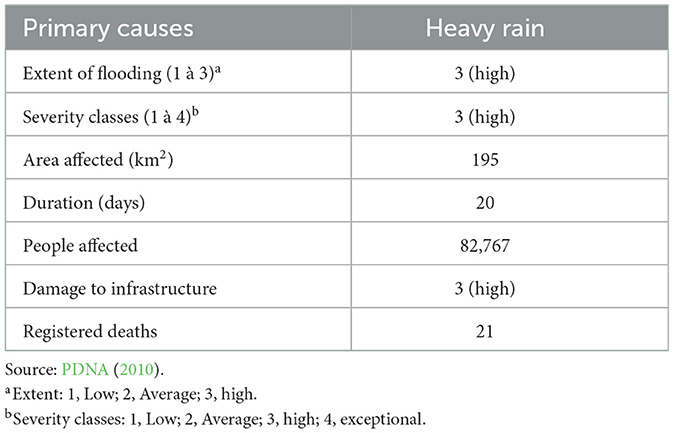
Table 1. Description of flooding.
In 2010, intense and violent rainfall affected large areas of Lomé, causing flooding, including 20 to 35% of areas that are not usually flooded, mainly the area of the two cordons (the lower town of Lomé between the lagoon and the sea) where 40 to 50% of the population live. The flooding is likely to be on a major scale. They are caused by the city's very low position in relation to sea level, climate change with increased rainfall, accelerated urbanization of the city, construction in the major riverbeds (Zio valley), rising sea levels, and the sealing of soils due to rubbish dumps and plastic waste. The consequences of all these problems are having a detrimental effect on the socio-economic development of the city of Lomé, requiring both urgent and medium-term measures. Our study will focus on the urban area of Lomé (Figure 3).
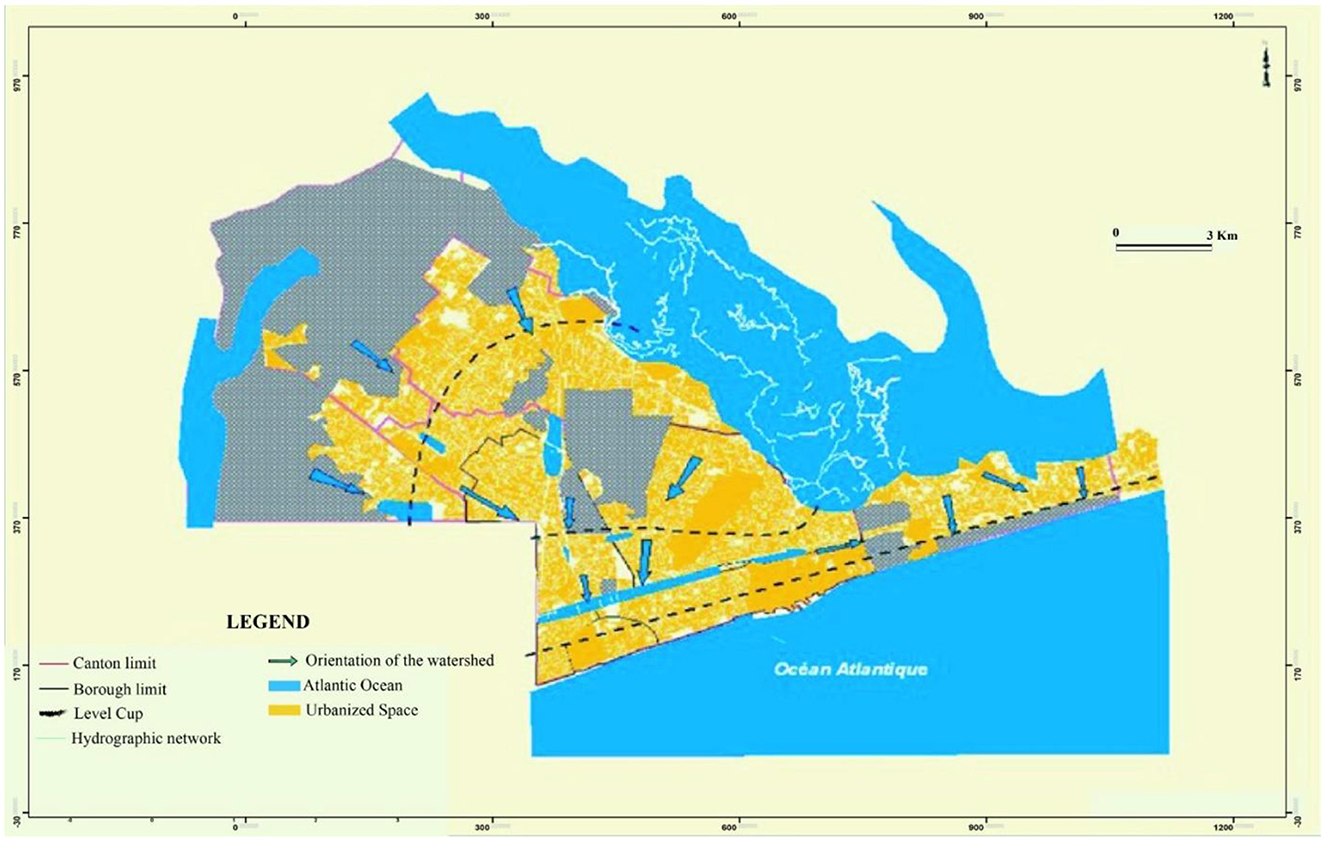
Figure 3. Map of flood zones. Source: SDU (2011).
The main objective of this research is to analyse the vulnerability of the city of Lomé during the 2010 floods. It aims to be systemic in order to gain a better understanding of all the causes of this vulnerability. It is based on the premise that a high level of exposure and sensitivity to risk, coupled with a low capacity to adapt, makes the area vulnerable.
Many methodologies are used in vulnerability analysis; the first is known as the socio-economic vulnerability assessment methodology and focuses on the socio-economic and political circumstances of specific individuals or social groups. Members of a community often differ in terms of political power, formal and informal (social) capital, education, wealth, health status, access to credit and other factors that are responsible for variations in levels of vulnerability (Deressa et al., 2008; Pearson and Langridge, 2008).
The second strategy is known as the biophysical strategy and aims to determine the extent to which a specific environmental stress affects social and biological systems. It is sometimes referred to as effects analysis. The vulnerability or deterioration of biophysical conditions is the main objective (Liverman, 1990). It is a methodology commonly used in research on climate change and vulnerability to natural disasters (Hewitt, 1995). This strategy has been classified as a risk and hazard strategy by Füssel. The biophysical method has some drawbacks, although it is very informative. One of the main drawbacks is that the assessment of biophysical parameters alone is insufficient to understand the complex dynamics of vulnerability. Furthermore, it does not take into account the way in which human action and institutional variables create vulnerability and help people to manage or adapt to it.
The third strategy, called the integrated assessment strategy, combines socio-economic and biophysical strategies to determine vulnerability. The integrated approach to vulnerability analysis is supported by the IPCC definition, which sees climate vulnerability as a function of adaptive capacity, sensitivity and exposure (Intergovernmental Panel on, 2001; Füssel and Klein, 2006; Fussel, 2007). Füssel and Klein argue that while adaptive capacity (broader social development) is essentially compatible with the social-ecological approach, the risk-hazard framework (biophysical approach) corresponds best to sensitivity in the IPCC nomenclature (Füssel and Klein, 2006).
Given that our objective is to carry out a systemic analysis of the vulnerability of the city of Lomé to flooding, we will opt for the latter approach as it is more comprehensive and takes into account all the pillars that will enable us to carry out this analysis.
In order to solve the problem of standards for combining the different variables, various methods have been developed.
In this case, vulnerability is the difference between a household's capacity to adapt and its sensitivity and exposure to the risks generated by climate change. The area is less sensitive to the effects of climate change when its adaptive capacity exceeds its sensitivity and exposure. Each set (adaptive capacity, sensitivity and exposure) is made up of different indicators.
The model will be as follows:
If Xs are the components of adaptive capacity, Ys are exposure and sensitivity, and V1 is the vulnerability index. By employing their mean and standard errors as a normalization factor, the values of X and Y are derived.
The case study will be based on socio-economic data and an analysis of the three vulnerability indicators: the exposure indicator, the sensitivity indicator and the adaptive capacity indicator. Data was collected from primary and secondary sources. For the primary data, a questionnaire survey was carried out in 8 zones (Bè kpota, Todman, Agoe zongo, Nykeonakpe, Adidogome, Badago, tokoin and Baguida) of the different communes most affected by the floods in the city. There is a population of around 7,500 in these areas, with a household size of 5 people per family, making a total of 1,500 households. Using the slovin formula, we collected information from 312 households out of the 316 planned. The questionnaire was designed on the basis of vulnerability indicators, and the various questions covered the duration and cause of the floods, the losses recorded, the perception of the risks, and adaptation measures…). Sampling was carried out in such a way as to ensure that respondents actually came from the areas most affected by flooding. To ensure good spatial coverage during data collection in the survey areas, we made sure that every alleyway in the different areas severely affected by flooding was taken into account. The data was collected using the Kobocollect tool and processed using Excel.
The data collected mainly concerned four (04) variables: socio-economic data (age, gender, level of education, profession, etc.); exposure indicators (frequency of flooding, distance between home and watercourses, etc.); sensitivity indicators (duration of flooding, height of water, knowledge of the risks involved, previous experience, etc.); and recovery capacity indicators (management strategies, relief, assistance, etc.).
The secondary data to which we will have recourse will be, principally, the annual reports of the National Agency for Civil Protection (We were given information on: the most vulnerable areas, the impact of previous floods, risk prevention measures, etc.), the reports of the National Agency for Environmental Protection, documented reports (ex: the assessment of damage, loss and reconstruction needs after the 2010 flood disaster in togo report), studies published in relation to flooding in Togo, websites and national newspapers) (ex: https://reliefweb.int/report/togo/togo-les-inondations-ont-fait-une-dizaine-de-victimes). Rainfall data was obtained from the national meteorological station.
Finally, a descriptive analysis of all the data collected through the survey was carried out, covering all the vulnerability indicators, followed by a correlation analysis (Table 2).
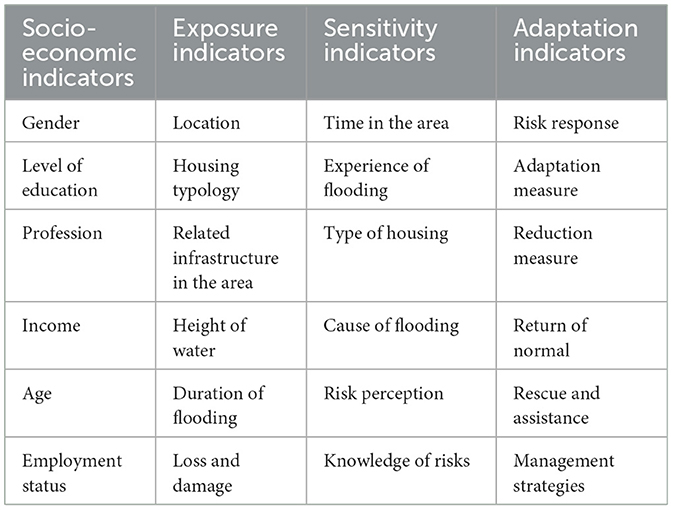
Table 2. Summary of vulnerability analysis indicators.
A total of 312 people were interviewed during the data collection, including 147 women (47.12%) and 165 men (52.88%). The level of education is heterogeneous in the study area, with 29% of respondents claiming to have higher education, 36% having secondary or post-secondary education, while 19% had just completed primary school and 16% had no formal education. While 7.5% of respondents were students and 31.5% were civil servants, the majority were in the informal sector (36.9%), traders (12.7%), unemployed (4.5%) and farmers (6.9%). 53.1% of respondents had an income of at least 200,000 CFA francs and 46.9% had an income of more than 200,000 CFA francs per month. The majority of respondents live on low incomes. The age distribution of respondents was as follows (Table 3).
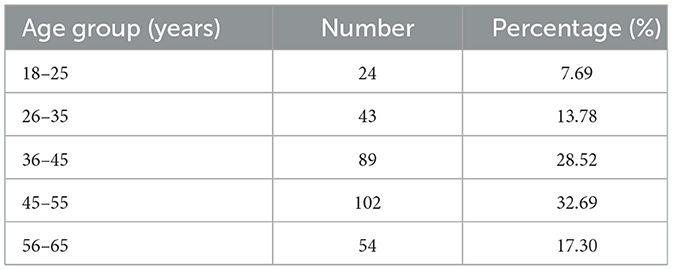
Table 3. Age distribution.
The results of the field surveys show that the vulnerability of dwellings during the 2010 floods was not directly caused by the proximity of dwellings to lagoons or outlets, but also by the inadequacy of retention and drainage structures for run-off water, which exacerbates the risk of flooding and increases the damage and losses. Surveys show that 44% of respondents live more than 1km from a river, lagoon or the sea. However, 21% live <250 m from a lagoon or river and 35% live between 250 and 900 m away. Cascading effects are thought to be partly responsible for the spread of flood risk in several parts of the city.
The vulnerability of urban networks and housing during the 2010 floods was not primarily due to their proximity to drainage works, lagoons and sewers, but the inadequacy of construction, river water management and drainage systems also increased the risk of flooding. Flooding and damage increase losses. According to the survey, 44% of respondents live more than 1 km from a river, lagoon or ocean. Meanwhile, 21% live <100 meters from a lagoon or river, and 35% live within 100–500 meters.
The generally precarious housing conditions are aggravated by the combined effects of insufficient infrastructure, the low level of decentralization of technical services, the high cost of building materials, the scarcity and high cost of housing credit due to the lack of suitable resources and the difficulties encountered by borrowers in obtaining the guarantees required by banks. The graph below shows the losses and damage suffered by the people interviewed during the surveys (Figure 4).
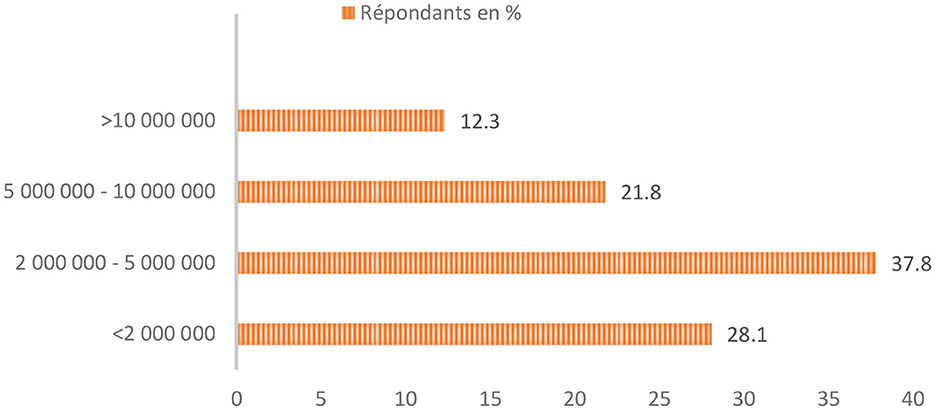
Figure 4. Losses incurred by respondents in F cfa.
Given the country's economic situation and the population's income, the losses and damage suffered by the people interviewed as a result of the floods were considered to be very high. This confirms the impact and severity of the disaster.
The height of submergence can have a major impact on buildings, particularly when it exceeds the reference level. The load-bearing structure of the dwelling may be damaged and the floors and walls waterlogged. When the flooding lasts for a long time (more than 24 hours or even 48 hours), health problems can arise, as the water is often dirty, contaminated by sewage or sometimes fuel oil escaping from tanks. The speed of flow depends on the slope of the bed and its roughness. It can reach several meters per second. The dangerousness of the flow depends on the combination of height and speed. For example, at speeds above 0.50 m/s, the current becomes dangerous for humans, with the risk of being swept away by the water or injured by objects carried along at high speed. A considerable percentage of the people surveyed were vulnerable because of the height of the water in their area. In fact, 71.9% of respondents estimated the height of the water at 1 m above ground level and 28.1% estimated the height at <1 m (between 0.5 and 0.8).
Respondents were asked: How long was needed for a return to normal, 43.9% thought that the adverse effects of the floods were felt more than 2 months after the floods, i.e. around 8 weeks. On the other hand, 37.2% said they had experienced flood conditions for 1 month, i.e. 4 weeks, and 18.9% said they had experienced flood conditions for 2 weeks.
24.4% of respondents had lived in the area affected by flooding for 20 years. On the other hand, 39.5% said they had lived in the area for 10 years. Of this proportion, 26.5% settled in the area 5 years ago and 9.3% have lived there for between 1 and 4 years. Between 1925 and 1992, Togo recorded 60 urban and rural floods which caused material damage and loss of life (Sodogas and Gomado, 2006). These past events could serve as experiences for the city's residents, only 24.4% of whom have been living there for around 20 years.
Analyses of the housing stock show that 52.5% of the houses were made of breezeblock, 24.6% of BTC, 15.6% of earth and 7.3% of precarious materials (Figure 5).
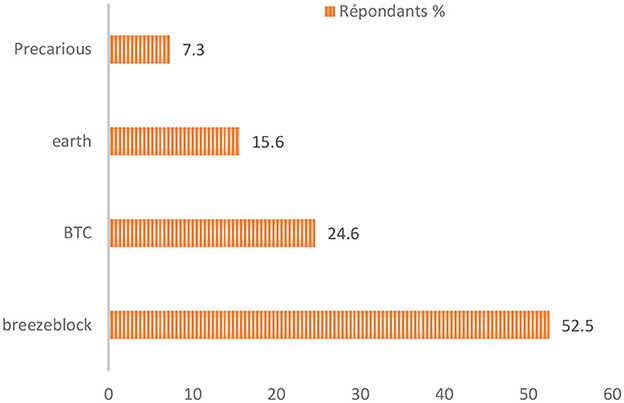
Figure 5. Types of building materials.
Feedback is essential if we are to meet this challenge, as it enables us to collect data on the ground, reconstruct the circumstances and sequence of events in their spatial and temporal dimensions, and better understand the results so that we can learn from them (Ledoux, 1996; Nyassogbo, 2005; Crozier et al., 2017; Moatty et al., 2017; Rey et al., 2017). It can provide certain elements of response and is also intended to feed into international risk and disaster management plans (Klassou, 2014). It advances our understanding of events and risk and crisis management techniques (Rey et al., 2017). Of all the people questioned, more than half (61.5%) said they had already experienced urban flooding in their city. Almost all of those questioned said they had never experienced flooding on this scale. The age of 79.2% of respondents with experience of past flooding varies between 35 and 55, and these people have lived in the area affected by flooding for 10 years or more, while 38.5% of respondents who have never experienced flooding have lived in the area affected by flooding for less than 10 years.
The poor quality and inadequacy of stormwater drainage works (2.3%), the increase in rainfall intensity in previous years (0.1%), the occupation of minor and major river beds (1%), the control of the radius of impact of a river following an overflow (4.2%), knowledge of lowland areas (1.2%) and the obstruction of drainage works were considered to be prior warnings (0.9%). On the other hand, 84.2% of respondents said they were not aware of the risk of flooding in the area. 6.1% of respondents did not answer this question.
Risk perception is defined as an assessment of the probability of harm and the probability of consequences (mainly negative consequences) perceived by a society or community (Bubeck et al., 2012). Kellens et al. (2011) the study of flood risk perception is considered to be the study of human awareness, emotions and behavior in the face of danger. It is an important component of vulnerability and several studies show that risk perception is significantly dependent on flood preparedness (Miceli et al., 2008).
38.5% of those questioned who had experienced flooding in the past had a perception of the risks, while those who had never experienced flooding (61.5%) had no perception of the risks. Among the 56% of respondents who live between 0 and 900 m from lagoons, only 18% had a perception of the risk of flooding. Proximity to the lagoons has not considerably increased people's perception of the risks. The result is exponential vulnerability.
In terms of risk perception, the results of the survey are as follows (Table 4).
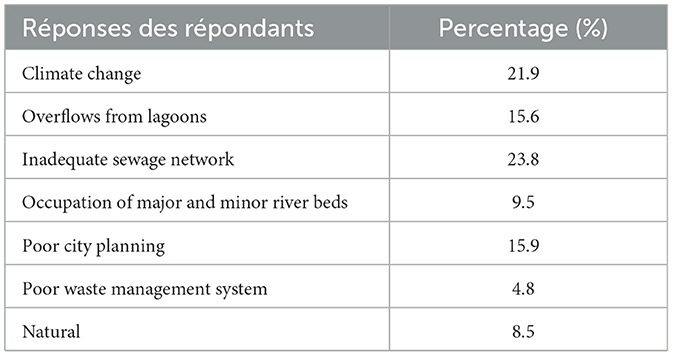
Table 4. Risk perception.
Emergency relief remains the main measure in the event of flooding, with material, food and health aid provided to those affected. Reception centers are also set up to house and care for the homeless until the waters recede. Local authorities were often absent from flood management due to a lack of internal organization. As a result, the ability of local people to cope with the risks reduced to some extent the adverse effects of flooding in the city. Local people have used their knowledge to deal with the floods. Some 43% of those questioned said that they had dug culverts to facilitate the evacuation of rainwater. A number of people affected by the floods received government aid, mainly in the form of emergency and temporary shelters and emergency aid supplies (medicines, food and clothing). 91% of the recipients of government aid were people on low incomes.
Flood victims were asked if they had taken any personal decisions or measures to reduce the risk of vulnerability to flooding in their area or home. The results of the surveys are as follows (Table 5).
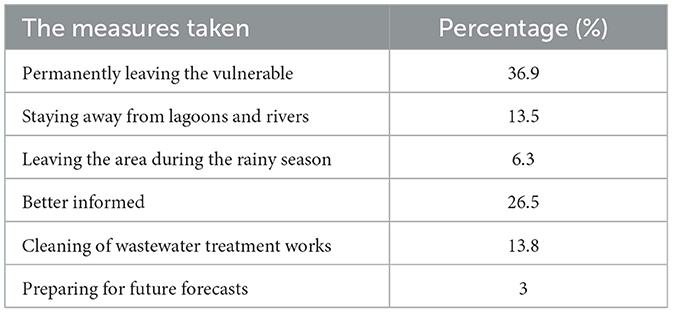
Table 5. Measures taken by local people.
When it comes to responsibility for flood management, most respondents (97%) reject this role for governments, believing that they are not at the forefront of sustainable urban development strategies, specifically on issues relating to urban resilience to flooding.
The design approach used, which attempts to respect the many understandings of the idea of vulnerability, justifies the high variety of indicators. This work's foundation is city study with a common understanding of vulnerability. It should be mentioned that competition among indicators shows the current, objective dynamics underpinning a society because it is crucial to choose a small number.
The already precarious socioeconomic position further worsened as a result of the floods. While many residents were forced to stop working, some lost their tools of the trade (destroyed motorcycles, street stalls, and shops of all types). It is expected that the ensuing crisis will be challenging to resolve since, despite the assistance of local and international NGOs, the government has been slow to address the urgent requirements of the excessive number of refugees dispersed around the city. But the most serious consequence was elsewhere: sanitary conditions deteriorated during these events, depriving the population of electricity and therefore of the possibility of refrigerating food which, in the open air, was subject to contamination and the proliferation of bacteria. The need to light their homes by candlelight encouraged accidental fires, of which there were many within a week. Above all, the population is deprived of drinking water, which makes it virtually impossible to observe basic hygiene rules, in a context that would require even more precautions than in normal times.
In many developing countries, knowledge of the hazard is limited due to a lack of archives and historical data, as well as inadequate meteorological and hydrological records. For example, the results of a recent study (Hubert and Ledoux, 1999) show that forecasting is difficult due to the lack of properly functioning local weather stations.
The truly galloping growth of some cities in developing countries does not allow for land management, nor for the installation of sufficient infrastructure in newly-created neighborhoods. All the areas affected have shown that the greater the poverty, the greater the vulnerability of populations, the greater the risks. At the very least, risk management should involve information and training for exposed residents, if not for society as a whole. This remains difficult for largely illiterate populations whose only concern is often day-to-day survival. Risk is also frequently perceived as the result of divine intervention or fate. Once again, this is a considerable obstacle to a prevention policy.
The term “anthropogenic vulnerability indicators” is used to describe all human behaviors that increase their sensitivity to flooding. Population increase has frequently been accompanied by a large-scale rural exodus, which is still occurring in several developing nations (CRED, 2005). Sodogas and Gomado (2006) demonstrates that although a number of variables contribute to the recurring flooding in various African cities, human behavior—particularly exposure and persistent sensitivity—associated with the settling of populations in flood-prone areas, is the main cause. Recent research (Klassou, 2014) demonstrate that environmental deterioration is causing flooding issues in an increasing number of African communities.
All aspects of the city of Lomé in 2010 are well known. In fact, the need for urban space for housing is greater due to population growth in large area. As a result, the city has expanded into sensitive areas. Urban development has rendered surfaces impervious to water, structures obstruct natural drainage systems, and torrential rains during the wet seasons leave people vulnerable to flooding. The analysis of vulnerability to flooding, based on socio-economic indicators, exposure and sensitivity indicators and adaptation measures, has highlighted the key vulnerabilities of communities and their populations, which need to be adjusted in order to achieve sustainable urban development. Indeed, clarifying the vulnerability of individuals and communities is crucial to successful flood management, as modifying the vulnerability of exposed populations is likely to reduce the effects of hazardous disasters. The urban flood of 2010 fully reflected the vulnerability of its victims in terms of their socio-economic characteristics, their exposure to risk, their sensitivities and their ability to recover once affected by flooding. The risk perception of flood victims is highly dependent on the institutions that serve them and regulate urban management.
The original contributions presented in the study are included in the article/supplementary material, further inquiries can be directed to the corresponding author.
Ethical approval was not required for the studies involving humans because it was not compulsory and the work did not affect people's sensibilities and each person gave their agreement before the interview began. The studies were conducted in accordance with the local legislation and institutional requirements. The participants provided their written informed consent to participate in this study. Written informed consent was obtained from the individual(s) for the publication of any potentially identifiable images or data included in this article.
RA: Writing – original draft, Data curation, Formal analysis, Software, Investigation, Visualization. IE: Conceptualization, Investigation, Methodology, Writing – review & editing. AC: Supervision, Validation, Project administration, Funding acquisition, Writing – review & editing.
The author(s) declare that financial support was received for the research, authorship, and/or publication of this article. The author was deeply grateful to the World Bank for funding this research through CERViDA (Regional Centre for Sustainable Cities in Africa) and to the Association of Universities of Africa (Funding number IDA 5360 TG).
The authors declare that the research was conducted in the absence of any commercial or financial relationships that could be construed as a potential conflict of interest.
The reviewer FB declared a shared affiliation with the author IE to the handling editor at the time of review.
All claims expressed in this article are solely those of the authors and do not necessarily represent those of their affiliated organizations, or those of the publisher, the editors and the reviewers. Any product that may be evaluated in this article, or claim that may be made by its manufacturer, is not guaranteed or endorsed by the publisher.
Barroca, B., Pottier, N., and And Lefort, E. (2005). Analyse et évaluation de la vulnérabilité aux inondations du bassin de l'orge aval; Septièmes Rencontres de Théo Quant.
Brooks, N., and Adger, W. N. (2003). Country Level Risk Measures of Climate-Related Natural Disasters and Implications for Adaptation to Climate Change. Tyndall Centre Working Paper 26. Available online at: http://www.tyndall.ac.uk/publications/working_papers/wp26.pdf (accessed October 2023).
Bubeck, P., Botzen, W. J. W., and Aerts, J. C. J. H. (2012). A review of risk perceptions and other factors that influence flood mitigation behavior. Risk Anal. 32, 1481–1495. doi: 10.1111/j.1539-6924.2011.01783.x
CRED (2005). EM-DAT, The International Disasters Database. WHO Collaborating Centre For Research on the Epidemiology of Disasters. Universite' Catholique de Louvain. Available online at: http://www.em-dat.net/ (accessed October 2023).
Crozier, D., Jouannic, G., Tran Duc Minh, C., Kolli, Z., Matagne, E., and Arbizzi, S. (2017). Reconstruire un territoire moins vulnérable après une inondation : une fenêtre d'opportunité encore difficilement mobilisable. Espace populations sociétés. Available online at: http://eps.revues.org/7033 (accessed July 2, 2017).
de Richemond, N. M., and Reghezza, M. (2010). La gestion du risque en France: contre ou avec le territoire? Dans Annales de géographie 2010/3 (n° 673), pages 248 à 267. Available online at: https://www.cairn.info/revue-annales-de-geographie-2010-3-page-248.htm (accessed October 2023).
D'Ercole, R. (1994). Les vulnérabilités des sociétés et des espaces urbanisés: concepts, typologie, modes d'analyse. Revue de Géographie Alpine LXXXII, 87–96. doi: 10.3406/rga.1994.3776
Deressa, T., Hassan, R. M., and Ringler, C. (2008). Measuring Ethiopian Farmers' Vulnerability to Climate Change Across Regional States. IFPRI discussion paper No. 806, Washington. Available online at: http://www.ifpri.org/pubs/dp/ifpridp00806.asp (accessed October 2023).
Fussel, H. (2007). Vulnerability: A generally applicable conceptual framework for CC research. Glob. Environ. Change 17, 155–167. doi: 10.1016/j.gloenvcha.2006.05.002
Füssel, H.-M., and Klein, R. J. T. (2006). CC vulnerability assessments: an evolution of conceptual lthinking. Clim. Change 75, 301–329. doi: 10.1007/s10584-006-0329-3
Gleyze, J.-F. (2000). Apport de l'information géographique dans l'analyse de risques – Applications à l'étude des perturbations du réseau routier à la suite de catastrophes, in Bulletin d'Information de l'IGN. Activité recherche 2000, n°72, 69–84, laboratoire COGIT.
Gleyze, J.-F. (2001). Etude topologique de la fonctionnalité des réseaux, in Actes des Journées Cassini 2001: ≪ Géomatique et espace rural ≫. laboratoire COGIT, IGN-SR-01-041-S-ART-JFG.
Hewitt, K. (1995). Excluded perspectives in the social construction of disaster. Int. J. Mass Emerg. Dis. 13, 317–319. doi: 10.1177/028072709501300307
Hubert, G., and Ledoux, B. (1999). Le coût du risque… L'évaluation des impacts socio-économiques des inondations. Paris: Presses de l'Ecole Nationale des Ponts et Chaussées. p.232.
Intergovernmental Panel on, C. C. (2001). CC 2001: Impacts, Adaptation and Vulnerability. 3rd Assessment Report of the Intergovernmental Panel on CC, Adaptation to CC in the Context of Sustainable Development and Equity. Cambridge: Cambridge University Press. p. 877–912.
Kellens, W., Zaalberg, R., Neutens, T., Vanneuville, W., and De Maeyer, P. (2011). An analysis of the public perception of flood risk on the Belgian coast. Risk Anal. 31, 1055–1010. doi: 10.1111/j.1539-6924.2010.01571.x
Klassou, K. S. (2014). L'influence humaine dans l'origine et la gravité des inondations au Togo: cas de l'aménagement de l'espace dans la grande banlieue nord de Lomé (Togble194 Adetikope), Revue de Géographie Tropicale et d'Environnement (GEOTOPE), n° 2, EDUCI. p. 3–15.
Ledoux, M. (1996). On Talagrand's deviation inequalities for product measures. ESAIM Prob. Stat. 1, 63–87. doi: 10.1051/ps:1997103
Leneveu, J., and Laville, M. M. (2012). La perception et l'évaluation des risques d'un point de vue psychologique; Note de recherche; Bibliographic record. Available online at: https://www.erudit.org/en/journals/vertigo/1900-v1-n1-vertigo0531/1015097ar/abstract/ (accessed October 2023).
Liverman, D. M. (1990). Vulnerability to global environmental change. In: Kasperson, R.E., et al., editors. Understanding Global Environmental Change. Worcester: Center for Technology, Environment, and Development, Clark University. p. 27–44.
Meesner, F., and Meyne, V. (2006). Flood Damage, Vulnerability and Risk Perception – Challenges for Flood Damage Research. Part of the NATO Science Series book series.
Miceli, R., Sotgui, I., and Settanni, M. (2008). Disaster preparedness and perception of flood risk: a study in an alpine valley in Italy. J. Environ. Psychol. 28, 164–173. doi: 10.1016/j.jenvp.2007.10.006
Milly, P. C. D., Wetherald, R. T., Dunne, K. A., and Delworth, T. L. (2002). Increasing risk of great floods in a changing climate. Nature 415, 514–517. doi: 10.1038/415514a
Moatty, A., Gaillard, J.-C., and Vinet, F. (2017). Du désastre au développement : les enjeux de la reconstruction post-catastrophe. Annales de géographie 714, 169–194. doi: 10.3917/ag.714.0169
Nyassogbo, G. K. (2005). La zone lagunaire de Lomé: Problèmes de dégradation de l'environnement et assainissement. Libreville: Annales de l'Université Omar Bongo, Lettres, Langues, Sciences Humaines et Sociales, Presses universitaires du Gabon. p. 390–408.
PDNA (2010). Rapport final, evaluation des dommages, pertes et besoins de reconstruction post catastrophes des inondations de 2010 au Togo. Pnud, Banque mondiale, février.
Pearson, L., and Langridge, J. (2008). CC Vulnerability Assessment: Review of Agricultural Productivity. CSIRO Climate Adaptation Flagship Working Paper No. 1.
Rapport PDNA (2010). Evaluation des dommages, pertes et besoins de reconstruction post catastrophes des inondations de 2010 au Togo. Rapport PDNA 2010.
Reghezza, M. (2006). Réflexions sur la vulnérabilité métropolitaine. La métropole parisienne face au risque de crue centennale. Thèse de doctorat. Nanterre: Université Paris X–Nanterre.
Reghezza, M., Rufat, S., Djament, G., Le Blanc, A., and Lhomme, S. (2012). What Resilience Is Not: Uses and Abuses. Cybergeo. Eur. J. Geography. doi: 10.4000/cybergeo.25554
Rey, T., Le, D.é L., Leone, F., and David, G. (2017). An integrative approach to understand vulnerability and resilience post-disaster : the 2015 cyclone Pam in urban Vanuatu as case study. Dis. Prev. Manag. 26, 259–275. doi: 10.1108/DPM-07-2016-0137
SDU (2011). Agetur Togo, stratégie de développement urbain du grand Lomé, rapport diagnostic volume i.
Sodogas, A. V., and Gomado, K. (2006). Analyse situationnelle des risques et facteurs de risques potentiels en matière de désastres au Togo.
Turner, M. G., Romme, W. H., and Tinker, D. B. (2003). Surprises and Lessons from the 1988 Yellowstone Fires. Available online at: https://esajournals.onlinelibrary.wiley.com/doi/abs/10.1890/1540-9295(2003)001[0351:SALFTY]2.0.CO;2 (accessed October 2023).
Keywords: evaluation, vulnerability, flooding, Lomé, risk
Citation: Attipo RV, Emvoulou IJ and Coffi AC (2023) Climate change and urban stormwater: vulnerability analysis of the 2010 floods in Lomé, Togo. Front. Clim. 5:1281433. doi: 10.3389/fclim.2023.1281433
Received: 23 August 2023; Accepted: 21 November 2023;
Published: 20 December 2023.
Edited by:
Pia-Johanna Schweizer, Research Institute for Sustainability – Helmholtz Centre Potsdam, GermanyReviewed by:
Mo Wang, Guangzhou University, ChinaCopyright © 2023 Attipo, Emvoulou and Coffi. This is an open-access article distributed under the terms of the Creative Commons Attribution License (CC BY). The use, distribution or reproduction in other forums is permitted, provided the original author(s) and the copyright owner(s) are credited and that the original publication in this journal is cited, in accordance with accepted academic practice. No use, distribution or reproduction is permitted which does not comply with these terms.
*Correspondence: Reisch Vanel Attipo, ci5hdHRpcG9AZ21haWwuY29t
Disclaimer: All claims expressed in this article are solely those of the authors and do not necessarily represent those of their affiliated organizations, or those of the publisher, the editors and the reviewers. Any product that may be evaluated in this article or claim that may be made by its manufacturer is not guaranteed or endorsed by the publisher.
Research integrity at Frontiers
Learn more about the work of our research integrity team to safeguard the quality of each article we publish.