 Lelisa Hordofa
 Tamiru Yazew
95% of researchers rate our articles as excellent or good
Learn more about the work of our research integrity team to safeguard the quality of each article we publish.
Find out more
ORIGINAL RESEARCH article
Front. Clim. , 22 September 2023
Sec. Climate Adaptation
Volume 5 - 2023 | https://doi.org/10.3389/fclim.2023.1237144
Introduction: The objective of this research was to assess the trends and variability in the BakoTibe district as well as raise awareness among rural farmers.
Methods: The sample of homes included 141 out of 29 participants, all from families headed by a female. The Mann-Kendall trend test and the Sen-slope estimator were used to assess the trend of annual minimum and maximum temperatures and seasonal precipitation for the study areas.
Results and discussion: The year, summer, and spring climate variability results were examined, and the CV of spring precipitation was found to be 34.8%, indicating high variability of rainfall. Spring precipitation was more unstable than summer precipitation. Statistically, total annual precipitation, the summer season, and the autumn season all showed positive or no significant trends, while spring and winter precipitation both showed a negative or decreasing trend. The probability of 7, 10, 15, and 20-day dry spells in June, July, August, and September during the main rainy season (summer) was zero. The chance of a 20-day dry spell occurrence was highest from March 1 (61 days) to April 23 (115 days), lowest from April 23 (130 days) to June, July, August, and September 20 (265 days), and highest after the end of September. The dry period lasted 15 days, beginning on March 1 (61 days), ending on May 8 (130 days), and returning to zero from May 8 (130 days) to June, July, August, and September 5 (250 days). The probability of a 10-day dry spell began in March (61) and ended on May 23 (145), with the 7-day dry spell ending on June 23 (160). In this study, annual precipitation and temperature values from 2010 to 2019 were examined. Precipitation and temperature have a positive and significant relationship with corn and teff. Approximately 65.2% of the population reported late precipitation, while 34.8% reported no late precipitation. A premature end to the rains affected the livelihoods of ~73% of those polled. Crop diversification, terracing, tree planting, irrigation cultivation for precocious crops, and non-agricultural activities have all been used to adapt to the effects of climate variability and change.
Smallholder farmers' decisions about which adaptation alternatives to use in response to climate change and variability are influenced by socioeconomic, institutional, and environmental factors, implying that small-scale irrigation, agronomic methods, livelihood diversification, soil conditions, and water conditions influence decision patterns. Conservation measures are the most commonly used adaptation strategies among smallholder farmers to mitigate the negative effects of climate change and variability (Abayineh and Belay, 2017). Climate change and labor turnover are now local and global phenomena. Drought, torrential rain, heat waves, and dry spells affect the majority of rural Africa, and their impact is now felt on virtually all scales and in all regions (Adger, 2000).
Climate variability is widely regarded as one of the most difficult and complex issues confronting the world today (Woodward et al., 2014). The risks are extremely high, and the consequences would significantly increase the developmental barriers to ensuring livelihood security and poverty eradication in the majority of Sub-Saharan African (SSA) countries (Woodward et al., 2014). Because of their reliance on rain-fed agricultural output and limited adaptive capability due to socioeconomic constraints, most tropical regions around the world are vulnerable to climate unpredictability (Arpita et al., 2019). Climate variability and extreme events affect livelihood vulnerability, but several biophysical and social factors (Feyissa et al., 2018) also influence it. This means that a system is vulnerable if it is exposed to the effects of climate variability and catastrophic events while also having limited adaptive capability (Selvaraju, 2012). Ethiopian households' livelihoods are adversely affected because they rely on rain-fed agriculture and face issues related to climatic variability and extremes (World Bank, 2010). Droughts are becoming more common, as are other environmental issues such as land degradation, deforestation, overgrazing, and biodiversity loss, all of which have an impact on the livelihoods of rural communities (Mekonnen et al., 2019). Farmers in most SSA regions identify and describe decreasing precipitation levels and rising air temperatures as the most common indicators of climate variability (Tesfahunegn et al., 2016; Ochieng et al., 2017). Farmers have reported changes in precipitation amount, distribution, and timing, such as late onset and early cessation, resulting in shifted cropping calendars and shorter cropping seasons, reducing agricultural production significantly (Mubiru et al., 2018). Despite Ethiopia's unpredictable precipitation, which causes frequent droughts and severe soil degradation, agricultural production drives the country's economy (EPCC, 2015). The industry is the largest contributor to food security, accounting for 38.5% of GDP, 85% of employment, 90% of export revenues, and 80.2% of population income (CSA, 2013; NPC, 2016).
According to the study, smallholder farmers in different parts of Ethiopia face a wide range of climatic variations and change-related problems. Some of the issues are reduced or irregular precipitation, rising temperatures, short growing seasons, pests and diseases of agriculture and livestock, weed infestations, floods, water scarcity, and land degradation (Wagesho et al., 2013; Alemayehu and Bewket, 2017). Climate change is contributing to lower agricultural productivity, and without proper farming practices, the local sector's long-term viability is negatively impacted (Arragaw and Woldeamlak, 2016; Popoola et al., 2017).
To overcome the problem, smallholder farmers use crop and livestock diversification, soil and water conservation, tree planting, changing the planting date based on area climatic conditions, functional climate-related nutrient applications, perennial agroforestry systems, and irrigation, which are among Ethiopian farmers' “sodbuster” methods to combat this problem (Gebrehiwot and van der Veen, 2013; Tessema et al., 2013). Estimating agricultural acreage and yield is one of the most essential concerns that policymakers and decision-makers require for analyzing annual crop productivity and food supply, and it allows for the estimation of these crop production characteristics across wide geographic areas (Gowhar et al., 2022).
Furthermore, crop production and the livelihoods of smallholder subsistence farmers suffer because of shortfalls in rainfall caused by climate change. As a result, accurate and timely predictions of climatic conditions have had good effects in the research area, and some adaptive mechanisms to deal with climatic extremes have been adopted (Arpita et al., 2019). The influence on rainfall and soil moisture, an increase in temperature range, and the episodes producing intra-seasonal fluctuation make further investigation critical for sustainable livelihood systems (Netrananda et al., 2020).
The majority of people in the Bako Tibe areas rely on a mixed farming system that is inherently climate-sensitive, so climate variability affects their livelihoods as well. Droughts, food insecurity, low crop yields, livestock deaths, and even famine are all symptoms of this effect in the study area. Because agriculture is the primary source of income for the rural population, even minor variations in rainfall intensity or amount pose a serious problem. Temperature fluctuations, as well as irregular rainfall throughout the year and season, have an impact on the agricultural sector, which is primarily supported by rainfall. As a result, agriculture is critical to the economic and social health of rural livelihoods. The effects of climate variability on smallholder farmers' livelihoods and adaptation practices have not previously been investigated. As a result, this study was initiated to assess the impact of climate variability on smallholder farmers' livelihoods and adaptation practices in Ethiopia's Oromia region's western Shewa zone.
The study was carried out in the Bako Tibe area of Oromia Regional State's West Shewa Zone (Figure 1). The Bako Tibe districts are located 251 km west of Addis Abeba, at an elevation of 1,650 m above sea level, between 8° 56′ 00” and 9° 06′ 00” N latitude and 37° 01′ 00” and 37° 12′ 00” E longitude. Chaliya district is bordered on the east by the district; Gobu Seyo district is bordered on the west by the district; Gudaya Bila district is bordered on the north by the district; and Biloboshe district is bordered on the south by the district. The district has 123,558 residents, with 61,266 males and 62,292 females, for a total household size of 22,851 (CSA, 2010). A survey study design was chosen to obtain and provide detailed data on the current situation of the subjects under consideration. As a result, the study employed a straightforward quantitative research approach. This strategy was used to gather a wealth of information about the subject under consideration.
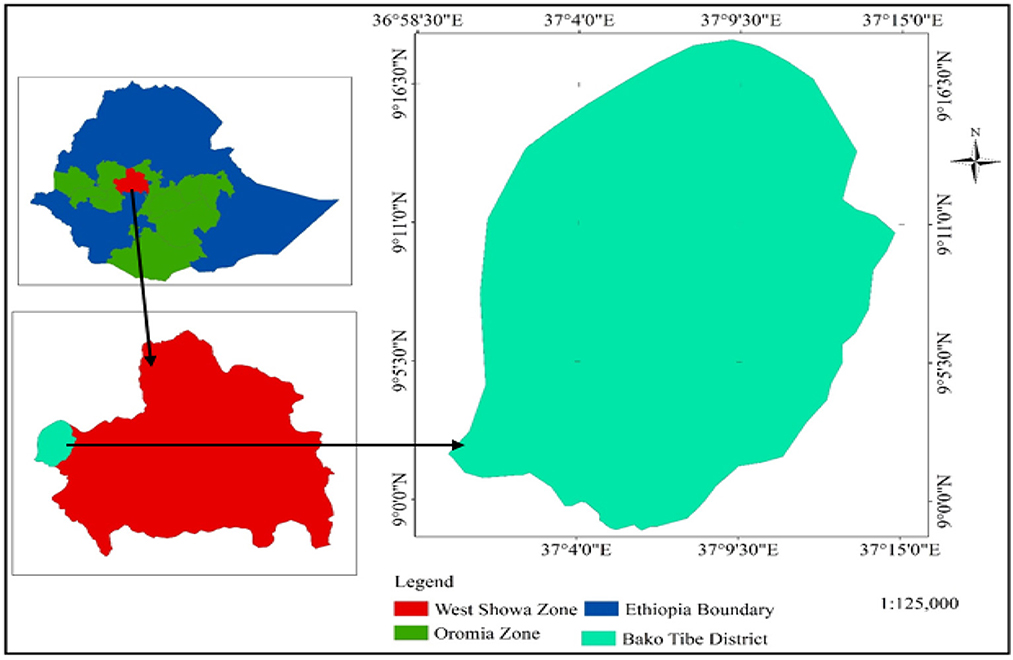
Figure 1. Map of the study area.
To collect primary data, questionnaires, interviews, and field observations were used. Secondary data was gathered from the metrological station and the agricultural administration office, as well as crop output and livestock statistics.
The study included kebele households.
Non-participating households whose their age is <18 years old and not information about climate variablity were excluded from the study.
The study concentrated on three “kebeles”, chosen at random from 32 in the district. Dambi Dima, Guto Meti, and Oda Gudaya were chosen several times based on their agro ecological distinctions (lowland, midland, and highland) (Table 1). The study employs an alternative stratified sampling technique to collect sorted socioeconomic data (age, gender, education, and so on) from sodbuster farmers in the study area. Questionnaires for this study were developed from different related articles, and local language (Afaan Oromoo) was used to collect data from each study subject.
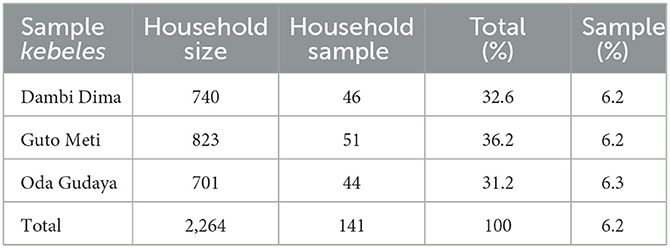
Table 1. Selection of sample households from three selected kebeles.
The Kothari sample size determination formula was used to calculate the sample size (Kothari, 2004). This was a modern and straightforward method of determining sample size based on home size.
Where; n = sample size, N = size of the household head unit in kebeles, e = acceptable error (the precision error) = 0.08, p = standard deviation of the population (0.5), z = standard variant at a given confidence level (1.96).
Ground observation data obtained from the National Meteorology Agency was used to characterize the daily climate of the study area (1984–2019). The characterization focused on determining information on the start of the rain, the maximum rain date, the duration, the dry/wet period, and thus the variety of rainy days using specified criteria. The climate variables were analyzed using INSTAT v3.37.
The coefficient of variation (CV) and standard deviation (SD) were used to analyze past and future intra-seasonal precipitation indices (SD).
The coefficient of variation (CV) was calculated as
CV (%) values are classified as follows by Hare (1983): 20% as less variable, 20–30% as moderately variable, and >30% as highly variable. SD can be calculated as follows:
The standard deviation, on the other hand, was calculated as the square root of the variance. The stability of precipitation is examined using Reddy's (1990) classification: when the standard deviation is 10, it is very stable; 10–20 is high stability; 20–40 is moderate stability; and >40 is less stable.
If the previous day had been dry, the probability of a prolonged dry spell was calculated; if the previous day had been rainy, the probability of a prolonged rainy spell was calculated on a conditional basis known as a Markov chain (Stern and Cooper, 2011). To provide an overview of dry spell hazards during the crop-growing season and realistic decision support to various practitioners, the Markov chain model was used to predict the probability of dry spell lengths of 5, 7, 10, 15, and 20 days during the crop-growing season. The Ethiopian National Meteorological Agency is used to calculate the number of rainy days and the length of dry spells. A rainy day occurs when it rains 1 mm or more (NMA, 2001). The number of rainy days was counted every year from June 1 to September 30 during the “Ganna” (summer season). In addition, the length of the dry spell was calculated by counting the number of consecutive dry days (days with <1 mm of precipitation) in “Ganna” (summer season).
In a Markov chain analysis of the watershed's dry spell, the following expression was utilized (Reddy et al., 2008).
Where; Pd is the probability of the day being dry; Fd is the number of dry days; Pw is the probability of the day being wet; Fw is the number of wet days; n is the number of observations; Pww is the probability of a wet day followed by other wet days; Few is the number of wet days followed by other wet days; Pdd is the probability of a dry day followed by other dry days; Pdw is the probability of a wet day followed by other dry days; Pwd is the probability of a dry day followed by other wet days; and Fdd is the number of a dry day followed by another dry day of the growing season.
The Mann-Kendall trend test and Sen's slope estimator were used to examine the trend of the studied areas' yearly minimum and maximum temperatures and seasonal precipitation. The Mann-Kendall test approach is a non-parametric test approach that has been widely utilized in meteorological time series data and identification studies to determine the importance of a trend and, more particularly, whether a trend exists (Wang et al., 2007; Karaburun et al., 2011; Kendall, 2015). Mann (1945) suggested the test, which has been widely used with environmental time series. There are two benefits to using this test. For starters, a non-parametric test does not require regularly distributed data. Second, the test is impervious to abrupt breakdowns caused by inhomogeneous time series. The null hypothesis H0 in this test assumes that there is no trend (the data is independent and randomly organized). Addisu et al. (2015) define the Mann-Kendall statistic (S) as the sum of the number of positive differences minus the number of negative differences:
Where S is the Mann-Kendall statistics of a time series' sequential data values in years i and j (j > i) and N represents the time series length. A positive S value shows an increasing trend in the data series, while a negative value indicates a decreasing trend. The sign function is given as
For n > 10, the distribution approximates the standard normal distribution (Yenigun et al., 2008). Kendall (1975) describes the normal approximation test as a test procedure. This test assumes that the values in the dataset are minimally connected and is computed as follows: First, the variance of S was calculated using the following equation, which takes ties into account:
Here, q is the number of tied groups, and tp is the number of data values in the pth group. The values of S and VAR(S) are used to compute the test statistic Z as follows:
If there are n values xj in the time series, we get as many as N = n (n-1)/2 in the slope estimate Qi. Sen's estimator of the slope is the median of these N values of Qi. The N-values of Q are ranked from the smallest to the largest, and the Sen's estimator is:
The impact of climate variability and change on smallholder livelihoods was investigated using a multiple linear regression model. The different applications of a standardized period between the two datasets were accounted for by gaps in the production crop data. Multiple regression models have been used to study the effects and impacts of climate variability and change on food production (Greene, 2003). Multiple regression equations were used because they allow for the modeling of associations between two or more explanatory factors and a response variable. The multiple regression models are written as follows:
Where; the parameter β0 is the y-intercept, which represents the expected value of Y when each X is zero (0). The other parameters, β1, β2... βp in the multiple regression equation, are sometimes called partial slopes.
Descriptive statistics were used to examine the farmers' adaptation practices. The data from the questionnaire were coded and entered into a computer using the Social Science Statistics Package (SPSS version), which included percentages, charts, averages, and frequencies.
In terms of age distribution, the majority of respondents (33.5 and 30.7%, respectively) belonged to the adult population aged 40–45 years and 46–50 years, with 22 and 14.2% belonging to the 51–55 and 56–60 age groups, respectively (Table 2).
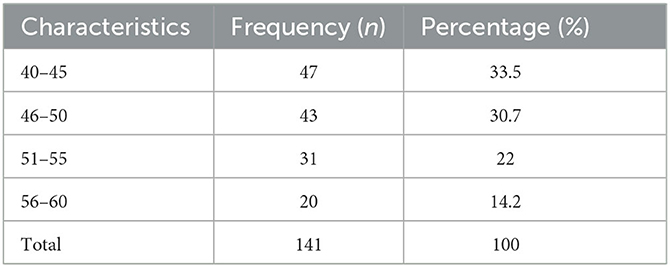
Table 2. Age characteristics of the respondents.
Male headed 79% of the sampled households, while female headed 21%. Women became family heads after their husbands died, and they moved away from their native homes (Table 3).
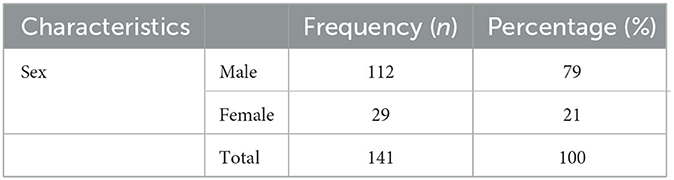
Table 3. Sex characteristics of respondents.
About 30% of respondents said they had finished primary school; 17% had finished high school; and 46.8% of household heads said they had no formal education. As a result, they cannot read or write, and only 6% have completed college. In general, 53% of those polled were literate, while 48% were illiterate (Table 4).
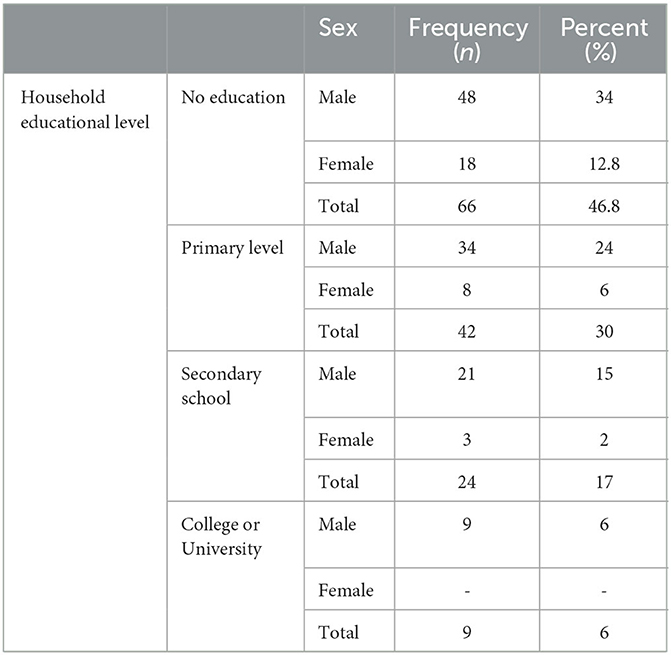
Table 4. The educational level of the respondents.
As one of the most important factors determining the level of smallholder farmers in the study region, land was one of the most important resources for the families in the area. Around 24.8% of the total household respondents have 0.5 ha, 42.6% have 1 ha, 24.8% have 1–1.5 ha, and 7.8% have 2 ha (Table 5).
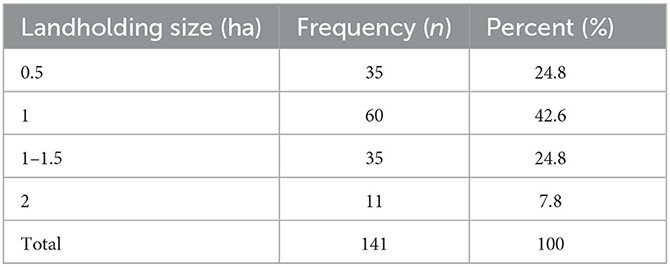
Table 5. Distribution of sample household farmland size.
Crop production has increased by 23.4% among respondents, livestock rearing by 22.7%, and crop and cattle production by 40.4%, and off-farm activities by 13.5% (Table 6).
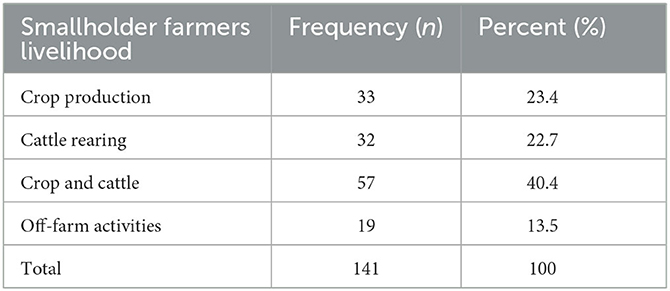
Table 6. Distribution of sample household livelihood.
The computation of onset, end, and length of the growing period (LGP) was performed by following the input format for days of the year for a year's daily precipitation data of 35 (1984–2019) years for rain stations in Bako. Table 7 shows that the minimum onset date was 144 days (May 23–July 26), the maximum onset date was 209 days (July 26–August 26), and the mean, standard deviation, and coefficient of variation of precipitation onset were 152 days, 11.7 days, and 7.7%, respectively. The maximum, minimum, mean, standard deviation (SD), and CV end dates in this study were 324 days (November 2018), 260 days (September 2015), and 293 days (October 2018), representing 15.5 and 5.3%, respectively. The crop was ripe on November 18th and October 18th, so the end date of the maximum and mean rainy days was not favorable. LGP, coefficient of variation (CV) was 14%. The LGP is one of the harvest's maturity indicators. In this study area, the maximum, minimum, mean, standard deviation, and CV with the number of rainy days were 209 days (July 26), 124 days (May 3), and 136 days (May 14), or 17 and 12.6% of seasonal precipitation, respectively.
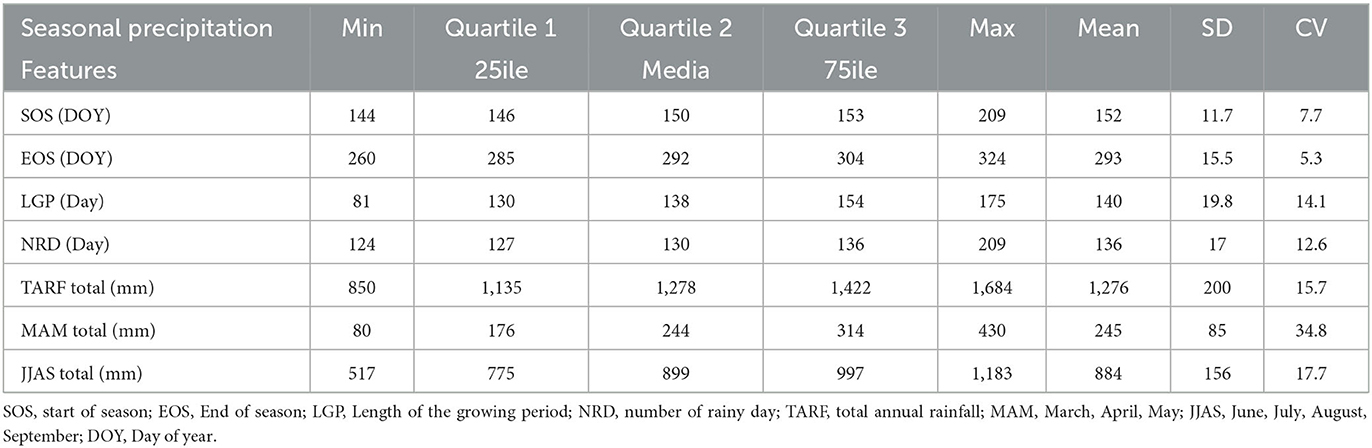
Table 7. Descriptive statistics of important precipitation characteristics at Bako weather station.
The probability of dry spell occurrence for the Bako station was shown for the spring (DOY = 61–150) and summer (DOY = 150–265) seasons. Dry period lengths of 5, 7, 10, 15, and 20 days were considered. Observations of precipitation data revealed that the likelihood of dry spells occurring during the growing season varied from month to month. During the main rainy season (summer), the likelihood of 7, 10, 15, and 20-day dry spells was zero in June, July, August, and September, but it was >0 for a 5-day dry spell. The chance of a 20-day dry spell occurrence was highest from March 1 (61 days) to April 23 (115 days), lowest from April 23 (130 days) to June, July, August, and September 20 (265 days), and highest after the end of September. The dry period lasted 15 days, from March 1 (61 days) to May 8 (130 days), and then dropped to zero from May 8 (130 days) to June, July, August, and September 5 (250 days). The probability of a 10-day dry spell began in March (61) and ended on May 23 (145), with the 7-day dry spell ending on June 23 (160). The probability of dry spells was also shown in percentages: the 5-day dry spell was 100%, the 7-day dry spell was 98%, the 10-day dry spell was 78%, the probability of a 15-day dry spell was 39%, and the probability of dryness within 20 days was around 18%. Summer has a higher probability of dry periods in general (Figure 2).
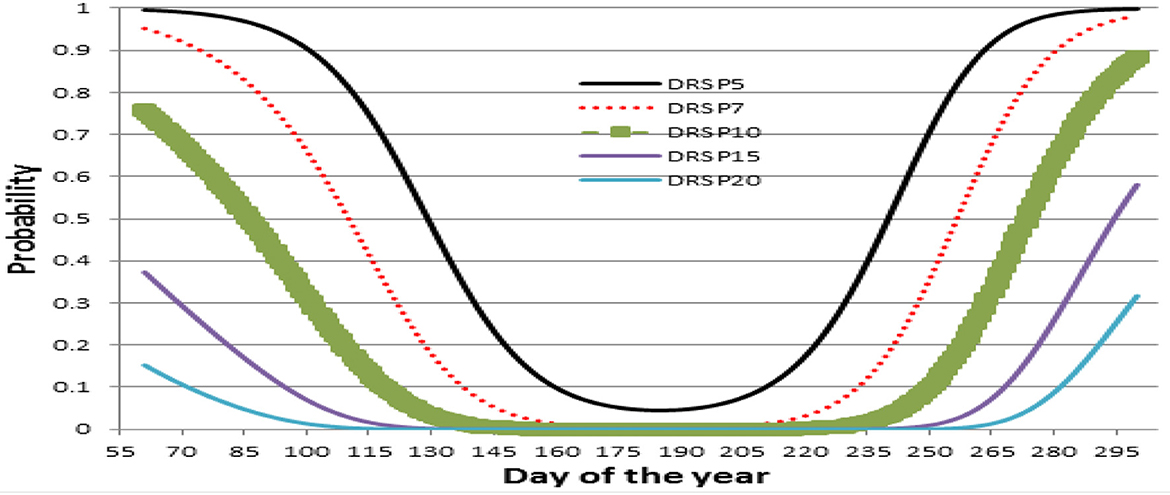
Figure 2. Probability of a dry spell.
For the annual precipitation in the spring, autumn-winter, and summer seasons, the Mann-Kendall trend and Sen's slope analysis were performed. Three months out of the year have significant trend-based rainfall records in the study area. Statistically, total annual rainfall, the summer season, and the autumn season all showed positive trends, with the autumn season being non-significant; spring and winter rainfall both showed negative and decreasing trends and were not significant at 95% in the study area (Table 8).
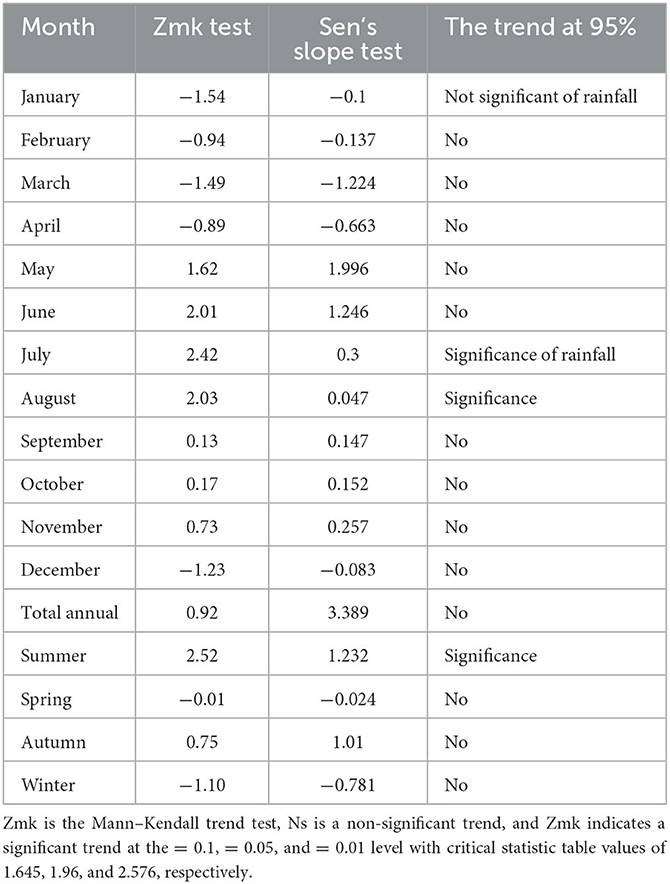
Table 8. Monthly, seasonal, and annual average rainfall of MK trend test results of Bako metrological station (1983–2019).
Furthermore, the majority of respondents agreed that there was variability in rainfall amount and distribution. Unusual dry spells in the summer and spring have become a common occurrence over the last three decades. Furthermore, rainfall is uneven, and the growing season has previously been shortened (Table 9). According to one expert, there has been a shift in the agricultural calendar due to changes in the tin end, onset days, and months of rain, which have reflected their negative outlook for the future, particularly in the agricultural sector.
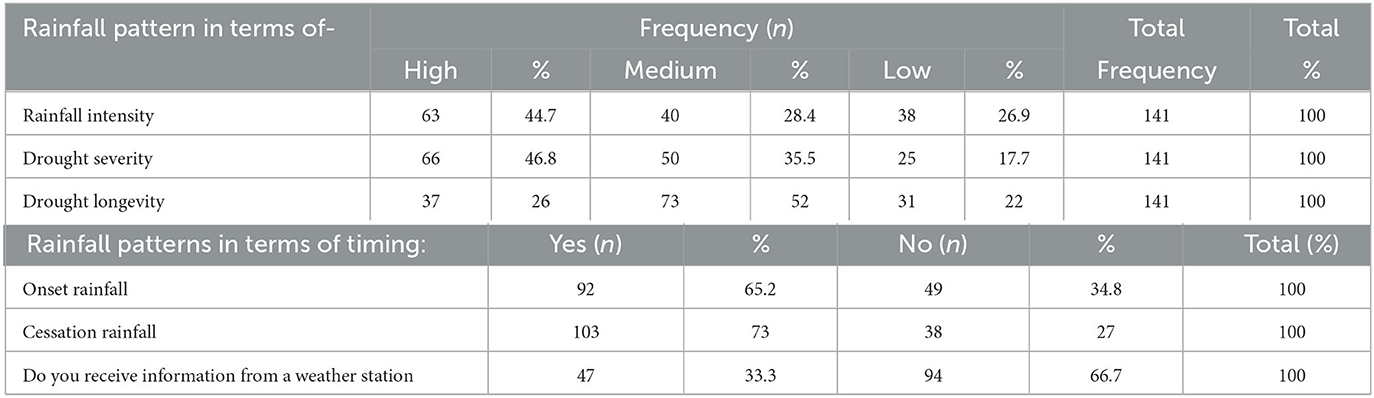
Table 9. Rainfall pattern of the household survey.
According to the households surveyed, the precipitation intensity over the last three decades was 44.7% high, 28.4% medium, and 26.9% low. A household survey also reported precipitation patterns as a function of drought severity and duration (Table 10). About 46.8% were affected by high drought, 35.5% by medium drought, 17.7% by low drought severity, 26% by high longevity, 52% by medium drought, and 22% by drought. The households in the sample were asked to identify the manifestations of precipitation changes over the previous 35 years. Precipitation began late and ended early compared to 35 years ago (Table 6).
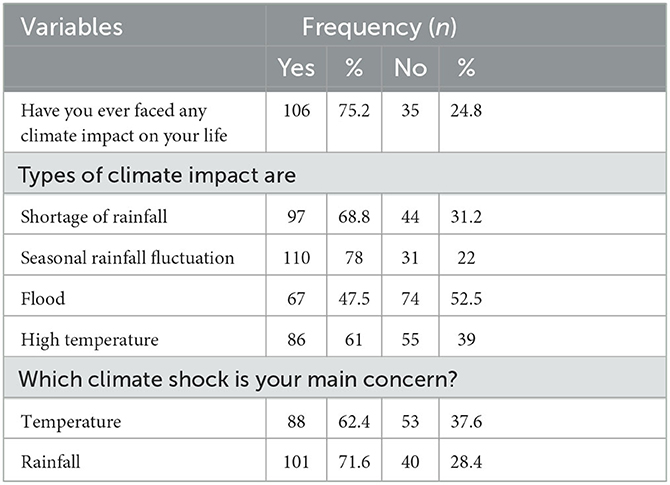
Table 10. Climate-related impact results of household survey.
Approximately 65.2% of the population reported late precipitation, while 34.8% reported no late precipitation. A premature end to the rains affected the livelihoods of ~73% of those polled. These changes in precipitation patterns have a direct impact on crop yields, livestock production, and price fluctuations in agriculture. Because having information about the impact of climate variability and change is critical, the household survey discovered that ~66.7% of households do not have access to weather station data.
Table 11 displays the results of various precipitation and temperature regressions on crop yields and cattle. The correlation coefficients of the major crops (maize and teff) and two climatic variables (rainfall and temperature) revealed that maize (0.363, 0.279), teff (0.148, 0.485), and cattle (−0.273, −0.729) were positively correlated, whereas precipitation and temperature were negatively correlated. If crop yield increases by one precipitation unit and temperature increases by 0.014, maize yield increases by 4.761, 0.008, and teff yield increases by 0.014, 0.008, and 0.637 for teff yield increases by 0.014, 0.008, and 0.637 for teff yield increases by 0.014, 0.008, and 0.637 for teff yield increases by 0.014, 0.008, and 0.637 for teff.
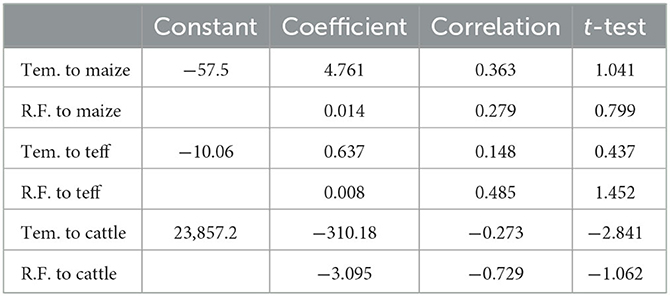
Table 11. Multiple regression analysis of crop production in a year per hectare quintal.
In Ethiopia, precipitation deficits are critical in determining crop and farm animal production. The same holds for the Bako Tibe district's precipitation issue. Approximately 68.8% of respondents stated that insufficient rainfall and uneven distribution during the wet season were the single most important reasons for the acute meals' lack of confidence in the location. Approximately 78% of respondents stated that seasonal precipitation fluctuations have harmed land guidance for summer crop production and the sowing of past-due maturity crops. Summertime rain, on the other hand, becomes overdue in some areas after 1 month. The Bako Tibe district has experienced variations in rainfall variability during plantation crops as well as land guidance at some point during the spring and summer seasons. Approximately 47.8% of respondents said flooding has eroded a large amount of soil from their farms and grazing land in the district. Floods are common among residents of internal valleys, mountain bottoms, and rugged hillsides. Excessive temperatures, according to 61% of respondents, harm crop production, farm animals, and human health. The primary issues of weather extrusion in the location have been precipitation rather than temperature, which means that, according to the family survey results, precipitation is more likely to affect the livelihood of smallholder farmers, followed by ~71.6% of rainfall and 62.4% of temperature.
Climate variability has a significant impact on small farm holder households in the study area. Farmers employed a variety of strategies to mitigate the effects of the climate change risks discussed in the preceding section. However, as the effects of climate change become more severe, smallholder farmers' ability to adapt is deteriorating. Domestic research indicates that some of the negative effects of climate variability can be tolerated. Different modes of practice are very important in combating climate variability if farmers use them effectively. This decision implies that a single strategy was insufficient to adapt to the effects of climate variability, as a combination of many strategies may work better than a single strategy. Approximately 69.5% of the households polled indicated that practice routines were very effective. Effective flexibility procedures have evolved through training from the government and various professionals, but only 36.9% of the families surveyed are trained (Table 12).
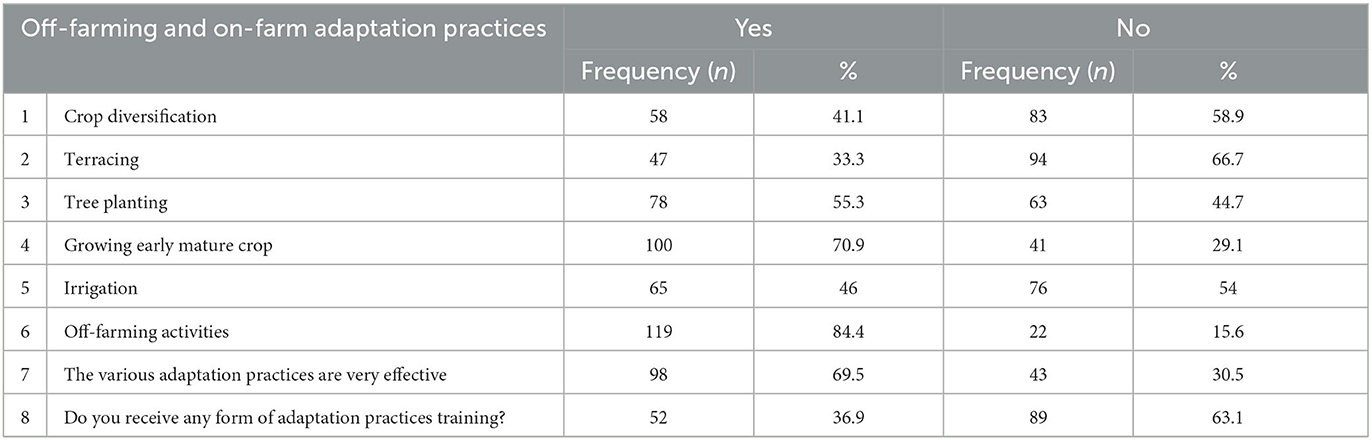
Table 12. Adaptation practices of respondents.
Climate change had a significant negative impact on the livelihoods and food security status of smallholder farmers in a local area of Zimbabwe, leading to food aid, the use of traditional grains and other drought-resistant crops, early planting, multiple planting, barter trade, and livelihood diversification, according to the study. These adaptation strategies were hampered by a lack of markets for agricultural produce, weak institutions, poverty, and significant climate variability (Mushore et al., 2021). Smallholder farmers in Ghana adopt on-farm and off-farm adaptation techniques to deal with ecological and climate changes (especially meteorological droughts, socioeconomic droughts, poor soil fertility, and food shortages). In this area, farmers depend on agriculture and implement on-farm adaptation strategies to mitigate the negative consequences of ecological and climate change, including droughts and floods. Off-farm adaptation practices are used by smallholder farmers to reduce their vulnerability to the negative effects of climatic and ecological change or variability, such as food and livelihood instability (Appiah et al., 2018). Farmers in developing countries have to implement and utilize climate smart agriculture (CSA) practices because they include numerous low-cost farm-based sustainable agricultural land management techniques such as water management, zero or minimum tillage, residue management, and agroforestry, among others. Furthermore, CSA practices mostly involve traditional practices and indigenous knowledge that are widely understood and employed by farmers in handling climatic concerns (Tol, 2020; Baffour-Ata et al., 2021).
The length of a region's growing season is determined by the start and end dates of rainfall in a given year (Abiy et al., 2014). The findings contrast with those of Daniel et al. (2014), who discovered a statistically insignificant increasing trend across all seasons (including on an annual time scale). This study discovered a highly variable but non-significant decreasing trend in spring rainfall over time, in contrast to Alemayehu and Bewket (2017), who discovered a significant decreasing trend in spring rainfall. The monthly rainfall trend and Sen's slope result for January, February, March, April, July, and December were negative and not significant, whereas they were positive and not significant for May, June, August, September, October, and November.
The study area's general socioeconomic position, the agricultural productivity of both crops and cattle, and social issues such as changes in the health of smallholder farmers had all been impacted by the drought's intensity. As a result, the most severe droughts in Ethiopia are typically caused by a failure of summer rainfall to meet agricultural and water resource needs (Kassa, 2015). Respondents stated that they do not plant crops because they cannot predict rainfall as well as they used to, limiting agriculture production and risking their livelihoods (Akinbami et al., 2016).
Rainfall was currently falling 1 month before or after the normal cropping season (Meron, 2012). Given Ethiopia's history of repeated droughts and variability in rainfall, it is critical to conduct long-term trend and variability studies using reliable methods to obtain significant information on what has changed over the last few decades (Daniel et al., 2014). Temperature increases, combined with changes in precipitation because of extreme climate conditions such as dry spells, prolonged droughts, and heat waves, are expected to have a significant impact on crop and livestock productivity (Walthall et al., 2012). Understanding the problem thoroughly is critical because it may lead to the development of effective adaptation and mitigation strategies (Eames et al., 2020).
A Ugandan study found that a number of factors combine to influence the adaptation strategies small farmers choose to employ (Atube et al., 2021). In eastern Ethiopia, small-scale irrigation has allowed smallholder farmers to diversify and intensify their crop output, increasing agricultural production and yields (Dawid et al., 2023). In order to improve their overall adaptation to the effects of climate variability, all responsible entities should strengthen the provision of agricultural extension services by strengthening their climate information system. Additionally, in Ethiopia's lowlands, structural land use dynamics and the related resource tenure insecurity have a greater restricting impact on the tactics than the effects of climate variability (Ofgeha and Abshare, 2021). As a result, the current study's findings support additional research into these contexts, and any approach for development interventions should consider how non-climate components affect local community adaptation and coping. The assessment of this impact is critical for increasing adaptability because it provides evidence-based knowledge about the vulnerabilities and risks that smallholder farmers experience. This knowledge can be used to inform the creation and execution of appropriate adaptation practices and strategies in relation to the unique impact of climate variability on smallholder livelihoods, assisting in the identification of areas that require intervention and support.
In this study, the precipitation in different seasons revealed that there is a lot of fluctuation in both seasons, but it was especially high in the spring. Changes in precipitation variability have a significant impact on crop output in the Bako Tibe tract. Agriculture, on the other hand, relied heavily on rainfall. Because the crop matured in November and October, the crop's end date for the maximum and mean rain days was not ideal. In the primary rainy season (summer), the likelihood of a 7, 10, 15, or 20-day dry spell was zero in June, July, August, and September; however, the probability of a 5-day dry spell was >0. The spring is more likely to have dry spells than the summer. Crop diversification is practiced by 41.1% of respondents in the research region, indicating that some of the effects of climatic variability can be mitigated. According to the study findings, ~58.9% of respondents do not practice crop diversification due to various constraints such as a lack of additional farmland, a lack of funds to purchase a variety of seeds and fertilizers, and so on. However, 46% of respondents used irrigation to combat climate variability on their property caused by unpredictable rainfall by growing vegetables. This study's findings are very important for local governments to tackle factors associated with climate variability by using different strategic activities to ensure small farmers livelihoods. Further researchers will also utilize this finding as a base line for further information. Financial issues, a lack of time to cover all “kebeles” in the district, and a lack of complete information were among the constraints. Data collection is also difficult due to the dispersed settlement of families and communication infrastructure, the respondents' lack of awareness of the goals of the research, particularly households, and the biased and distorted information provided by the respondents.
The original contributions presented in the study are included in the article/supplementary material, further inquiries can be directed to the corresponding author.
LH: Writing—review and editing, Conceptualization, Methodology, and Project administration. TY: Writing—review and editing, Conceptualization, Methodology, and Formal analysis. Both authors read and approved the manuscript.
Wollega University's Research and Innovation Technology Department provided funding for this project.
The authors would like to express their gratitude to Wollega University for their financial assistance. The authors would also like to express their gratitude to the Bako Tibe district's data collectors, supervisors, and study participants.
The authors declare that the research was conducted in the absence of any commercial or financial relationships that could be construed as a potential conflict of interest.
All claims expressed in this article are solely those of the authors and do not necessarily represent those of their affiliated organizations, or those of the publisher, the editors and the reviewers. Any product that may be evaluated in this article, or claim that may be made by its manufacturer, is not guaranteed or endorsed by the publisher.
Abayineh, A., and Belay, S. (2017). Determinants of smallholder farmers' decision to adopt adaptation options to climate change and variability in the Muger Sub-basin of the Upper Blue Nile basin of Ethiopia. Agric. Food Secuir. 6, 1–20. doi: 10.1186/s40066-017-0144-2
Abiy, G., Quraishi, S., and Girma, M. (2014). Analysis of seasonal rainfall variability for agricultural water resource management in the southern region, Ethiopia. J. Nat. Sci. Res. 4, 56–79.
Addisu, S., Selassie, Y. G., Fissha, G., and Gedif, B. (2015). Time series trend analysis of temperature and rainfall in lake Tana Sub-basin, Ethiopia. Environ. Syst. Res. 4, 1–12. doi: 10.1186/s40068-015-0051-0
Adger, W. N. (2000). Theory and Practice in Assessing Vulnerability to Climate Change and Facilitating Adaptation. vol 47, 3.
Akinbami, C. A. O., Ifeanyi-Obi, C., Appiah, D. O., and Kabo-Bah, A. T. (2016). Towards sustainable adaptation to climate change: the role of indigenous knowledge in Nigeria and Ghana. Afr. J. Sustain. Dev. 6, 189–214.
Alemayehu, A., and Bewket, W. (2017). Local spatiotemporal variability and trends in rainfall and temperature in the central highlands of Ethiopia. Geogr. Ann. A: Phys. Geogr. 99, 85–101. doi: 10.1080/04353676.2017.1289460
Appiah, O. D., Akondoh, A. C., Tabiri, R. K., and Donkor, A. A. (2018). Smallholder farmers' insight on climate change in rural Ghana. Cogent Food Agric. 4, 1436211. doi: 10.1080/23311932.2018.1436211
Arpita, P., Netrananda, S., Swadhin, B., Takahiro, S., Limonlisa, S., Ram, A., et al. (2019). Impact of climate variability on crop yield in Kalahandi, Bolangir, and Koraput Districts of Odisha, India. Climate. 7, 126. doi: 10.3390/cli7110126
Arragaw, A., and Woldeamlak, B. (2016). Local climate variability and crop production in the central highlands of Ethiopia. Environ. Dev. 19, 3648. doi: 10.1016/j.envdev.2016.06.002
Atube, F., Malinga, G. M., Nyeko, M., Okello, D. M., Alarakol, S. P., and Okello-Uma, I. (2021). Determinants of smallholder farmers' adaptation strategies to the effects of climate change: evidence from northern Uganda. Agric. Food Secur. 10, 1–14. doi: 10.1186/s40066-020-00279-1
Baffour-Ata, F., Antwi-Agyei, P., Apawu, G. O., Nkiaka, E., Amoah, E. A., Akorli, R., et al. (2021). Using traditional agroecological knowledge to adapt to climate change and variability in the Upper East Region of Ghana. Environ. Chall. 4, 100205. doi: 10.1016/j.envc.2021.100205
CSA (2010). The Population and Housing Census of Ethiopia Resulted in the Oromia Region. Part Statistical Report on Population Size and Characteristics. Ethiopia: CSA.
CSA (2013). Population Projection of Ethiopia for All Regions at the District Level From 2014 to 2017. Addis Ababa: The Federal Democratic Republic of Ethiopia.
Daniel, M., Woldeamlak, B., and Lal, R. (2014). Recent spatiotemporal temperature and rainfall variability and trends over the upper Blue Nile river basin, Ethiopia. Int. J. Climatology. 34, 2278–2292. doi: 10.1002/joc.3837
Dawid, I., Haji, J., and Aman, M. (2023). Evaluating farm household resilience and perceptions of the role of small-scale irrigation in improving adaptability to climate change stress: evidence from eastern Ethiopia. Front. Clim. 5, 1193910. doi: 10.3389/fclim.2023.1193910
Eames, C. W., Hunter, P. A., and Vaioleti, T. M. (2020). Climate change education in Tongan secondary schools (Doctoral dissertation). The University of Waikato, Hamilton, New Zealand. Retrieved from: https://hdl.handle.net/10289/14011 (accessed 2020).
EPCC (2015). The First Assessment Report. Working Group II Agriculture and Food Security. Ethiopian Academy of Sciences, Ethiopia ministry of Agriculture.
Feyissa, G., Zeleke, G., Gebremariam, E., and Bewket, W. (2018). GIS-based quantification and mapping of climate change vulnerability hotspots in Addis Ababa. Geo-environ. Disast. 5, 14. doi: 10.1186/s40677-018-0106-4
Gebrehiwot, T., and van der Veen, A. (2013). Climate change vulnerability in Ethiopia: disaggregation of Tigray region. J. East. Afr. Stud. 7, 607–629. doi: 10.1080/17531055.2013.817162
Gowhar, M., Shruti, K., Abhijeet, A., Pankaj, K., Suraj Kumar, S., Majid, F., et al. (2022). Assessing the Yield of Wheat Using Satellite Remote Sensing-Based Machine Learning Algorithms and Simulation ModelingGreene, W. H., 2003. Econometric Analysis, 5th Edn. Prentice-Hall, Upper Saddle River, NJ: Prentice-Hall, 1026.
Greene, W. H. (2003). Econometric Analysis, 5th Edn. Prentice-Hall, Upper Saddle River, NJ: Prentice-Hall, 1026.
Hare, F. K. (1983). Climate and Desertification: A Revised Analysis (WMO-UNDP) WCP-44. Geneva: World Meteorological Organization (WMO).
Karaburun, A., Demirci, A., and Kara, F. (2011). Analysis of spatially distributed annual, seasonal, and monthly temperatures in Istanbul from 1975 to 2006. World Appl. Sci. J. 12, 1662–1675.
Kassa, F. (2015). Ethiopian seasonal rainfall variability and prediction using canonical correlation analysis (CCA). Earth Sci. 4, 112–119. doi: 10.11648/j.earth.20150403.14
Kendall, M. (2015). Trend analysis of Pahang River using non-parametric analysis: Mann Kendall's trend test. Malays. J. Anal. Sci. 19, 1327–1334
Kothari, C. R. (2004). Research Methodology Methods and Techniques. 2nd Edn. Jaipur: New Age International Publishers; Universities of Rajastan.
Mann, H. B. (1945). Nonparametric tests against trend. Econ. J. Econom. Soc. 13, 245–259.doi: 10.2307/1907187
Mekonnen, Z., Woldeamanuel, T., and Kassa, H. (2019). Socio-ecological vulnerability to climate change/variability in central rift valley, Ethiopia. Adv. Climate Change Res. 10, 9–20. doi: 10.1016/j.accre.2019.03.002
Meron, A. (2012). The impact of climate change and adaptation through agroecological farming practices: a case study of the Konso area in Ethiopia (MSc Thesis). Swedish University of Agricultural Sciences, Sweden.
Mubiru, D. N., Radeny, M., Kyazze, F. B., Zziwa, A., Lwasa, J., Kinyangi, J., et al. (2018). Climate trends, risks and coping strategies in smallholder farming systems in Uganda. Clim. Risk Manag. 22, 4–21 doi: 10.1016/j.crm.2018.08.004
Mushore, T. D., Mhizha, T., Manjowe, M., Mashawi, L., Matandirotya, E., Mashonjowa, E., et al. (2021). Climate change adaptation and mitigation strategies for smallholder farmers: a case of Nyanga District in Zimbabwe. Front. Clim. 3, 676495. doi: 10.3389/fclim.2021.676495
Netrananda, S., Atul, S., Swadhin, B., Takahiro, S., Sridhara, N., Limonlisa, S., et al. (2020). Impact of Indo-Pacific climate variability on rice productivity in Bihar, India. Sustainability 12, 7023. doi: 10.3390/su12177023
NMA (2001). Initial National Communication of Ethiopia to the United Nations Framework Convention on Climate Change (UNFCCC). Addis Ababa: NMA, 110.
NPC (2016). Growth and TransformationPlan II (2015/20162019/2020). Main Text, Volume1, Addis Ababa. Available online at: http://dagethiopia.org/new/images/DAG_DOCS/GTP2_English_Translation_Final_June_21_2016.pdf (accessed September 12, 2018).
Ochieng, J., Kirimi, L., and Makau, J. (2017). Adapting to climate variability and change in rural Kenya: farmer perceptions, strategies, and climate trends. Nat. Res. Forum 41, 195–208. doi: 10.1111/1477-8947.12111
Ofgeha, G. Y., and Abshare, M. W. (2021). Local adaptation and coping strategies to global environmental changes: portraying agroecology beyond production functions in southwestern Ethiopia. PLoS ONE 16, e0255813. doi: 10.1371/journal.pone.0255813
Popoola, O. O., Monde, N., and Yusuf, S. F. G. (2018). Perceptions of climate change impacts and adaptation measures used by crop smallholder farmers in Amathole district municipality, Eastern Cape province, South Africa. Geo J. 83, 1205–1221. doi: 10.1007/s10708-017-9829-0
Reddy, G. S., Bhaskar, S. R., Purohit, R. C., and Chittora, A. K. (2008). Markov chain model probability of dry, wet weeks and statistical analysis of weekly rainfall for agricultural planning at Bangalore. Karnataka J. Agric. Sci. 21, 12–16.
Reddy, S. J. (1990). Methodology: agro-climatic analogue technique and applications as relevant to dry land agriculture. Agro climatological Series Eth 86/021WMO/UNDP/NMSA, Addis Ababa, Ethiopia. 60.
Selvaraju, R. (2012). Climate Risk Assessment and Management in Agriculture. Building resilience for adaptation to climate change in the agriculture sector. 71.
Stern, R. D., and Cooper, P. J. M. (2011). Assessing climate risk and climate change using rainfall data–a case study from Zambia. Experim. Agric. 47, 241–266. doi: 10.1017/S0014479711000081
Tesfahunegn, G. B., Mekonen, K., and Tekle, A. (2016). Farmers' perception on causes, indicators, and determinants of climate change in northern Ethiopia: implication for developing adaptation strategies. Appl. Geogr. 73, 1–12. doi: 10.1016/j.apgeog.2016.05.009
Tessema, Y. A., Aweke, C. S., and Endris, G. S. (2013). Understanding the process of adaptation to climate change by smallholder farmers: the case of East Hararghe zone, Ethiopia. Agric. Food Econ. 1, 13. doi: 10.1186/2193-7532-1-13
Tol, R. S. (2020). The Economic Impacts of Climate Change. Review of Environmental Economics and Policy.
Wagesho, N., Goel, N., and Jain, M. (2013). Temporal and spatial variability of annual and seasonal rainfall over Ethiopia. Hydrol. Sci. J. 58, 354–373. doi: 10.1080/02626667.2012.754543
Walthall, C. L., Hatfield, P., Backlund, L., Lengnick, E., Marshall, M., Walsh, M., et al. (2012). Climate Change and Agriculture in the United States: Effects and Adaptation. Washington, DC: USDA Technical Bulletin.
Wang, X. L., Wen, Q. H., and Wu, Y. (2007). Penalized maximal t test for detecting undocumented mean change in climate data series. J. Appl. Meteorol. Climatol. 46, 916–931. doi: 10.1175/JAM2504.1
Woodward, A., Smith, K. R., Campbell- Lendrum, D., Chadee, D. D., Honda, Y., Liu, Q., et al. (2014). Climate change and health: on the latest IPCC report. The Lancet. 383, 1185–1189. doi: 10.1016/S0140-6736(14)60576-6
World Bank (2010). Economics of Adaptation to Climate Change: Ethiopia. Washington, DC: World Bank. Available online at: https://openknowledge.worldbank.org/handle/10986/12504 (accessed June 4, 2020).
Keywords: livelihood, climate variability, smallholder farmer, Bako Tibe, Ethiopia
Citation: Hordofa L and Yazew T (2023) Evaluating impacts of climate variability on smallholder livelihoods and adaptation practices in the western Shewa Zone, Oromia, Ethiopia. Front. Clim. 5:1237144. doi: 10.3389/fclim.2023.1237144
Received: 08 June 2023; Accepted: 05 September 2023;
Published: 22 September 2023.
Edited by:
Jyostna Devi Mura, USDA-ARS, United StatesReviewed by:
Netrananda Sahu, University of Delhi, IndiaCopyright © 2023 Hordofa and Yazew. This is an open-access article distributed under the terms of the Creative Commons Attribution License (CC BY). The use, distribution or reproduction in other forums is permitted, provided the original author(s) and the copyright owner(s) are credited and that the original publication in this journal is cited, in accordance with accepted academic practice. No use, distribution or reproduction is permitted which does not comply with these terms.
*Correspondence: Tamiru Yazew, dGFtaXJ1eWF6ZXcyMDEyQGdtYWlsLmNvbQ==
Disclaimer: All claims expressed in this article are solely those of the authors and do not necessarily represent those of their affiliated organizations, or those of the publisher, the editors and the reviewers. Any product that may be evaluated in this article or claim that may be made by its manufacturer is not guaranteed or endorsed by the publisher.
Research integrity at Frontiers
Learn more about the work of our research integrity team to safeguard the quality of each article we publish.