
94% of researchers rate our articles as excellent or good
Learn more about the work of our research integrity team to safeguard the quality of each article we publish.
Find out more
ORIGINAL RESEARCH article
Front. Clim. , 28 September 2023
Sec. Climate Adaptation
Volume 5 - 2023 | https://doi.org/10.3389/fclim.2023.1235886
This article is part of the Research Topic Advancing Sustainability, Battling Climate Change View all 6 articles
 Francesca Peroni1*
 Daniele Codato1
 Luca Buscemi2Marco Cibrario3
 Salvatore Eugenio Pappalardo1
 Massimo De Marchi1
Nature-based solutions (NBSs) are considered essential measures to face climate change in cities. Riparian ecosystems are often undervalued as NBSs even if they represent an “already plugged-in” ecosystem service provider. However, applied research on urban riparian ecosystems is scarce. To fill the gap, this study frames the role of these ecosystems as a frontline mitigation and adaptation strategy by (i) investigating how urban riparian ecosystems experienced a process of urbanization from World War II until today in Padua (Italy), (ii) estimating how effective was carbon sequestration, and (iii) assessing how an afforestation process might contribute to mitigation scenarios. Land use/land cover changes are first mapped with high-resolution aerial images and, by using InVEST models, carbon sequestration is estimated. Results highlight that impervious surfaces notably increased along these ecosystems; hence, carbon sequestration was negative (−928 Mg/C). The future scenario (2022–2050) indicates an increase of carbon stocks (+4,329.95 Mg/C), giving a contribution toward city carbon neutrality. Results suggest that, in the recent past, the urban management and policies did not provide clear and well-defined planning of these areas. On the contrary, at present, urban riparian ecosystems might represent already existing multi-functional NBSs to be restored and enhanced within cities for climate-resilient planning and for increasing the life quality of city dwellers. Finally, our methodology provides a replicable spatial database for supporting urban planning policies.
In the last decade, urban green infrastructures and nature-based solutions (NBSs) are considered as strategic alternatives to contrast the ongoing urbanization of cities, to restore lost urban Ecosystem Services (ESs), and for climate protection, adaptation, and mitigation (European Commission, 2015; Dushkova and Haase, 2020). To contrast the negative effects of urban development on ES, satisfactory and high-quality NBSs should be available to dwellers. Hence, different types of urban green spaces can be implemented or designed in urban areas: public parks, gardens, semi-natural and natural pockets, tree-lined roads, residential gardens, urban agriculture, and urban forests (Pristeri et al., 2021).
Among the existing green spaces, urban riparian ecosystems are “forgotten” NBSs common in several cities worldwide, offering unique ES-raising resiliency to rapid development and climate change (Gkiatas et al., 2021). However, few studies investigated their strategic role as NBS in urban areas and cities; scientific literature is mainly focused on the water quality, hydraulic risk, restoration, and stream daylighting of these systems (Nava-López et al., 2016; Khirfan et al., 2020; McEwen et al., 2020). Riparian vegetation systems are important to thermoregulate local urban microclimates by evapotranspiration processes as well as by shading with tree canopies (Chen et al., 1999); they offer continuous services on water depuration and runoff regulation (Zhao et al., 2019). These areas are also of paramount importance as habitats for animal taxa, such as birds, reptiles, and amphibians (Naiman et al., 2005). Moreover, different sociocultural ESs are provided by these ecosystems, such as increasing recreation opportunities for outdoor activities and supplying leisure places, as well as environmental ES, for instance, temperature mitigation (Völker et al., 2013; Tuofu et al., 2021; Peroni et al., 2022; Todeschi et al., 2022; Pappalardo et al., 2023).
It is important to highlight how riparian areas increase the esthetic values of urban settlements, besides the health and well-being of citizens, such as reductions in anxiety and stress, or as noise barrier (Völker and Kistemann, 2011; Vollmer et al., 2015).
However, urban riparian areas are often forgotten, abandoned, undervalued, underutilized, or strongly degraded. Urbanization processes frequently seal vegetated soils to build new infrastructures. Also, social connectivity, which refers to the “communication and movement of people, goods, ideas, and culture along and across rivers,” is jeopardized by making interactions among rivers, canals, and urban ecosystems affected by several anthropogenic processes creating physical and cultural barriers (Kondolf and Pinto, 2017). In addition, the management of riparian ecosystems in an urban context can be at the present complex as, in the recent past, many streams and rivers were buried inside cities or they were canalized, narrowed, and bank-reinforced (Eden and Tunstall, 2016). As a consequence, in North American and European cities, many stream channels and their associated riparian ecosystems were lost or completely modified (Petts and Amoros, 1996; Napieralski and Carvalhaes, 2016). Most recently, many scientific literature works have focused on stream daylighting, which refers to the practice of “opening up buried watercourses and restoring them to more natural conditions” (Wild et al., 2011). This technique aims to restore lost ES in urban areas, following the NBS concept (Khirfan et al., 2021).
In this framework, the European Union is developing the concept of green infrastructures that embraces both the ecological perspective as well as the social dimension. Indeed, according to the EU Strategy on Green Infrastructures, it is considered a “network of green (land) and blue (water) spaces that can improve environmental conditions and therefore citizens’ health and quality of life” (European Commission, 2013).
Finally, it is worth noting to highlight that at the EU and international level, regulations to protect riparian ecosystems, for example, the EU Green Deal and the UN Decade on Ecosystem Restoration, are limited (European Commission, 2019; United Nations, 2019; Urbanič et al., 2022). The European Commission in June 2022 proposed the Nature Restoration Law, in which there is an important focus on rivers, wetlands, and lakes. However, at the urban level, strategies and measures to protect or restore these important urban ecosystems are absent (European Commission, 2022b).
According to Naiman et al. (2005), riparian ecosystems are a complex of vegetation units along the river network that is functionally related to the other components of the fluvial system and surrounding area. However, in urban areas, the Land Use/Land Cover (LULC) of riparian ecosystems is highly differentiated and mixed, including grassland vegetation, agricultural areas, walking and cycle paths, and built-up areas. Among such LULC urban features, vegetation systems represented by grassland, shrubs, and urban woodlands are fundamental elements for improving the quality of goods and services provided by riparian ecosystems.
One of the main relevant ES provided by urban riparian ecosystems is the role they play in terms of carbon sequestration service and carbon sinks for long-term storage (Sutfin et al., 2016).
Carbon sequestration is the process of capturing and storing carbon that would otherwise be emitted to or remain in the atmosphere. Vegetation systems convert CO2 from the atmosphere into organic carbon through photosynthesis by storing it as an amount of biomass (McPherson, 1998). Moreover, along with riparian vegetation, agricultural areas and soils also represent important carbon sinks (Smith, 2004; Lal et al., 2015).
Carbon sequestration is of paramount importance to mitigate climate change. The emission of greenhouse gases by human activities, such as land use changes, deforestation, agriculture, and fossil fuel combustion, contributes to the increase in global temperature (Lal, 2007). As reported by IPCC (2021), since 2011 “concentrations have continued to increase in the atmosphere, reaching annual averages of 410 ppm for CO2.” Consequently, there is a strong interest in stabilizing and reducing the atmospheric concentrations of CO2 to mitigate climate change. Hence, safeguarding urban riparian ecosystems might be a useful strategy to increase carbon sequestration capacity and carbon sinks as a contribution to climate change mitigation. In this context, afforestation/reforestation are considered paramount strategies for greenhouse gas sinks (Griscom et al., 2017). Also in cities, they are considered as important measures to mitigate climate change (Ariluoma et al., 2021); however, they are implemented not only for their mitigation contributions but also for the multiple ESs that they could provide for citizens as adaptation strategies. Indeed, as highlighted by scientific literature, carbon sequestration of urban green is often lower than emissions of cities (Velasco et al., 2016), hence reforestation/afforestation in cities could be adopted as a complementary strategy, both for mitigation and adaptation.
The present study is framed within the riparian ecosystems established along the rivers and canals of the city of Padua in Italy (Figure 1). The general aim of the study is to investigate the role of the urban riparian ecosystem as a frontline strategy to contrast climate change already available in different modern cities by analyzing one of its main worthy ES, the carbon sequestration service.
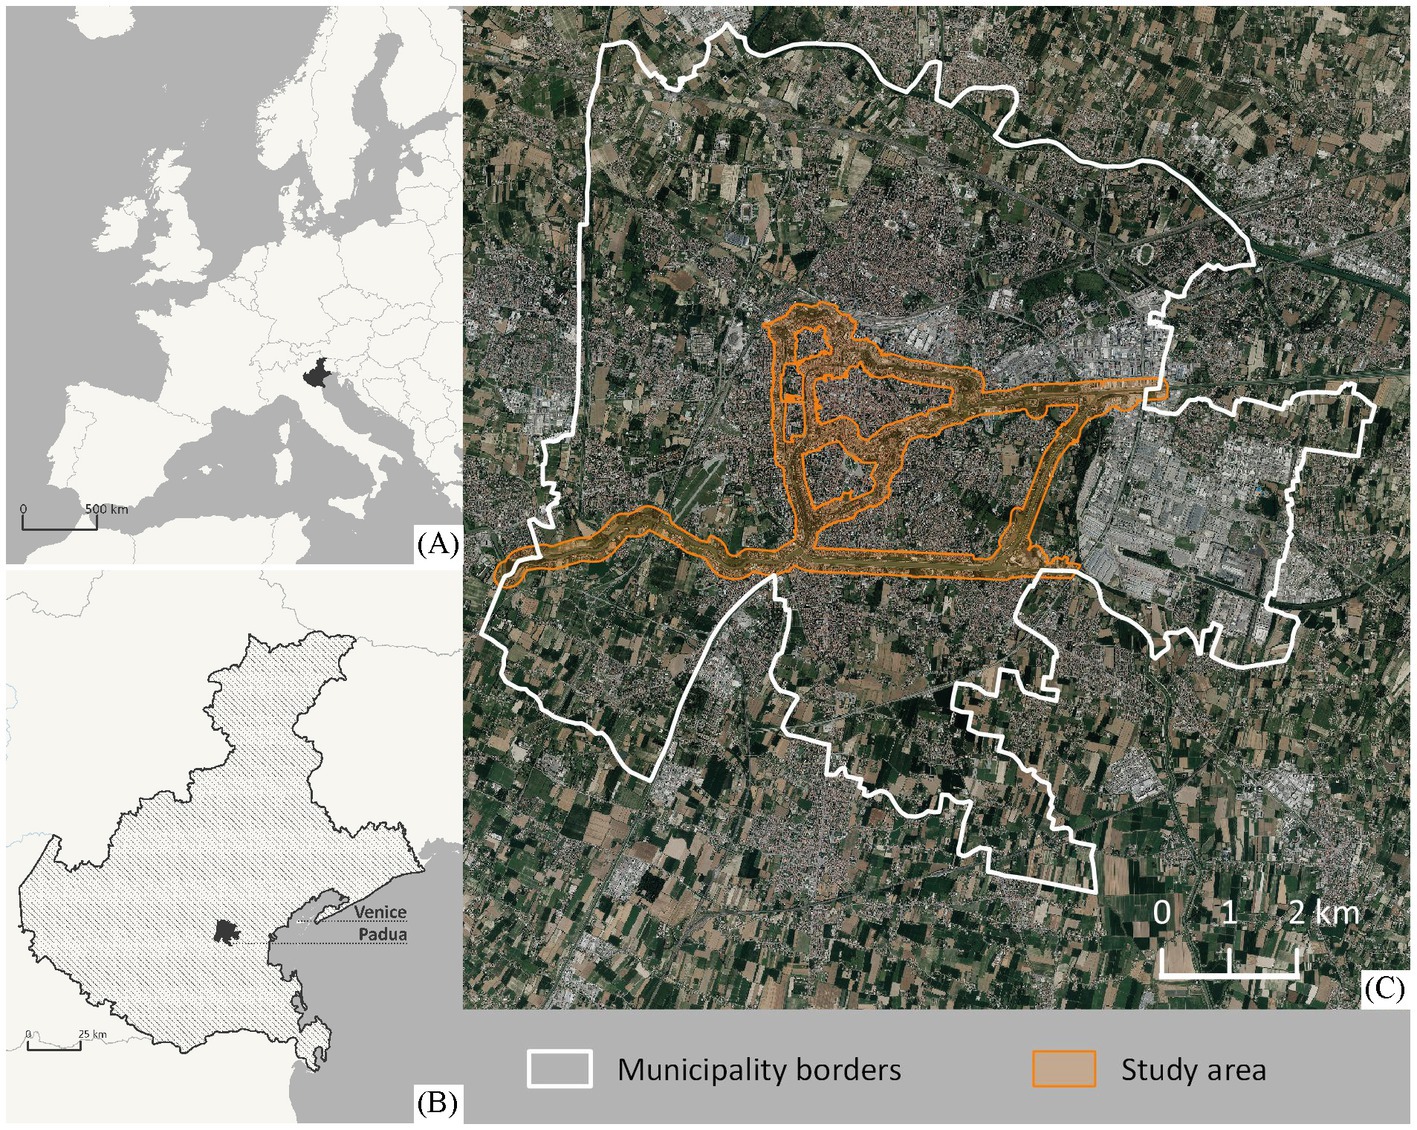
Figure 1. Geographical framework of the city of Padua. (A) The Veneto Region in Italy; (B) the city of Padua; (C) the city of Padua (white) and the study area (orange).
The specific objectives are (i) investigating how urban riparian ecosystems experienced a process of urbanization from World War II until today by mapping LULC changes in 3 specific years (1955, 1981, and 2018); (ii) estimating how carbon sequestration was effective during these decades by mapping and estimating carbon storage in the same years and assessing carbon sequestration from1955 to 2018; (iii) assessing how an afforestation process might contribute to relevant mitigation scenarios toward carbon-neutral cities by performing an afforestation and carbon sequestration future scenario in the period 2022–2050; and (iv) highlighting possible guidelines and recommendations both for urban planning and further applied research for riparian ecosystem restoration and enhancement.
Our case study involves the city of Padua. It is a city located in the Veneto Region, in the North-East of Italy, about 20 km from the Venice Lagoon (Figure 1). The municipality area covers 93 km2 with a resident population of 208,350 inhabitants (Comune di Padova, 2021). Padua for its dimension, population, and urban fabric shares many characteristics with other cities in Europe: it is a medium-sized urban settlement, developed around two rivers (Bacchiglione and Brenta rivers), with a medieval city center and suburban agricultural areas.
The water system of Padua is very complex and it has influenced its territory and its foundation by Romans (De Biaso Calimani, 1996). More specifically, the Brenta river flows from the west to the east of the north border of Padua municipality, whereas the Bacchiglione river moves inside the city center (Supplementary Figure S1). Moreover, over the centuries, the Bacchiglione river was strongly modified by canalization and it was redirected out of the Venetian Lagoon to protect the city against floods and enemies (Comune di Padova, 2004). It is also important to highlight that in the XVI Century, the Venetians, who dominated the city, built the ancient walls to defend the Padua settlement. As a consequence, the Bacchiglione river still flows around these Venetian walls. However, after the Second World War, different segments of the inner channel network were buried and part of the ancient walls were demolished to make space for streets. In addition, due to demographic growth and the economic and industrial development of the city, urban land use expanded beyond the historic center of Padua. New districts grew up north of the railway line and south of the Scaricatore channel, and a large industrial area was built east of the city (Peroni et al., 2019; Pristeri et al., 2020, 2021).
At present, Padua policymakers aim to enhance the city through the New Urban Plan (Piano degli Interventi) to seek more sustainable urban management and planning (Comune di Padova, 2020). The plan went into effect in late summer 2022. By following the 2017 Veneto Region law (Regione del Veneto, 2017), some of the main objectives of the plan are the urban regeneration, the limitation of soil sealing, and the densification of urbanized areas (Stefano Boeri Architetti, 2021). Moreover, a new Municipal Green Plan was designed and approved in February 2022. It is a planning tool, complementary to local urban planning, containing a strategic vision of urban and peri-urban public green areas in the medium–long term (Comune di Padova, 2022). This plan, unlike the New Urban Plan, is not binding.
The study area of this research is cartographically defined by the inner canals of the Bacchiglione river and the Venetian walls system; it covers an area of 8.76 km2, which represents 9.4% of the whole municipal area of Padua (Figure 1). In more detail, a buffer of 300 m from the river course is identified for the analyses. This buffer is pinpointed following an Italian national law of 1985, later incorporated into the 2004 Italian national law named Cultural Heritage and Landscape Code, that subjects rivers, streams, and watercourses and their banks to a landscape constraint for a range of 150 meters each side (Repubblica Italiana, 1985, 2004). In the study, this buffer is maintained also for the analysis of the Venetian walls. It is important to highlight that this law is not a limitation for new buildings and infrastructures, by excluding inner cities and urban areas from the constraints. As a consequence, both the historic center of Padua and the majority of urban areas outside the Venetian walls were not considered in the 1985 legislation (Repubblica Italiana, 1985). In general, the law is not establishing a non-building constraint, by obtaining building permission after authorization from the Regional Board for Cultural Heritage and Preservation. In addition, the following law of 2004, enacted almost 20 years later, does not take into account these important ecosystems by introducing more binding legislation (Repubblica Italiana, 2004).
The methodology is composed of three main phases: (i) multitemporal spatial analyses of LULC changes performed in an open-source GIS environment, (ii) analyses of carbon storage and sequestration related to LULC changes, performed with the Carbon Storage and Sequestration model of the InVEST software (Natural Capital Project, 2021), and (iii) development of a future scenario of carbon stock and sequestration by simulating new tree plantations in selected areas of the study area.
First, we conducted extensive research on available datasets and aerial images for the city of Padua, in particular, by considering the time span and spatial resolution suitable to achieve the aims of the study. During this phase, public data and aerial images were selected and used for the photo-interpretation of the images to produce a detailed LULC dataset for the study area at a 1:1000 nominal scale. The list of the data used in the analysis and their sources is presented in Supplementary Material (Supplementary Table S1). We tried to cover the widest possible time span by selecting the most recent available orthophotos (2018) and going back to the first available aerial images (GAI flight, 1954–55), with a suitable spatial resolution. Moreover, we selected suitable aerial images located in the middle of this 63-year time range (1981). In the Supplementary Materials, we show the resolution of the three aerial images (Supplementary Figures 2, 3).
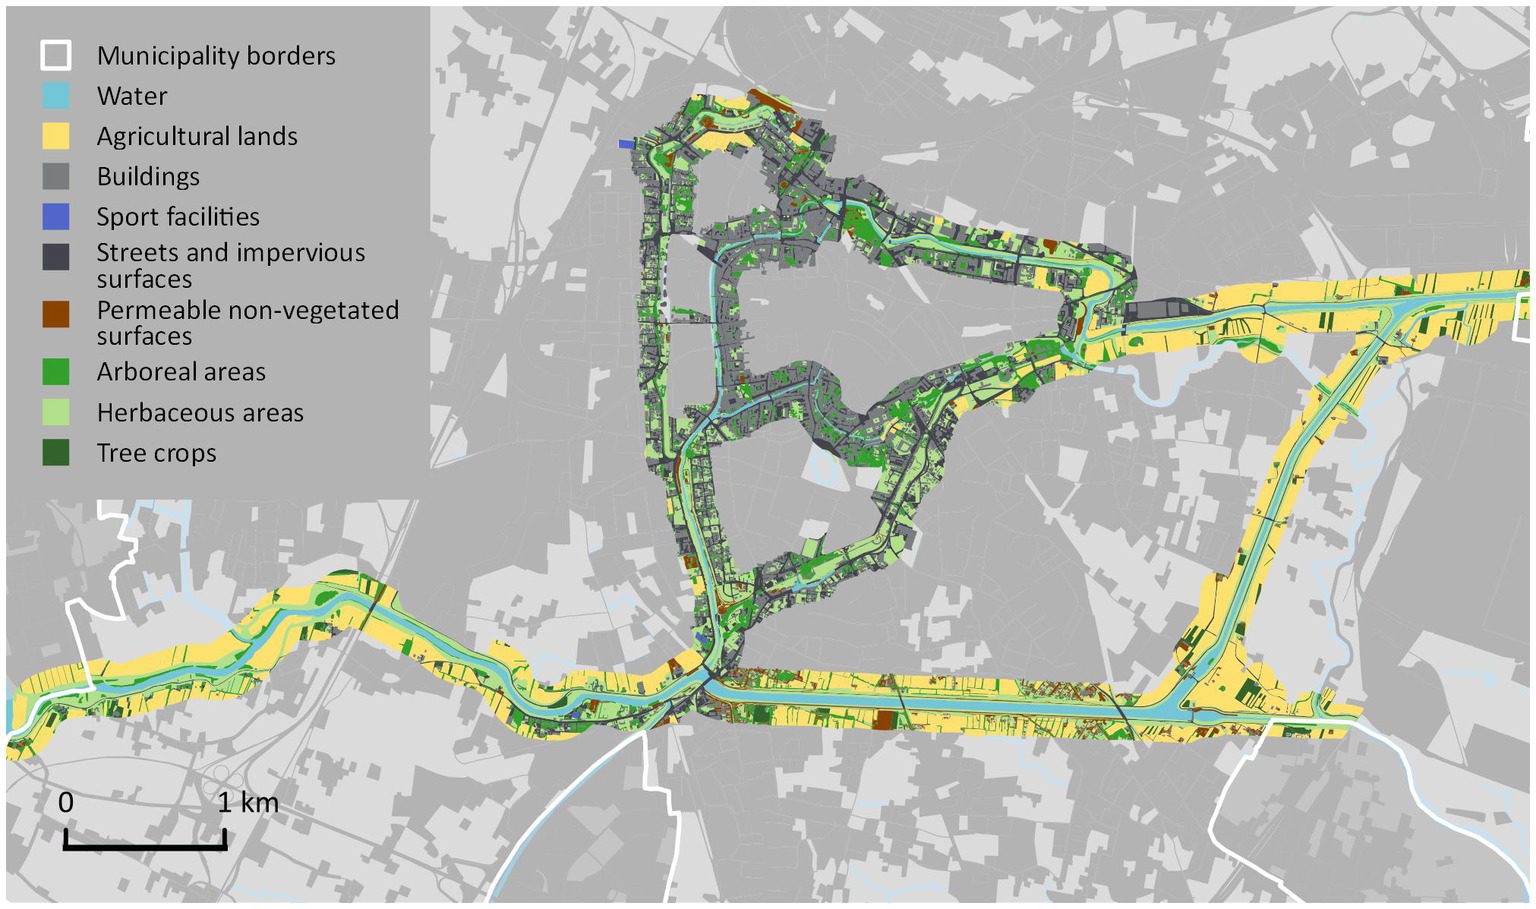
Figure 2. Land use classifications on 9 classes in the year 1955.
The process of photo-interpretation was developed by taking as a reference the work of Valera Lozano et al. (2019). Hence, the steps are as follows: (i) the study area shapefile was created by producing a 150 m buffer around the polygonal spatial datasets of rivers, channels, and historical walls of Padua provided by the Veneto Region; (ii) the aerial images of 1955 and 1981 were georeferenced, using as reference the 2018 orthophotos (already georeferenced by the Veneto Region) and selecting the same Coordinate Reference System (the Gauss Boaga Monte Mario, Italy zone 1, EPSG 3003 code); (iii) the visual photo-interpretation of the images were developed, starting with the analysis of the 2018 image and then with the 1981 and 1955 images. Finally, a vector LULC layer for each year was created. The process of photo-interpretation involves the recognition of objects and homogeneous areas in aerial images taking into account a number of parameters such as shape, color, texture, structure, association, location, and shading (Caridi et al., 2009). These characteristics allow us to easily understand the type of LULC. The scale of digitalization was maintained in a range between 1:400 and 1:1000. The use of a detailed scale has allowed the identification of small surfaces, such as units of gardens, trees of modest size, hedges, etc.
We identified 9 LULC classes: (1) water, (2) agricultural lands, (3) buildings, (4) sport facilities, (5) streets and impervious surfaces, (6) permeable non-vegetated surfaces, (7) arboreal areas, (8) herbaceous areas, and (9) tree crops. The 9 classes were defined by the research group according to the characteristics of the study area and the aims of the study. The LULC vector layers obtained were then processed and analyzed to map and quantify LULC and its changes between the 3 years and to obtain the input data for the carbon stock and sequestration step.
LULC thematic maps of 1955, 1981, and 2018 were rasterized and used as input data to map and quantify the ES carbon storage and sequestration of the study area, using InVEST software. This software, developed by the Natural Capital Project of Stanford University in collaboration with other international partners, groups a series of models that allow the mapping and evaluation of various ESs, and it is specifically suited for the support of decision-making processes (Standford University, 2022). It is widely used in different contests and for different purposes worldwide, as demonstrated by the presence of rich scientific literature available on the InVEST webpage. For this study, we used the carbon storage and sequestration model of InVEST version 3.10.x to estimate the amount of carbon stored in the LULC of the 3 analyzed years and its change, between 1955 and 2018. The input data and the format required by the carbon model are (Natural Capital Project, 2022) as follows: (i) a raster of LULC related to each year of analysis and (ii) a Comma-Separated Value (CSV) table formatted as shown in Table 1, containing data of the average amount of stored elemental carbon for each class of LULC (Cod), in Mg/ha, considering four reservoirs or carbon pools:
1. Epigeal biomass (C_Above): composed of the tissues that make up the aerial parts of living plant organisms (stems, branches, bark, leaves, seeds, and fruits);
2. Hypogeous biomass (C_Below): consisting of the root systems of living plant organisms;
3. Soil carbon (C_Soil): consisting of the organic carbon in the organic and mineral layers;
4. Organic carbon in the litter (C_Dead): made up of the finest residues not yet decomposed.
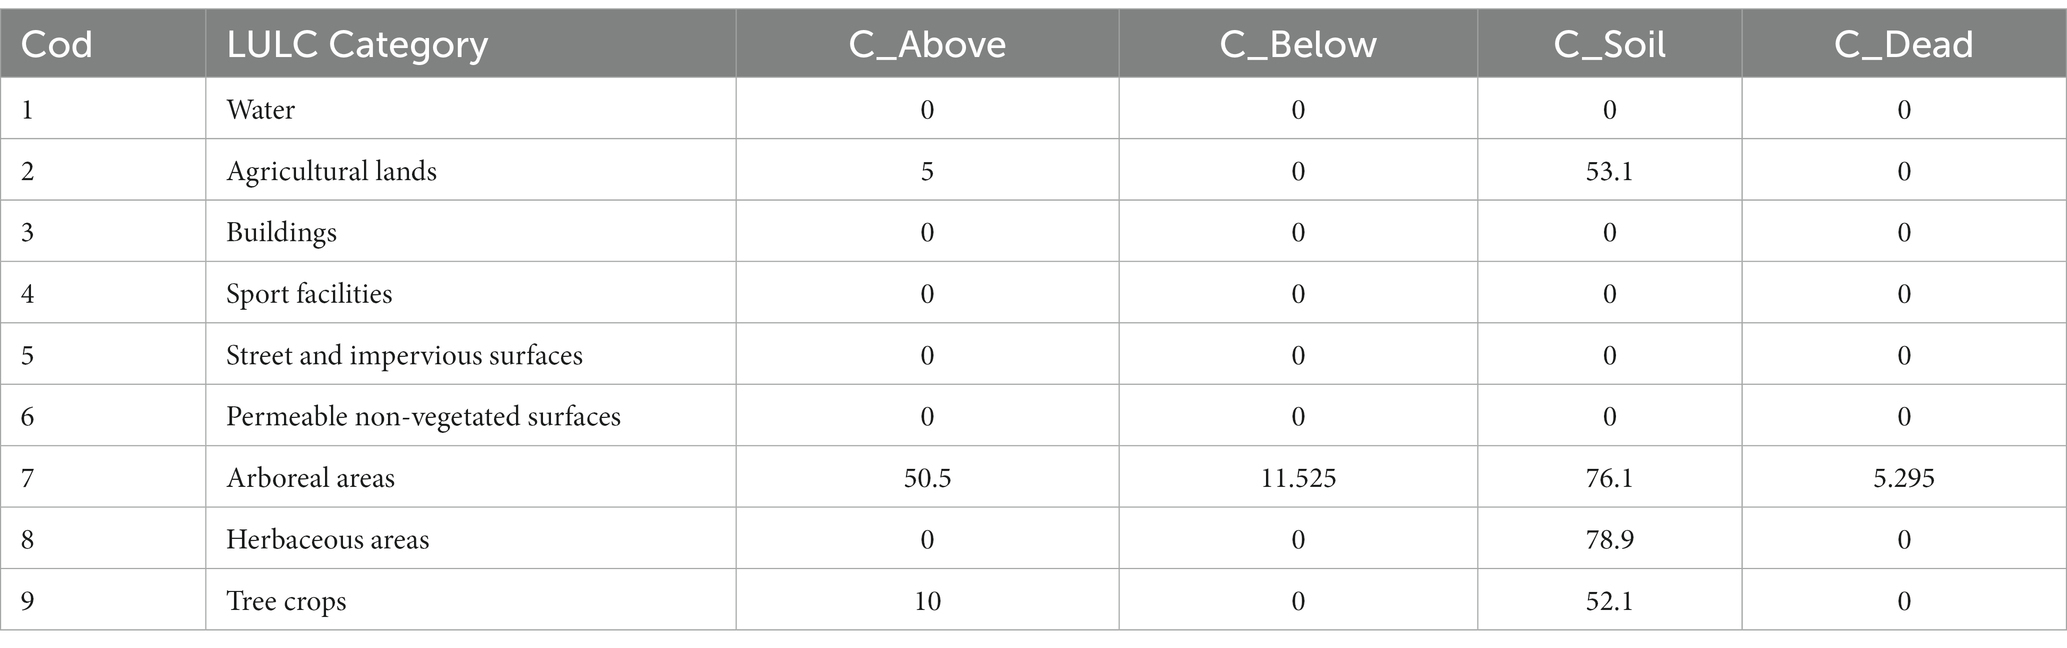
Table 1. Carbon pool values in Mg C ha−1 (Sallustio et al., 2015).
If information on some carbon pools is not available, pools can be estimated from other pools or omitted leaving all values for the pool equal to 0.
The InVEST model links the values attributed to each reservoir to the type of LULC class associated with each pixel, thus determining the total value of stored carbon expressed in Mg/pixel resolution. The temporal variation of stored carbon, that means its release or sequestration, is calculated only for pixels that underwent a change in LULC between the specified comparison years.
According to the InVEST documentation, the average carbon pool value for each LULC can be derived from literature or on-field monitoring. The carbon pool data used in this study can be appreciated in Table 1 and derived from a literature review of studies concerning carbon stock analysis in similar LULC in Italy. In particular, natural reservoirs (for example, arboreal and herbaceous areas) were estimated from values taken from the study of Sallustio et al. (2015), while it is assumed that values for artificial areas and water correspond to 0 for each carbon pool.
Through the so-called “Cities mission,” the Municipality of Padua was selected by the European Commission among the 100 European cities to target carbon neutrality in 2030 (European Commission, 2022a). To pursue the ecological transition, different initiatives to implement and integrate NBS and green infrastructures by afforestation are currently promoted in various cities both in Europe and worldwide. Hence, the starting points to perform the future scenario in the study area are two: (1) the Padova O2 project, promoted by the Padua Municipality, which aims to reforest selected public areas with 10,000 new trees (Wownature, 2022), and (2) the selection of herbaceous public green areas along the riverbanks to implement the future scenario by using a previous quantification of public and private green spaces from Pristeri et al. (2021). Finally, we considered a time frame for tree growth from 2022 to 2050, without taking into account possible illness or dead trees. In more detail, we selected 2018 herbaceous polygons located only in public areas by using spatial data from Pristeri et al. (2021) and excluded polygons with an area less than 50 m2, for a total potential area of 76.5 ha. Hence, 10,000 trees, as promoted by the Padova O2 project, are uniformly distributed across the riparian ecosystem. As a standard to calculate the increasing reforested surfaces, we used a typical tree planted in Padua, Tilia cordata Mill., by considering its crown diameter growth range (Supplementary Table S2; Moser et al., 2015). Concerning the carbon pools for the reforested surface with Tilia cordata Mill., tree carbon pool values from Sallustio et al. (2015) are assigned (Table 1). It was established that in the year 2022, the crown diameter was equal to zero, and in 2030, the crown diameter value will be assigned by considering the mean value of the <20 years age group; in 2040, the value will be calculated by taking the average between the 2030 value and the 20–40 years age group mean value. Finally, for 2050, the value will be considered as the 20–40 age group mean value (ascribable to about a 30-year-long interval from 2022).
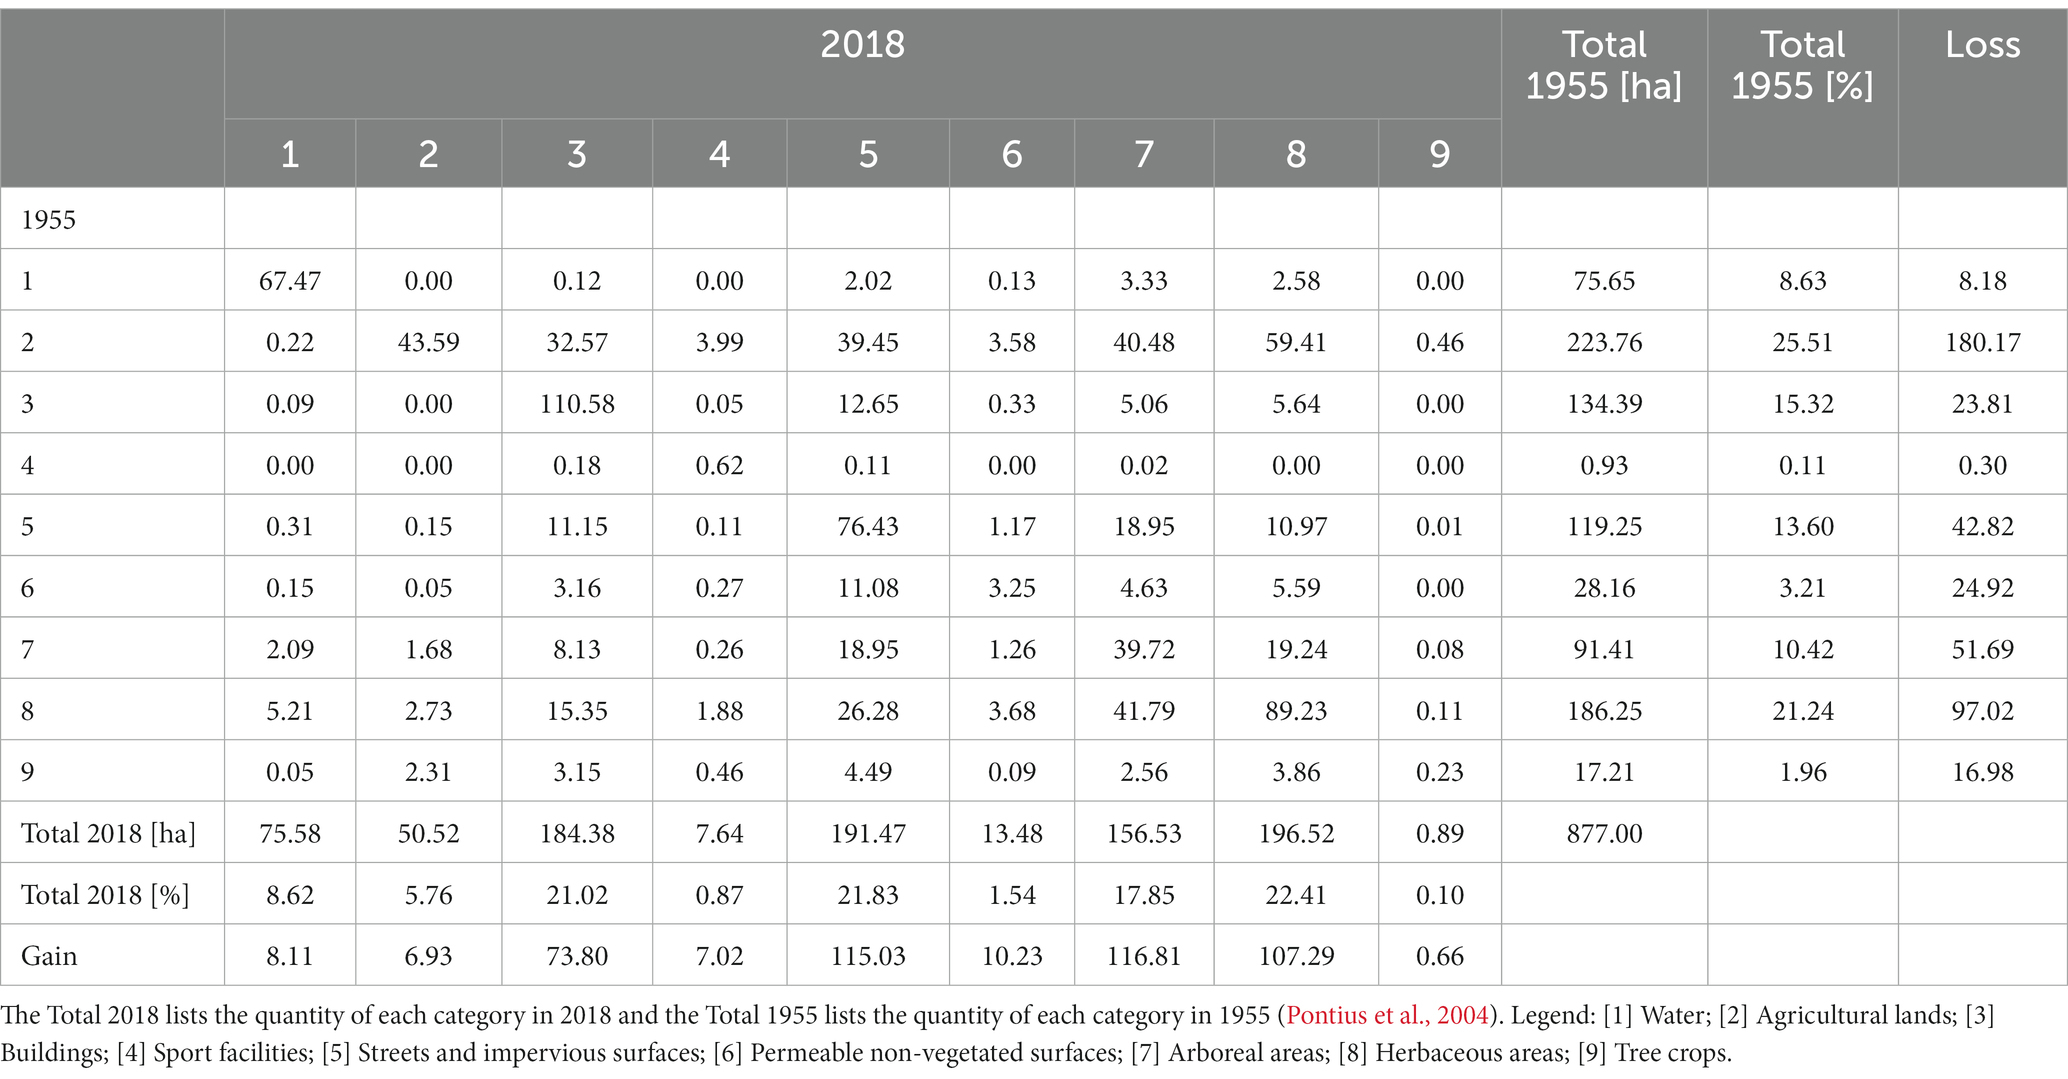
Table 2. Cross-tabulation matrix: analysis of LULC changes between 1955 and 2018.
The area occupied by a tree can be calculated by using the following equation (assuming the area of a tree crown is a circle):
with A = Tree area and CD = Tilia cordata Mill. crown diameter.
For example, the area of a single tree in 2030 is equal to 7.55 m2, which means that 10,000 trees will occupy 7.5 ha, which corresponds to about the 10% of the total potential area.
The percentage of the increasing tree area for 2040 and 2050 can be calculated by multiplying 10,000 by the surface area of a 2040 tree or a 2050 tree.
Carbon sequestration assessment for 2022, 2030, 2040, and 2050 considering the 4 carbon pools (C_above, C_below, C_soil, and C_dead) is extracted from the tree cover carbon stock calculated for each year.
Our analyses highlight the changes in the urban riparian ecosystem of Padua for 63 years (from 1955 to 2018).
The 1955 LULC map shows how the study area was already strongly man-made (Figure 2). There were no natural or semi-natural areas, while agricultural areas and buildings were located along the river and canals of the city, mainly outside the historical walls (Supplementary Figure S4). Overall, 25.5% of the total area was covered by crops in 1955, while impervious areas, such as buildings and streets, occupied 28.9% (Figure 3).
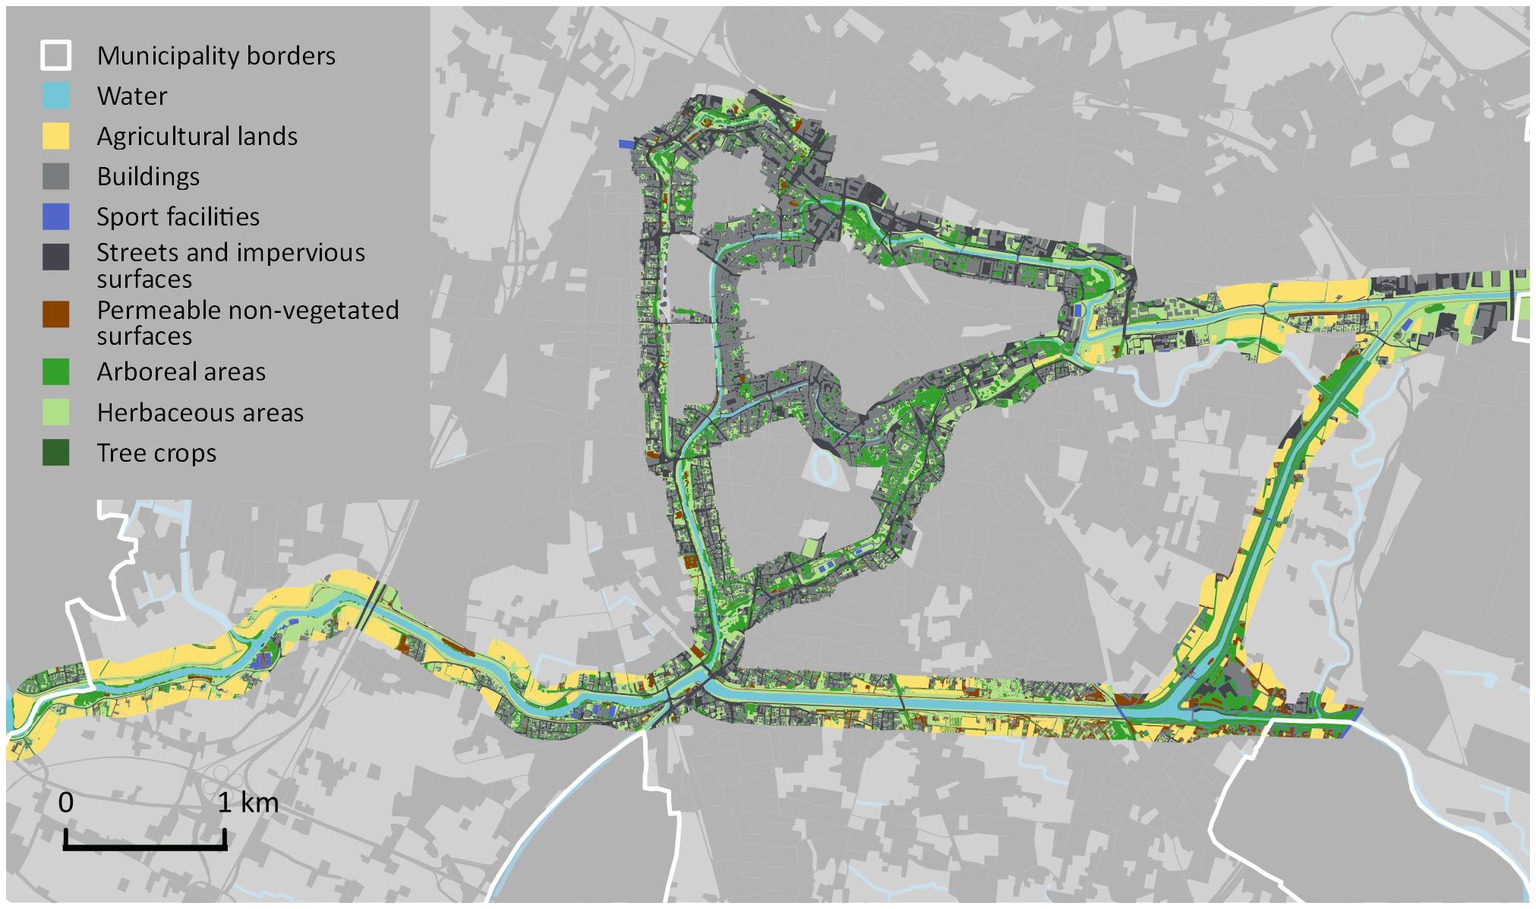
Figure 3. Land use classifications on 9 classes in the year 1981.
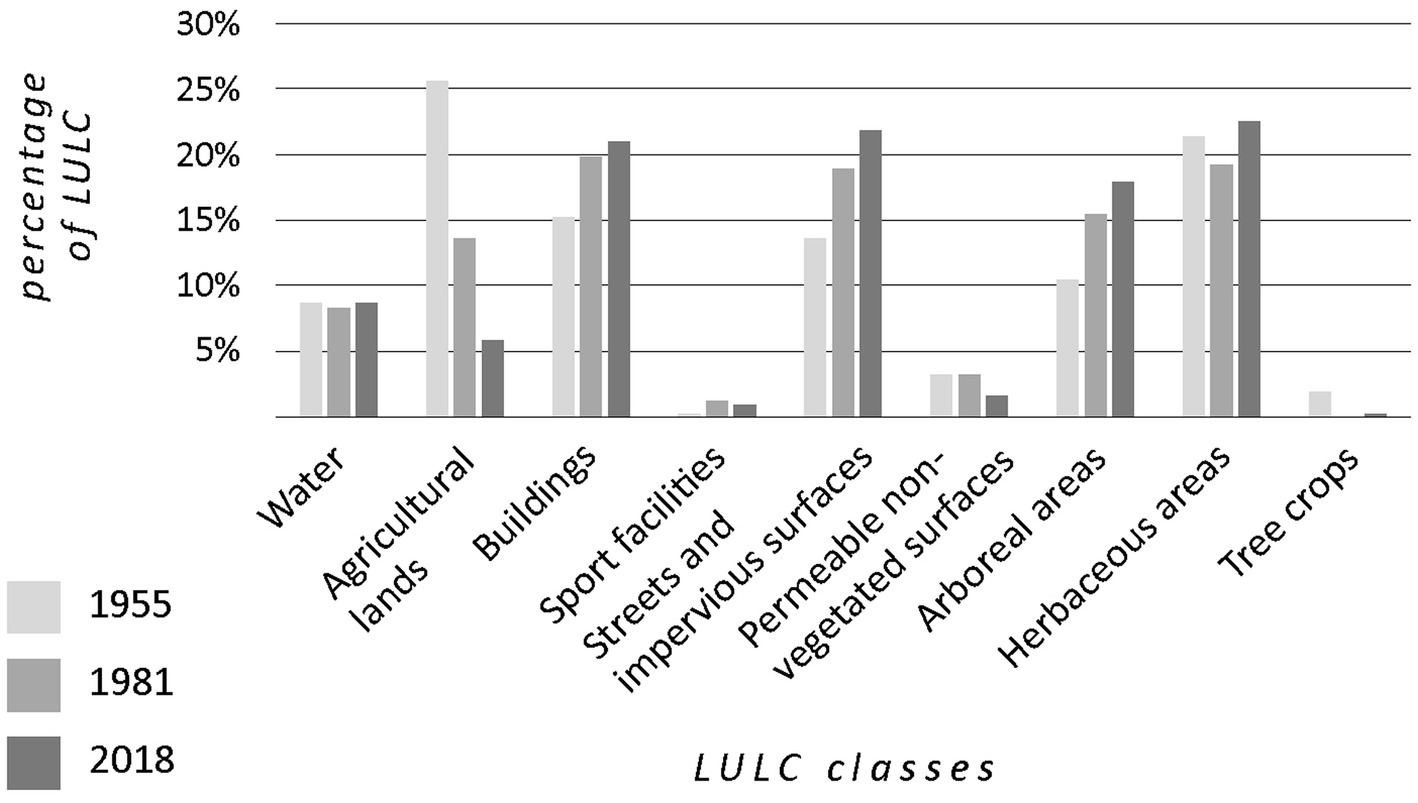
Figure 4. Graphic of diachronic land use analysis on 9 LULC classes.
Over time, crops have shrunk, and in 2018, they covered only 50.52 ha (5%) of the study area, whereas buildings and streets have increased by 188.83 ha (21.53%), occupying more than 40% of the total area: the greatest growth occurred until 1981 during the post-World War II economic boom period (Figures 2–4). Later, since 1981, in the north-eastern sector, large buildings were detectable. They represent part of the industrial area of Padua, which developed since the late years of the 1960s (Figure 3). It is worth noting that green spaces, i.e., arboreal and herbaceous areas, have increased from 1955 to 2018 (see Figure 4). More specifically, vegetated areas mainly grew from 1955 to 1981, rising from almost 10% to more than 15%, while from 1981 to 2018, the increase of vegetated areas was slower. Overall, the herbaceous areas cover more surfaces than trees, nevertheless, their growth has not been steady and markedly over the years.
Hence, the general tendency shows that impervious surfaces increased along urban riparian ecosystems, mainly located in the suburban sectors of the study area, at the expense of crops and agricultural areas; it is important to highlight that vegetated cover has risen thanks to tree growth (Figures 2–5).
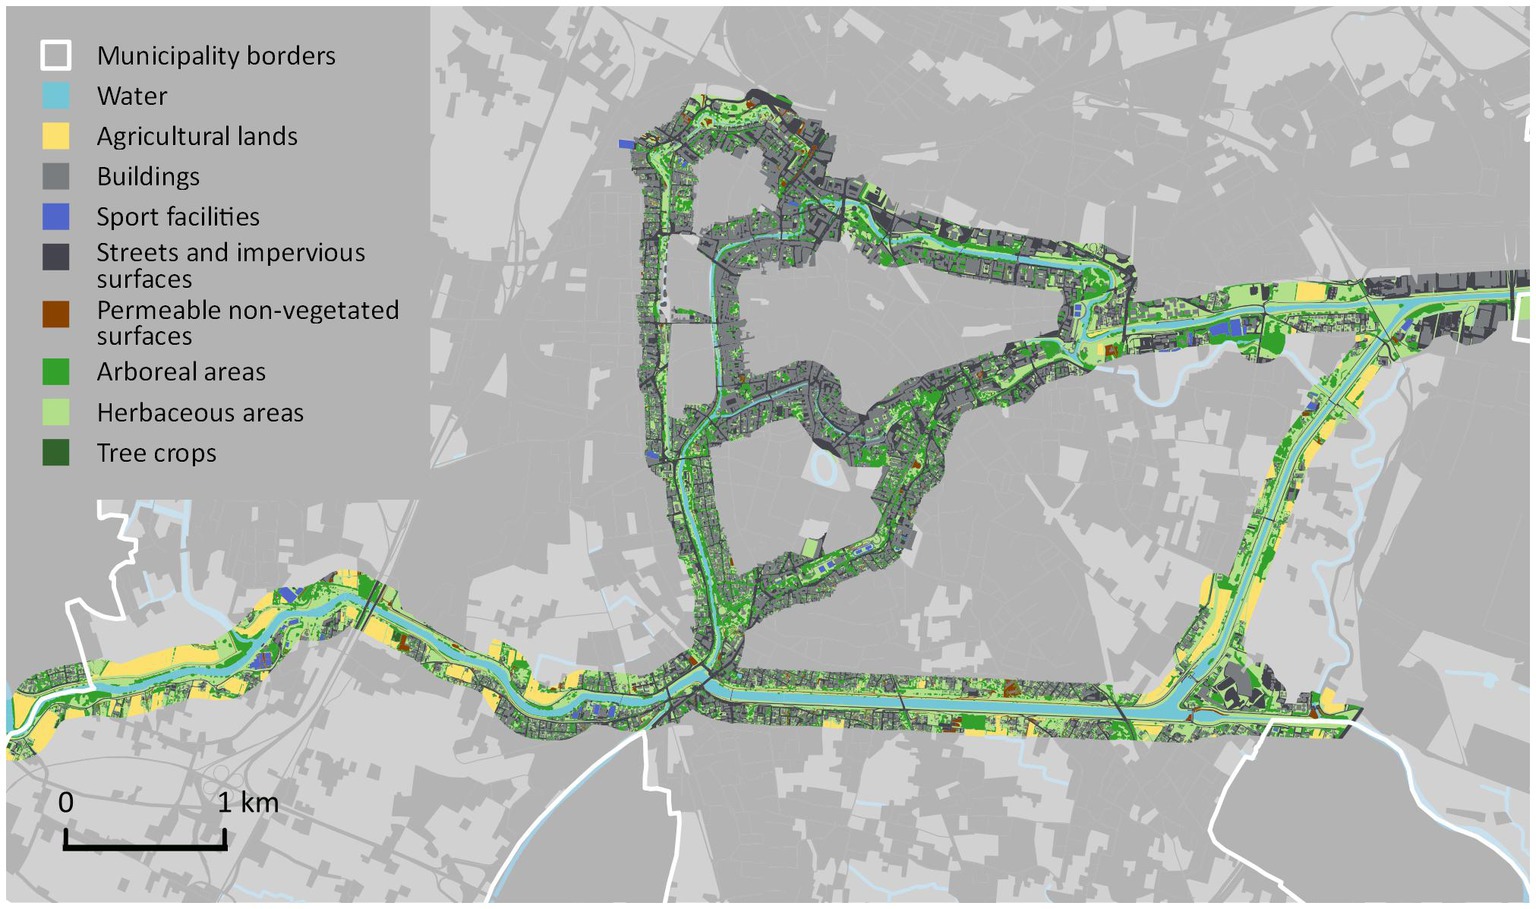
Figure 5. Land use classifications on 9 classes in the year 2018.
A detailed analysis indicates that changes occurred mainly outside the walls during the period from 1955 to 1981. In 1955, the presence of agricultural areas was dominant (more than 40%); however, after the economic boom, urbanization and settlement growth caused a loss of crops (less than 25%; Supplementary Figure S4). The land for agricultural use has been replaced by buildings and roads up to 10% of the total in 2018, with negative consequences on soil permeability.
In more detail, LULC’s evolution outside the historical walls evolved according to three different categories. First, the area located in the southwest of Padua, along the Bacchiglione river, is one of the few sectors preserved as agricultural areas over the decades. Hence, soil sealing has shown very low percentages in these areas. It is important to highlight that a similar evolution occurred in the east sector of the study area, along the St. Gregorio canal. Here, agricultural areas were converted into green areas mainly from 1981 to 2018. It is worth noting that this canal is a sort of division between a residential neighborhood on the West of the riverbank and the industrial area of Padua on the East of the banks. Second, a different evolution occurred for the area located in the north-east sector of Padua: rural areas were not preserved, and they underwent progressive urbanization as a consequence of soil sealing growth. In this area, since 1960, the industrial sector of the city of Padua has been concentrated. The industrial buildings and road infrastructures have determined the occupation of most of the natural and semi-natural areas. Third, high LULC changes are reported in the south sector of the study area, along the Scaricatore canal. Therefore, the area completely lost its agricultural identity in favor of a residential urban fabric.
Inside the historical walls, the LULC transformations were more limited, and they occurred mainly from 1955 to 1981 (Supplementary Figure S5). Indeed, during this period, new built-up areas were created. Within the walls, the consolidated urban fabric, determined by a network of ancient buildings, has led to limited changes over the years. Moreover, it is important to highlight that the majority of constructions were built directly on the banks of the canal. Overall, soil sealing has not shown a significant evolution inside the historical Walls. Hence, it is therefore evident that, over the years, the city has followed a process of conurbation, extending mainly beyond the historical boundaries of the city.
The 1955 and the 2018 maps are compared to produce a cross-tabulation matrix that shows the percentage of the LULC categories (Table 2) and that identifies the most important transitions (Pontius et al., 2004). The table highlights important changes for agricultural areas, with a net loss of 173 ha. It is worth noting the change for arboreal areas, which gained 65 ha, as well as for buildings and streets, which gained about 50 and 72 ha, respectively (Table 3).
Finally, Table 3 shows the net change of each category by giving additional information concerning persistence and swap of LULC changes. It is important to focus on the concept of “swap” in this table. Usually, LULC changes for each category between 2018 and 1955 are defined as the “net change.” However, when there is no net change, there could be a swap change, which means that land changes could take place in such a way that the location of a category changes between 1955 and 2018, while the quantity remains the same. For example, a given quantity of herbaceous areas at one location can coincide with the same quantity of herbaceous areas gained at another location. Hence, it is important to understand the swapping component of change to understand if a change in the territory really occurred: when total change and swap corresponded, it means that there are no changes in the territory. Table 3 indicates the positive absolute value of net change for four categories, buildings, streets, and arboreal and herbaceous areas, whereas it highlights the negative absolute value of net change for agricultural areas, permeable non-vegetated areas, and tree crops.
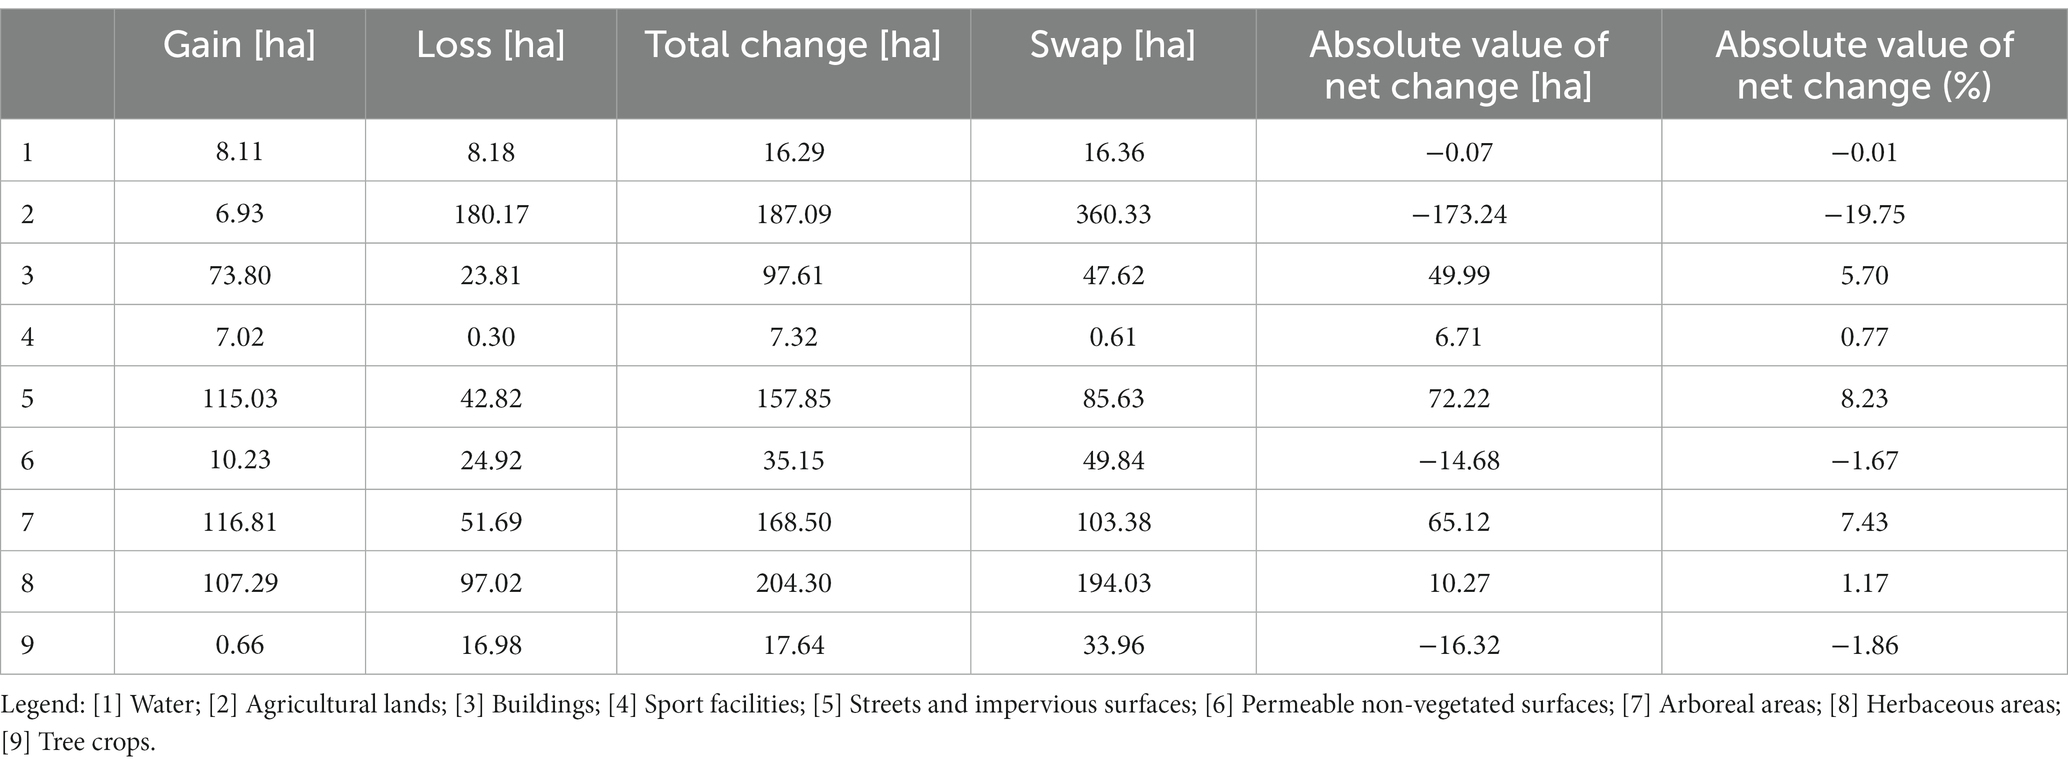
Table 3. The table shows the net change of each category.
In conclusion, LULC analyses are very helpful to underline, at a very detailed scale, how this ecosystem changes during the years and they also underline how the urbanization process was faster from 1955 to 1981 than from 1981 to 2018. This trend was also probably decreased by the Italian national law of 1985 (later incorporated into the 2004 Italian national law named as Cultural Heritage and Landscape Code) that tried to safeguard these areas. However, it is important to highlight that this law was not focused only on urban ecosystems, but it referred to all rivers.
Results on carbon storage and sequestration in 1955, 1981, and 2018 are represented by three different cartographic outputs (Figures 6–8).
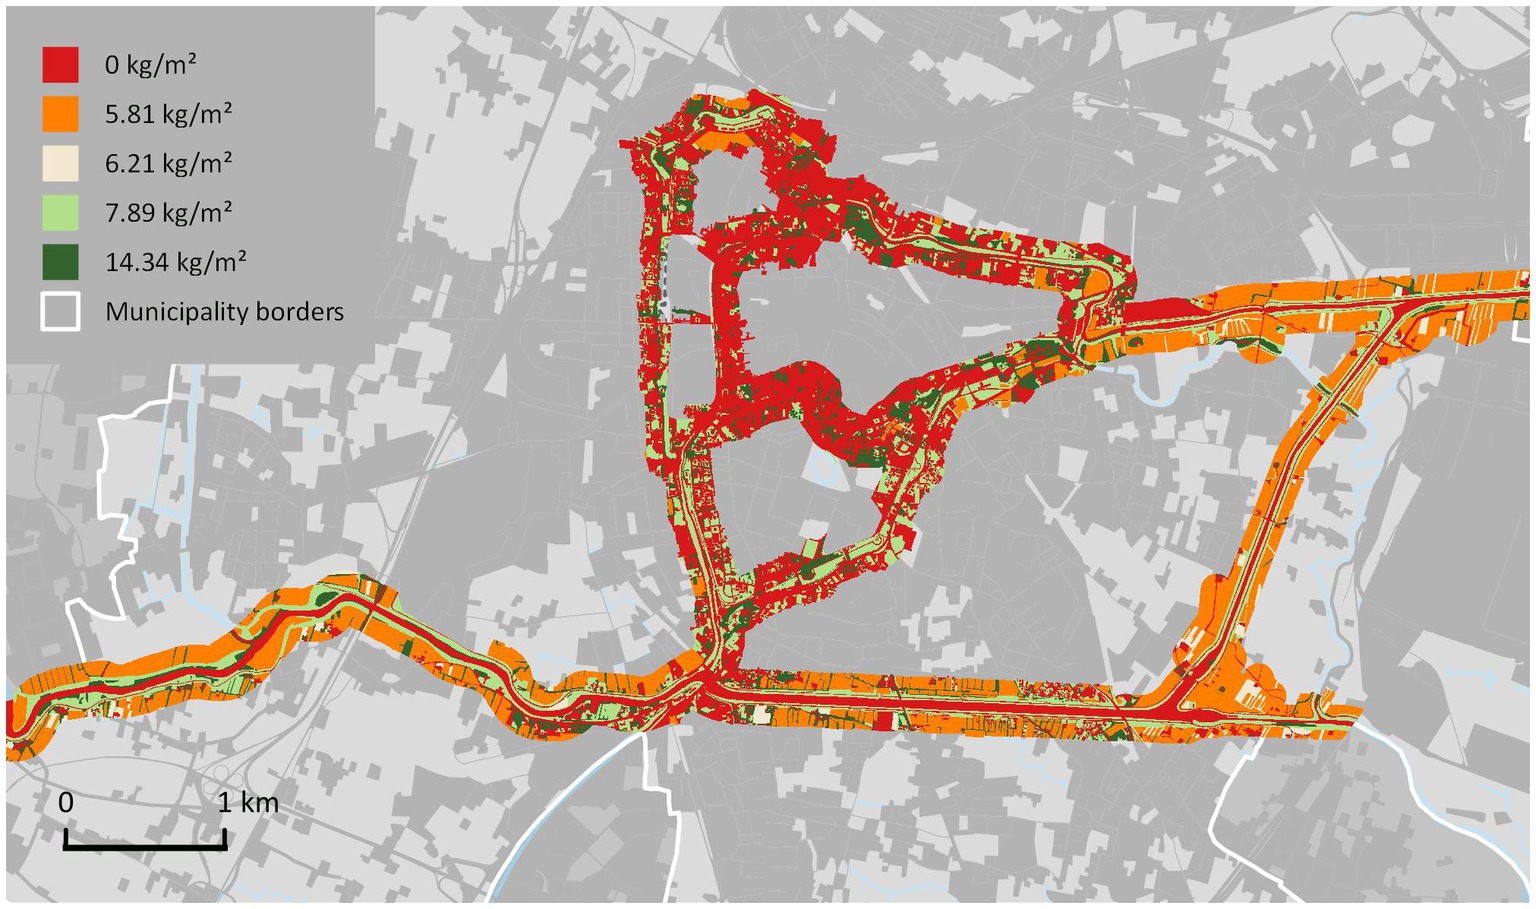
Figure 6. Carbon storage in 1955.
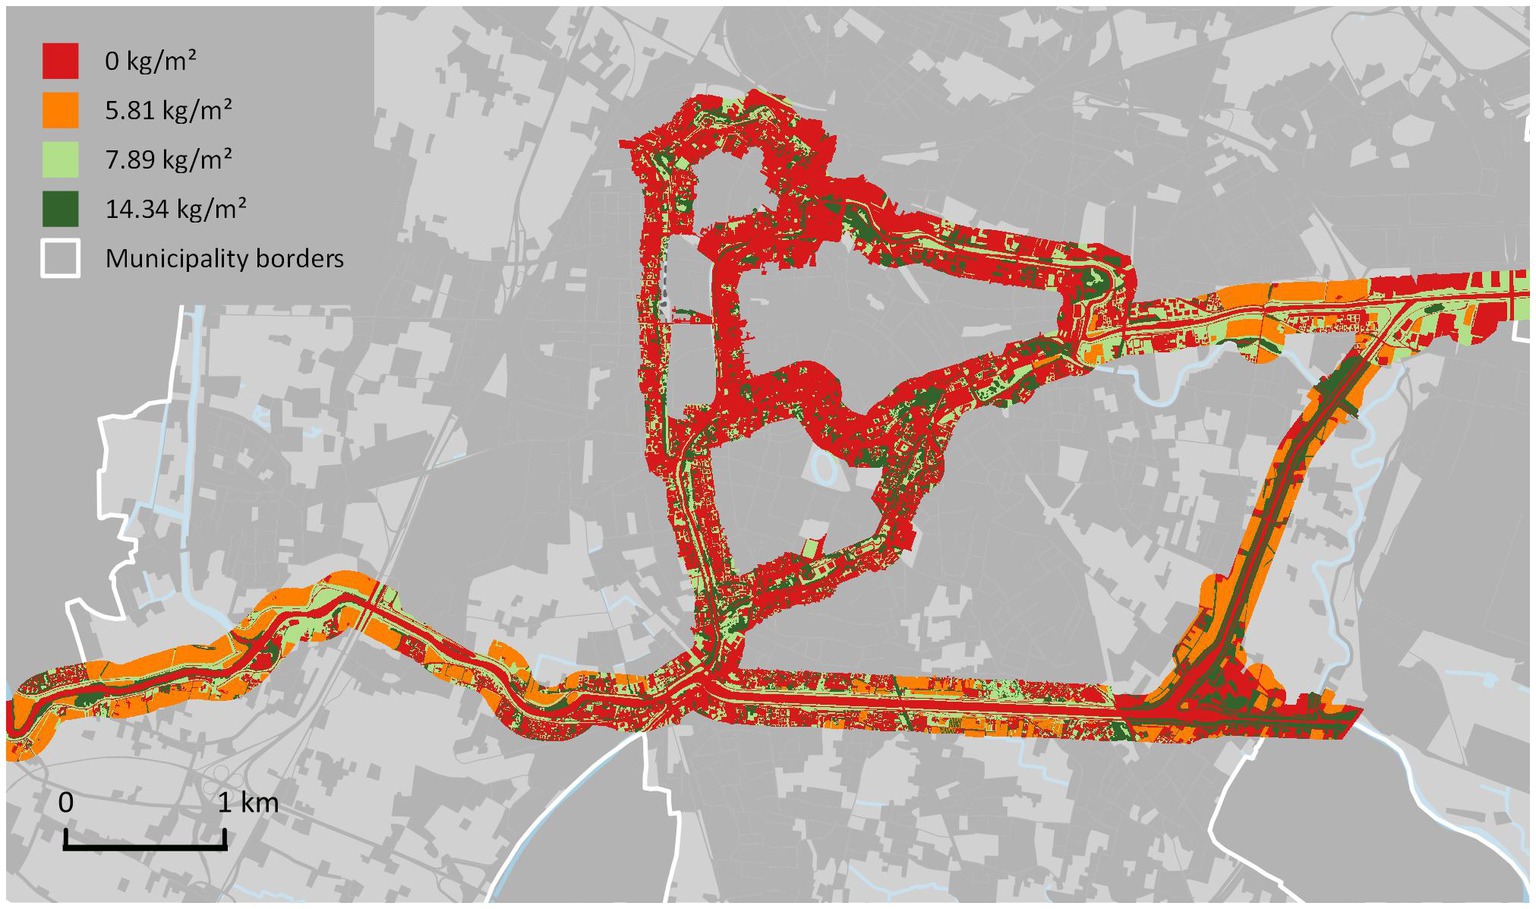
Figure 7. Carbon storage in 1981.
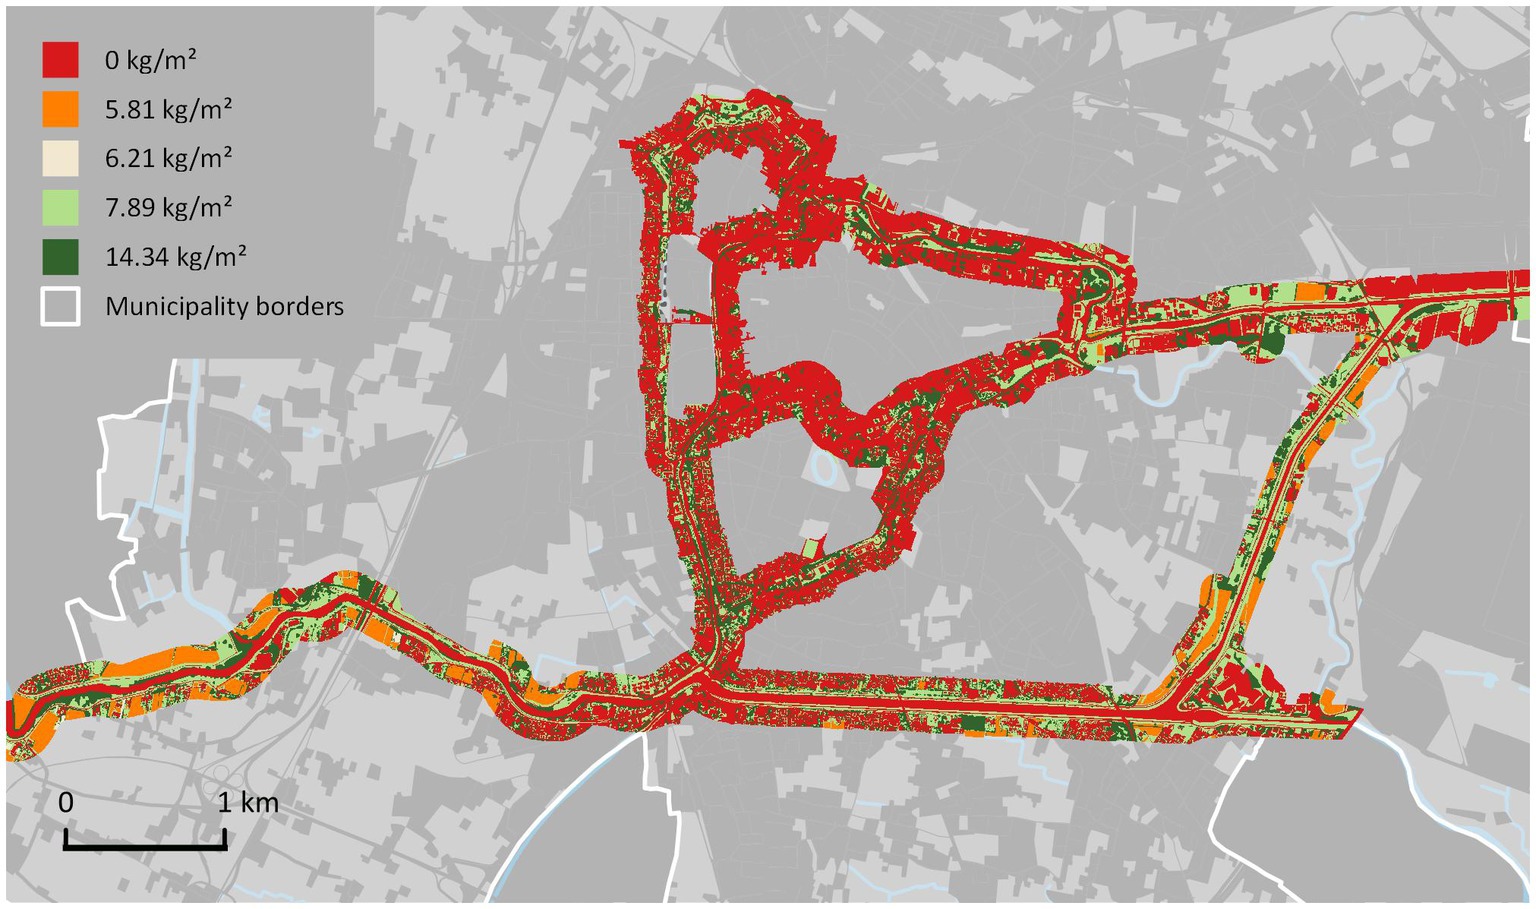
Figure 8. Carbon storage in 2018.
The range of values of stored carbon goes from 0 to 14 kg/m2 (140 Mg/ha). 0 kg/m2 class corresponds to surfaces that do not sequester carbon, such as buildings, roads, bare ground, and sports fields with synthetic ground, while 14 kg/m2 class corresponds to surfaces that sequester the highest value of carbon, represented by vegetated areas. Intermediate values of carbon storage are represented by 5.81 and 7.89 kg/m2, for example, tree crops and herbaceous areas.
The color gradient used in the representation of carbon storage ranges from red for zero values to green for higher storage values and through orange, light brown, and light green for intermediate values.
Inside the Venetian walls, where the majority of the historical urban fabric is located, carbon storage values have not significantly changed over the years. Zero carbon storage areas are predominant and they correspond to roads and ancient buildings. Surfaces with high storage values (14 kg/m2) are mainly located along the canals and the perimeter of some residential buildings.
Outside the historical walls, major variations in carbon storage values occurred. In particular, large extensions of 5.81 kg/m2 carbon storage values, corresponding to agricultural areas are presented over the entire period analyzed. In 1955, the few 0 values of carbon storage were derived mostly from water, roads, and the few scattered rural buildings: they remained steady up to 2018 (Figure 8). On the other hand, part of the carbon storage is reported by herbaceous areas (7–10 kg/m2), some of which have replaced crops from 1955 to 2018, as well as by the green shrubs and trees that are mainly located along the riverbanks and, to a lesser extent, along the borders of some agricultural plots and buildings.
In the south sector of Padua, 3.5 kg/m2 areas, that correspond to crops, were transformed, both from 1955 to 1981 as well as from 1981 to 2018, into extensive built-up areas for residential use. As a consequence, in 2018 high areas of 0 storage value are shown in this sector. Vegetated areas, which store large amounts of carbon (14.34 kg/m2), were relocated during the years partly along the river and partly within the urban fabric (Figure 8).
Finally, carbon sequestration was calculated from 1955 to 2018 (Figure 9): positive values indicate sequestered carbon (light green and green), light yellow corresponds to no sequestration, whereas negative values indicate released carbon (dark red and red). Sequestration or release of carbon depends directly on the variation of LULC between 1955 and 2018 and therefore on the capacity to store carbon by the areas that provided a change of soil use. Carbon sequestration was calculated also from 1955 to 1981 and from 1981 to 2018 (Supplementary Figures 6, 7; Supplementary Tables 3, 4).
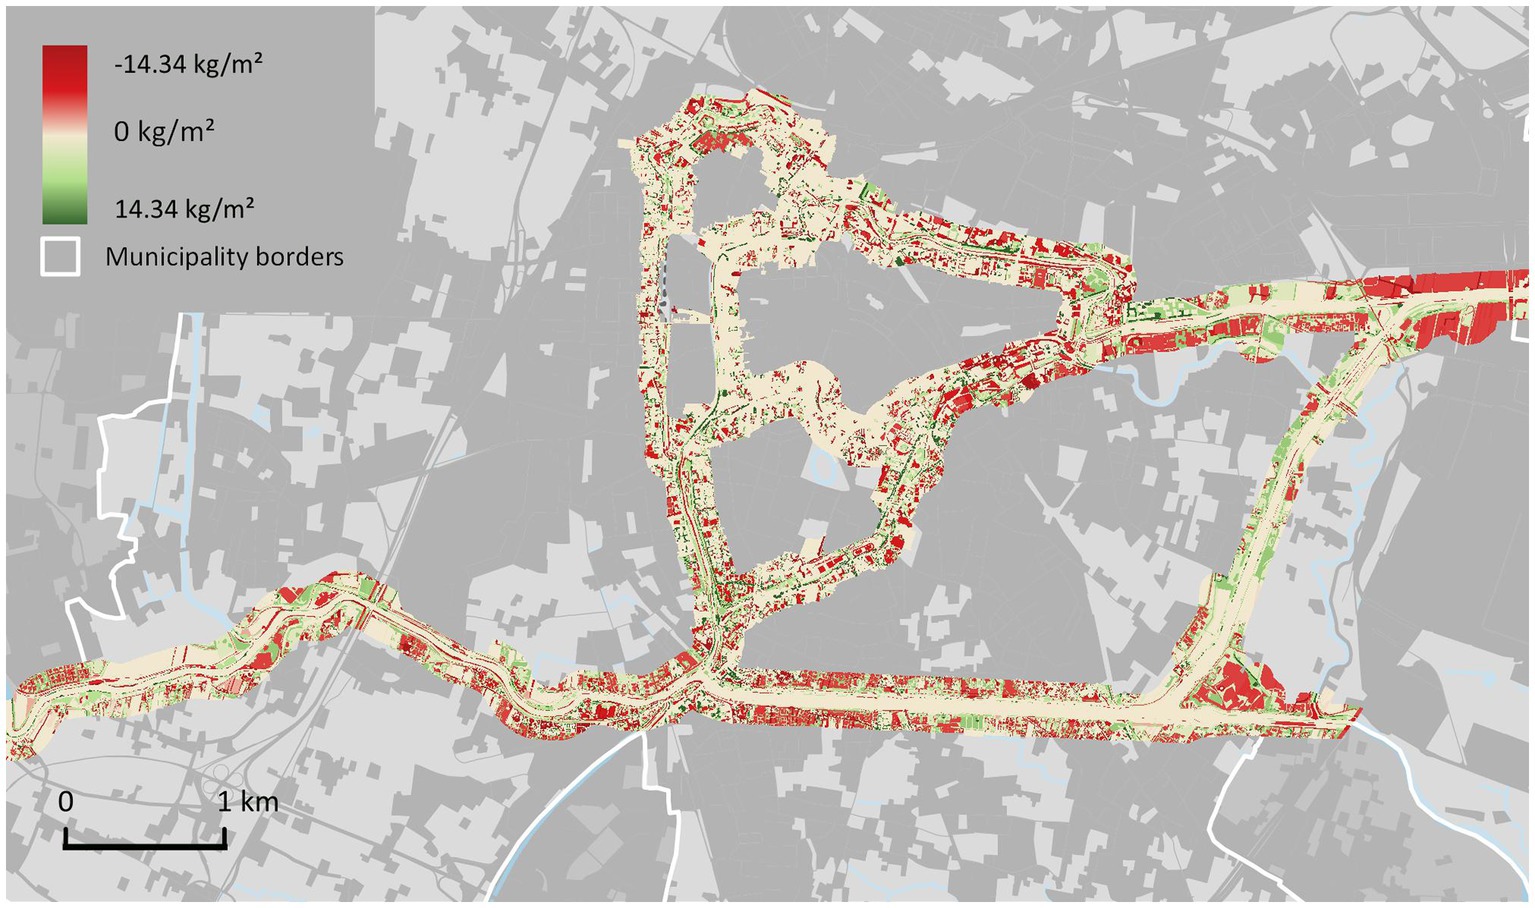
Figure 9. Carbon sequestration between 1955 and 2018.
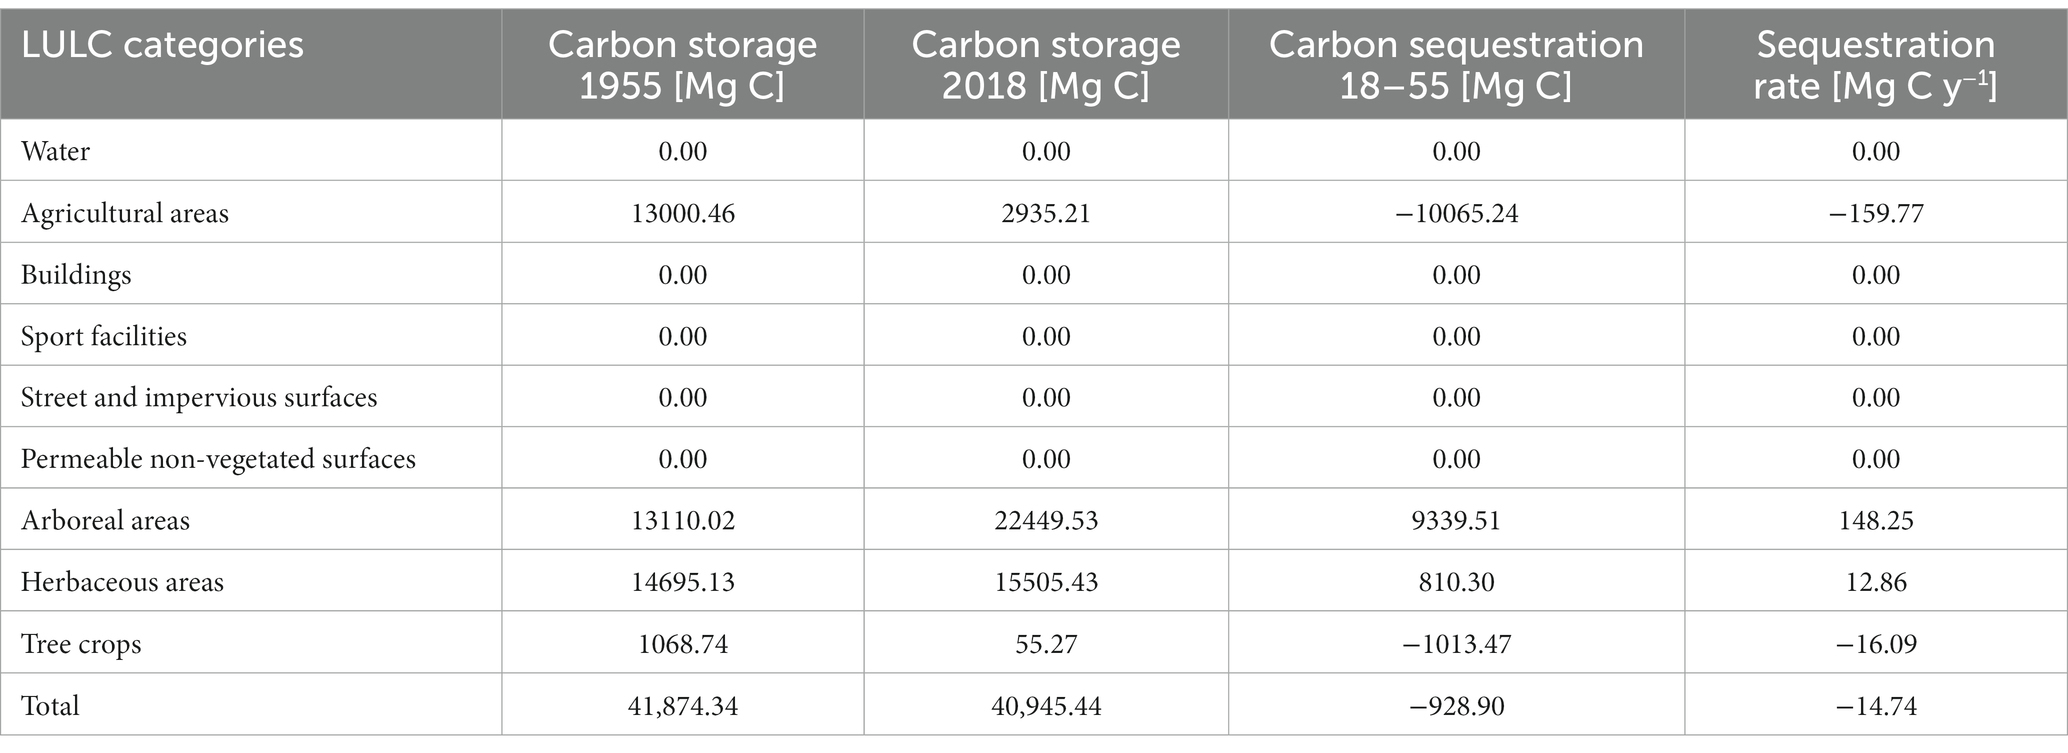
Table 4. Carbon storage and sequestration for each category between 1955 and 2018.
The InVEST carbon model report showed that in 1955, 41,874 Mg of C were stored in the different tanks while in 2018, 40,945 Mg of C were stored (Table 4). Hence, a negative change occurred corresponding to about −928 Mg of C. Table 4 shows also the carbon storage for each category and it highlights how the loss of agricultural areas and tree crops from 1955 to 2018 were partially replaced by arboreal and herbaceous areas. Moreover, the total sequestration rate reports a decrease of −14.74 Mg of C per year.
In more details, inside the Venetian walls, where the historic and dense urban fabric is located, few variations are detectable; in the north-east sector and the south sector, areas releasing carbon are located, due to the conversion of agricultural areas into industrial warehouses (in the north) and residential areas (in the south), respectively, with a loss between 7 and 14 kg/m2.
However, a positive variation in terms of sequestration (+7 and +14 kg/m2) is visible thanks to trees (dark green) and grassland, which are located at different extents in different locations, such as the banks of the rivers and along the historic walls.
In conclusion, the map shows a very slight increase in vegetated areas, while the built-up areas are significantly increased.
Calculations on carbon sequestration are based on Reduced Complexity Models which imply some limitations and constraints. First, the InVEST Carbon model is based on a simplified carbon cycle where the carbon sequestration rate is constant over time. Moreover, it assumes that none of the LULC categories are gaining or losing carbon over time. Instead, it is assumed that all types of LULC are at a fixed accumulation level equal to the average of the accumulation levels measured within that type of LULC. In this assumption, the only changes in carbon storage over time are due to changes from one type of LULC to another. Therefore, any pixel that does not change its LULC type will have a sequestration value of 0 over time (Natural Capital Project, 2022).
Moreover, since the aerial images of 1981 and 1955 were in black and white, this implied a greater difficulty in distinguishing the extent of the different elements of the soil and a lower detail of the photo-interpretation. However, in 1955, given the greater simplicity of the landscape, the identification was less complex.
Despite its limitations, the methodology is still an excellent starting point for assessing important changes occurring in the urban territory and therefore a valuable support for policymakers.
The results of the future scenario from 2022 to 2050 show a gradual growth of trees: in 2030, the public green areas reforested will be almost 10%, and in 2050, they will be overall 40%, moving from 7.6 ha to 30 ha (Supplementary Table S5). Simultaneously, carbon stocks will also increase. At the plantation moment, carbon stocks will be 0, whereas it will increase quickly, doubling from decade to decade: in 2030, it will be 1,082.53 Mg; in 2040, it will be 2,435.60 Mg; and in 2050, it will be 4,329.95 Mg (Supplementary Table S6). Hence, carbon sequestration from 2022 to 2050 will be 4,329.95 Mg (Table 5).
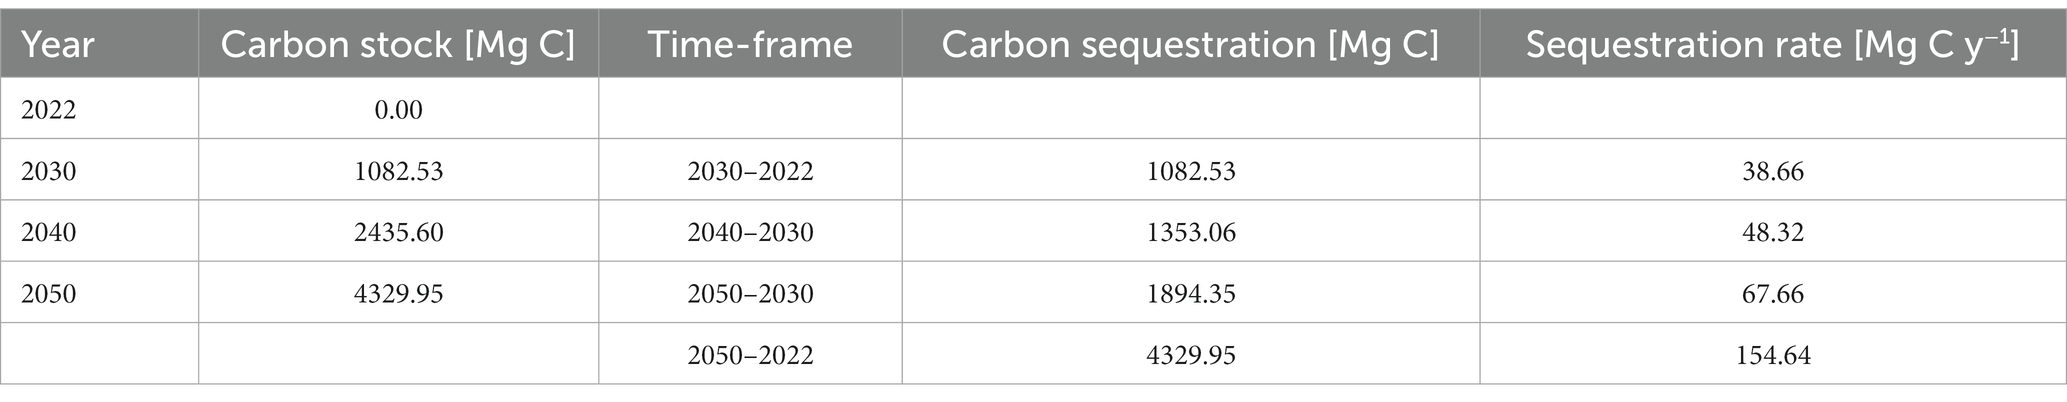
Table 5. Carbon stock and carbon sequestration from 2022 to 2050.
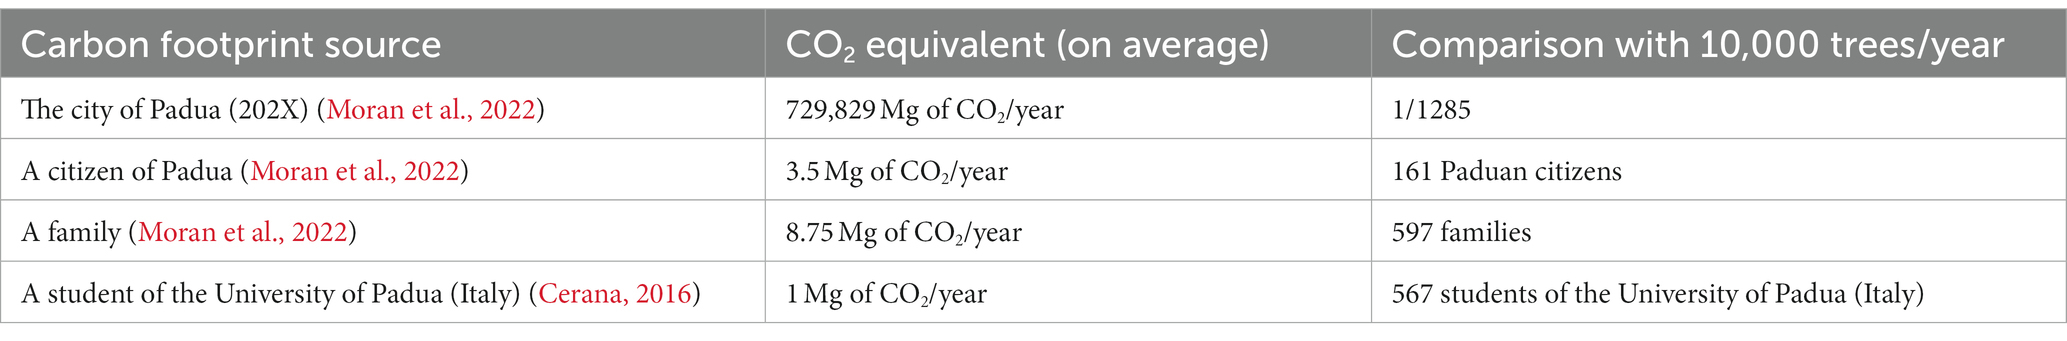
Table 6. Carbon footprint of CO2 emission.
If we consider carbon sequestration service in terms of carbon dioxide, 15,890.92 Mg of CO2 will be sequestered in 28 years. On average, every year, 567.53 Mg of CO2 will be sequestered by the growth of 10,000 newly planted trees. However, it is useful to compare such value with some metrics to understand the contribution in terms of carbon footprint. Table 6 summarizes some carbon footprint of CO2 emission.
As already mentioned, tree planting may accelerate live-tree sequestration of CO2, not only in urban riparian ecosystems but, more completely, in the entire urban ecosystem. Indeed, the concept of urban forest is not a new topic as described by Johnston about the urban forestry movement in the US (Johnston, 1996). At present, there are different initiatives of afforestation to create new urban forests for climate-resilient cities and to achieve carbon neutrality. For example, as brownfield issues affected eastern Germany, new strategies were developed to re-use or renaturalize these areas, by introducing urban forests (Rink, 2011). A paramount initiative was taken in Leipzig (Germany) where urban forests were used as instruments of urban redevelopment (Rink and Schmidt, 2021). Other famous examples are Beijing’s 50 Million Trees Programme providing a 10% increase in overall forest cover, as well as the Million Trees Projects in New York, to plant 1 million trees over 10 years, Los Angeles through planting and stewardship of 1 million trees from 2006 to 2010, and Singapore through the planting of a million more trees from 2020 to 2030 (McPhearson et al., 2010; McPherson et al., 2011; Yao et al., 2019; NParks Singapore 2020, 2020).
However, the examples in Table 6 and the case studies abovementioned highlight how the 10,000 trees planted in our future scenario are a minimal contribution to the city’s total CO2 emissions. Hence, the study underlines how the number of trees would be two orders of magnitude higher than the 10,000 trees planned up to 2030 to achieve or contribute to the city’s carbon neutrality. As explained by Veldman et al. (2019), even if tree planting can have an important role in climate change mitigation, it is no substitute for the fact that most fossil fuel emissions will need to stop to meet the targets of the Paris Agreement. Such action should be accompanied by policies that prioritize the conservation of biodiverse ecosystems, irrespective of whether they contain a lot of trees.
In conclusion, the Padua urban riparian ecosystem case study underlines two aspects. First, in the recent past, urban management and policies did not provide clear and well-defined planning of these areas, as shown by the continuous fragmentation and urbanization of this ecosystem over the decades. Second, urban riparian ecosystems could be suitable locations to implement afforestation projects from a carbon sequestration perspective as well as from an overall ES perspective. Hence, improving these strategies could represent successful solutions to integrate NBSs in cities and make these ecosystems a sustainable frontline to adapt to climate change in urban areas.
Urban riparian ecosystems are exemplary cases of “already plugged-in” green infrastructures and NBS, existing part of the potential urban ecological networks that are still providing essential ES for city dwellers, especially in historical and compact cities, where natural and semi-natural areas are lacking. Urban rivers and channel networks, shaped by constant human-environment interactions in a build-up environment, currently represent a functional urban-integrated ES engine, essential for offsetting energy-intensive cities. Hence, they should be considered as priority areas to be protected and prioritized in actual urban planning strategies. Prioritizing these areas could offer unique opportunities to cities and their dwellers, not only for carbon sequestration but also for the other ESs that they could provide. Indeed, as stated in the introduction, urban riparian ecosystems provide a multitude of ES even if they are relatively small areas (González et al., 2017). Moreover, they could be considered the ecological background to implement NBSs for mitigating and adapting to the local effects of climate change that cities are increasingly faced with heat waves, drought, floods, and pollution (Haase, 2017).
Having this in mind, it is thus fundamental to design and plan future strategies to restore and maintain the functionality of these underestimated and “already plugged-in” areas. The added value of these ecosystems also comes from not requiring the ecosystem to be planned from scratch but from capitalizing on what is already in place in many cities that, as explained by our case study, has been partially safeguarded by the Italian legislation. The strategies that could be adopted at the local level by policymakers are: (i) considering urban riparian ecosystem as a network of green infrastructures that should be managed as a unique net; (ii) avoiding construction of new buildings along the riverbanks, (iii) implementing arboreal areas both in public as well as in private areas, (iv) maintaining agricultural areas moving from traditional agriculture to agroecological systems, and (v) implementing social connectivity across rivers and canals.
We, therefore, stress that an explicit recognition in public urban planning is necessary to manage and restore these fundamental ecosystems, not only in rural areas but also in ecosystems of compact and dense cities. The policy instruments should be addressed to stakeholders and policymakers not only at the international but also at the national, regional, and local levels to preserve and implement ESs of urban riparian areas.
Urban riparian ecosystems have been severely modified and degraded during the city development, including water surface sealing or narrowing as well as reduction or loss of riverbanks. As a consequence, essential urban ESs are degraded or lost.
Our study first analyzed the relationships between LULC changes and urban development within the riparian ecosystems of a compact city as Padua, during the past 63 years (1955–2018), finding a relevant loss of permeable surfaces, in particular agricultural areas. As a result, LULC changes contributed to a loss of carbon sequestration service of almost 1,000 Mg of C.
Modeled future scenarios in 2030 and 2050 do not indicate relevant climate mitigation effects when considering the actual carbon footprint of the city of Padua and the target to be carbon neutral in 2030. However, the preservation and implementation of other urban ESs for the increase of biodiversity, the mitigation of urban heat islands and hydrogeological risk, as well as the implementation of social open spaces and corridors can represent possible pathways for a more sustainable and resilient urban development.
Finally, the use of very high-resolution aerial images combined with GIS modeling allowed to elaborate detailed thematic maps at the suburban scale, providing a spatially explicit database of occurred changes and supporting urban planning policies based on ES assessment and green infrastructure implementation.
The raw data supporting the conclusions of this article will be made available by the authors, without undue reservation.
FP contributed to the conception and design of the study. DC, LB, and MC performed the geographical analyses. DC wrote the methodology sections of the manuscript. FP wrote the first draft of the manuscript and performed the thematic maps. SP and MM contributed to the manuscript revision. All authors contributed to the article and approved the submitted version.
The authors declare that the research was conducted in the absence of any commercial or financial relationships that could be construed as a potential conflict of interest.
All claims expressed in this article are solely those of the authors and do not necessarily represent those of their affiliated organizations, or those of the publisher, the editors and the reviewers. Any product that may be evaluated in this article, or claim that may be made by its manufacturer, is not guaranteed or endorsed by the publisher.
The Supplementary material for this article can be found online at: https://www.frontiersin.org/articles/10.3389/fclim.2023.1235886/full#supplementary-material
Ariluoma, M., Ottelin, J., Hautamäki, R., Tuhkanen, E. M., and Mänttäri, M. (2021). Carbon sequestration and storage potential of urban green in residential yards: a case study from Helsinki. Urban For. Urban Green. 57:126939. doi: 10.1016/J.UFUG.2020.126939
Caridi, D., Spampinato, G., and Grasso, S. (2009). Manuale Delle Procedure Della Cartografia Di Uso e Copertura Del Suolo Regione Calabria. Agenzia Regionale per Lo Sviluppo e per i Servizi in Agricoltura.
Cerana, Linda . (2016). Il Calcolo Dell’impronta Carbonica Dell’Ateneo Di Padova. Università degli Studi di Padova.
Chen, J., Saunders, S. C., Crow, T. R., Naiman, R. J., Brosofske, K. D., Mroz, G. D., et al. (1999). Microclimate in forest ecosystem and landscape ecology variations in local climate can be used to monitor and compare the effects of different management regimes. Bioscience 49, 288–297. doi: 10.2307/1313612
Comune di Padova (2004). Padova, Città d’acque. Un Modo Diverso per Conoscere La Città. Padova, Italia: Ufficio Turismo Settore Comunicazioni ai Cittadini. Available at: www.padovanet.iwww.padovanet.it. (Accessed April 28, 2022).
Comune di Padova (2021). La Statistica per La Città. Demografia Del Mese: Ottobre 2021. 2021. Available at: https://www.padovanet.it/sites/default/files/attachment/Demo202110.pdf. (Accessed April 28, 2022).
Comune di Padova (2022). Il Piano Del Verde Del Comune Di Padova. Premessa. Padova. Available at: http://www.padovanet.it/piano-del-verde-comunale/1_ALL-00_ColophonPremessa.pdf. (Accessed April 28, 2022).
De Biaso Calimani, L. ed. (1996). Padova: Il Verde Urbano. Riconversione Ecologica Della Città. Piccin Nuova Libraria.
Dushkova, D., and Haase, D. (2020). Not simply green: nature-based solutions as a concept and practical approach for sustainability studies and planning agendas in cities. Land 9:19. doi: 10.3390/LAND9010019
Eden, S. E., and Tunstall, S. (2016). Ecological versus social restoration? How Urban River restoration challenges but also fails to challenge the science – policy Nexus in the United Kingdom. Environ. Plan. C Polit. Space 24, 661–680. doi: 10.1068/C0608J
European Commission (2013). Green infrastructure (GI) — enhancing Europe’s natural capital. COM(2013) 249 final. Brussels. Available at: https://eur-lex.europa.eu/resource.html?uri=cellar:d41348f2-01d5-4abe-b817-4c73e6f1b2df.0014.03/DOC_1&format=PDF. (Accessed April 28, 2022).
European Commission (2015). Towards an EU research and innovation policy agenda for nature-based solutions & re-Naturing cities. Luxembourg.
European Commission (2019). Communication from the commission to the European Parliament, the European council, the council, the European economic and social committee and the Committee of the Regions. The European Green Deal. Brussels.
European Commission (2022a). Commission announces 100 cities participating in EU Mission. Available at: https://ec.europa.eu/commission/presscorner/detail/en/IP_22_2591 [Accessed April 28, 2022].
European Commission (2022b). Proposal for a regulation of the European Parliament and of the council on nature restoration. Brussels.
Gkiatas, G., Kasapidis, I., Koutalakis, P., Iakovoglou, V., Savvopoulou, A., Germantzidis, I., et al. (2021). Enhancing urban and sub-urban riparian areas through ecosystem services and ecotourism activities. Water Supply 21, 2974–2988. doi: 10.2166/WS.2021.114
González, E., Felipe-Lucia, M. R., Bourgeois, B., Boz, B., Nilsson, C., Palmer, G., et al. (2017). Integrative conservation of riparian zones. Biol. Conserv. 211, 20–29. doi: 10.1016/J.BIOCON.2016.10.035
Griscom, B. W., Adams, J., Ellis, P. W., Houghton, R. A., Lomax, G., Miteva, D. A., et al. (2017). Natural climate solutions. Proc. Natl. Acad. Sci. U. S. A. 114, 11645–11650. doi: 10.1073/PNAS.1710465114/SUPPL_FILE/PNAS.1710465114.SAPP.PDF
Haase, D. (2017). “Urban wetlands and riparian forests as a nature-based solution for climate change adaptation in cities and their surroundings” in Nature-based solutions to climate change adaptation in urban areas. Linkages between science, policy and practice. eds. N. Kabisch, H. Korn, J. Stadler, and A. Bonn (Cham, Switzerland: Springer), 111–122.
IPCC (2021). Climate change 2021: The physical science basis. Contribution of Working Group I to the Sixth Assessment Report of the Intergovernmental Panel on Climate Change. Available at: https://www.ipcc.ch/report/ar6/wg1/downloads/report/IPCC_AR6_WGI_Full_Report.pdf. (Accessed April 28, 2022).
Johnston, M. (1996). A brief history of Urban forestry in the United States. Int. J. Urban For. 20, 257–278. doi: 10.1080/03071375.1996.9747122
Khirfan, L., Mohtat, N., and Daub, B. (2021). Reading an urban palimpsest: how the gradual loss of an urban stream impacts urban Form’s connections and ecosystem functions. Front. Water 3:155. doi: 10.3389/FRWA.2021.754679/BIBTEX
Khirfan, L., Mohtat, N., and Peck, M. (2020). A systematic literature review and content analysis combination to ‘shed some light’ on stream daylighting (Deculverting). Water Security 10:100067. doi: 10.1016/J.WASEC.2020.100067
Kondolf, G. M., and Pinto, P. J. (2017). The social connectivity of urban Rivers. Geomorphology 277, 182–196. doi: 10.1016/J.GEOMORPH.2016.09.028
Lal, R. (2007). Carbon Sequestration. Philos. Trans. R. Soc. B 363, 815–830. doi: 10.1098/RSTB.2007.2185
Lal, R., Negassa, W., and Lorenz, K. (2015). Carbon sequestration in soil. Curr. Opin. Environ. Sustain. 15, 79–86. doi: 10.1016/J.COSUST.2015.09.002
McEwen, L., Barnes, L. G., Phillips, K., and Biggs, I. (2020). Reweaving urban water-community relations: creative, Participatory River ‘daylighting’ and local Hydrocitizenship. Trans. Inst. Br. Geogr. 45, 779–801. doi: 10.1111/TRAN.12375
McPhearson, P. T., Feller, M., Felson, A., Karty, R., Lu, J. W. T., and Timon, P. (2010). Assessing the effects of the urban Forest restoration effort of MillionTreesNYC on the structure and functioning of new York City ecosystems. Cities Environ. 3, 1–21. doi: 10.15365/cate.3172010
McPherson, E. G. (1998). Atmospheric carbon dioxide reduction by Sacramento’s urban Forest. J. Arboric. 24, 215–223.
McPherson, E. G., Simpson, J. R., Xiao, Q., and Chunxia, W. (2011). Million trees Los Angeles canopy cover and benefit assessment. Landsc. Urban Plan. 99, 40–50. doi: 10.1016/J.LANDURBPLAN.2010.08.011
Moran, D., Pichler, P. P., Zheng, H., Muri, H., Klenner, J., Kramel, D., et al. (2022). Estimating CO2emissions for 108000 European cities. Earth Syst. Sci. Data 14, 845–864. doi: 10.5194/ESSD-14-845-2022
Moser, A., Rötzer, T., Pauleit, S., and Pretzsch, H. (2015). Structure and ecosystem Services of Small-Leaved Lime (Tilia Cordata Mill.) and black locust (Robinia Pseudoacacia L.) in urban environments. Urban For. Urban Green. 14, 1110–1121. doi: 10.1016/J.UFUG.2015.10.005
Naiman, R. J., Décamps, H., and McClain, M. E. (2005). Riparia: Ecology conservation and management of streamside communities Burlington, MA (USA): Elsevier.
Napieralski, J. A., and Carvalhaes, T. (2016). Urban stream deserts: mapping a legacy of urbanization in the United States. Appl. Geogr. 67, 129–139. doi: 10.1016/J.APGEOG.2015.12.008
Natural Capital Project (2021). InVEST. 2021. Available at: https://naturalcapitalproject.stanford.edu/software/invest.
Natural Capital Project (2022). InVEST 3.12.0. User’s guide. Available at: https://storage.googleapis.com/releases.naturalcapitalproject.org/invest-userguide/latest/index.html. (Accessed April 28, 2022).
Nava-López, M. Z., Diemont, S. A. W., Hall, M., and Ávila-Akerberg, V. (2016). Riparian buffer zone and whole watershed influences on river water quality: implications for ecosystem services near megacities. Environ. Proc. 3, 277–305. doi: 10.1007/S40710-016-0145-3/TABLES/9
NParks Singapore 2020 (2020). One MillionTrees Movement. 2020. Available at: https://www.nparks.gov.sg/treessg/one-million-trees-movement. (Accessed April 28, 2022).
Pappalardo, E. S., Carlo, Z., and Valeria, T. (2023). “Mapping Urban Heat Islands and Heat-Related Risk during Heat Waves from a Climate Justice Perspective: A Case Study in the Municipality of Padua (Italy) for Inclusive Adaptation Policies”. Landscape and Urban Planning 238:104831. doi: 10.1016/J.LANDURBPLAN.2023.104831
Peroni, F., Pristeri, G., Codato, D., Pappalardo, S. E., and De Marchi, M. (2019). Biotope area factor: an ecological urban index to Geovisualize soil sealing in Padua, Italy. Sustainability 12:150. doi: 10.3390/SU12010150
Peroni, F., Salvatore, E. P., Francesco, F., Edoardo, C., Michele, M., Michael, E. H., et al. (2022). How to Map Soil Sealing, Land Take and Impervious Surfaces? A Systematic Review. Environ. Res. Lett. 17:053005. doi: 10.1088/1748-9326/AC6887
Petts, Geoffrey E., and Amoros, C.. (1996). Fluvial Hydrosystems. 1st ed. London, New York: Chapman & Hall.
Pontius, R. G., Shusas, E., and McEachern, M. (2004). Detecting important categorical land changes while accounting for persistence. Agric. Ecosyst. Environ. 101, 251–268. doi: 10.1016/J.AGEE.2003.09.008
Pristeri, G., Peroni, F., Pappalardo, S. E., Codato, D., Masi, A., and De Marchi, M. (2021). Whose urban green? Mapping and classifying public and private green spaces in Padua for spatial planning policies. ISPRS Int. J. Geo Inf. 10:538. doi: 10.3390/IJGI10080538
Pristeri, G., Francesca, P., Salvatore, E. P., Daniele, C., Anna, G. C., Antonio, M., et al. (2020). Mapping and Assessing Soil Sealing in Padua Municipality through Biotope Area Factor Index. Sustainability 12, 5167. doi: 10.3390/SU12125167
Regione del Veneto (2017). Legge Regionale 6 Giugno 2017, n. 14. Disposizioni per Il Contenimento Del Consumo Di Suolo e Modifiche Della Legge Regionale 23 Aprile 2004, n. 11 Norme per Il Governo Del Territorio e in Materia Di Paesaggio. Venezia, Italy. Available at: https://bur.regione.veneto.it/BurvServices/pubblica/DettaglioLegge.aspx?id=346720. (Accessed April 28, 2022).
Repubblica Italiana (1985). Disposizioni Urgenti per La Tutela Delle Zone Di Particolare Interesse Ambientale. Rome. Available at: https://www.gazzettaufficiale.it/eli/id/1985/08/22/085U0431/sg.
Repubblica Italiana (2004). D.L. 22 Gennaio 2004, n. 42 | Codice Dei Beni Culturali e Del Paesaggio. Available at: https://www.gazzettaufficiale.it/atto/serie_generale/caricaDettaglioAtto/originario?atto.dataPubblicazioneGazzetta=2004-02-24&atto.codiceRedazionale=004G0066. (Accessed April 28, 2022).
Rink, D. (2011). Urban shrinkage as a problem of post-socialist transformation. The case of eastern Germany. Soc. Român. 9, 20–34.
Rink, D., and Schmidt, C. (2021). Afforestation of urban brownfields as a nature-based solution. Exp. Project Leipzig 10:893. doi: 10.3390/LAND10090893
Sallustio, L., Quatrini, V., Geneletti, D., Corona, P., and Marchetti, M. (2015). Assessing land take by urban development and its impact on carbon storage: findings from two case studies in Italy. Environ. Impact Assess. Rev. 54, 80–90. doi: 10.1016/j.eiar.2015.05.006
Smith, P. (2004). Carbon sequestration in croplands: the potential in Europe and the global context. Eur. J. Agron. 20, 229–236. doi: 10.1016/J.EJA.2003.08.002
Standford University (2022). Natural Capital Project. 2022. Available at: https://naturalcapitalproject.stanford.edu/. (Accessed April 28, 2022).
Stefano Boeri Architetti (2021). Piano Degli Interventi Di Padova | Presentazione. 2021. Available at: https://www.stefanoboeriarchitetti.net/notizie/piano-degli-interventi-di-padova-presentazione/. (Accessed April 28, 2022).
Sutfin, N. A., Wohl, E. E., and Dwire, K. A. (2016). Banking carbon: a review of organic carbon storage and physical factors influencing retention in floodplains and riparian ecosystems. Earth Surf. Process. Landf. 41, 38–60. doi: 10.1002/ESP.3857
Todeschi, V., Salvatore, E. P., Carlo, Z., Francesca, P., and Massimo, D. M. (2022). Climate Justice in the City: Mapping Heat-Related Risk for Climate Change Mitigation of the Urban and Peri-Urban Area of Padua (Italy). ISPRS Int. J. Geo-Inf. 11:490. doi: 10.3390/IJGI11090490
Tuofu, H., Qingyun, H., Dongxiao, Y., and Xiao, O. (2021). Evaluating the impact of urban blue space accessibility on housing Price: a spatial quantile regression approach applied in Changsha, China. Front. Environ. Sci. 9:164. doi: 10.3389/FENVS.2021.696626/BIBTEX
United Nations (2019). United Nations decade on ecosystem restoration (2021–2030). Resolution adopted by the general assembly on 1 march 2019. Available at: https://undocs.org/A/RES/73/284. (Accessed April 28, 2022).
Urbanič, G., Politti, E., Rodríguez-González, P. M., Payne, R., Schook, D., Alves, M. H., et al. (2022). Riparian zones—from policy neglected to policy integrated. Front. Environ. Sci. 452. doi: 10.3389/FENVS.2022.868527
Valera Lozano, A., Añóvidal, C., and Sánchez Díaz, J. (2019). Urban growth (1956-2012) and soil sealing in the metropolitan area of Valencia (eastern Spain). Spanish J. Soil Sci. 9, 88–104. doi: 10.3232/SJSS.2019.V9.N2.03
Velasco, E., Roth, M., Norford, L., and Molina, L. T. (2016). Does urban vegetation enhance carbon sequestration? Landsc. Urban Plan. 148, 99–107. doi: 10.1016/J.LANDURBPLAN.2015.12.003
Veldman, J. W., Aleman, J. C., Alvarado, S. T., Michael Anderson, T., Archibald, S., Bond, W. J., et al. (2019). Comment on ‘The Global Tree Restoration Potential’. Science 366. doi: 10.1126/SCIENCE.AAY7976
Völker, S., Baumeister, H., Classen, T., Hornberg, C., and Kistemann, T. (2013). Evidence for the temperature-mitigating capacity of urban blue space - a health geographic perspective. Erdkunde 67, 355–371. doi: 10.3112/ERDKUNDE.2013.04.05
Völker, S., and Kistemann, T. (2011). The impact of blue space on human health and well-being – Salutogenetic health effects of inland surface waters: a review. Int. J. Hyg. Environ. Health 214, 449–460. doi: 10.1016/J.IJHEH.2011.05.001
Vollmer, D., Prescott, M. F., Padawangi, R., Girot, C., and Grêt-Regamey, A. (2015). Understanding the value of urban riparian corridors: considerations in planning for cultural services along an Indonesian river. Landsc. Urban Plan. 138, 144–154. doi: 10.1016/J.LANDURBPLAN.2015.02.011
Wild, T. C., Bernet, J. F., Westling, E. L., and Lerner, D. N. (2011). Deculverting: reviewing the evidence on the ‘daylighting’ and restoration of culverted Rivers. Water Environ. J. 25, 412–421. doi: 10.1111/J.1747-6593.2010.00236.X
Wownature (2022). Padua O2 Project. Available at: https://www.wownature.eu/en/urban-forest-padova-o2-project/ [Accessed May 17, 2022].
Yao, N., Cecil, C., van den Bosch, K., Jun Yang, T., Devisscher, Z. W., Jia, L., et al. (2019). Beijing’s 50 million new urban trees: strategic governance for large-scale urban afforestation. Urban For. Urban Green. 44:126392. doi: 10.1016/J.UFUG.2019.126392
Keywords: urban ecosystem services, urban riparian ecosystem, carbon sequestration, green infrastructures, nature-based solutions, climate change adaptation
Citation: Peroni F, Codato D, Buscemi L, Cibrario M, Pappalardo SE and De Marchi M (2023) Rethinking urban riparian ecosystems as a frontline strategy to counter climate change: mapping 60 years of carbon sequestration evolution in Padua, Italy. Front. Clim. 5:1235886. doi: 10.3389/fclim.2023.1235886
Edited by:
Waqas Ahmed Mahar, Balochistan University of Information Technology, Engineering and Management Sciences, PakistanReviewed by:
Manob Das, University of Gour Banga, IndiaCopyright © 2023 Peroni, Codato, Buscemi, Cibrario, Pappalardo and De Marchi. This is an open-access article distributed under the terms of the Creative Commons Attribution License (CC BY). The use, distribution or reproduction in other forums is permitted, provided the original author(s) and the copyright owner(s) are credited and that the original publication in this journal is cited, in accordance with accepted academic practice. No use, distribution or reproduction is permitted which does not comply with these terms.
*Correspondence: Francesca Peroni, ZnJhbmNlc2NhLnBlcm9uaUB1bmlwZC5pdA==
Disclaimer: All claims expressed in this article are solely those of the authors and do not necessarily represent those of their affiliated organizations, or those of the publisher, the editors and the reviewers. Any product that may be evaluated in this article or claim that may be made by its manufacturer is not guaranteed or endorsed by the publisher.
Research integrity at Frontiers
Learn more about the work of our research integrity team to safeguard the quality of each article we publish.