- 1AGRHYMET RCC-WAS, Department of Information and Research, Niamey, Niger
- 2Université d'Abomey-Calavi, Ecole Doctorale des Sciences Agronomiques et de l'Eau, Abomey-Calavi, Benin
- 3Laboratoire d'hydrologie appliquée, Université d'Abomey-Calavi, Abomey-Calavi, Benin
- 4Earth Observation and Space Research Division, Department of Meteorology, University of Reading, Reading, United Kingdom
Satellite rainfall estimation products (SRPs) can help overcome the absence of rain gauge data to monitor rainfall-related risks and provide early warning. However, SRPs can be subject to several sources of errors and need to be validated before specific uses. In this study, a comprehensive validation of nine high spatial resolution SRPs (less than 10 km) was performed on monthly and dekadal time scales for the period 2001–2015 in West Africa. Both SRPs and reference data were remapped to a spatial resolution of 0.1 ° and the validation process was carried out on a grid scale, with 1,202 grids having at least one rain gauge throughout West Africa. Unconditional statistical metrics, such as mean absolute error, Pearson correlation, Kling-Gupta efficiency and relative bias, as well as the reproducibility of rainfall seasonality, were used to describe the agreement between SRPs and reference data. The PROMETHEE II multi-criteria decision analysis (MCDA) method was employed to rank SRPs by considering criteria encompassing both their intrinsic characteristics and performance metrics. Overall, IMERGv6-Final, MSWEPv2.2, RFE2, ARC2, and TAMSATv3.1, performed reasonably well, regardless of West African climate zones and rainy season period. Given the performances displayed by each of these SRPs, RFE2, ARC2, and MSWEPv2.2 would be suitable for drought monitoring. TAMSATv3.1, IMERGv6-Final, RFE2, ARC2, and MSWEPv2.2 are recommended for comprehensive basin water resources assessments. TAMSATv3.1 and MSWEPv2.2 would be of interest for the characterization of variability and long-term changes in precipitation. Finally, TAMSATv3.1, ARC2, and MSWEPv2.2, could be good alternatives to observed data as predictants in West African Regional Climate Outlook Forum (RCOF) process.
1. Introduction
High variability in rainfall and the resurgence of extreme hydro-meteorological events such as floods, droughts, and heavy rains have highlighted the vulnerability of humans and ecosystems in West Africa. The agricultural sector, a crucial component of the population's survival, relies heavily on rainfall. Indeed, significant production losses may result from decreases in water resources and increases in waterborne diseases with deviations from normal precipitation levels. To address these challenges, it is essential to have accurate rainfall data in the region to track changes in the rainfall pattern over time and for practical applications in hydrology and agriculture. This information will help mitigate the risks associated with rainfall.
Different methods, such as rain gauges, radar, satellite sensors, and, more recently, microwave signals from commercial cellular networks, have been used to measure rainfall. Rain gauges are the most accurate method, but the data collected is only representative of a small area around the gauge. Therefore, a dense network of gauges is needed for reliable precipitation analyses. In West Africa, the rainfall network is sparse with often incomplete historical series (Dembélé and Zwart, 2016; Maidment et al., 2017), making it challenging to gather accurate data. Additionally, real-time data transmission is difficult, slowing down the dissemination of information for decision-making (Nicholson et al., 2003a).
Advances in remote sensing science have allowed for the estimation of rainfall from satellite observations using microwave and infrared spectral bands. This provides a viable alternative to traditional ground-based precipitation measurement methods in West Africa, as it offers continuous coverage with high spatiotemporal resolution. Organizations such as the AGRHYMET Regional Climate Center for West Africa and the Sahel (AGRHYMET RCC-WAS) use these satellite-based estimates for climate monitoring and decision-making. However, there are sources of error such as gaps in revisiting times, a weak correlation between remote sensing signals and precipitation rates, and atmospheric effects that alter the radiation field (Bitew and Gebremichael, 2011). Thus, it is important to conduct validation studies to determine the error in the estimation and ensure confidence in the use of these satellite products for various applications.
Several studies have been conducted in West Africa to validate SRPs. Early studies include Laurent et al. (1998), Ali et al. (2005), Roca et al. (2010), Novella and Thiaw (2010), Jobard et al. (2011), and Pierre et al. (2011) that focused on the Sahel subregion, and Nicholson et al. (2003a), Nicholson et al. (2003b), and Lamptey (2008) on a larger scale in West Africa. Ali et al. (2005) compared GPCC and three satellite-based products (CMAP, GPCP, and GPI) over the Sahel using a network of AGRHYMET RCC-WAS rain gauges at a monthly scale and a spatial resolution of 2.5°. They found that CMAP performed the best, followed by GPCC and GPCP, with GPI being far behind. Comparing three satellite-based products (EPSAT-SG, GSMAP, and TMPA) with a rain gauge network (580 rain gauges) over the Sahel, Roca et al. (2010) showed that combined infrared–microwave (IR–MW) satellite products described rainfall variability similar to ground measurements. Novella and Thiaw (2010) compared the gauge-only product CPC unified to five satellite-based products over the Sahel and found the good performance of RFE2 and CMORPH in discriminating rainfall occurrences and good accuracy of RFE, ARC2, and CPC unified. Jobard et al. (2011) found that near-real-time products 3B42-RT, CMORPH, and PERSIANN performed poorly compared to other products considered for intercomparison. Regional products EPSAT-SG, TAMSAT, and RFE2 had the best performance compared to global products. Nicholson et al. (2003a) assessed gauge-only (GPCC), satellite (GPI, SSM/I), and blended rainfall (GPCP) products over West Africa using 515 rain gauges datasets. They found that the mean fields derived from the gauge network, the GPCC gauge-only analysis, and the GPCP were similar, but there were large systematic errors in the satellite-only products with biases of 20 and 40% for the mean rain field as a whole and much larger biases in individual years.
The most recent studies have focused more on the country level (Gosset et al., 2013, 2018; Amekudzi et al., 2016; Dembélé and Zwart, 2016; Akinyemi et al., 2020; Atiah et al., 2020a,b; Dembélé et al., 2020; Ogbu et al., 2020; Abdourahamane, 2021) except Satgé et al. (2020). Such studies have revealed the adequacy/inadequacy of SRPs at small scales generally in areas with diverse climates, complex topographies, coastal regions, and forest zones. Two dense research gauge networks from the AMMA-CATCH observing system in Benin (Sudanian area) and Niger (Sahelian area), were used by Gosset et al. (2013) to evaluate eight global (PERSIANN, CMORPH, TMPA 3B42-RT, GSMaP, GSMaP-RT, GPCP-1DD, TMPA 3B4) and regional (RFE2, EPSAT-SG) satellite-based rainfall products. Regional products tend to underestimate rainfall amounts with too many days with low rainfall. Global products, especially real-time ones (GSMAP-RT, CMORPH, PERSIANN, and TRMM 3B42RT), overestimate high rainfall rates. EPSAT-SG showed the best correlation, while RFE2 showed a low correlation and bias. Dembélé and Zwart (2016) evaluated SRPs in Burkina-Faso and found that on a daily scale, all the SRPs used showed poor performance, with the best correlation observed for the CHIRPS data. On the dekadal and monthly scales, RFE2 performed the best, followed by ARC2 and CHIRPS. Another study evaluated TAPEER, GSMAP, CMORPH, PERSIANN, TMPA, and IMERG using rain gauge networks in Niger, Burkina Faso, and Benin, with TAPEER demonstrating excellent abilities, particularly over Niger and Burkina Faso (Gosset et al., 2018). The other products showed less bias in Benin, with CMORPH standing out with relatively good correlations, GSMAP slightly less, and PERSIANN having a strong bias in the Sahel. Atiah et al. (2020a) validated satellite products using gridded rain gauge data at various time scales. It was observed that the performance of the products in the country was mostly scale and location-dependent, with CHIRPS revealing a better skill on both seasonal and annual scales countrywide. In Nigeria, Akinyemi et al. (2020) compared TRMM, CHIRPS, RFE2, and NOAA with the ground reference and found CHIRPS and TRMM to be the best performing at all the locations studied. Ogbu et al. (2020) also found CHIRPS to perform the best in all Nigerian climatic zones. The evaluation of four SRPs (CHIRPSv2.0, ARC2, CMORPH, and TAMSAT) over Niger revealed that the 3-h CMORPH data set is a good sub-daily rainfall product, whereas CHIRPS and ARC2 have good potential for hydroclimatological applications on a daily, dekadal, and monthly basis (Abdourahamane, 2021).
For regional climate institutions, such as AGRHYMET RCC-WAS which monitors rainfall for seventeen countries across West and Central Africa, regional assessments are more valuable when selecting the most skillful SRP for region-wide monitoring of rainfall-related risks and providing early warning. In this regard, the most recent study was conducted by Satgé et al. (2020). They evaluated 23 gridded precipitation datasets across West Africa through direct comparisons with rain gauge measurements at daily and monthly time scales. Similar to the early studies at the regional level, the main shortcoming of this study was the limited number of rain gauges used as a reference, which was not sufficiently representative of the study area. Additionally, most previous studies at a regional scale need to be updated due to the improvements in satellite rainfall estimation algorithms and new product development over time. As such, the objective of this study is to evaluate satellite precipitation products for rainfall monitoring and early warning in West Africa. This research focuses on satellite products with a relatively high spatial resolution ( ≤ 10 km) in order to provide early rainfall warnings at the most accurate spatial scale possible.
This paper, which summarizes the main findings of the study, is divided into four parts. The first part describes the study area and the data used, including a physical description of the study area and an overview of the reference data and satellite estimates. The second part covers the methods used in the study, including the presentation of the main statistical metrics used for validation. The third and fourth parts present the results and discussion, respectively. Finally, the conclusion synthesizes the key findings of the study, along with its limitations and future perspectives.
2. Study area and data source
2.1. Study area
The study area encompasses the Economic Community of West African States (ECOWAS) and the Permanent Interstate Committee for Drought Control in the Sahel (CILSS) member countries, which are located between latitudes 3°N and 25°N, and longitudes 20°W and 25°E (Figure 1). Bordered by the Gulf of Guinea in the South, Mauritania, Mali, and Niger in the North, the highlands of Chad in the East and the Atlantic Ocean in the West, this region experiences an average annual temperature of approximately 18°C, with maximum temperatures reaching over 40°C in March/April. The West African monsoon, ocean currents, and local characteristics such as topography primarily affect the rainfall patterns in this region.
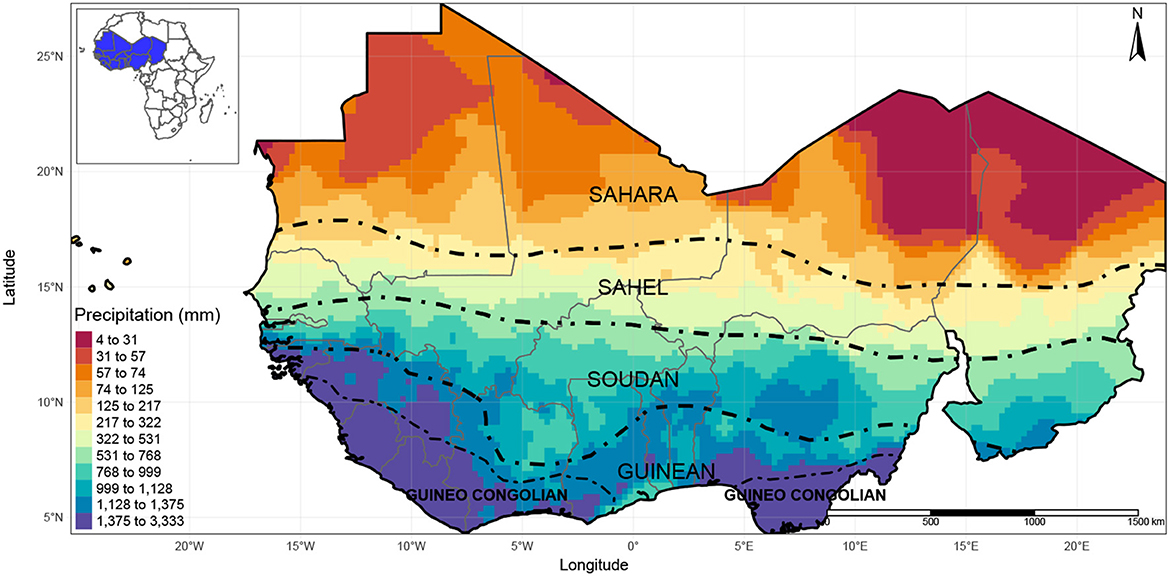
Figure 1. Map of the study area showing average annual rainfall (Period 2001–2015, AGRHYMET RCC-WAS merged product) and bioclimatic zones (CILSS, 2016).
The West African monsoon is driven by the opposition of the continental mass (the West African land surface) and the Atlantic Ocean, which results in significant differences in temperature and pressure. The wind moves from high pressures above the ocean to low pressures above the continent, thus supplying energy to the Intertropical Convergence Zone (ITCZ) and leading to heavy rainfall. The circulation of the African monsoon system, which is determined by anticyclones and thermal depressions, results in the summer monsoon in West Africa. The Intertropical Front (ITF) represents the confluence of southeasterly and southwesterly winds in the lower layers of the atmosphere. The seasonal rainfall cycle in this region is influenced by the monsoon in two phases (Lebel et al., 2009). The first phase is characterized by the gradual onset of rain from the tropical Atlantic and is referred to as the “oceanic regime.” The second phase involves a sudden increase in average daily rainfall and is referred to as the “continental regime”. The continental regime begins in late June and accounts for 75–90% of the total annual rainfall in the region.
Regarding the bioclimatic zones, the study area can be divided into five regions (Figure 1), according to CILSS (2016). The transitions between these zones represent a continuous ecological gradient. The first region is the Saharan zone, which is located in the northernmost part of the region with annual rainfall lower than 200 mm and is characterized by an arid desert climate. This is followed by the Sahelian zone, which is located southward between the 200 and 600 mm isohyets and has a semi-arid climate. The third zone is the Sudanian zone, located south of the semi-arid Sahelian strip, with an average annual rainfall of 600–1,200 mm and a dry season lasting 5–7 months. The fourth zone is the Guinean area, which is defined by an average annual rainfall of 1,200–2,200 mm, with some parts having a bimodal seasonal cycle driven by the movements of the intertropical front. It is located immediately south of the Sudanian zone. The last zone, the southernmost one, is the Guineo-Congolian region, which is the wettest in West Africa with an average annual rainfall higher than 2,200 mm.
2.2. Reference and satellite data used
The reference data used in the study was supplied by the AGRHYMET RCC-WAS and consisted of merged rain gauge and satellite precipitation products covering the period 2001–2015 at a dekadal time scale and with a spatial resolution of 5 km. The CHIRPSv2.0 data (Funk et al., 2015) represents the satellite rainfall product used by the AGRHYMET RCC-WAS in their merging process. Basically, CHIRPSv2.0 is itself a merged product and integrates several rain gauges from the study area (rain gauge in red in Figure 2). This integration is variable and depends on the availability of observations at rainfall stations. Figure 3 shows the number of rainfall stations involved at least once a year in the CHIRPSv2.0 and AGRHYMET RCC-WAS merging processes. There was a significant decrease in the number of rainfall stations included in the CHIRPSv2.0 data from 2005. The CRA's merged product aims to maximize the benefits of both data sources (satellite and rain gauges), CHIRPSv2.0 because it provides full spatial coverage, while the rain gauges from AGRHYMET RCC-WAS (1,325 rain gauges in red and black in Figure 2) provide much better information on rainfall amounts. However, the AGRHYMET RCC-WAS final merged product is not entirely independent of other satellite datasets that are being evaluated (because some of them also contain the same TIR imagery used in CHIRPS), and is also subject to constraints associated with the sharing of in-situ rainfall data. Therefore, for this study, grids of the AGRHYMET RCC-WAS merged product that had at least one rain gauge were used (Figure 2).
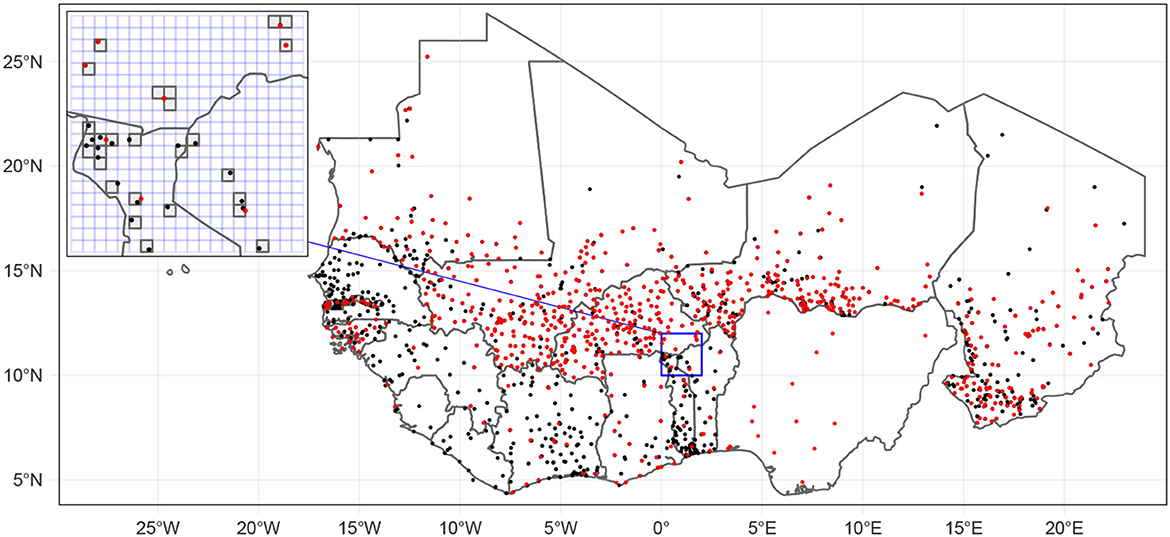
Figure 2. Rain gauges used in AGRHYMET RCC-WAS merged rainfall product (red and black dot) and those used in CHIRPSv2.0's merged product (red dot).
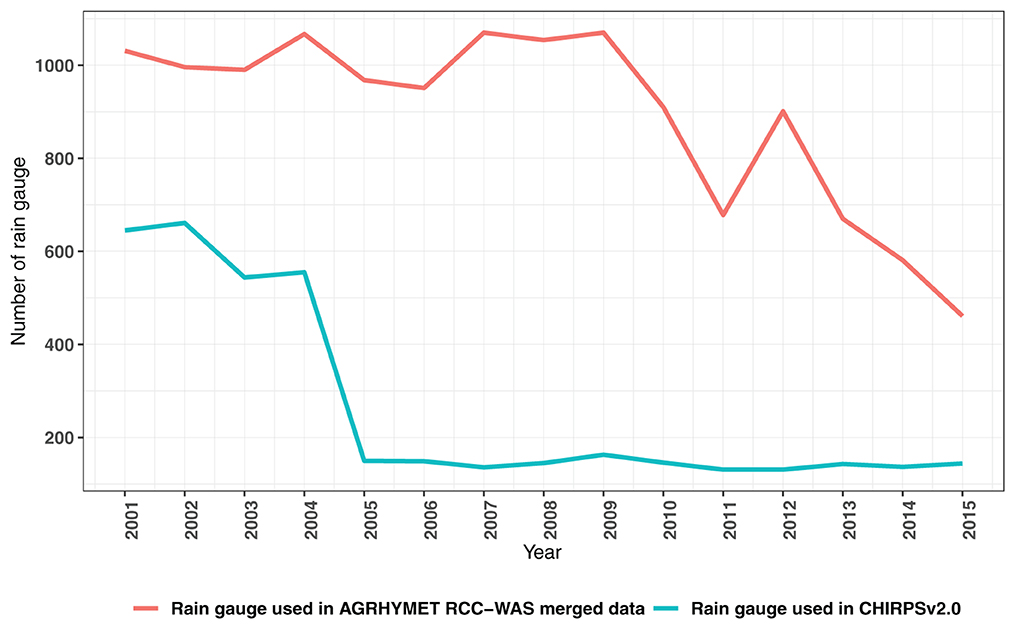
Figure 3. Annual evolution of a number of rain gauges involved in AGRHYMET RCC-WAS and CHIRPSv2.0 merged products.
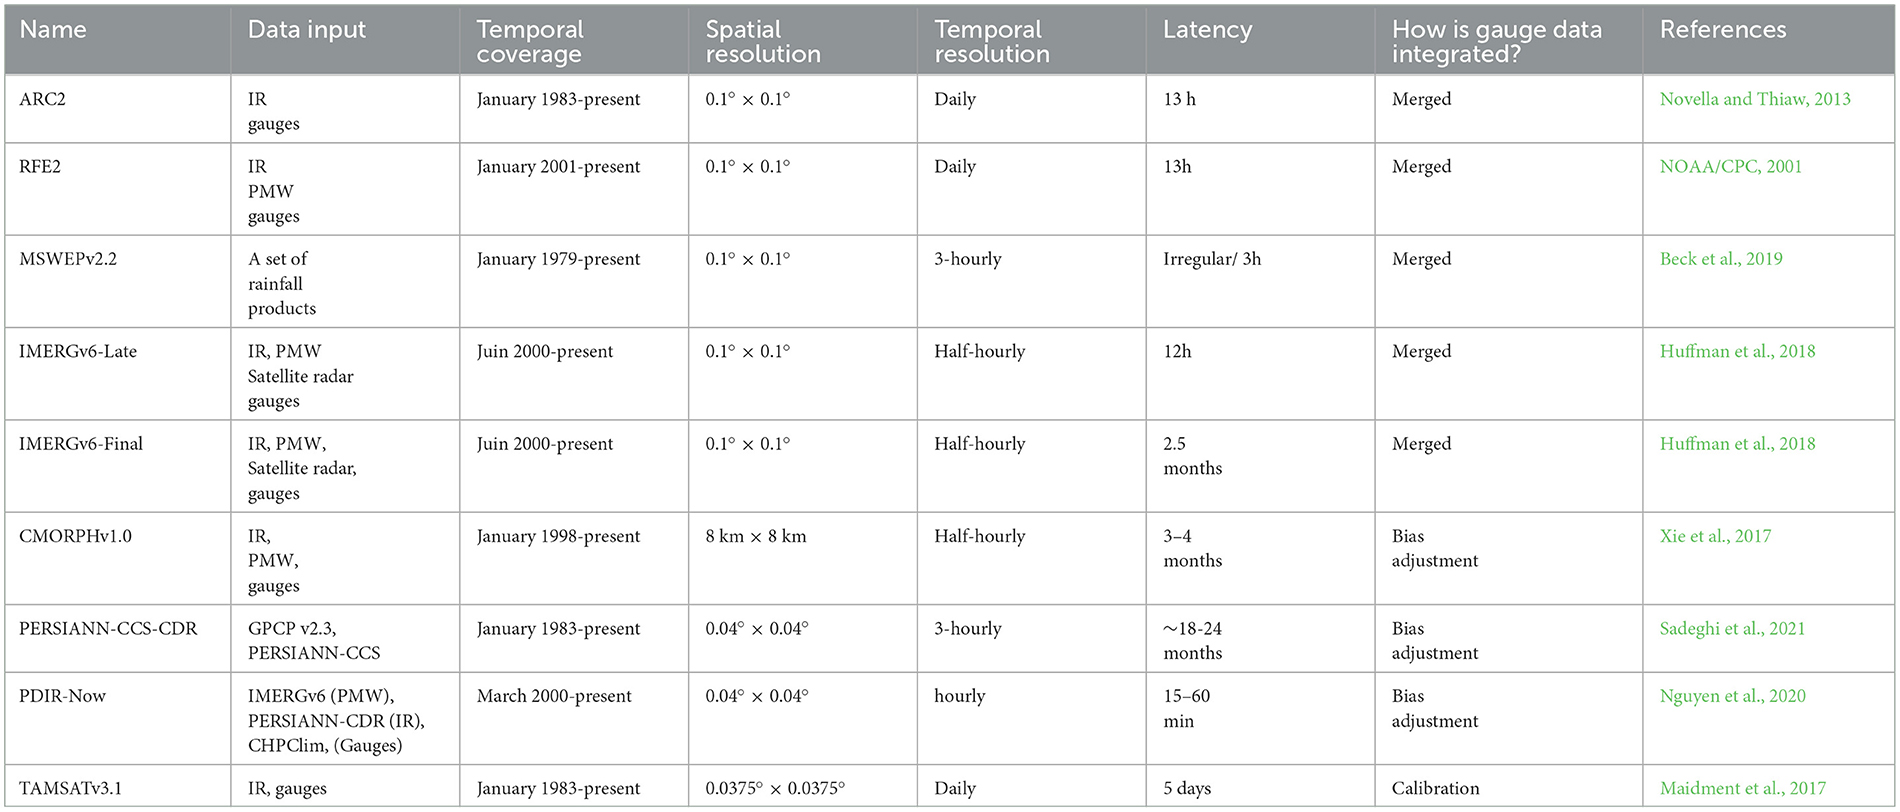
The satellite rainfall products used in the study have three key characteristics: a long historical record (at least 20 years), near real-time availability for rainfall monitoring, and a spatial resolution of 0.1° or higher. The high spatial resolution of these products is crucial because in case of abnormal rainfall, early warning systems focus on the affected area to identify the specific locations impacted and inform decision-making. Table 1 provides the specifications of the satellite rainfall products used.
3. Methods
3.1. Reference data merging
The method for merging CHIRPSv2.0 with the AGRHYMET RCC-WAS rain gauge network involves quality control of in-situ data and a simple bias adjustment, as described in Dinku et al. (2013). This bias adjustment involves extracting satellite rainfall estimates at rain gauge locations, computing the difference between the satellite estimate and rain gauge values at each station, interpolating these differences to each grid point using inverse distance weighting, and adding the interpolated differences back to the satellite estimate. The final product has a resolution of 0.05°, which is that of CHIRPsv2.0. This method is implemented using R-based software called Climate Data Tools (Dinku et al., 2022). However, the main limitation of these data is that they are difficult to update due to delays in transmitting country rain gauge data to the regional level. Additionally, the low number of rainfall stations involved in the merging process for countries like Nigeria, Sierra Leone, and Liberia means that special attention should be given to these regions for different uses.
3.2. Validation statistics
The validation was carried out over the overlapping period of 2001–2015 with all SRPs used on the dekadal and monthly timescales. These two timescales aligned with the frequency of dissemination used in most West African meteorological services for rainfall reports. SRPs with spatial resolutions higher than 0.1° and reference data were bilinearly interpolated at 0.1° to facilitate the comparison process, which was carried out on a grid scale. Across West Africa, 1202 grids (0.1°) with at least one rain gauge were considered in the validation process (Figure 2). These include 391, 542, 177, and 92 for the Sahelian, Sudanian, Guinean, and Guineo-Congolian zones, respectively.
Table 2 lists the validation statistics used in this study. Continuous statistical metrics are used to describe the agreement between SRPs and reference data and include Pearson's correlation (r), relative bias (RB), mean absolute error (MAE), and Kling-Gupta efficiency (KGE). r indicates how well the SRPs correspond to the reference data; RB is used to quantify the magnitude of the overestimation or underestimation of SRPs; MAE measures the mean deviation of the SRPs from the reference data; and KGE (Gupta et al., 2009) is used to quantify how well the SRPs can estimate the observed rainfall amount. Pearson's correlation is classified as weak when its value is less than 0.2, moderate when it falls between 0.2 and 0.5, and strong when it exceeds 0.5 (de Carvalho et al., 2017). According to Thiemig et al. (2013) and Yonaba et al. (2021), the SRP (Satellite Rainfall Product) is considered to have failed in estimating the observed rainfall amount if the KGE is less than 0.5. It is deemed acceptable if the KGE falls within the range of 0.50 to 0.75, good if it is between 0.75 and 0.9, and very good or excellent if the KGE is equal to or greater than 0.9.
For the comparison on the dekadal scale, the metrics were computed for each period of the rainy season. These are the onset, peak (full) rainfall, and cessation periods of the rainy season, determined based on the study by Dunning et al. (2016). For the onset period, the following dekads are considered by region: dekads May 1 to June 3 for the Sahel, March 3 to May 2 for the Sudan, March 2 to April 2 for the Guinean, and February 1 to April 1 for the Congolo-Guinean. The cessation period included dekads October 1 to October 3 for the Sahel, October 2 to November 1 for the Sudan and November 2 for the Guinean and Congolo-Guinean regions. The full rainfall period for each zone is comprised of the remaining dekads between onset and cessation. The presentation aims to assist climatologists in selecting the best performing SRPs for these different periods. Additionally, the metrics of the wettest months (March to October) are presented for comparison on a monthly scale.
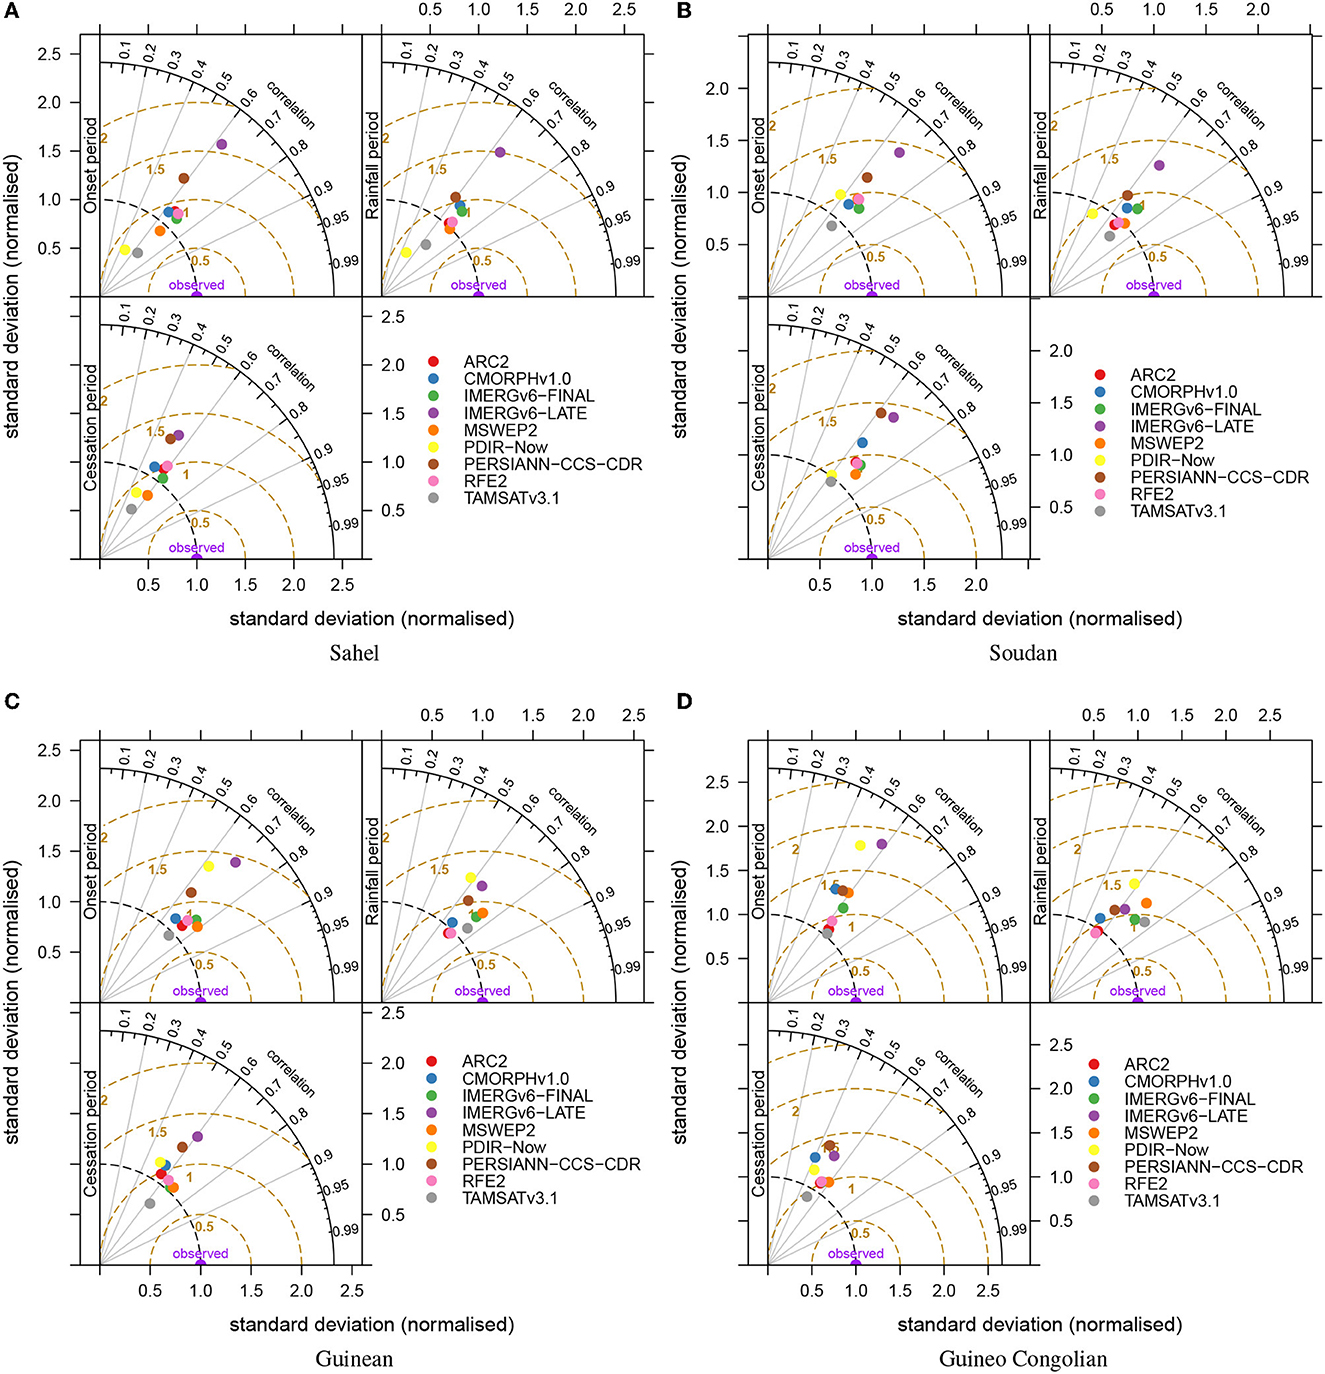
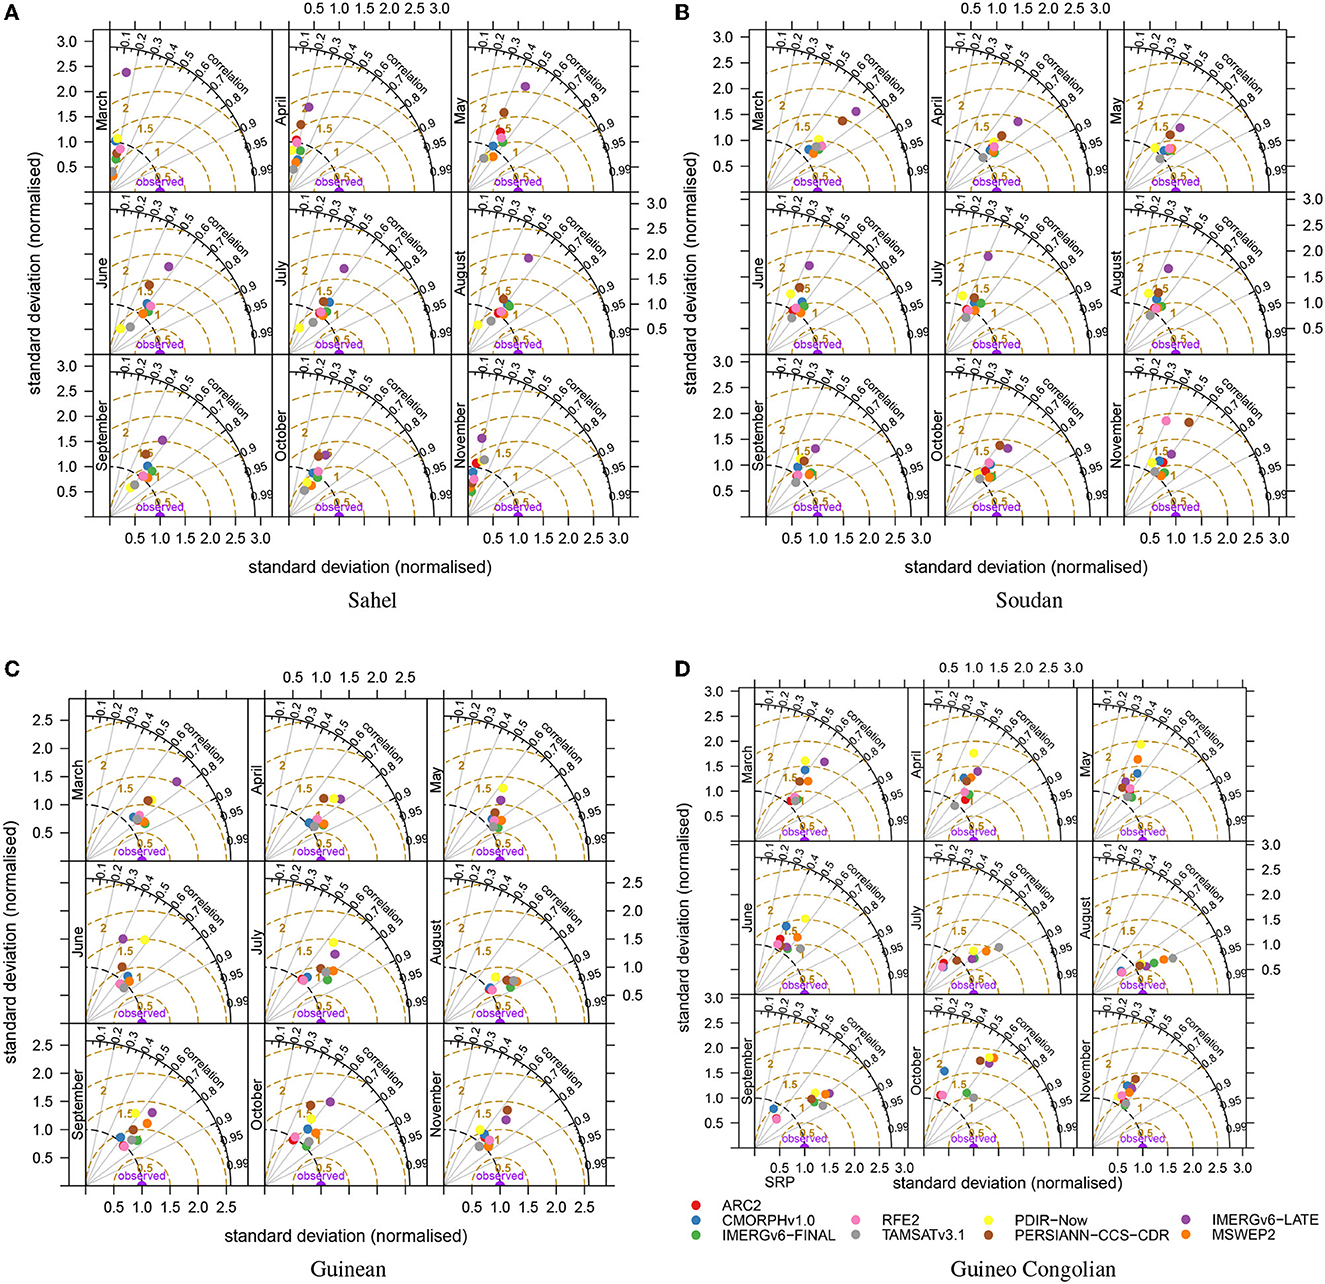
Taylor diagrams (Taylor, 2001) were used to display the global performance of SRP across each bioclimatic zone. These diagrams offer a visual tool to compare SRPs against reference data based on continuous metrics. The integrated continuous metrics include Pearson's correlation, the root mean square error, and the variance ratio between the reference values and those of SRP. In addition, the reproducibility of the seasonal cycle by different SRPs was assessed in four major bioclimatic zones in West Africa, namely Sahelian, Sudanian, Guinean, and Guineo-Congolian (see Figure 1). To accomplish this, the average monthly rainfall was computed from the rain gauge data for the delimited regions within each bioclimatic zone.
3.3. Ranking of satellite rainfall estimation products
MCDA's PROMETHEE II (Behzadian et al., 2010 and Greco and Greco, 2015 for further details) method was used to rank SRPs (referred to as alternatives) considering various criteria, including their intrinsic characteristics (which are important in rainfall monitoring and early warning) and their performances, such as correlation, MAE, RB, KGE and seasonal cycle reproducibility. Their intrinsic characteristics considered are temporal coverage, spatial resolution and latency. The performance metrics were computed for all grids within each zone and for each period for the dekadal analysis. For the monthly analysis, the metrics were computed for all months collectively, not independently, for each month. Two rankings were conducted, the first considering only performance metrics weighted equally (0.2) and the second considering all criteria. In the latter case, Table 3 displays each criterion's weight, preference function, preference and indifference threshold, and the direction of the criterion. The weights assigned to the criteria consider the criterion's importance in producing information for rainfall monitoring and early warning. Thus, the criteria on the performance of the SRPs have more weight (0.14) than all the other criteria. This is followed by the latency criterion (with a weight of 0.12), which is very important, as the timeliness of rainfall information gives users sufficient time to implement strategies. A latency of more than 5 days, for example, is almost useless in the production of rainfall monitoring reports. A weight of 0.105 is assigned to the temporal coverage criterion. SRPs with good temporal depth allow the characterization of rainfall anomalies, rainfall variability, and long-term changes. For these analyses, it is recommended to consider time series of at least 30 years (WMO, 2007). The spatial resolution has the lowest weight, as the SRPs considered already have a resolution of less than 0.1°. Among the performance criteria, the seasonal cycle reproducibility is considered as a criterion level with the levels very good, good, average, bad and very bad. These levels are coded from 1 to 5, with 1 considered very bad. Relative bias is classified into 7 classes: −100 ≤ RB < −80, −80 ≤ RB < −40, −40 ≤ RB < −20, −20 ≤ RB ≤ 20, 20 < RB ≤ 40, 40 < RB ≤ 80, 80 < RB ≤ 100 and coded 4 for classes −100 ≤ RB < −80 and 80 < RB ≤ 100, 3 for classes −80 ≤ RB < −40 and 40 < RB ≤ 80, 2 for classes −40 ≤ RB < −20 and 20 < RB ≤ 40 and 1 for class −20 ≤ RB ≤ 20. KGE is classified on the basis of the work of Yonaba et al. (2021). Class −∞ < KGE < 0 coded 1, class 0 ≤ KGE < 0.5 coded 2, class 0.5 ≤ KGE < 0.75 coded 3, class 0.75 ≤ KGE < 0.9 coded 4, and class KGE≥0.9 coded 5. SRPs latencies were converted to days and spatial resolutions to km. The temporal coverage was categorized into three classes: class 1, coded as SRPs with a temporal coverage of less than 20 years; class 2, coded as SRPs with a temporal coverage between 20 and 30 years; and class 3, coded as SRPs with a temporal coverage of more than 30 years. The first ranking differs from the second only in terms of weight and the criteria taken into account. The decision matrix used for the Sahelian zone and the rainfall period at the dekadal timescale is provided as an example in Table 4.

Table 3. Criteria with their weight, preference function, preference and indifference threshold, and the direction of the criterion.

Table 4. Decision matrix used for the Sahelian zone and the rainfall period at the dekadal timescale.
4. Results
4.1. Performance of satellite rainfall estimation products across individual grid cells and bioclimate zones
Figures 4–7 display the correlation coefficient, mean absolute error, relative bias, and Kling-Gupta efficiency for the dekadal and monthly comparison. For dekadal data comparison, the correlation coefficients between the SRPs and reference data are greater than 0.2 for over 60% of the grids examined, regardless of climatic zone, onset, cessation, or peak rainfall periods (Figure 4A). In the Sahel region, during the onset, over 75% of the grids indicate good correlation (>0.5) with the reference data for all SRPs except PDIR-Now, with MSWEPv2.2, IMERGv6-FINAL, ARC2, TAMSATv3.1, and RFE2 displaying the strongest correlation. During the peak rainfall period, all SRPs showed better correlations in the Sahel, with MSWEPv2.2 performing the best. During the cessation period, IMERGv6-FINAL performed well, with over 75% of grids exhibiting a correlation greater than 0.5. In the Sudanian region, PDIR-Now had the worst correlation with the reference data regardless of the season period, while MSWEPv2.2, IMERGv6-FINAL, IMERGv6-LATE, ARC2, TAMSATv3.1, and RFE2 were the best correlated with over 75% of the grids displaying a correlation greater than 0.5. In the Guinean region, during the peak and cessation of the rainy season, MSWEPv2.2, IMERGv6-FINAL, TAMSATv3.1, and RFE2 outperformed all other SRPs. During the onset period, MSWEPv2.2, IMERGv6-FINAL, RFE2, and ARC2 exhibited better performance than other SRPs, with fewer grids having a correlation greater than 0.5. During the onset and cessation periods of the rainy season in the Guineo-Congolian region, MSWEPv2.2, ARC2, the two IMERGs, and TAMSATv3.1 products showed good correlation with reference data compared to other SRPs. TAMSATv3.1 outperformed all other SRPs in terms of correlation during the peak rainfall period, with over 70% of the grids displaying good correlation. MSWEPv2.2, the IMERG products, ARC2, and RFE2 followed as the next best SRPs.
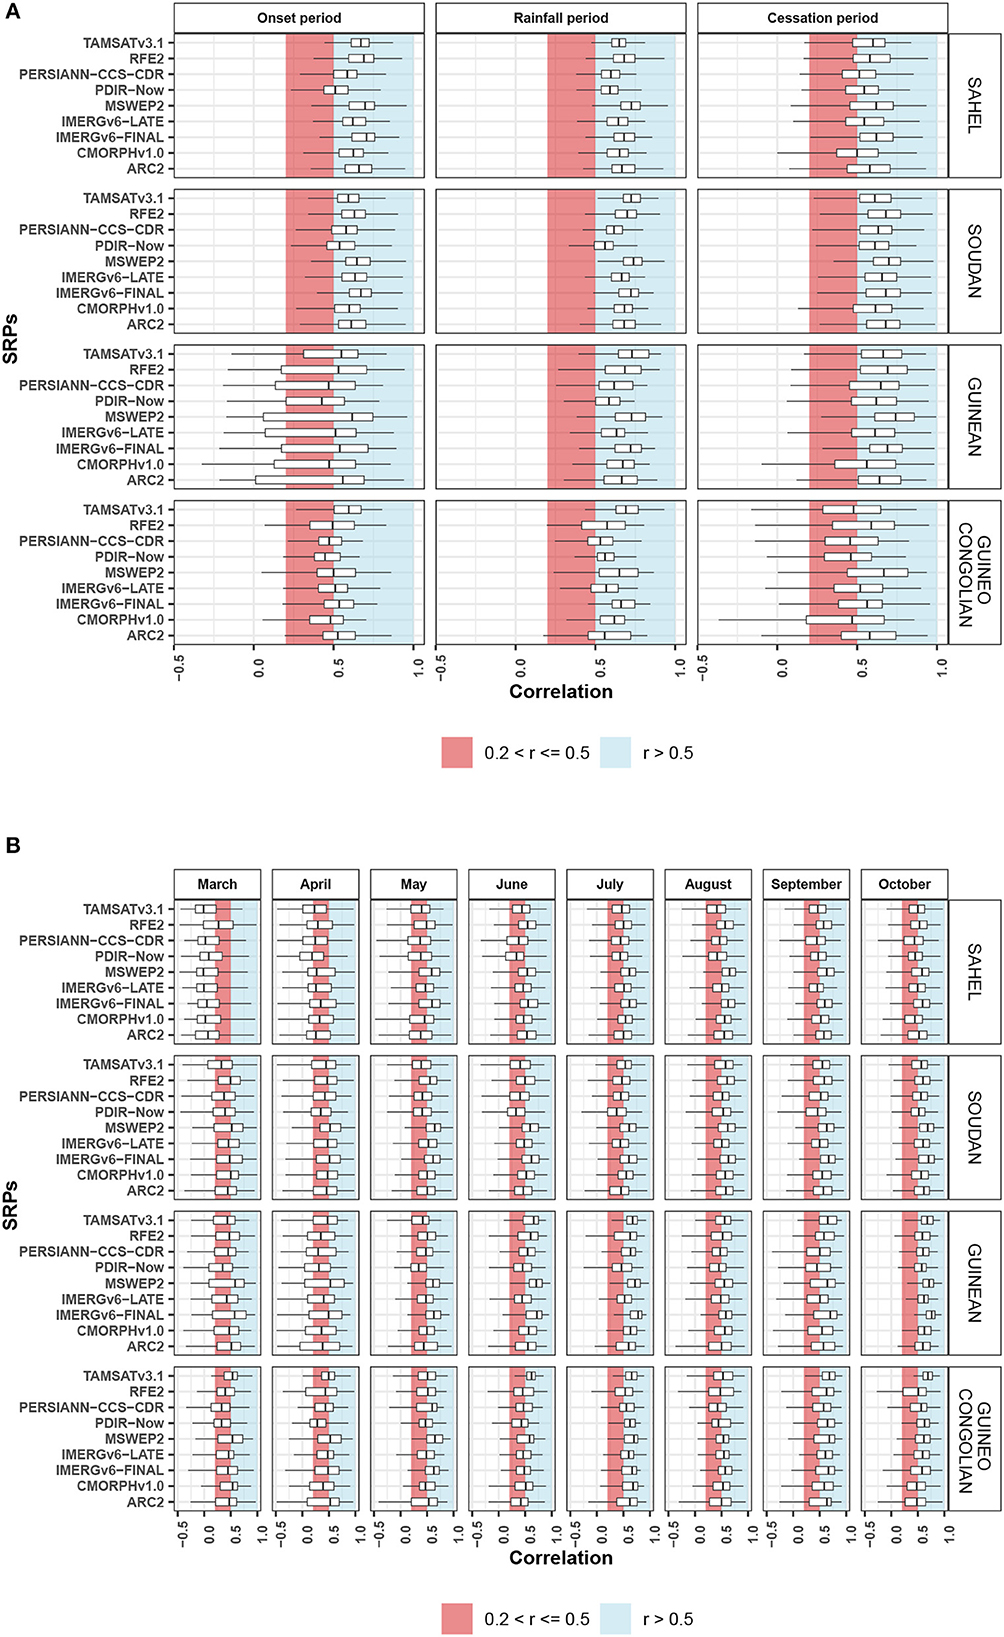
Figure 4. Correlation between satellite rainfall estimate products and reference rainfall data at dekadaly (A) and monthly (B) times scales, for retained grids, bioclimatic zones, and different period or months of rainfall season (period: 2001–2015).
The magnitude of the mean absolute error (MAE) shown in Figure 5A is proportional not only to the amount of rainfall in each region but also to the rainfall total for each period of the rainy season. In the Sahel region, more than 80% of the pixels considered had an MAE of less than 50 mm for all SRPs, with TAMSATv3.1, RFE2, ARC2, MSWEPv2.2, and IMERGv6-FINAL showing excellent to good MAEs in that order. Regarding the Sudanian zone, the SRPs' performance in terms of MAE ranged from excellent to good in the following order: MSWEPv2.2, TAMSATv3.1, IMERGv6-FINAL, RFE2, and ARC2. In the Guinean and Guineo-Congolese regions, TAMSATv3.1, RFE2, ARC2, MSWEPv2.2, and IMERGv6-FINAL had MAE values below 50 mm for more than 75% of the selected grids.
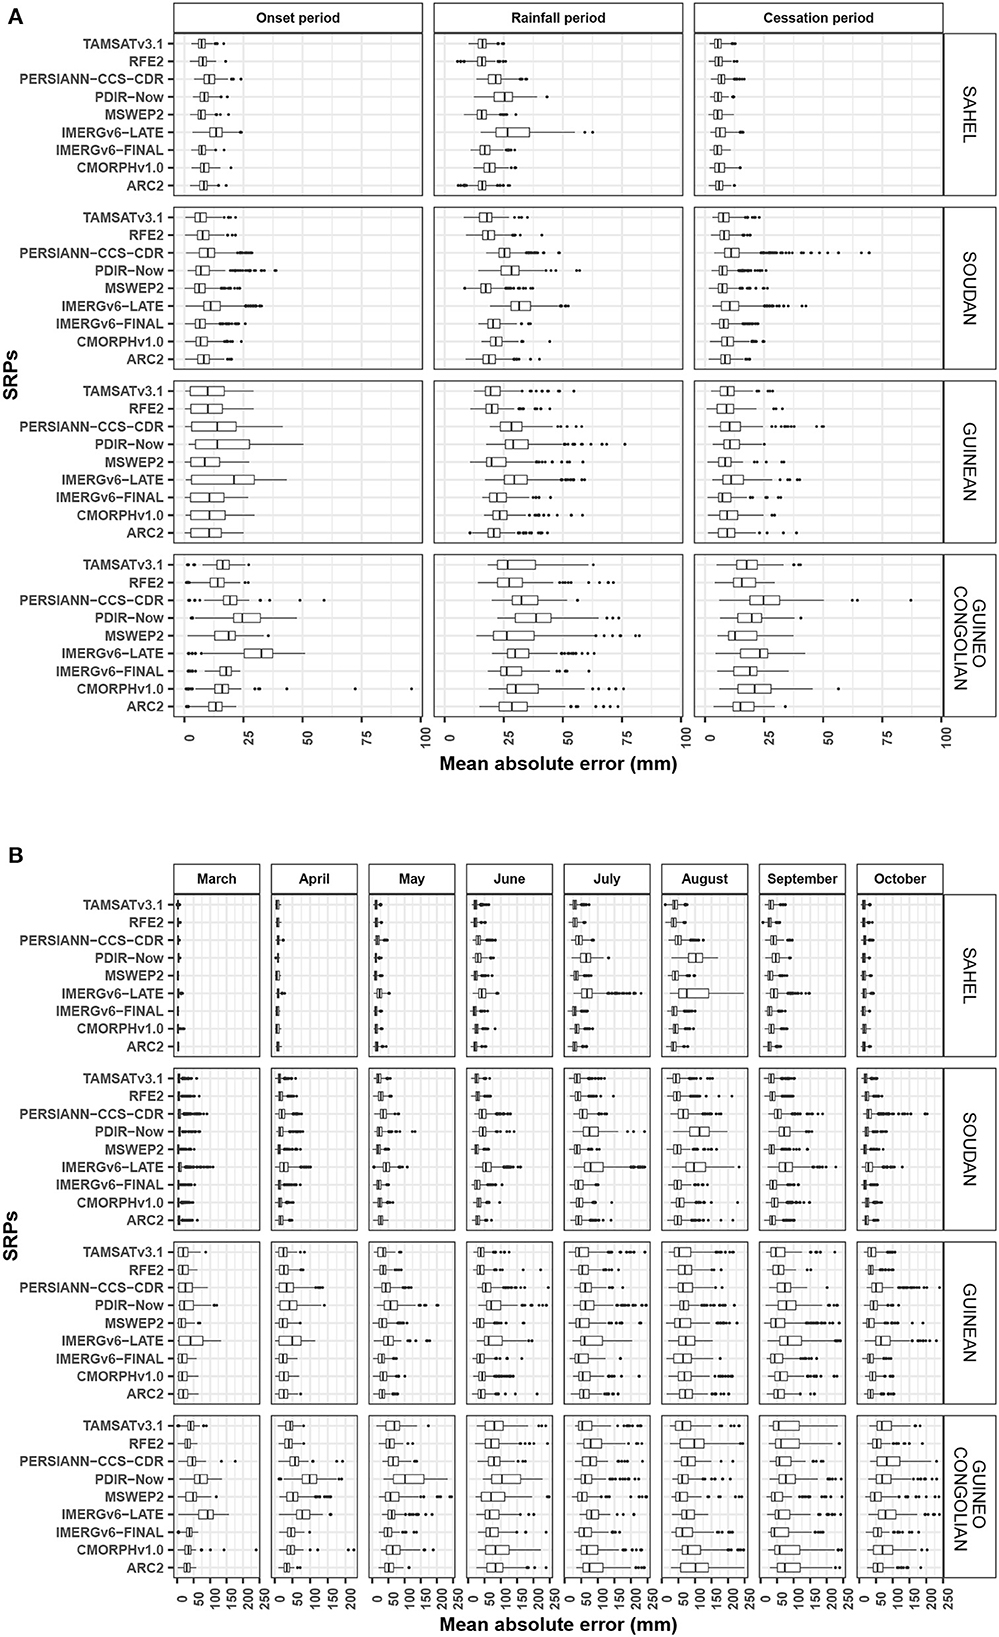
Figure 5. Mean absolute error between satellite rainfall estimate products and reference rainfall data at dekadaly (A) and monthly (B) times scales, for retained grids, bioclimatic zones, and different period of rainfall season (period: 2001–2015).
In the Sahel region, RFE2, IMERGv6-FINAL, and ARC2 outperformed other SRPs, with RBs between −20 and 20% for more than 70% and less than 40% of the grids considered for the peak rainfall period and for the onset and cessation periods, respectively (Figure 6A). TAMSATv3.1, PDIR-Now, MSWEPv2.2, and CMORPHv1.0 underestimated the dekadal rainfall for over 60% of the grid cells during the onset of the season. During the period of cessation of rainfall, this underestimate characterized more than 75% of the grids for these 4 SRPs. PDIR-Now significantly underestimated rainfall during the peak rainfall period for more than 90% of the grids. Only IMERGv6-LATE and PERSIANN-CCS-CDR significantly overestimated rainfall during the peak rainfall period. In the Sudanian region, TAMSATv3.1, RFE2, MSWEPv2.2, CMORPHv1.0, ARC2, and IMERGv6-FINAL outperformed other SRPs, with RBs between -20 and 20% for more than 60% of the grids during the peak rainfall period. At the onset and cessation periods, TAMSATv3.1, CMORPHv1.0, and IMERGv6-FINAL had RBs close to zero for more than 40% of the grids and outperformed other SRPs. In the Guinean and Guinean-Congolian regions, RFE2, IMERGv6-FINAL, MSWEPv2.2 and ARC2 outperformed other SRPs during the peak rainfall period. At the beginning and end of the rainy season, almost all SRPs overestimated observed rainfall for more than 60% of the grids. RFE2, ARC2, and CMORPHv1.0 showed biases close to zero for more than 30% of the grids at the start of the rainy season in the Guinean-Congolian zone, while for the Guinean region only TAMSATv3.1, IMERGv6-FINAL, CMORPHv1.0, and MSWEPv2.2 presented similar statistics.
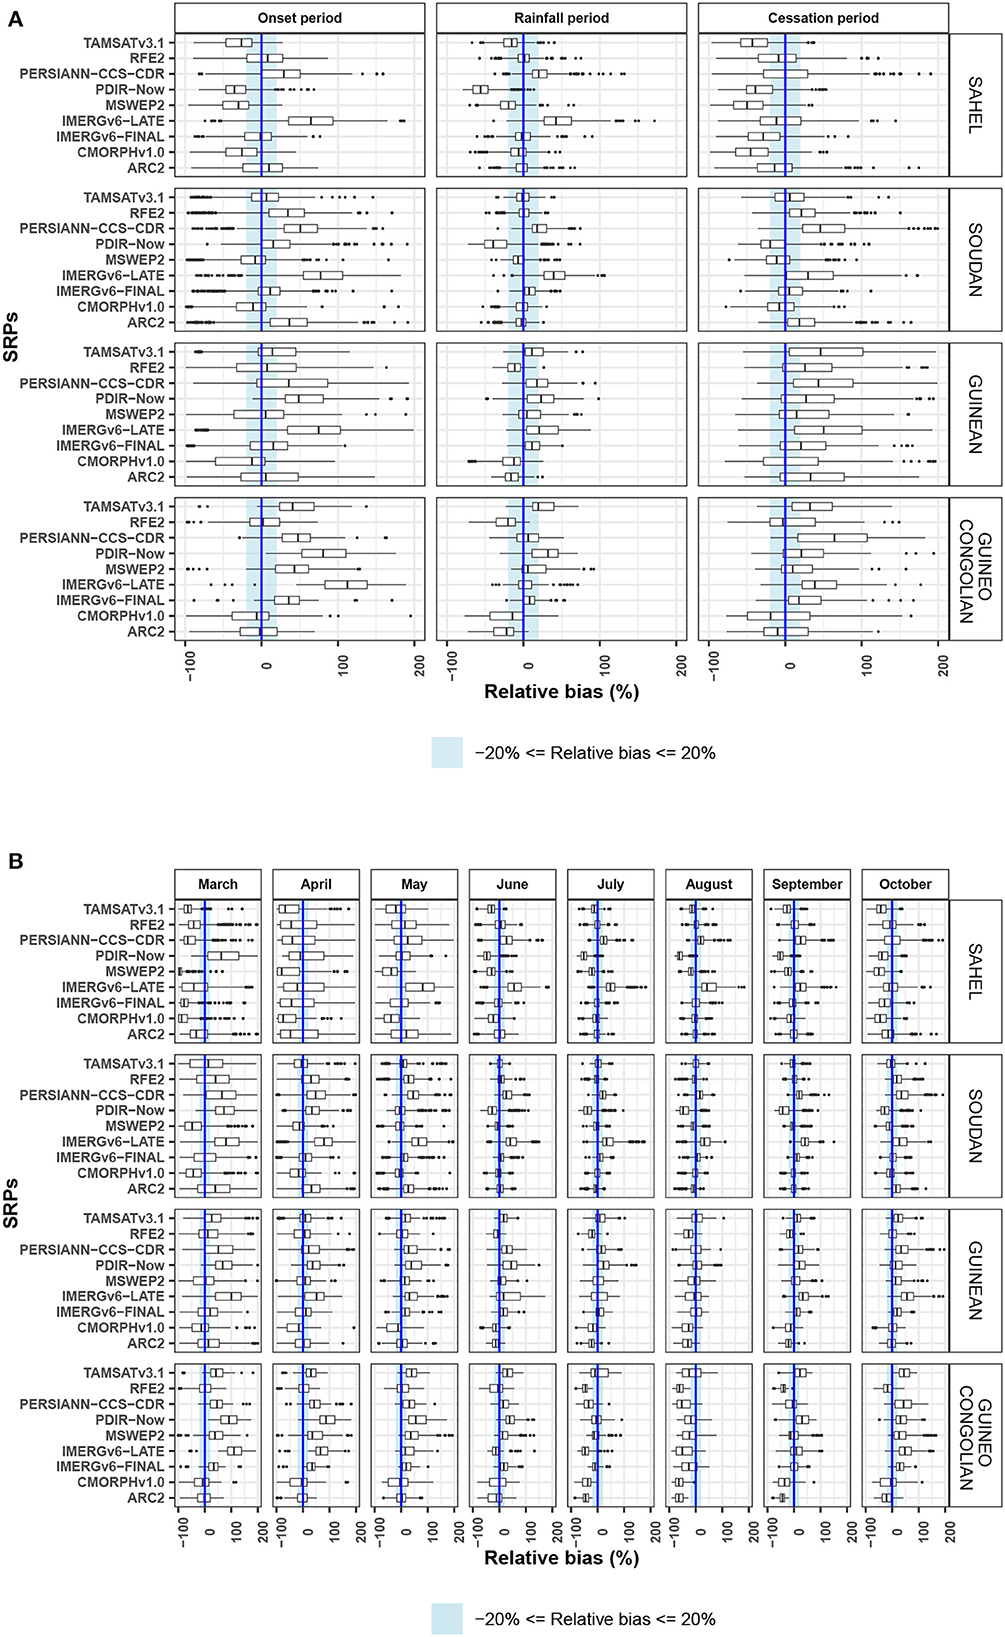
Figure 6. Relative bias between satellite rainfall estimate products and reference rainfall data at dekadaly (A) and monthly (B) times scales, for retained grids, bioclimatic zones, and different period of rainfall season (period: 2001–2015).
Regarding to the KGE performance metric (Figure 7A), it was observed that, regardless of the period and zone, the SRPs MSWEPv2.2, IMERGv6-FINAL, RFE2, ARC2, and to some extent, TAMSATv3.1 exhibited superior performance over all other SRPs. Additionally, it was noted that these SRPs had fewer grids with KGE values greater than 0.5 the onset and cessation periods compared to during the peak of the rainy season.
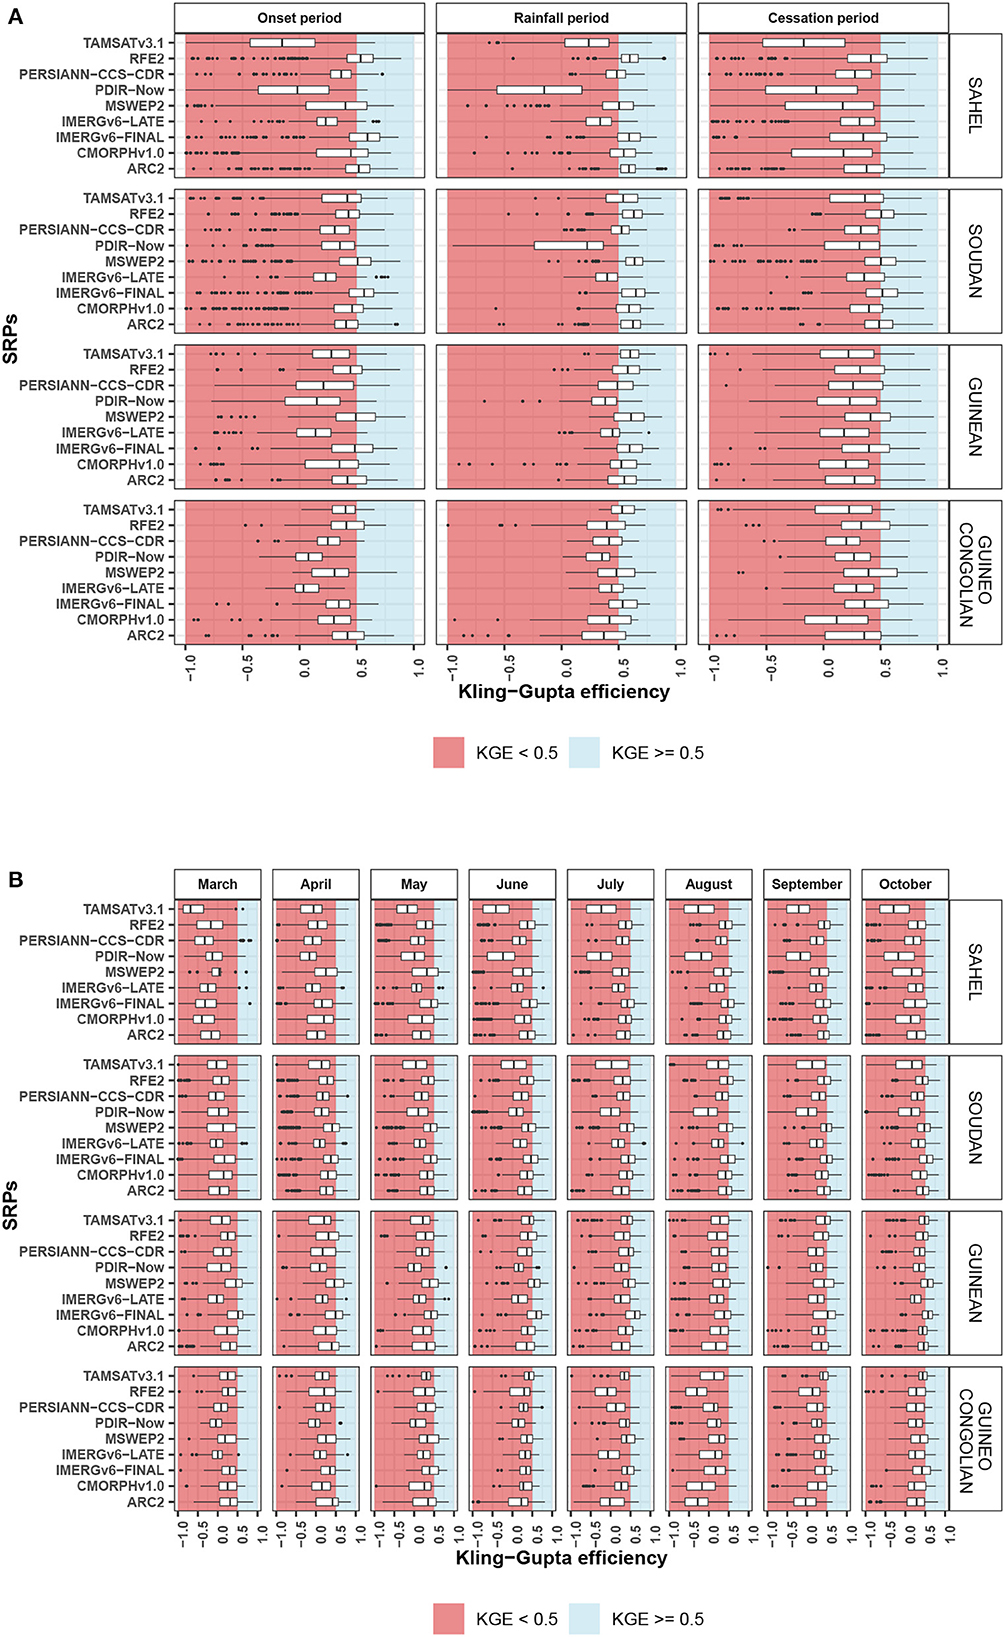
Figure 7. Relative bias between satellite rainfall estimate products and reference rainfall data at dekadaly (A) and monthly (B) times scales, for retained grids, bioclimatic zones, and different period of rainfall season (period: 2001–2015).
For monthly data comparison, RFE2, MSWEPv2.2, IMERGv6-FINAL, CMORPHv1.0, and ARC2 outperformed other SRPs in terms of correlation (Figure 4B), relative bias (Figure 5B), MAE (Figure 6B), and KGE (Figure 7B) for the Sahel region from July to September. Over 60% of selected grids showed correlations higher than 0.5, MAE lower than 50 mm, and relative bias close to zero, except for MSWEPv2.2, which was underestimated for more than 50% of grids. KGE values above 0.5 were observed for only 15% of the grids. The same SRPs and TAMSATv3.1 showed good scores for April to June and October but for fewer grids.
Except for PDIR-Now, IMERG-LATE, and PERSIANN-CCS-CDR, all SRPs performed well in the Sudanian region, showing correlations greater than 0.5 and an MAE of less than 50 mm with a close-to-zero relative bias for over 50% of the pixels considered. However, very few pixels showed KGE values above 0.5.
TAMSATv3.1, MSWEPv2.2, IMERGv6-FINAL, CMORPHv1.0, RFE2, and ARC2 outperformed other SRPs in terms of correlation and MAE over the Guinean and Guinean-Congolian regions. MSWEPv2.2, IMERGv6-FINAL, CMORPHv1.0, and TAMSATv3.1 showed good scores in terms of KGE in the Guinean region. For the Guineo-Congolian region, only MSWEPv2.2 and, to a lesser extent, IMERGv6-FINAL showed good scores for some grids.
4.2. Global performance of satellite rainfall estimation products across each bioclimatic zone
Figures 8, 9 present the global performance for each bioclimatic zone. For the dekadal timescale (Figure 8), and considering the Sahelian region, MSWEPv2.2, IMERGv6-FINAL, ARC2, RFE2, CMORPHv1.0 and to some extent, TAMSATv3.1 performed well during the onset, cessation and the rainfall period, with MSWEPv2.2 performing the best. TAMSATv3.1 underestimated the variance in observed dekadaly precipitation over the region. Regarding the Soudan region, TAMSATv3.1 was the best SRP reproducing the observed precipitation, followed by MSWEPv2.2, ARC2, and RFE2. In the Guinean region, TAMSATv3.1, MSWEPv2.2, IMERGv6-FINAL, ARC2, and RFE2 were closer to the observation than any other SRPs. In the Guineo-Congolian region, ARC2, RFE2, and TAMSATv3.1 performed well during onset, the peak of rainfall and cessation period. For the monthly timescale (Figure 9), TAMSATv3.1, IMERGv6-FINAL, MSWEPv2.2, ARC2, RFE2, and CMORPHv1.0, to some extent, outperformed other SRPs regardless of the month considered and climates zone.
4.3. Seasonal cycle reproducibility
All SRPs captured relatively well the seasonal rainfall cycles for the Sahelian, Guinean, and Sudanian zones, as shown in Figure 10, with TAMSATv3.1, IMERGv6-FINAL, and MSWEPv2.2 exhibiting the best performance in reproducing the observed cycles. In the Guineo-Congolian zone, only MSWEPv2.2, IMERGv6-FINAL, TAMSATv3.1, and CMORPHv1.0 managed to capture the observed seasonal cycle to some extent.
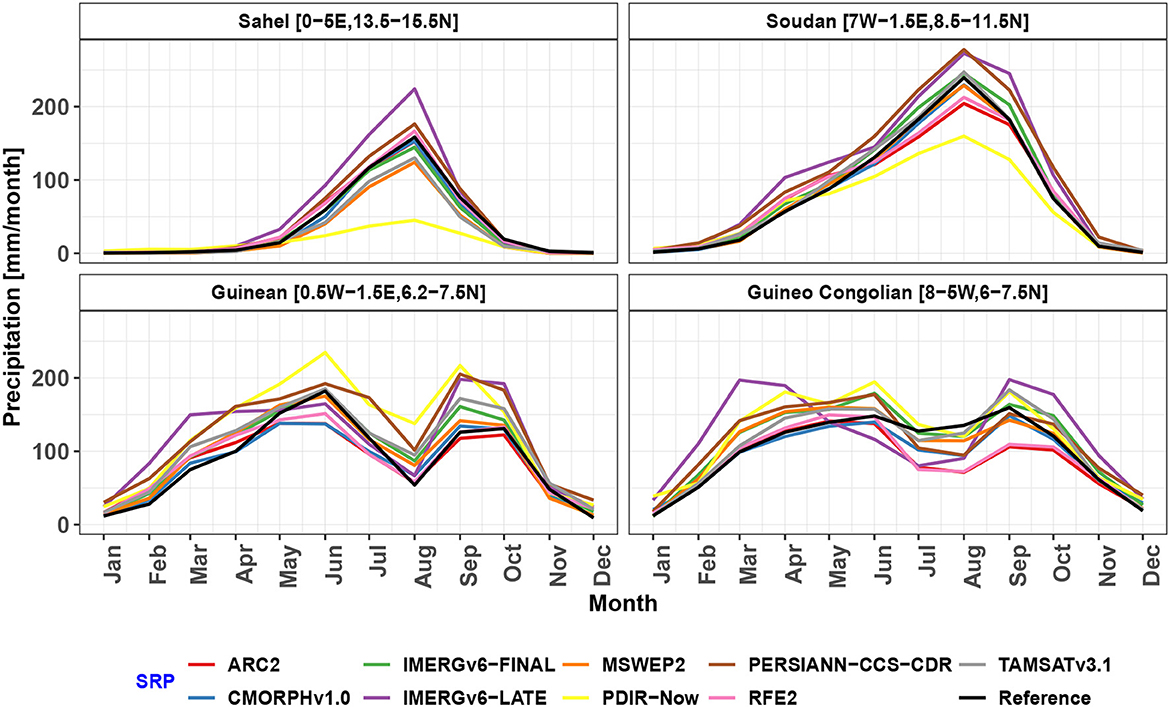
Figure 10. Ability of satellite rainfall estimate to reproduce observed rainfall seasonal cycle over different bioclimatic zones (period: 2001–2015).
4.4. Ranking of satellite rainfall estimation products
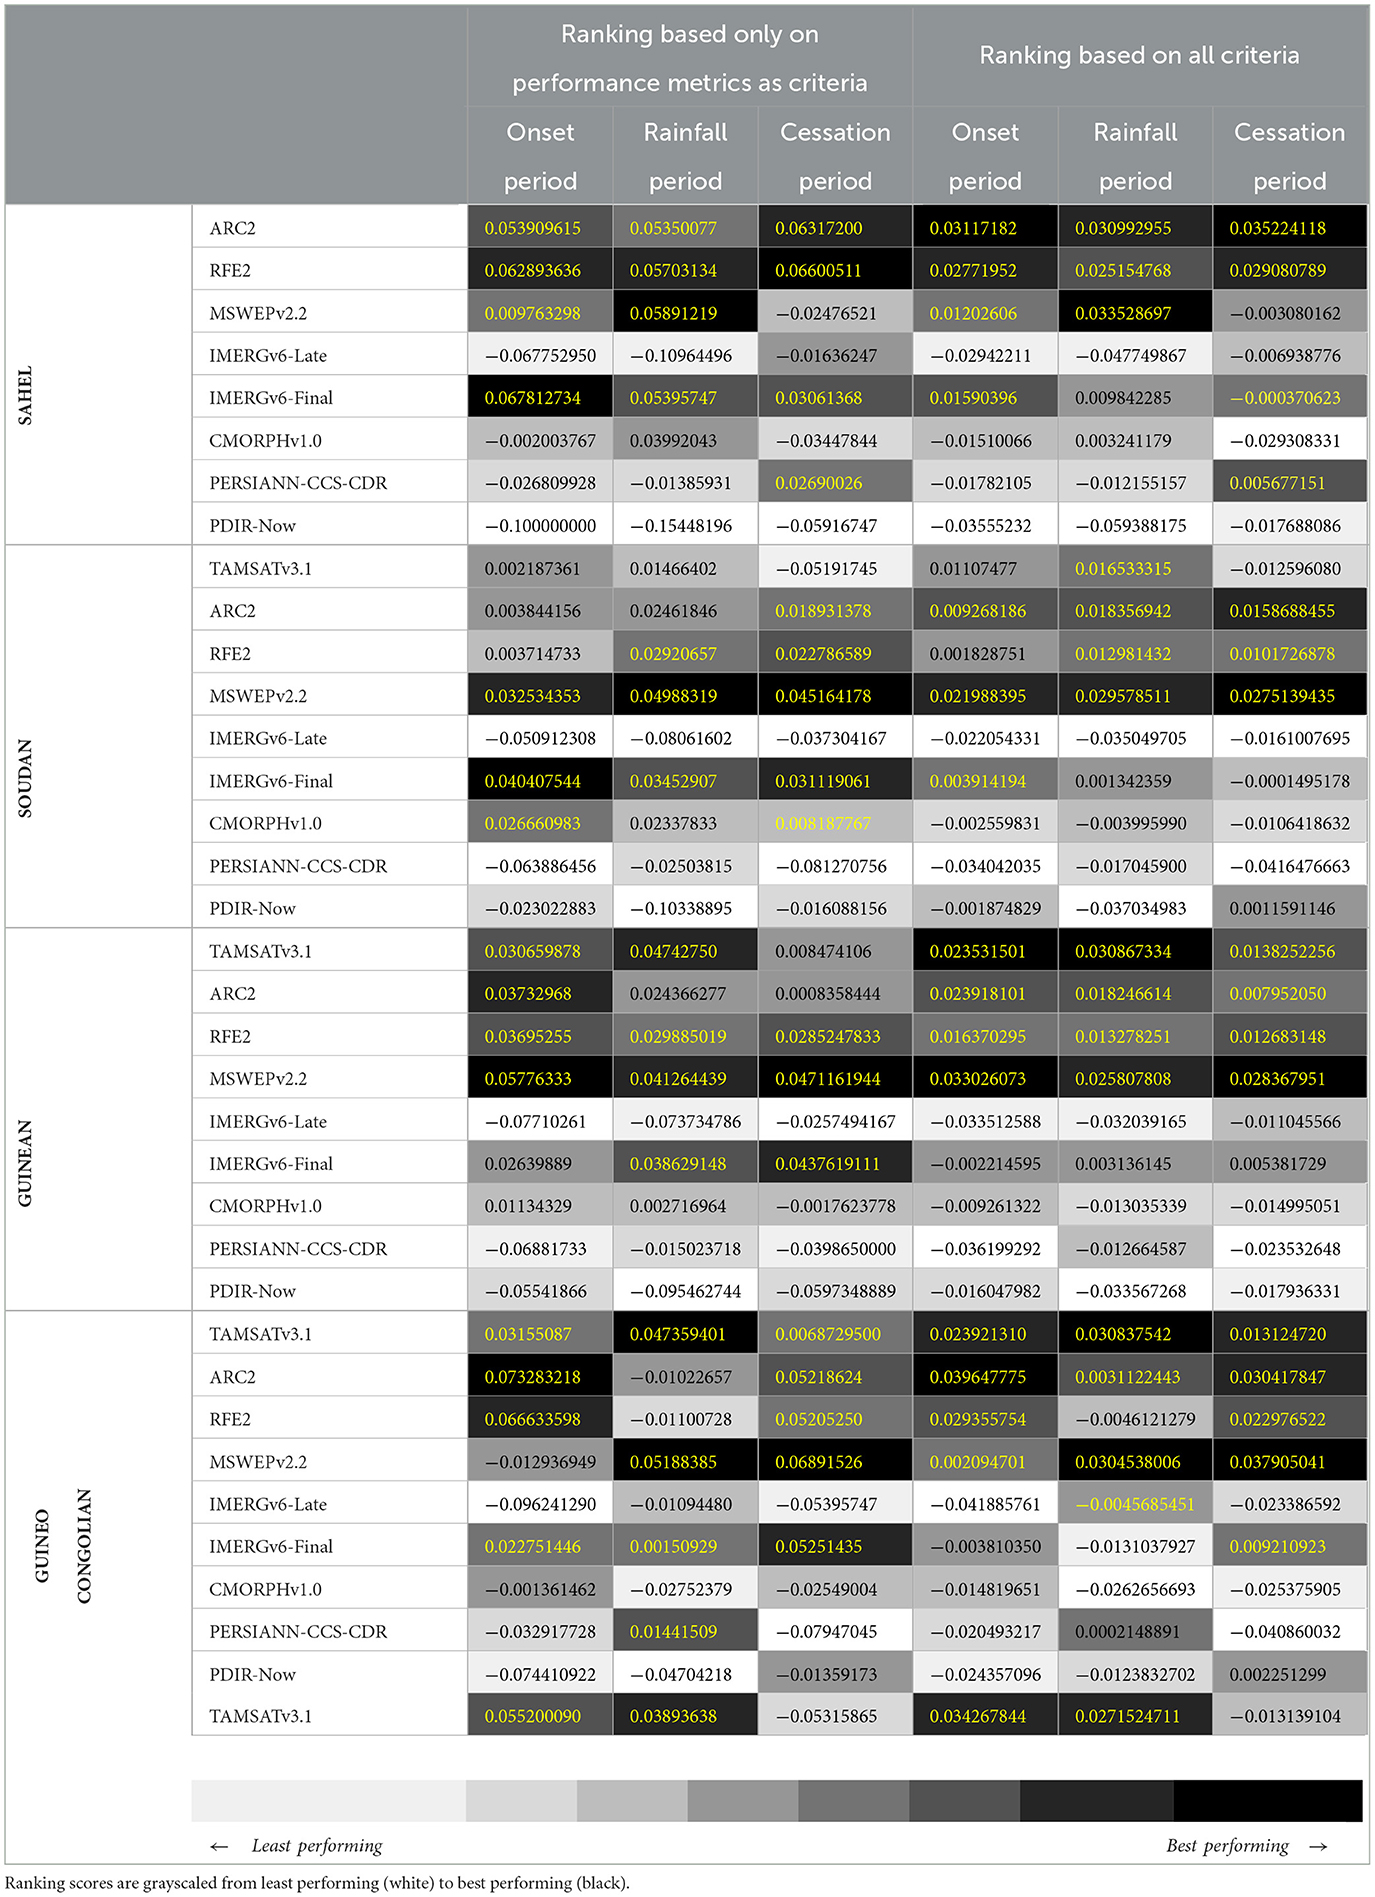
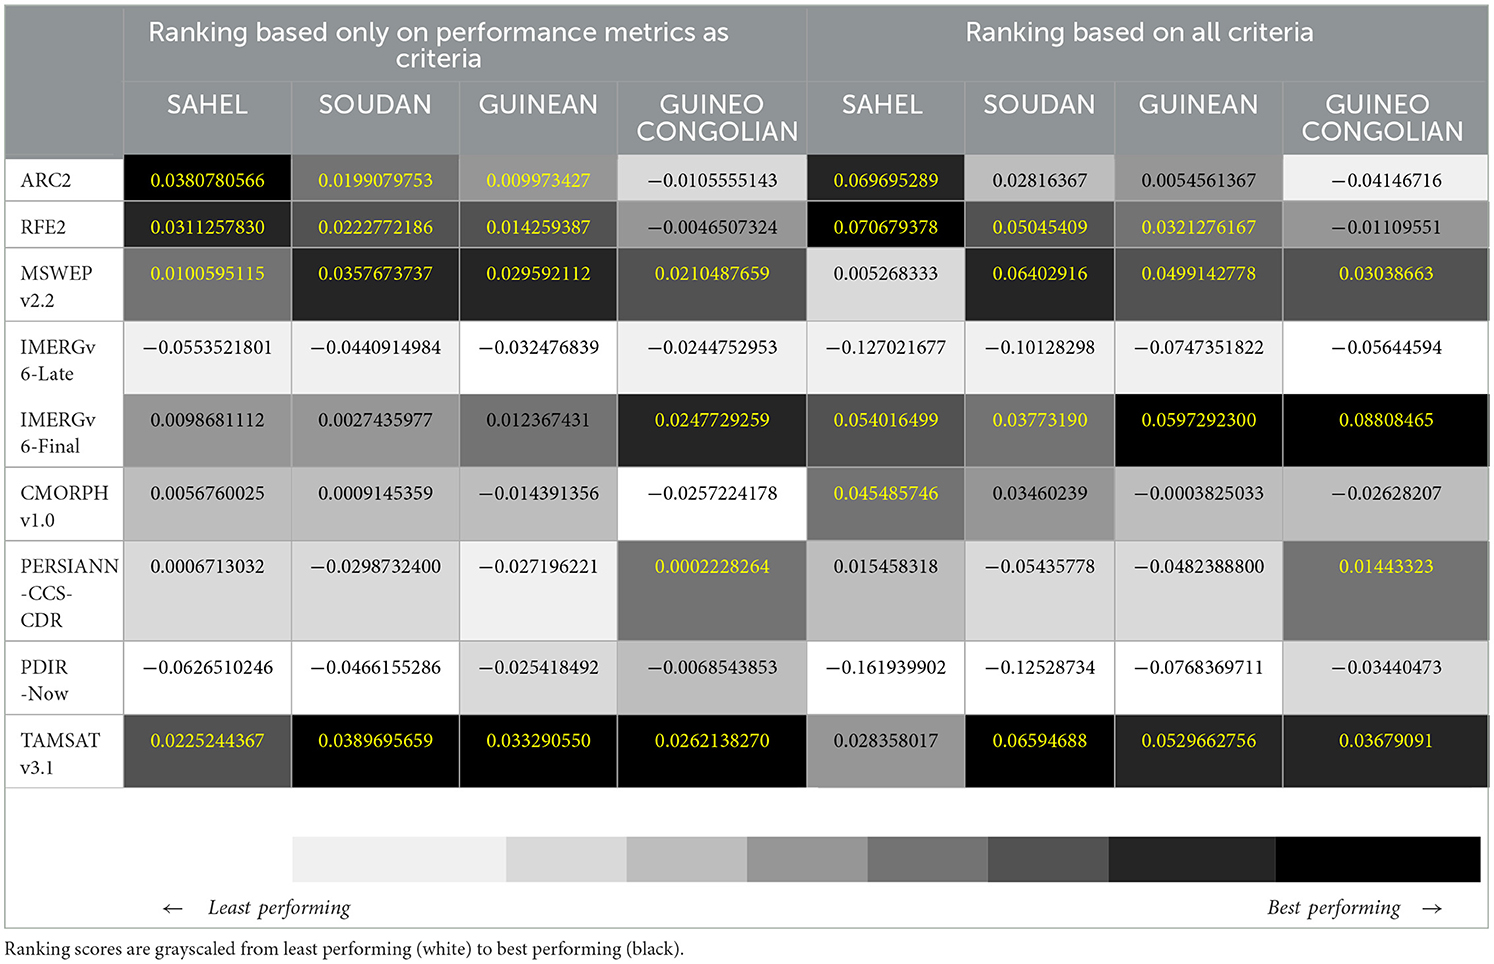
The ranking of SRPs based on multi-criteria decision analysis (MCDA) is presented in Tables 5, 6. For dekadal timescales, when considering only performance measures as criteria, it was observed that in the Sahel zone, the top-ranked SRPs are IMERGv6-Final (0.067812734), RFE2 (0.062893636), ARC2 (0.053909615), and MSWEPv2.2 (0.009763298) for the onset period. For the peak of the rainfall period, the top-ranked SRPs are MSWEPv2.2 (0.05891219), RFE2 (0.05703134), IMERGv6-Final (0.05395747), and ARC2 (0.05350077). For the end of the season period, the top-ranked SRPs are RFE2 (0.06600511), ARC2 (0.06317200), IMERGv6-Final (0.03061368), and PERSIANN-CCS-CDR (0.02690026). Regarding the Sudan region, the top-ranked SRPs for the onset period are IMERGv6-Final (0.040407544), MSWEPv2.2 (0.032534353), TAMSATv3.1 (0.030659878), and CMORPHv1.0 (0.026660983). For the rainfall period, the top-ranked SRPs are MSWEPv2.2 (0.04988319), TAMSATv3.1 (0.04742750), IMERGv6-Final (0.03452907), and RFE2 (0.02920657). For the cessation period, the top-ranked SRPs are MSWEPv2.2 (0.045164178), IMERGv6-Final (0.031119061), RFE2 (0.022786589), and ARC2 (0.018931378). In the Guinean zone, the highest-ranked SRPs for the onset period are MSWEPv2.2 (0.05776333), ARC2 (0.03732968), RFE2 (0.03695255), and TAMSATv3.1 (0.03155087). For the rainfall period, the top-ranked SRPs are TAMSATv3.1 (0.047359401), MSWEPv2.2 (0.041264439), IMERGv6-Final (0.038629148), and RFE2 (0.029885019). For the cessation period, the top-ranked SRPs are MSWEPv2.2 (0.0471161944), IMERGv6-Final (0.0437619111), RFE2 (0.0285247833), and TAMSATv3.1 (0.0068729500). In the Guineo Congolian region, the best-ranked SRPs for the onset period are ARC2 (0.073283218), RFE2 (0.066633598), TAMSATv3.1 (0.055200090), and IMERGv6-Final (0.022751446). For the peak of rainfall period, the top-ranked SRPs are MSWEPv2.2 (0.05188385), TAMSATv3.1 (0.03893638), PERSIANN-CCS-CDR (0.01441509), and IMERGv6-Final. For the cessation period, the top-ranked SRPs are MSWEPv2.2 (0.06891526), IMERGv6-Final (0.05251435), ARC2 (0.05218624), and RFE2 (0.05205250).
When combining performance metrics with intrinsic characteristics of SRPs as criteria for the MCDA, the best-ranked SRPs for the onset period in the Sahel region are ARC2 (0.03117182), RFE2 (0.02771952), IMERGv6-Final (0.01590396), and MSWEPv2.2 (0.01202606). For the peak of rainfall in the same region, the best-ranked SRPs are MSWEPv2.2 (0.033528697), ARC2 (0.030992955), RFE2 (0.025154768), and TAMSATv3.1 (0.016533315). For the cessation period, the best-ranked SRPs are ARC2 (0.035224118), RFE2 (0.029080789), PERSIANN-CCS-CDR (0.005677151), and IMERGv6-Final (-0.000370623). In the Sudan region, TAMSATv3.1 and MSWEPv2.2 are the top-ranked SRPs for the onset and peak of rainfall period, while MSWEPv2.2 and ARC2 are the top-ranked SRPs for the cessation period. In the Guinean region, TAMSATv3.1 and MSWEPv2.2 are the best-ranked SRPs for all periods of the rainfall season. However, in the Guineo Congolian region, the highest-ranked SRPs are ARC2 and TAMSATv3.1 for the onset period, MSWEPv2.2 and TAMSATv3.1 for the rainfall period, and MSWEPv2.2 and ARC2 for the cessation period.
For monthly timescales, the ranking of SRPs based only on performance metrics as criteria resulted in ARC2, RFE2, MSWEPv2.2, and TAMSATv3.1 as the best-ranked SRPs in the Sahel, Sudan, and Guinean regions. However, in the Guineo Congolian region, the top-ranked SRPs were TAMSATv3.1, IMERGv6-Final, MSWEPv2.2, and PERSIANN-CCS-CDR. The ranking based on all criteria (intrinsic characteristics of SRPs and performance metrics) resulted in IMERGv6-Final as the best-ranked SRP in the Guinean and Guineo Congolian regions, and RFE2 and TAMSATv3.1 as the top-ranked SRPs in the Sahel and Sudan regions.
5. Discussion
5.1. Performance of SRPs over different bioclimatic regions and times scales
In the Sahelian and Sudanian regions, the majority of SRPs exhibited good performance, except for PDIR-Now, with MSWEPv2.2, IMERGv6-FINAL, RFE2, and ARC2 performing the best on the dekadal time scale. On the monthly time scale, RFE2, MSWEPv2.2, TAMSATv3.1, ARC2, and IMERGv6-FINAL, to some extent, outperformed other SRPs. The good performance of these SRPs can be attributed to the high number of rain gauges used in the retrieval algorithms: in the merging process for the IMERGv6-Final, ARC2, RFE2, and MSWEPv2.2 products and in the calibration process for TAMSATv3.1. This good performance could also be explained by the predominance of convective rainfall over these regions. Indeed, both IR-based and PMW-based estimation methods perform well with convective precipitation (Ebert et al., 2007), hence the generally good skill over these regions. Dembélé and Zwart (2016) validated ARC2, RFE2, TARCAT (an older version of TAMSATv3.1), and other SRPs over Burkina-Faso and found that all SRPs showed a very good correlation for monthly time scales. Regarding the general performance, they found that RFE2 and ARC2 performed better than TARCAT. Other studies over the Sahel, such as those of Jobard et al. (2011) and Pierre et al. (2011) have also revealed the good performance of RFE2 in the sub-region. However, RFE2 was not compared in these studies with the SRPs chosen in the present study. On a monthly scale, Abdourahamane (2021) found that CHIRPS and ARC2 have good potential for hydroclimatological applications in Niger. However, four SRPs (CHIRPSv2.0, ARC2, CMORPH, and TAMSAT) were used in his study.
In the Guinean area, TAMSATv3.1, MSWEPv2.2, IMERGv6-FINAL, RFE2, and ARC2 were the best SRPs, whatever the time scales and period of the rainfall season. Nwachukwu et al. (2020) also found MSWEPv2.2 and IMERGv6-FINAL to be the best performing all over Nigeria, including the Guinean area. However, ARC2 was found to have the worst performance among several SRPs, including ARC2, CHIRPSv02 and TAMSATv3.0 in four agroecological zones of Ghana.
The SRPs performed less well in the Guineo-Congolian regions than in the Sahel, Sudan, and Guinean regions. The underperformance in the Guineo-Congolian region reflects the inability of IR-based or PMW-based products to capture warm cloud precipitation over coastal and orographic regions. According to Dinku et al. (2007, 2008, 2011), this is mainly due to the threshold they use to discriminate rain clouds, which is too cold for such processes. PMW-based algorithms are mainly scattered by ice aloft, but orographic rainfall is a warm-cloud process that does not necessarily produce much ice, which can lead to underestimation. Over this region, MSWEPv2.2, TAMSATv3.1, ARC2, RFE2, IMERGv6-Final, and somewhat PERSIANN-CCS-CDR, outperformed all other SRPs.
In general, SRPs performed well during the peak rainfall period of the season compared with the others period, probably due to the convective nature of the rainfall during this wet season, and MSWEPv2.2, ARC2, RFE2, IMERGv6-Final, and TAMSATv3.1 outperformed all SRPs across bioclimatic zones and time scales. Similar conclusions were drawn by Gosset et al. (2013) and Satgé et al. (2020) on West Africa, which put emphasis on the good performance of MSWEPv2.2 and IMERGv6-Final. Very few studies have considered the reproducibility of rainfall patterns in these regions, whereas Cattani et al. (2016) and Romilly and Gebremichael (2011) showed the relevance of evaluating this characteristic. Seasonal rainfall cycles were relatively well-reproduced by all SRPs, with TAMSATv3.1, IMERGv6-FINAL and MSWEPv2.2 being the best at reproducing the observed seasonal cycles in the Sahel, Sudan and Guinean regions. Over the Guineo-Congolian area, only MSWEPv2.2, IMERGv6-FINAL, and TAMSATv3.1 reproduced, to some extent, the observed seasonal cycle.
The ranking of SRPs, whether based on performance measures as criteria or based on both performance measures and intrinsic characteristics of SRPs, generally resulted in MSWEPv2.2, IMERGv6-Final, ARC2, RFE2, and TAMSATv3.1 as top-ranked SRPs across different climatic zones and time scales. While PROMETHEE II is a widely used multi-criteria decision analysis method, it also has certain limitations (De Keyser and Peeters, 1996). Some of the key limitations of the PROMETHEE II ranking method include the following:
• Sensitivity to criteria weights: PROMETHEE II requires the assignment of weights to criteria, and the ranking of alternatives can be sensitive to these weights. Small changes in weights can lead to significant changes in the ranking results, potentially affecting the overall decision outcome;
• Independence assumption: PROMETHEE II assumes that the criteria are independent of each other, meaning that changes in one criterion do not affect the evaluation of other criteria. However, we can not guarantee this assumption in our analysis;
• Lack of sensitivity analysis: PROMETHEE II does not offer a built-in mechanism for sensitivity analysis, which could assess the robustness of the ranking results to changes in criteria or weights. Sensitivity analysis is valuable for understanding the stability of the rankings and providing insights into the impact of uncertainties or variations in the decision-making process.
These limitations must be considered in interpreting SRPs' ranking results.
This study primarily focused on SRPs utilizing microwave, infrared spectral band, or satellite radar technologies. However, in addition to these types of SRPs, emerging products have gained popularity in recent years, offering high spatial detail and accuracy. Two notable examples are rainfall estimates derived from bottom-up soil moisture inversion (Pellarin et al., 2020; Krishnan et al., 2022) and the utilization of microwave signals from commercial cellular networks (Gosset et al., 2016). An evaluation of one such product has been conducted in Burkina Faso (Yonaba et al., 2022), highlighting the importance of further research in this promising field.
5.2. Use cases
The intended use of an SRP determines its choice. Depending on the envisaged applications, certain metrics/characteristics (latency, temporal and spatial resolution, bias, etc.) are more important than others to consider. It is also important to understand the algorithm underlying an SRP to understand its strengths and limitations. The use cases are discussed here for some rainfall-related risks and with some recommendations about the SRPs used. Over West Africa, drought and floods are the main risks affecting rain-fed agriculture, food and water security, economic losses, and loss of human life. Thus, a monthly timescale can be used for drought monitoring and early warning, and SRPs with low relative biases should be preferred (Le Coz and van de Giesen, 2020). In this regard, RFE2, ARC2, CMORPHv1.0, MSWEPv2.2, and to some extent, PDIR-Now and TAMSATv3.1 would be better suited for monitoring droughts on a monthly time scale. Dembélé and Zwart (2016) also recommended the old versions of ARC2 (ARC), RFE2 (RFE), and (TAMSAT) TARCAT to monitor dry spells in Burkina Faso. Monthly or even seasonal rainfall can be considered for the overall assessment of water resources of river basins Bajracharya et al. (2015). As such, MSWEPv2.2, TAMSATv3.1, IMERGv6-Final, RFE2, ARC2, and SRPs are recommended given the generally good performance displayed by these SRPs at these time scales. Dembélé et al. (2020) and Gbohoui et al. (2021) reached the same conclusion regarding ARC2 over the Volta and Nakanbé watersheds in West Africa, respectively. For climatological applications, SRPs should cover a long time period and be able to represent yearly and seasonal variability with algorithms that do not change over time, making them more consistent (Le Coz and van de Giesen, 2020). Thus, given their good performance and long time series, TAMSATv3.1, MSWEPv2.2, and ARC2 would be interesting to characterize rainfall variability and long-term changes. The last, but not least application is the use of these SRPs within the framework of the West African Regional Climate Outlook Forum (RCOFs). AGRHYMET supports the National Meteorological and Hydrological Services (NMHS) in the region by organizing regional climate outlook forums (RCOFs), called seasonal forecasts for the Sudanian and Sahelian regions of West Africa (PRESASS), and seasonal forecasts for countries along the Gulf of Guinea (PRESAGG). Statistical seasonal forecasts were developed using the climate predictability tool (Mason and Tippett, 2022). For spatially consistent reasons, it recommended using gridded fields as a predictand (WMO, 2020). Thus, SRPs constitute a very good alternative to observed precipitation analysis, given the scarcity of rain gauges in West Africa. Thus, TAMSATv3.1, MSWEPv2.2, and ARC2 could be good alternatives to observed data for both PRESAGG and PRESASS.
6. Conclusion
In areas with sparse rainfall networks, such as West Africa, Satellite Rainfall Products (SRPs) serve as a viable alternative for monitoring rainfall-related risks and providing early warnings. However, product suitability varies based on its intended application. For instance, RFE2, ARC2, CMORPHv1.0, and MSWEPv2.2 which have relatively lower relative biases, are more suited for drought monitoring. TAMSATv3.1, IMERGv6-Final, RFE2, ARC2, and MSWEPv2.2, because they generally have good performances at monthly time scales, are recommended for a comprehensive assessment of basin water resources. TAMSATv3.1 and MSWEPv2.2 are of particular interest for characterizing precipitation variability and long-term changes due to their long time series availability and good performance with algorithms that remain unchanged over time. Lastly, TAMSATv3.1, MSWEPv2.2, and ARC2, because of their best performance in estimating monthly rainfall and their long time series could be good alternatives to observed data for predictands to the PRESAGG and PRESASS RCOFs.
This research emphasizes the assessment of rainfall products at a regional scale for their application in specific contexts and outlines some constraints. The merging process for some regions is based on a limited number of rain gauges, which demands particular consideration for various purposes. Additionally, the upscaling of SRPs and reference data may result in more important biases in the findings. Consequently, evaluating rainfall products at the country level is highly recommended to ensure their efficacy for specific applications.
Data availability statement
Publicly available datasets were analyzed in this study. This data can be found here: the SRPs analyzed for this study can be found in the Zenodo repository (https://zenodo.org/record/7728991#.ZA-b8oDMLAR). However, the reference data used for comparison is available on request from AGRHYMET RCC-WAS. Requests to access these datasets should be directed to YmVybmFyZC5taW5vdW5nb3VAY2lsc3MuaW50.
Author contributions
MH and RM contributed to conception and design of the study and wrote the first draft of the manuscript. MH and BM performed the statistical analysis. BM organized the database. ST, AAlh, and AAli contributed to manuscript revision. All authors contributed to the article and approved the submitted version.
Funding
This study benefited from the UK-GCRF strategic fund (NE/R000034/1), which supported MH during the data analysis period, as well as other AGRHYMET project funds such the EU funded intra ACP GFCS ClimSA (N°FED/2019/413-586) and Accelerating Impacts of CGIAR Climate Research for Africa (AICCRA) project, Grant/Award Number: P173398 through the contribution of their staff members.
Conflict of interest
The authors declare that the research was conducted in the absence of any commercial or financial relationships that could be construed as a potential conflict of interest.
Publisher's note
All claims expressed in this article are solely those of the authors and do not necessarily represent those of their affiliated organizations, or those of the publisher, the editors and the reviewers. Any product that may be evaluated in this article, or claim that may be made by its manufacturer, is not guaranteed or endorsed by the publisher.
References
Abdourahamane, Z. S. (2021). Evaluation of fine resolution gridded rainfall datasets over a dense network of rain gauges in Niger. Atmos. Res. 252, 105459. doi: 10.1016/j.atmosres.2021.105459
Akinyemi, D. F., Ayanlade, O. S., Nwaezeigwe, J. O., and Ayanlade, A. (2020). A comparison of the accuracy of multi-satellite precipitation estimation and ground meteorological records overSouthwestern Nigeria. Remote Sens. Earth Syst. Sci. 3, 1–12. doi: 10.1007/s41976-019-00029-3
Ali, A., Amani, A., Diedhiou, A., and Lebel, T. (2005). Rainfall estimation in the Sahel. Part II: evaluation of rain gauge networks in the CILSS countries and objective intercomparison of rainfall products. J. Appl. Meteorol. 44, 1707–1722. doi: 10.1175/JAM2305.1
Amekudzi, L. K., Osei, M. A., Atiah, W. A., Aryee, J. N. A., Ahiataku, M. A., Quansah, E., et al. (2016). Validation of TRMM and FEWS satellite rainfall estimates with rain gauge measurement over Ashanti Region, Ghana. Appl. Categor. Struct. 6, 500–518. doi: 10.4236/acs.2016.64040
Atiah, W. A., Amekudzi, L. K., Aryee, J. N. A., Preko, K., and Danuor, S. K. (2020a). Validation of satellite and merged rainfall data over Ghana, West Africa. Atmosphere 11, 859. doi: 10.3390/atmos11080859
Atiah, W. A., Tsidu, G. M., Tsidu, G. M., and Amekudzi, L. K. (2020b). Investigating the merits of gauge and satellite rainfall data at local scales in Ghana, West Africa. Weather Clim. Extremes 30, 100292. doi: 10.1016/j.wace.2020.100292
Bajracharya, S. R., Palash, W., Shrestha, M. S., Khadgi, V. R., Duo, C., Das, P. J., et al. (2015). Systematic evaluation of satellite-based rainfall products over the Brahmaputra basin for hydrological applications. Adv. Meteorol. 2015, 398687. doi: 10.1155/2015/398687
Beck, H. E., Wood, E. F., Pan, M., Fisher, C. K., Miralles, D. G., van Dijk, A. I. J. M., et al. (2019). MSWEP V2 global 3-hourly 0.1° precipitation: methodology and quantitative assessment. Bull. Am. Meteorol. Soc. 100, 473–500. doi: 10.1175/BAMS-D-17-0138.1
Behzadian, M., Kazemzadeh, R., Albadvi, A., and Aghdasi, M. (2010). PROMETHEE: a comprehensive literature review on methodologies and applications. Eur. J. Oper. Res. 200, 198–215. doi: 10.1016/j.ejor.2009.01.021
Bitew, M. M., and Gebremichael, M. (2011). Evaluation of satellite rainfall products through hydrologic simulation in a fully distributed hydrologic model. Water Resour. Res. 47. doi: 10.1029/2010WR009917
Cattani, E., Merino, A., and Levizzani, V. (2016). Evaluation of monthly satellite-derived precipitation products over East Africa. J. Hydrometeorol. 17, 2555–2573. doi: 10.1175/JHM-D-15-0042.1
De Keyser, W., and Peeters, P. (1996). A note on the use of PROMETHEE multicriteria methods. Eur. J. Oper. Res. 89, 457–461.
de Carvalho, W. Jr., Loireau, M., Fargette, F., Filho, B. C., and Wélé, A. (2017). Correlation between soil erosion and satellite data on areas of current desertification: A case study in Senegal. Ciência e tropic. 41, 51–66.
Dembélé, M., Schaefli, B., van de Giesen, N., and Mariethoz, G. (2020). Suitability of 17 gridded rainfall and temperature datasets for large-scale hydrological modelling in West Africa. Hydrol. Earth Syst. Sci. 24, 5379–5406. doi: 10.5194/hess-24-5379-2020
Dembélé, M., and Zwart, S. J. (2016). Evaluation and comparison of satellite-based rainfall products in Burkina Faso, West Africa. Int. J. Remote Sens. 37, 3995–4014. doi: 10.1080/01431161.2016.1207258
Dinku, T., Ceccato, P., and Connor, S. J. (2011). Challenges of satellite rainfall estimation over mountainous and arid parts of east Africa. Int. J. Remote Sens. 32, 5965–5979. doi: 10.1080/01431161.2010.499381
Dinku, T., Ceccato, P., Grover-Kopec, E., Lemma, M., Connor, S. J., and Ropelewski, C. F. (2007). Validation of satellite rainfall products over East Africa's complex topography. J. Remote Sens. 28, 1503–1526. doi: 10.1080/01431160600954688
Dinku, T., Chidzambwa, S., Ceccato, P., Connor, S. J., and Ropelewski, C. F. (2008). Validation of high-resolution satellite rainfall products over complex terrain. J. Remote Sens. 29, 4097–4110. doi: 10.1080/01431160701772526
Dinku, T., Faniriantsoa, R., Islam, S., Nsengiyumva, G., and Grossi, A. (2022). The climate data tool: enhancing climate services across Africa. Front. Clim. 3:787519. doi: 10.3389/fclim.2021.787519
Dinku, T., Hailemariam, K., Maidment, R., Tarnavsky, E., and Connor, S. (2013). Combined use of satellite estimates and rain gauge observations to generate high-quality historical rainfall time series over Ethiopia. Int. J. Climatol. 34, 2489–2504. doi: 10.1002/joc.3855
Dunning, C. M., Black, E. C., and Allan, R. P. (2016). The onset and cessation of seasonal rainfall over Africa. J. Geophys. Res. Atmos. 121, 11–405. doi: 10.1002/2016JD025428
Ebert, E. E., Elizabeth, E., Ebert Ebert,, E. E., Janowiak, J. E., and Kidd, C. (2007). Comparison of near-real-time precipitation estimates from satellite observations and numerical models. Bull. Am. Meteorol. Soc. 88, 47–64. doi: 10.1175/BAMS-88-1-47
Funk, C., Peterson, P., Landsfeld, M., Pedreros, D., Verdin, J., Shukla, S., et al. (2015). The climate hazards infrared precipitation with stations–a new environmental record for monitoring extremes. Sci. Data 2, 150066. doi: 10.1038/sdata.2015.66
Gbohoui, Y. P., Paturel, J.-E., Fowe Tazen Mounirou, L. A., Yonaba, R., Karambiri, H., et al. (2021). Impacts of climate and environmental changes on water resources: a multi-scale study based on Nakanbe nested watersheds in West African Sahel. J. Hydrol. Region. Stud. 35, 100828. doi: 10.1016/j.ejrh.2021.100828
Gosset, M., Alcoba, M., Roca, R., Cloche, S., and Sophie Cloche Urbani, G. (2018). Evaluation of TAPEER daily estimates and other GPM-era products against dense gauge networks in West Africa, analysing ground reference uncertainty. Q. J. R. Meteorol. Soc. 144, 255–269. doi: 10.1002/qj.3335
Gosset, M., Kunstmann, H., Zougmore, F., Cazenave, F., Leijnse, H., Uijlenhoet, R., et al. (2016). Improving rainfall measurement in gauge poor regions thanks to mobile telecommunication networks. Bull. Am. Meteorol. Soc. 97, ES49–ES51. doi: 10.1175/BAMS-D-15-00164.1
Gosset, M., Viarre, J., Quantin, G., and Alcoba, M. (2013). Evaluation of several rainfall products used for hydrological applications over West Africa using two high-resolution gauge networks. Q. J. R. Meteorol. Soc. 139, 923–940. doi: 10.1002/qj.2130
Greco, S., and Greco, S. (2015). Mutiple Criteria Decision Analysis: State of the Art Surveys, 2nd Edn., Vol. 1. New York, NY: Springer Science+Business Media.
Gupta, H. V., Kling, H., Yilmaz, K. K., and Martinez, G. (2009). Decomposition of the mean squared error and NSE performance criteria: implications for improving hydrological modelling. J. Hydrol. 377, 80–91. doi: 10.1016/j.jhydrol.2009.08.003
Huffman, G. J., Bolvin, D. T., Braithwaite, D., Hsu, K., Joyce, R., Kidd, C., et al. (2018). Algorithm Theoretical Basis Document (ATBD) Version 5.2, NASA Global Precipitation Measurement (GPM) Integrated Multi-satellitE Retrievals for GPM (IMERG)0000. Technical report, NASA Tech.
Jobard, I., Chopin, F., Berges, J. C., and Roca, R. (2011). An intercomparison of 10-day satellite precipitation products during West African monsoon. Int. J. Remote Sens. 32, 2353–2376. doi: 10.1080/01431161003698286
Krishnan, S., Pradhan, A., and Indu, J. (2022). Estimation of high-resolution precipitation using downscaled satellite soil moisture and SM2RAIN approach. J. Hydrol. 610, 127926. doi: 10.1016/j.jhydrol.2022.127926
Lamptey, B. L. (2008). Comparison of gridded multisatellite rainfall estimates with gridded gauge rainfall over West Africa. J. Appl. Meteorol. Climatol. 47, 185–205. doi: 10.1175/2007JAMC1586.1
Laurent, H., Jobard, I., and Toma, A. (1998). Validation of satellite and ground-based estimates of precipitation over the Sahel. Atmos. Res. 47–48, 651–670.
Le Coz, C., and van de Giesen, N. (2020). Comparison of rainfall products over sub-Saharan Africa. J. Hydrometeorol. 21, 553–596. doi: 10.1175/JHM-D-18-0256.1
Lebel, T., Cappelaere, B., Galle, S., Hanan, N. P., Kergoat, L., Levis, S., et al. (2009). AMMA-CATCH studies in the Sahelian region of West-Africa: an overview. J. Hydrol. 375, 3–13. doi: 10.1016/j.jhydrol.2009.03.020
Maidment, R. I., Grimes, D., Black, E., Tarnavsky, E., Young, M., Greatrex, H., et al. (2017). A new, long-term daily satellite-based rainfall dataset for operational monitoring in Africa. Sci. Data 4, 170063. doi: 10.1038/sdata.2017.63
Mason, S. J., and Tippett, M. K. (2022). Climate Predictability Tool Version 17.7.6. New York, NY: International Research Institute for Climate and Society.
Nguyen, P., Shearer, E. J., Ombadi, M., Gorooh, V. A., Hsu, K., Sorooshian, S., et al. (2020). PERSIANN dynamic infrared–rain rate model (PDIR) for high-resolution, real-time satellite precipitation estimation. Bull. Am. Meteorol. Soc. 101, E286–E302. doi: 10.1175/BAMS-D-19-0118.1
Nicholson, S. E., Some, B., McCollum, J., Nelkin, E., Klotter, D., Berte, Y., et al. (2003a). Validation of TRMM and other rainfall estimates with a high-density gauge dataset for West Africa. Part I: validation of GPCC rainfall product and Pre-TRMM satellite and blended products. J. Appl. Meteorol. 42, 1337–1354. doi: 10.1175/1520-0450(2003)042<1337:VOTAOR>2.0.CO;2
Nicholson, S. E., Some, B., McCollum, J., Nelkin, E., Klotter, D., Berte, Y., et al. (2003b). Validation of TRMM and other rainfall estimates with a high-density gauge dataset for West Africa. Part II: validation of TRMM rainfall products. J. Appl. Meteorol. 42, 1355–1368. doi: 10.1175/1520-0450(2003)042<1355:VOTAOR>2.0.CO;2
NOAA/CPC (2001). The NOAA Climate Prediction Center African Rainfall Estimation Algorithm Version 2.0. Technical report, NOAA/CPC Tech.
Novella, N., and Thiaw, W. (2010). Validation of Satellite-Derived Rainfall Products over the Sahel. Wyle Information Systems/CPC/NOAA, 1–9.
Novella, N., and Thiaw, W. (2013). African rainfall climatology version 2 for famine early warning systems. J. Appl. Meteorol. Climatol. 52, 588–606. doi: 10.1175/JAMC-D-11-0238.1
Nwachukwu, P. N., Satge, F., Yacoubi, S. E., Pinel, S., and Bonnet, M.-P. (2020). From TRMM to GPM: how reliable are satellite-based precipitation data across Nigeria? Remote Sens. 12, 3964. doi: 10.3390/rs12233964
Ogbu, K. N., Houngu, N. R., Gbode, I. E., and Tischbein, B. (2020). Performance evaluation of satellite-based rainfall products over Nigeria. Climate 8, 103. doi: 10.3390/cli8100103
Pellarin, T., Romon-Cascon, C., Baron, C., Bindlish, R., Brocca, L., Camberlin, P., et al. (2020). The precipitation inferred from soil moisture (PrISM) near real-time rainfall product: evaluation and comparison. Remote Sens. 12, 481. doi: 10.3390/rs12030481
Pierre, C., Bergametti, G., Marticorena, B., Mougin, E., Lebel, T., and Ali, A. (2011). Pluriannual comparisons of satellite-based rainfall products over the Sahelian belt for seasonal vegetation modeling. J. Geophys. Res. Atmos. 116, D18201. doi: 10.1029/2011JD016115
Roca, R., Chambon, P., Jobard, I., Kirstetter, P.-E., Gosset, M., and Bergès, J. C. (2010). Comparing satellite and surface rainfall products over West Africa at meteorologically relevant scales during the AMMA campaign using error estimates. J. Appl. Meteorol. Climatol. 49, 715–731. doi: 10.1175/2009JAMC2318.1
Romilly, T. G., and Gebremichael, M. (2011). Evaluation of satellite rainfall estimates over Ethiopian river basins. Hydrol. Earth Syst. Sci. 15, 1505–1514. doi: 10.5194/hess-15-1505-2011
Sadeghi, M., Nguyen, P., Naeini, M. R., Hsu, K., Braithwaite, D., and Sorooshian, S. (2021). PERSIANN-CCS-CDR, a 3-hourly 0.04° global precipitation climate data record for heavy precipitation studies. Scient. Data 8, 157. doi: 10.1038/s41597-021-00940-9
Satgé, F., Defrance, D., Sultan, B., Bonnet, M.-P., Seyler, F., Rouche, N., et al. (2020). Evaluation of 23 gridded precipitation datasets across West Africa. J. Hydrol. 581, 124412. doi: 10.1016/j.jhydrol.2019.124412
Taylor, K. E. (2001). Summarizing multiple aspects of model performance in a single diagram. J. Geophys. Res. Atmos. 106, 7183–7192. doi: 10.1029/2000JD900719
Thiemig, V., Rojas, R., Zambrano-Bigiarini, M., and de Roo, A. (2013). Hydrological evaluation of satellite-based rainfall estimates over the Volta and Baro-Akobo Basin. J. Hydrol. 499, 324–338. doi: 10.1016/j.jhydrol.2013.07.012
WMO (2007). The Role of Climatological Normals in a Changing Climate. Technique WCDMP-No. 61/WMO-TD No. 1377, World Meteorological Organization, Geneva.
Xie, P., Joyce, R., Wu, S., Yoo, S.-H., Yarosh, Y., Sun, F., et al. (2017). Reprocessed, bias-corrected CMORPH global high-resolution precipitation estimates from 1998. J. Hydrometeorol. 18, 1617–1641. doi: 10.1175/JHM-D-16-0168.1
Yonaba, R., Belemtougri, A., Tazen, F., Mounirou, L. A., Koata, M., Karambiri, H., et al. (2022). Assessing the accuracy of SM2RAIN (Soil Moisture to Rainfall) products in poorly gauged countries: the case of Burkina Faso in the West African Sahel. IAHS-AISH Scientific Assembly 2022, Montpellier, France. doi: 10.5194/iahs2022-263
Yonaba, R., Biaou, A. C., Koata, M., Tazen, F., Mounirou, L. A., Zoure, C. O., et al. (2021). A dynamic land use/land cover input helps in picturing the Sahelian paradox: assessing variability and attribution of changes in surface runoff in a Sahelian watershed. Sci. Tot. Environ. 757, 143792. doi: 10.1016/j.scitotenv.2020.143792
Keywords: satellite rainfall estimation products, rainfall monitoring, rainfall-related risks, early warning, West Africa
Citation: Houngnibo MCM, Minoungou B, Traore SB, Maidment RI, Alhassane A and Ali A (2023) Validation of high-resolution satellite precipitation products over West Africa for rainfall monitoring and early warning. Front. Clim. 5:1185754. doi: 10.3389/fclim.2023.1185754
Received: 13 March 2023; Accepted: 07 July 2023;
Published: 24 July 2023.
Edited by:
Xiang Gao, Massachusetts Institute of Technology, United StatesReviewed by:
Roland Yonaba, International Institute for Water and Environmental Engineering, Burkina FasoDjanna Koubodana Houteta, African Institute for Mathematical Sciences Rwanda, Rwanda
Copyright © 2023 Houngnibo, Minoungou, Traore, Maidment, Alhassane and Ali. This is an open-access article distributed under the terms of the Creative Commons Attribution License (CC BY). The use, distribution or reproduction in other forums is permitted, provided the original author(s) and the copyright owner(s) are credited and that the original publication in this journal is cited, in accordance with accepted academic practice. No use, distribution or reproduction is permitted which does not comply with these terms.
*Correspondence: Mandela C. M. Houngnibo, bWFuZGVsYS5ob3VuZ25pYm9AY2lsc3MuaW50
 Mandela C. M. Houngnibo
 Bernard Minoungou
 Seydou B. Traore
 Ross I. Maidment
 Agali Alhassane1