
95% of researchers rate our articles as excellent or good
Learn more about the work of our research integrity team to safeguard the quality of each article we publish.
Find out more
ORIGINAL RESEARCH article
Front. Clim. , 14 July 2023
Sec. Predictions and Projections
Volume 5 - 2023 | https://doi.org/10.3389/fclim.2023.1184050
 Daniel Kwawuvi1*
 Daouda Mama2
 Sampson K. Agodzo3
 Enoch Bessah3Gnibga Issoufou Yangouliba1Wisdom S. Aklamati4
Introduction: One of the ways that climate change manifest itself is through temperature changes. Though the Oti River basin has been grappling with drought incidents, there has been little or no emphasis on analyzing temperature fluctuations in the basin. This study aimed to analyze the mean annual and seasonal temperature for the observed (1981–2010) and future periods (2021–2050) over the Oti River basin.
Methods: Historical data were obtained from meteorological stations and the National Aeronautics and Space Administration Prediction of Worldwide Energy Resources (NASA POWER). Data quality assessment was conducted, and the NASA POWER temperature was validated against the stations' temperature. Ensemble of eight models acquired from the Coordinated Regional Climate Downscaling Experiment (CORDEX–Africa) under two Representative Concentration Pathways (RCP4.5 and RCP8.5), were used for the future projection. The mean annual and seasonal temperatures were analyzed for 1981–2010 and 2021–2050 (under RCPs 4.5 and 8.5 scenarios). The Modified Mann–Kendall test was used for trend analysis at 5% significant level.
Results and discussion: In the near-future, temperature is anticipated to increase at the mean monthly scale in the ranges of +0.88°C in October to +2.65°C in January under the RCP4.5 scenario, while the RCP8.5 predicts increases between +2.71°C in July and +6.48°C in January. The annual mean temperature change for the entire basin is projected at +1.47°C (RCP4.5) and +4.2°C (RCP8.5). For the rainy season period, the RCP4.5 projects annual mean temperature changes in the ranges of −0.72°C and +1.52°C while the RCP8.5 predicts changes between +1.06°C and +4.45°C. Concerning the dry season period, the anticipated changes in the annual mean temperature under the RCP4.5 would range from −0.43°C to +2.78°C whereas that of RCP8.5 would be between +1.97°C and 7.25°C. The Modified Mann–Kendall test revealed significantly increasing trends for temperature projections in the basin under both the RCPs 4.5 and 8.5 in the basin. The study provides significant contribution to the comprehension of temperature patterns in time and space which is necessary for the sustenance of rainfed agriculture and water resources within the basin.
One of the ways that climate change shows itself is through temperature changes. According to the Intergovernmental Panel on Climate Change, IPCC (2018), the world's temperature (from 2015 to 2019), which was 1.1°C higher than it was in pre-industrial times, is expected to continue warming through 2052 and is likely to reach 1.5°C higher. Most of the time, the emission of greenhouse gases enhances global temperatures, which affects evapotranspiration and rainfall (Bates et al., 2008). It was estimated by the Food and Agriculture Organization and Economic Commission for Africa (2018) that between 2006 and 2016, agriculture (crops, livestock, fisheries, aquaculture, and forestry) sustained well over 26% of all damages and losses inflicted by extreme weather conditions and close to 80% of those resulting from drought globally. Catastrophic events, glacier retreat, and decreased sea ice quantity have all been linked to elevated temperatures (Huss et al., 2017). Although these trends are not anticipated to be consistent, both locally and globally, the intensity and frequency of climatic changes are likely to expand (Agyekum et al., 2018; Kruger et al., 2019; Choi et al., 2021).
West Africa has been identified as one of the areas of the globe that will be increasingly vulnerable to droughts, resulting in an increased loss of life-sustaining activities (Ndehedehe et al., 2016). Due to the region's involvement in climate-sensitive sectors such as agriculture, policymakers are particularly interested in how vulnerable the West African sub-region is toward climate change. Approximately 95% of the region's fertile land is used for agriculture, which employs 65% of the workforce and generates 30%−70% of the region's Gross Domestic Product (Blanc, 2012; Akumaga and Tarhule, 2018). Climate change has caused nearly all countries in West Africa to experience a rise in mean annual temperature over the years (Iheonu et al., 2022). For example, Aziz and Obuobie (2017) found a considerable rise in the annual average temperature of 0.9°C in the Black Volta Basin part of Burkina Faso and anticipated variation in average rainfall volume (ranging from −16 and +6%) for the late 21st century (2050–2075) under the Representative Concentration Pathway 4.5 scenario.
In the same way, during the rainy season, Diba et al. (2019) noted a deepening of the tropical night and a decrease in the frequency of thermal extremes across the Sahel. Extreme temperature in the Sahel portion of the region decreases feed consumption, causes energy shortages, and lowers animal production, while drought can lower calving rates. In addition, it causes the disappearance of conventional grazing and water sources, which changes the pastoralists' migratory habits (Lafia N'gobi et al., 2022). The Sahara Desert region of Niger is already under significant pressure on water supplies and agricultural production due to the increase in temperature and excessive rains, according to the African Development Bank (2018).
Temperature and rainfall fluctuations impact watershed environments, which alter freshwater supplies, thereby increasing the occurrence of hydrologic extremes such as flooding and drought (Awotwi et al., 2021; Gurara et al., 2023). For instance, even though the Volta River basin in West Africa supports the region's economy, the sub-region experiences harsh weather events that cause deaths and widespread damage (Annor et al., 2017; Agyekum et al., 2018). Regrettably, climate change is anticipated to worsen severe drought trends and prolonged rainfall start in the basin (van de Giesen et al., 2010; Yeboah et al., 2022) and in the Oti basin (Kwawuvi et al., 2022b). Under high-emission scenarios, it is expected that by 2040, West Africa may experience more frequent instances of excessive heat than it does now (Russo et al., 2016). West Africa is expected to experience persistent and increased heating due to climate change (up to ~6.5°C), exceeding the estimated mean temperature worldwide of 1.5°C by 2100 (Sylla et al., 2016). These projections are likely true as trends in global drying triggered by climate change will eventually modify the hydrology of the land surface (Ndehedehe et al., 2016).
Although several other climate change impact studies have been conducted in the West African region, none of these studies have specifically performed a spatiotemporal analysis of temperature across the Oti basin to know the temperature patterns in this basin. For instance, Kwawuvi et al. (2022a) analyzed the variations in rainfall at both temporal and spatial scales in the basin and projected a decline in rainfall for the period 2021–2050 under both the RCP4.5 and RCP8.5 scenarios. Additionally, Klassou and Komi (2021) examined the extreme rainfall across the central portion of ORB. Their research showed that while the majority of the heavy rainfall indices they examined showed a decline, the dry spell index showed a rising tendency across a sizable part of the basin. Komi et al. (2017) estimated the magnitude of flood hazard in the Togo portion of the Oti basin. In the Kara basin, a sub-basin of the Oti basin, Badjana et al. (2014) also investigated land-cover changes. They indicated that between 1972 and 2000, the area underwent a transformation in its land cover, with a noticeably large loss of its native forests. Within the same Kara basin, Badjana et al. (2017) examined the long-term patterns in yearly precipitation, its length, and the yearly maximum precipitation for seven stations from 1950 to 2010. According to their findings, the mean annual precipitation significantly dropped at several stations, while the interannual variability of annual precipitation decreased over time at all the stations studied. However, they also noted an increase in the length of annual precipitation, suggesting that precipitation was more frequent but less intense in areas where annual precipitation had decreased. In all these studies, temperature was not the main emphasis even though it is one of the main climatic factors for determining climate change, and its oscillations could influence water availability. Analyzing the spatial and temporal fluctuations in temperature in the basin for the past (1981–2010) and the future (2021–2050) is therefore essential for determining how the climate is changing in the basin since most communities rely on its water for farming and fishing for subsistence. The outcomes of this study could help policymakers comprehend the basin's temperature trend and determine the most effective strategies to manage the basin's water supplies.
Four West African countries share the Oti River basin (Ghana, Burkina Faso, Togo, and Benin) and are located between longitudes 6°W and 2°E and latitudes 0° and 15°N (Figure 1). It is a part of the West African Volta basin system and has a surface size of ~72,000 km2 (Barry et al., 2005; Kasei, 2009). The inter-tropical discontinuity (ITD) movement and interactions with the corresponding West African Monsoon determine the basin's climate. The annual rainfall varies from 1,010 to 1,400 mm, with 2,540 mm of pan evaporation and 254 mm of runoff (Kasei, 2009). August is the wettest month in the basin, with a uniform rainfall distribution. The wet season lasts from April to October, whereas the dry season lasts from November to March (Klassou and Komi, 2021). The typical annual temperature ranges from 25.9 to 34°C. The steep topography of the basin and abundant rainfall aid surface runoff, which contributes to ~25% of the annual total flow to Volta Lake (Barry et al., 2005). According to climate projections, under the RCP8.5 and RCP 4.5 emission scenarios, the basin might see very wet (+1.91) rainfall in 2028 and extremely wet (+2.12) rainfall in 2037 (Kwawuvi et al., 2022a). Developing adaptation measures that would be resilient to the extremes in climate requires knowledge of the distribution of temperature projections at the annual and seasonal scales.
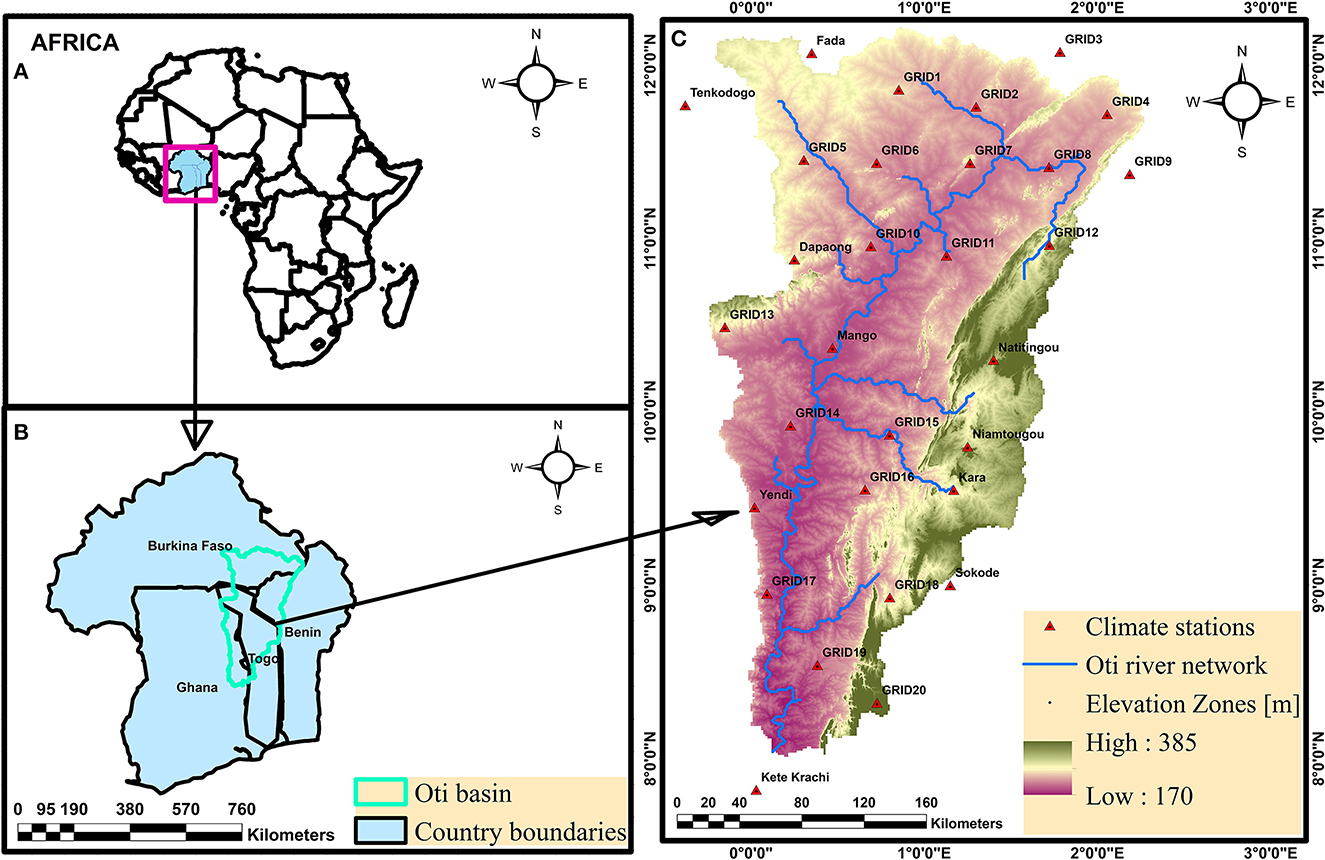
Figure 1. Map of the study area showing (A) location of Oti Riparian countries in Africa highlighted, (B) Oti River Basin (in green) shared by Ghana, Burkina Faso, Togo, and Benin, and (C) climate stations, elevation zones, and river network in the Oti basin.
The Ghana Meteorological Agency, the National Meteorological Service of Togo, and the Benin Meteorological Department provided daily maximum and minimum temperature data for eight climate stations within the Oti basin for the years 1981 to 2010. Additionally, due to the basin's limited spatial distribution of climate stations, gridded daily minimum and maximum temperature data for 22 gridded points were extracted from the National Aeronautics and Space Administration Prediction of Worldwide Energy Resource (NASA POWER) project for the period 1981–2010 (Stackhouse et al., 2018) (Table 1). The daily maximum and minimum temperature data were extracted for each gridded location using the respective geographic coordinates of 22 gridded points that had been previously used to extract rainfall data across the basin (Kwawuvi et al., 2022b). The temperature data were obtained in MS Excel (.csv) format. The NASA POWER datasets have been used throughout the region and have been verified to be universally consistent with ground data (Lizumi et al., 2014; Joseph et al., 2020).
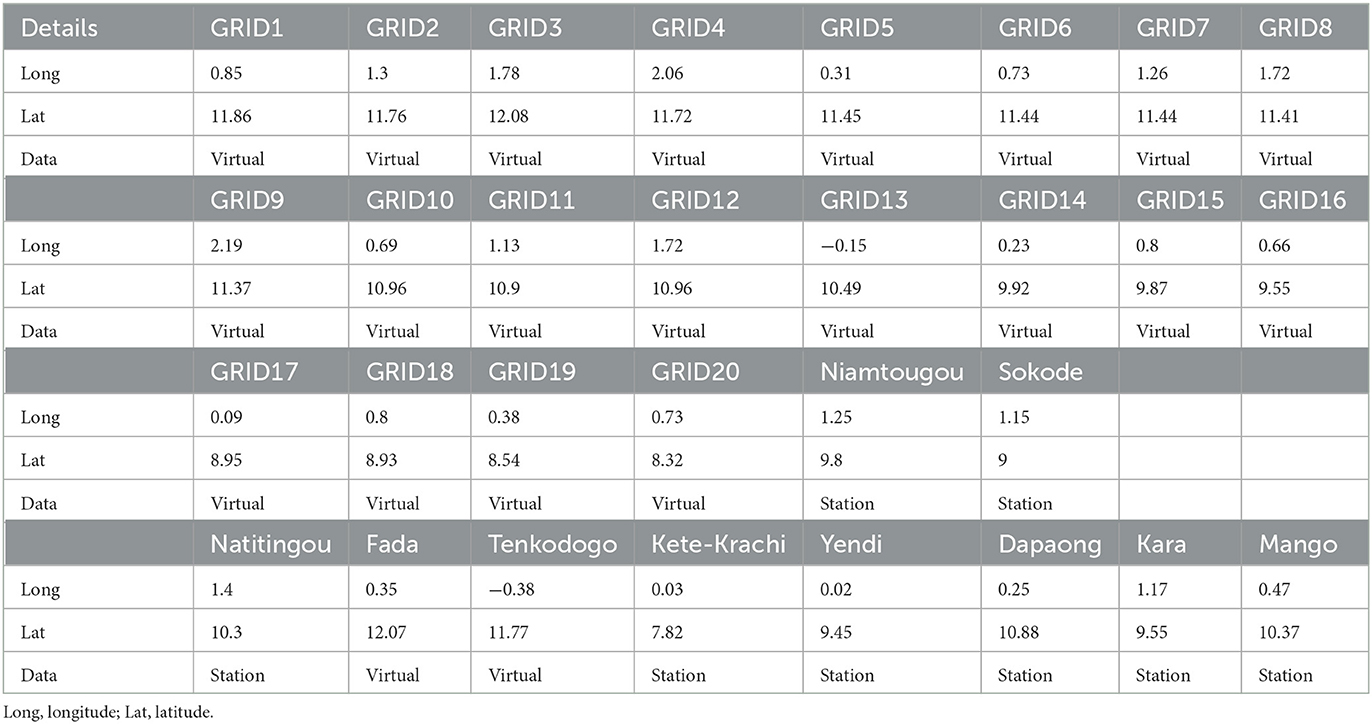
Table 1. Observed and virtual climate locations used for the study (1981–2010).
To project the future temperature in the Oti basin, the outputs of an ensembled mean of eight Global Circulation Models (GCMs) under the Coordinated Regional Climate Downscaling Experiment (CORDEX-Africa) were used (Table 2). These GCMs were downscaled by the Rossby Center regional atmospheric model (RCA4) at a spatial resolution of 0.44° × 0.44° (~50 km × 50 km) (Samuelsson et al., 2011; Kjellström et al., 2016). The reliability of the chosen Regional Climate Models (RCMs) and GCMs have been assessed, and the models showed reasonable levels of accuracy in replicating the Oti basin's temperature pattern (Kwawuvi et al., 2022b). The RCMs have already been bias-corrected using the quantile-quantile mapping procedure in Kwawuvi et al. (2022b). Daily simulated maximum and minimum temperature data for the period 2021–2050 under the Representative Concentration Pathways, RCP4.5, and RCP8.5 scenarios make up the output used in this study.
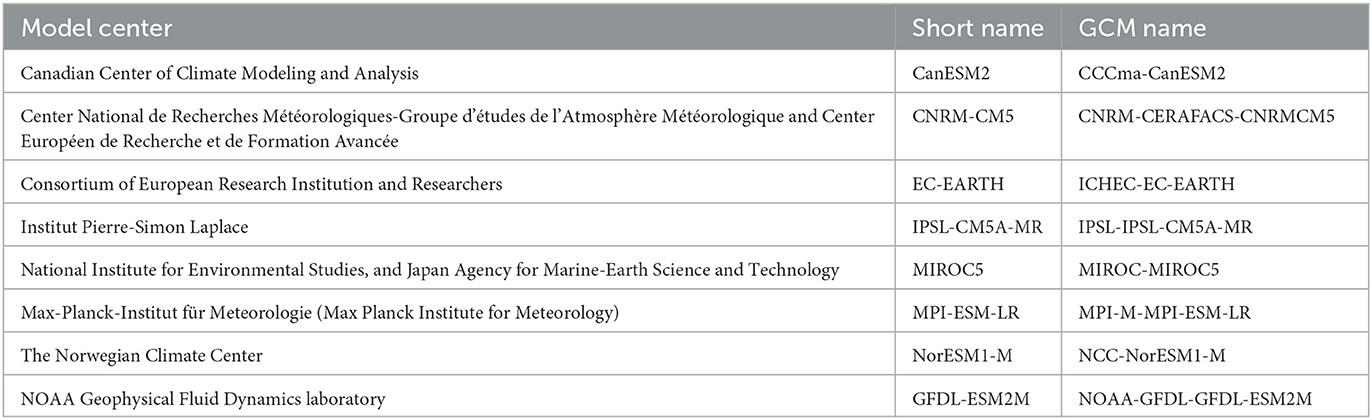
Table 2. RCA4-downscaled Global Climate Models (GCMs) used in this study.
Data quality for the eight stations was examined (Natitingou, Kete-Krachi, Yendi, Dapaong, Kara, Mango, Niamtougou, and Sokode). Four stations including Yendi, Dapaong, Kara, and Mango were found to have complete data for the period 1981–2010 and hence considered for validation. The validation exercise was done on a monthly scale. For each validation, the gridded and extracted values of NASA POWER temperature data were compared with the temperature data at the four stations that had complete data for 1981–2010. The validation of the NASA POWER temperature data was examined using commonly employed statistical indicators such as the Pearson correlation coefficient (r), bias, root-mean-square error (RMSE), and Nash–Sutcliffe efficiency (NSE). The position of the NASA POWER temperature data within the acceptable range of the time-series metric [(r = −1 to 1), (bias = 0 to ∞, with 1 being the perfect fit), (RMSE = 0 to ∞, with 0 being the perfect fit), and (NSE = – ∞ to 1, with 1 being the perfect fit)] demonstrated the accuracy of temperature data (Moriasi et al., 2007; Dembélé and Zwart, 2016; Bessah et al., 2020). After validation, a total of 22 grid points data were extracted for the work including four points that used a complete station observed data and four other points (Natitingou, Kete-Krachi, Niamtougou, and Sokode stations) that had station observed data but had their missing gaps filled with data from the NASA POWER extracted data as it has been previously demonstrated in Aguilar et al. (2009), Larbi et al. (2018), and Kwawuvi et al. (2022b). The statistical indicators were calculated as follows:
where Gi and Si are observed and NASA POWER data, respectively; Ḡ and are mean values of observed and satellite data; and N is the number of data pairs.
To evaluate the efficiency of the RCMs and their ensemble, the simulated temperature was compared with the observed temperature at the mean monthly scale. These have been performed and documented in a previous study by Kwawuvi et al. (2022b). It was found that the correlation between the raw models' ensemble mean and the observation was 0.82 and had an NSE of −0.38. However, after bias correcting the models, the correlation between the models' ensemble mean and the observation improved to 1.00 with an improved NSE of 0.99.
The mean annual temperature was analyzed from the daily maximum and minimum temperature data. The mean annual temperature was determined as the yearly average temperature for 30 stations in the basin for the observed period (1981–2010) and the future period (2021–2050). The standard deviation was also estimated for the observed and future periods. The standard deviation was estimated as
where represents each value from the data, is the data mean, and N is the size of the data.
The seasonal temperature averages were calculated based on the rainy season (AMJJASO) and the dry season (NDJFM) periods in the basin. The mean temperature projections over the Oti River basin were analyzed using the ensemble mean of eight RCMs. According to Luhunga et al. (2016), using the ensemble mean of RCMs improves the result of climate change scenario estimates. The future (2021–2050) temperature analyses considered the RCP4.5 and 8.5 scenarios. The estimated differences in annual means between the observed (1981–2010) and the near-future periods (2021–2050) reflect how much the yearly mean temperature will vary compared to past and future times. The projected changes in the mean temperature were obtained by subtracting the observed mean temperature from the anticipated mean temperature under both RCP4.5 and RCP8.5.
The analyzed mean annual temperature across the basin was spatially plotted using the inverse distance weighted (IDW) interpolation approach (Diodato and Ceccarelli, 2005; Lu and Wong, 2008).
To evaluate trends in mean annual temperature over the Oti River basin (ORB), the study used the modified Mann–Kendall (MK) trend statistics. It is a non-parametric trend test that serves as a tool for detecting monotonic trends within time series data (Mann, 1945; Sen, 1968; Kendall, 1975). The trends were computed in R software with the modified MK package and tested at a 0.05 significance level. Hence, a p-value of ≤ 0.05 shows a significant trend, whereas a p-value of >0.05 demonstrates a non-significant trend. The MK test contrasts the alternative hypothesis (H1) that there is a trend with the null hypothesis (Ho) that there is none (Önöz and Bayazit, 2003). The positive MK test results suggest rising tendencies, while negative ones reveal declining trends. All time series were initially examined for autocorrelation. When auto-correlated data were present, the time series were pre-whitened before trend computation using Eqs (6) to (11) (Pingale et al., 2016; Saini and Sahu, 2021). In situations where a time series exhibits positive autocorrelation, there is a tendency to underestimate the variance. Using the significant values of ρk, the correction factor for the variance is calculated (Pingale et al., 2016).
where n is the total observations, is the “effective” observations to consider for the autocorelation in the time series, and ρs(i) is the autocorrelation function of the ranks of the observations.
where ρ(i) is the parent autocorrelation function of rank of the observation.
The corrected variance is calculated as
where V(S) is the variance of the simple Mann–Kendall trend test (Kendall, 1975), and it is estimated as
where (xj−xk) is the signum function and S is the test statistic.
The modified Mann–Kendall test statistic Zmmk is determined as
Table 3 presents the validation results of NASA POWER temperature against observed temperature data at four stations in the basin from 1981 to 2010. The statistics show a good agreement with the station temperature data owing to the high correlation (r = 0.71–0.99) recorded; an acceptable bias within the range of 0.99–1.12; fairly low RMSE values between 0.01 and 0.92; and acceptable NSE values of 0.50 at Dapaong and 0.99 at Mango stations, whereas that of Yendi (−0.55) and Kara (−0.03) showed poor performances at the mean monthly scale. Yendi and Kara's NSE values are negative, which suggests that the measured value at these stations is a better predictor than the estimated values. These estimations agree with those made by Larbi et al. (2018) and Okafor et al. (2021), who also employed NASA POWER temperature and found a good correlation with NSE values when it was compared with local station data in the region. In summary, the outcomes of the evaluations suggest that the NASA POWER data matches the temperature pattern of the stations in the basin and, therefore, was used for subsequent investigation.
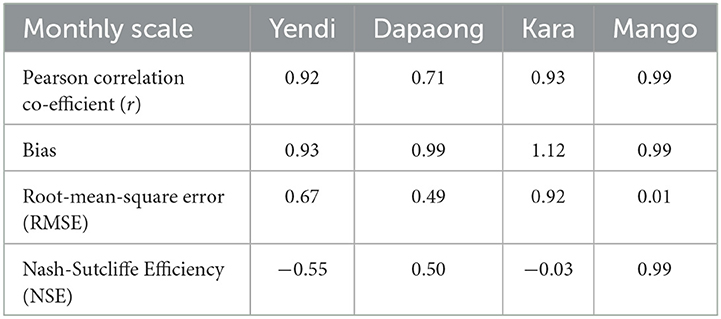
Table 3. Mean monthly statistics of stations and NASA POWER temperature in Oti basin (1981–2010).
The annual cycle of mean monthly temperature in the basin for the observed (1981–2010) and future periods (2021–2050) are shown in Figure 2. The mean temperature in the basin was found to likely increase in near future and under both climate change emission scenarios. For the observed period, mean temperature was the highest in April (30.49°C) and lowest (25.25°C) in December. However, in near future, the highest mean annual temperature would be recorded in March, at ~31.70 and 34.86°C under RCP4.5 and RCP8.5 scenarios, respectively, whereas the lowest mean temperature would be ~26.58°C (RCP4.5) and 28.26 (RCP8.5) in August. This trend change in future scenarios may be due to the non-linear responses of the climatic system to anthropogenic forcings such as an increase in greenhouse gas levels (Intergovernmental Panel on Climate Change, 1996). An increase in mean monthly temperature is anticipated from January to December. This increase is expected to be from +0.88°C (October) to +2.65°C (January) under RCP4.5 and from +2.71°C (July) to +6.48°C (January) under the RCP8.5 scenario. These outcomes align with the findings of Dembélé et al. (2022) who observed a clear rise in mean temperature between +0.6°C and +4.4°C under RCPs 2.6, 4.5, and 8.5, and at all months within the Volta Basin, during the period of 2021–2100. The basin's projection indicates a prospective exacerbation of aridity under both emission scenarios during the dry season (November–March) within the basin (Ankomah-Baffoe et al., 2021).
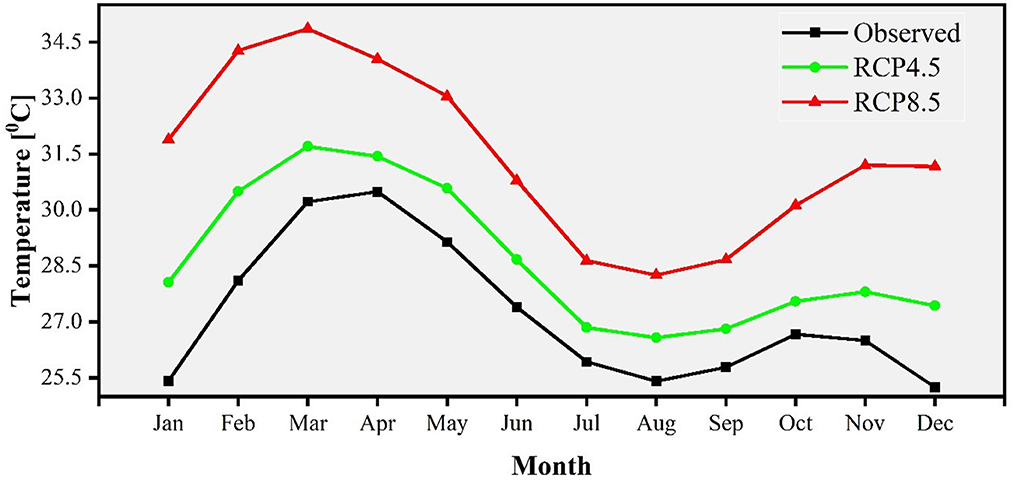
Figure 2. Annual cycle of mean monthly temperature during the observed (1981–2010) and future period (2021–2050).
The result depicts that the mean annual temperature across the entire basin was 27.18°C (±0.33°C) which varied between 25.39°C at GRID 20 and 28.91°C at Mango during the observed historical period (1981–2010). In near future and under the RCP4.5 scenario, the mean annual temperature is anticipated to be ~28.65°C (±0.26°C) and would vary from 27.1°C at GRID20 to 29.82°C at GRID3. The future mean annual temperature is expected to be ~31.38°C (±0.43°C) and would vary between 28.21°C at Natitingou and 33.39°C at GRID3 under the RCP8.5 emission scenario (Table 4). This corroborates The New Humanitarian's (2013) assertion that rising average yearly temperature is one of the basin's most important signs of approaching climate change. Volta basin's yearly temperature pattern was found to be rising at all examined sites by Kabo-Bah et al. (2016). These temperature rises have led to a higher rate of water loss in the basin.
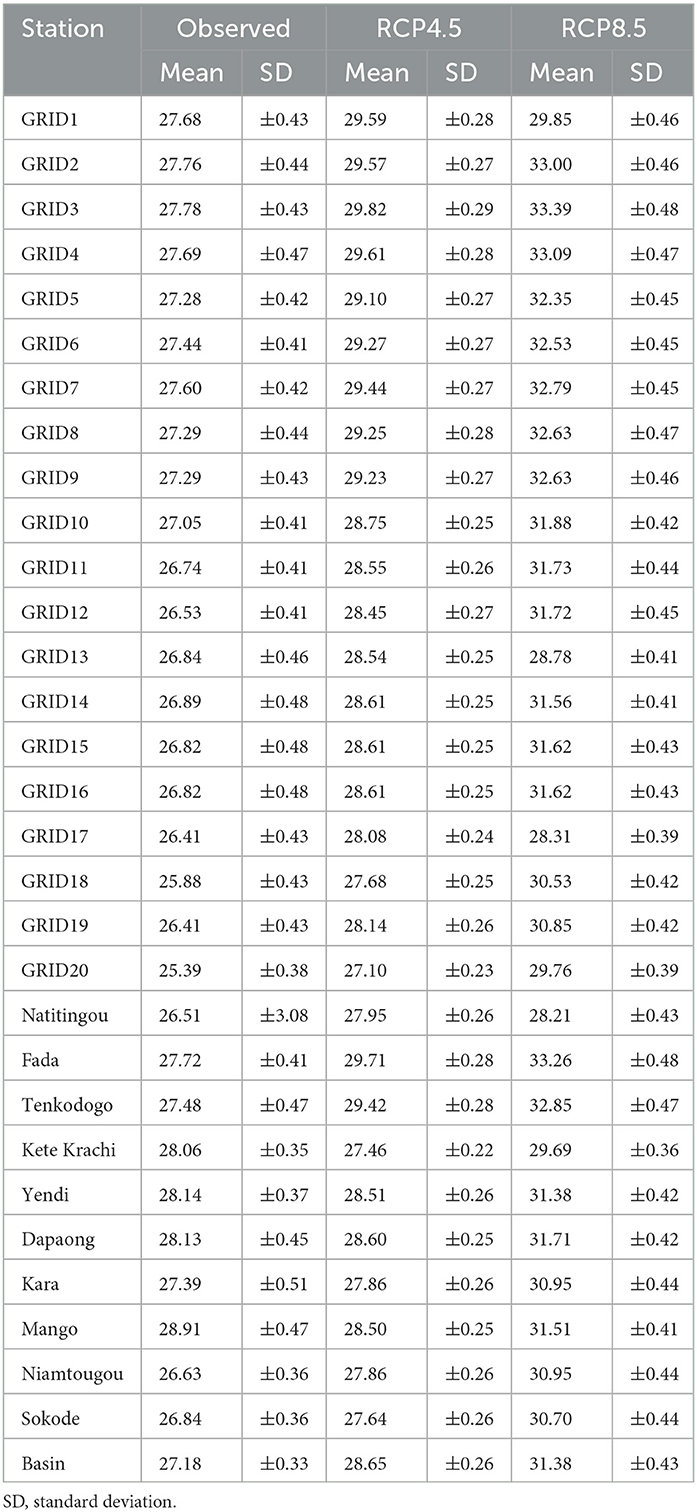
Table 4. Mean annual temperature and standard deviation in the Oti River basin.
It is observed that the spatial variability of mean temperature is low in the southern part of the basin as compared to the central and northern parts for the observed and future periods (Figure 3). As we proceed from the stations in the basin's southern part to the northern region, the mean temperature appears to increase. During the observed period, stations that exhibited elevated average temperature values of 28.14°C, 28.13°C, and 28.91°C were Yendi, Dapaong, and Mango, respectively. According to the RCP4.5 scenario, it is expected that the average temperature of the basin will undergo a significant increase in near future, with the northern parts experiencing the greatest temperature rise. Similarly, the RCP8.5 predicts a generally high increase in mean annual temperature except for stations such as GRID1, where the expected temperature elevation would be moderate, whereas GRID13, GRID17, and Natitingou anticipate a relatively lower mean temperature (Figure 3).
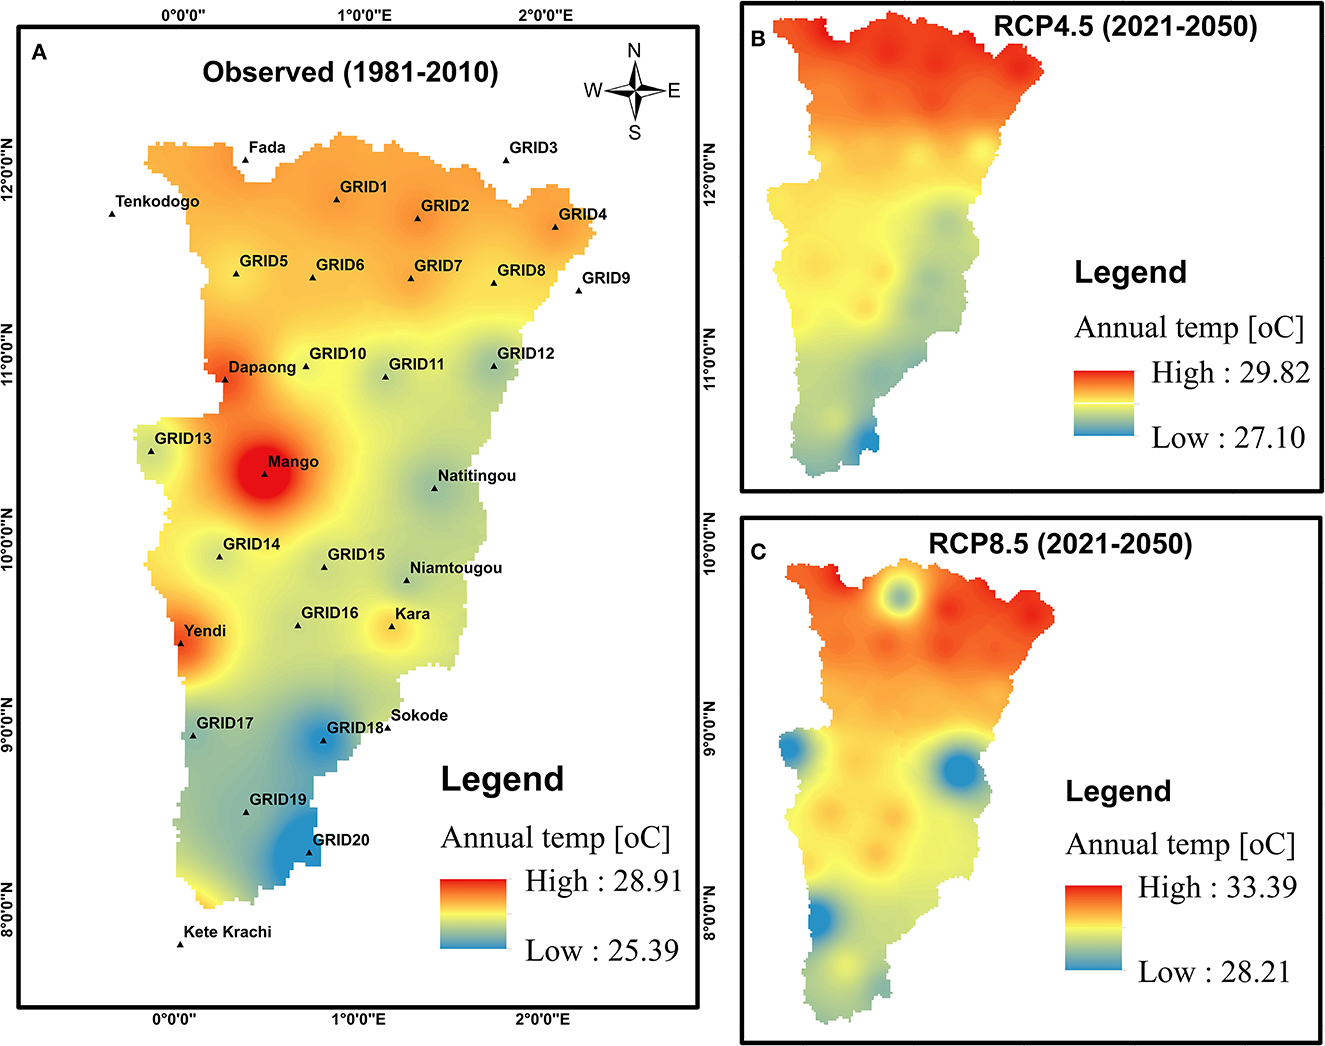
Figure 3. Spatial trends in mean annual temperature in the Oti River basin for (A) the observed period (1981–2010) and future period (2021–2050), (B) RCP4.5 scenario, and (C) RCP8.5 scenario.
Table 5 shows the outcomes of the modified Mann–Kendall test at a significance level of 0.05 for the mean annual temperature. As portrayed, the basin recorded a mixture of increasing and decreasing trends during the observed period. Stations such as Kete-Krachi, Yendi, Mango, Niamtougou, and Sokode had a significantly increasing trends, whereas GRID1 to GRID11, GRID13 to GRID17, GRID19, Fada, Tenkodogo, Dapaong, and Kara recorded non-significantly decreasing trends. GRID12, GRID18, GRID20, and Natitingou had decreasing trends with only the trend at Natitingou being significant. The entire basin had a non-significantly increasing trend with a mean magnitude of 0.011°C. This trend confirms the considerable warming signals that occurred in the basin between 1983 and 2010 (Sylla et al., 2016). The results align with those of Aziz and Obuobie (2017), who discovered a statistically significant rise in mean temperature in the Black Volta River Basin between 1981 and 2010 at a 5% significance level and with a 0.03 magnitude of increase. In near future, under the RCP4.5 and RCP8.5, all the stations in the basin are projected to have significantly increasing trends. The magnitude of these trends could range from 0.018 to 0.027 under the RCP4.5, whereas that of RCP8.5 would be between 0.034 and 0.051. Ilori and Ajayi (2020) also discovered that the magnitude of change in temperature over West Africa was predicted to range from 0.025 to 0.033 under RCP4.5 and from 0.057 to 0.063 under RCP8.5. A large rise in the mean annual temperature could accompany this change.
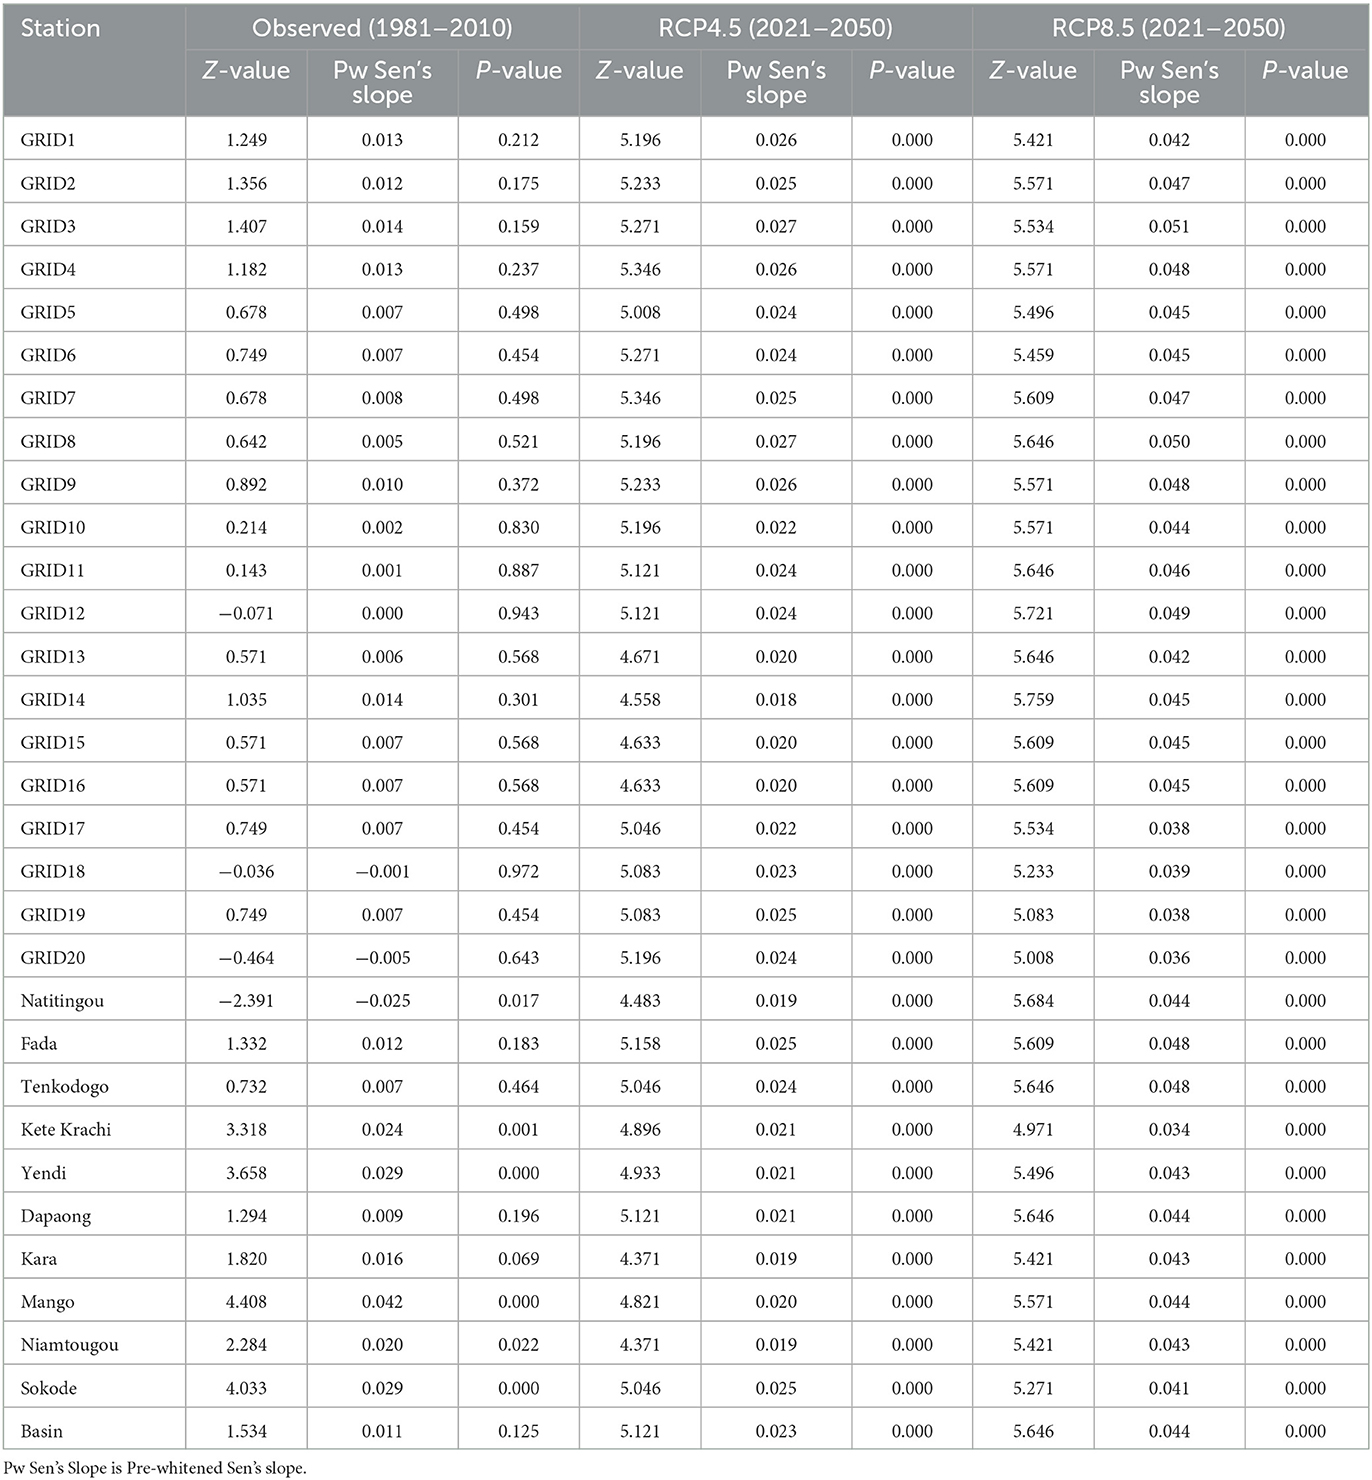
Table 5. Trend test statistics in mean annual temperature for the observed (1981–2010) and future period (2021–2050).
An increase was seen northward of the basin from the south according to the seasonal distribution of mean temperature during the observed period (Figure 4). The rainy season's mean annual temperature is projected to be the highest at GRID3 (30.26°C) and the lowest at GRID20 (26.52°C), with a basin mean of 28.35°C under the RCP4.5 scenario. Under the RCP8.5, temperature would range between GRID17 (27.62°C) and GRID3 (33.19°C) with a basin mean of 30.93°C. In the dry season, the RCP4.5 projects the highest temperature to occur at GRID7 (29.78°C) while the lowest would be at GRID20 (27.94°C) with a basin mean of 29.1°C. Under the RCP8.5, temperature would range between 28.9°C at Natitingou and 34.18°C at GRID7, with a basin mean of 33.22°C. Warmer temperatures expected during both the wet and dry seasons could shorten the agricultural cycle and decrease food production in the basin (Roudier et al., 2011; Sultan et al., 2013).
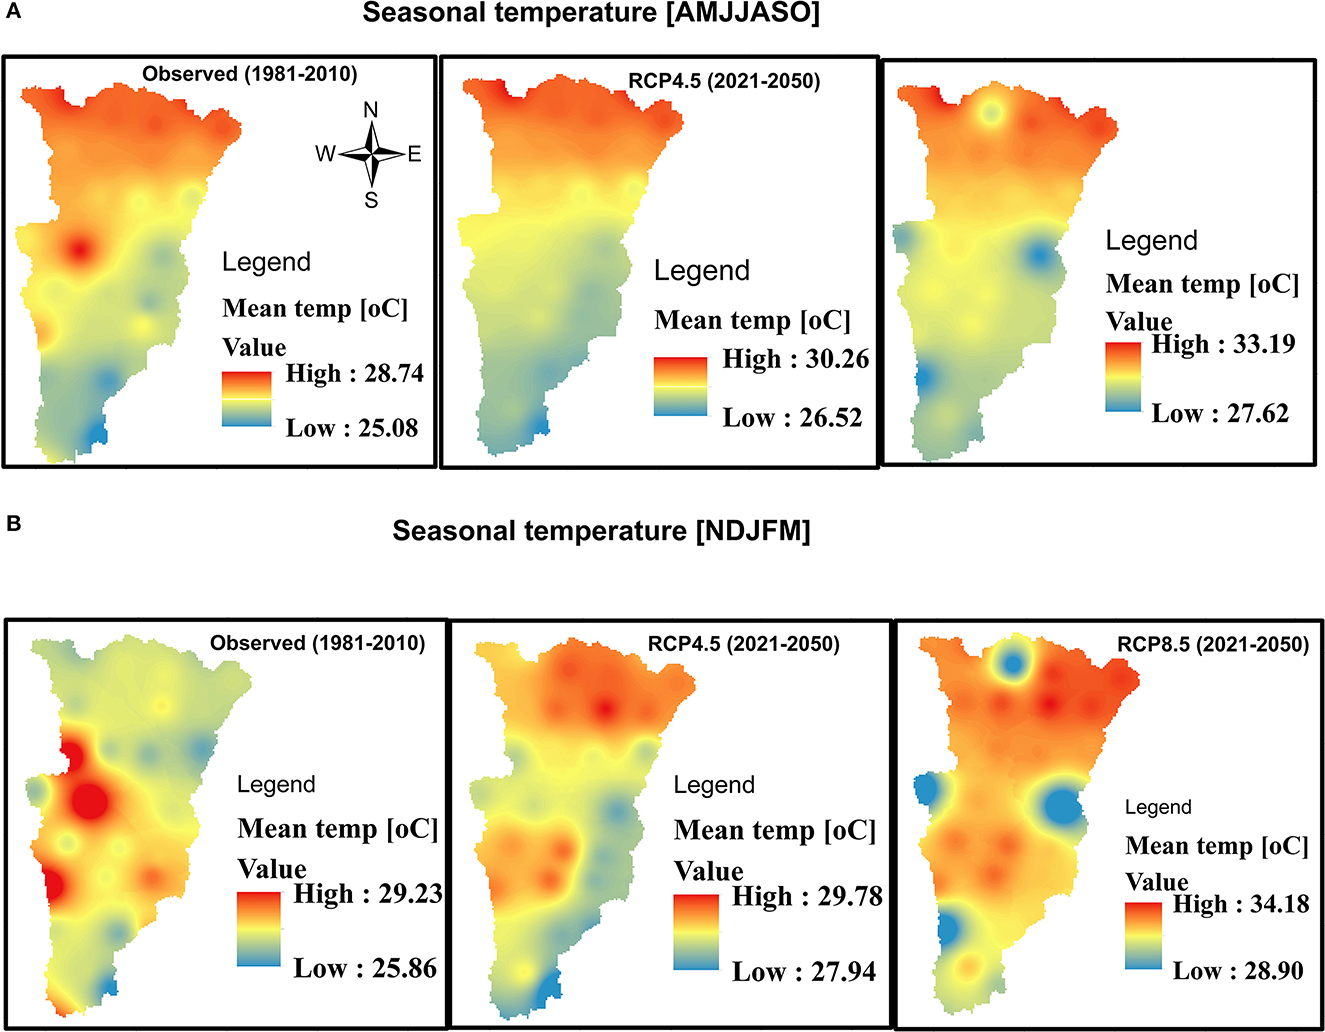
Figure 4. Spatial trends in mean annual temperature for (A) rainy season and (B) dry season in the Oti River basin.
From Figure 5, the mean annual temperature in the basin is projected to increase at the temporal scale (2021–2050). The models' mean ensemble projected the hottest year of 28.88°C mean temperature for 2049 under the RCP4.5 and in the rainy season (AMJJASO). For the RCP8.5 scenario, the hottest year would be 2048 and would have a mean temperature of ~31.28°C. Concerning the dry season (NDJFM) period, 2049 would be the warmest with a mean temperature of ~29.72°C under the RCP4.5, while the RCP8.5 predicts that the hottest mean temperature of 33.71°C occur in 2048. The increase in warm climatic conditions within the basin may have implications for a variety of ecosystem services, including the production of crops (Shrestha and Roachanakanan, 2021) during the rainy season.
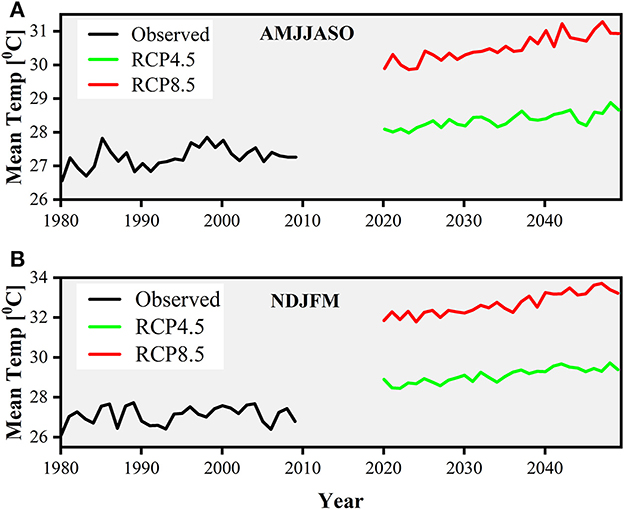
Figure 5. Temporal trends in mean annual temperature for (A) rainy (AMJJASO) season and (B) dry (NDJFM) season in the Oti basin.
With respect to the basin's projected yearly mean temperature, Kete-Krachi and Mango were the only two out of the thirty stations which could have a reduced mean temperature by ~-0.6 and −0.41°C, respectively, in the future period 2021–2050. All of the stations projected a temperature increase for both RCP4.5 and RCP8.5. Under the RCP4.5, the change in mean temperature could vary between −0.6 and +2.04°C and is anticipated to vary between +1.63 and +5.61°C under the RCP8.5 scenario. In the entire basin, mean temperature is predicted to increase by +1.47°C (RCP4.5) and +4.20°C (RCP8.5) relative to the baseline period (Table 6). Additionally, it should be emphasized that the warming trend is greater under the RCP8.5 scenario than under the RCP4.5 scenario. The warmer climate projected in the basin under both RCP4.5 and RCP8.5 is consistent with the IPCC (2013) report which stated that warmer climate would be experienced in the late end of the 21st century. Aziz and Obuobie (2017) also discovered in their study that the anticipated temperature increase in the Black Volta River basin was significant. Toward the end of the 21st century, the surface temperature worldwide may have risen by more than 1.5°C compared to the pre-modern temperature, and it may have risen even more or less depending on the location according to the IPCC's fifth assessment report (IPCC, 2014).
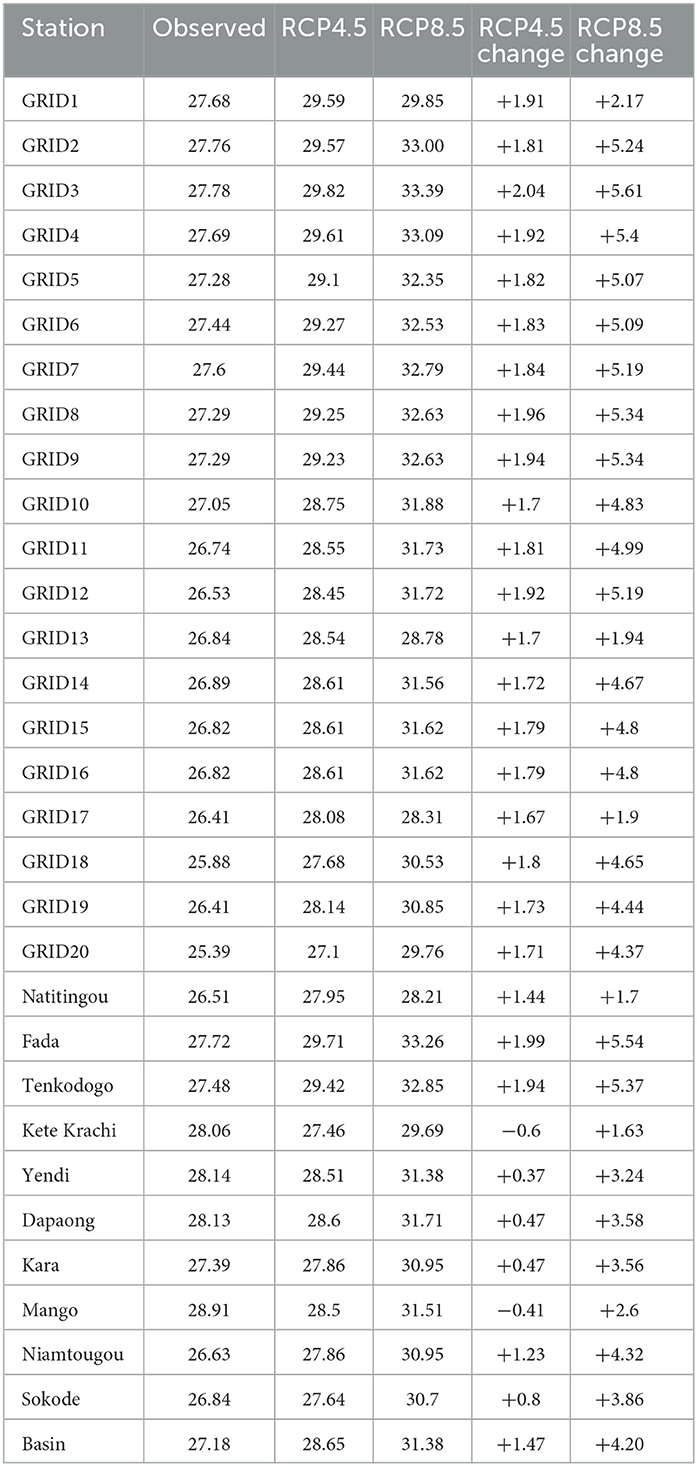
Table 6. Projected changes in mean annual temperature (°C) in 2021–2050.
The spatial distribution of mean temperature in the basin shows that in near future and under the RCP4.5 scenario, mean annual temperature is anticipated to increase in the northern part of the basin and with significant changes also expected in the southern part (Figure 6). The changes would increase from the south toward the northern part of the basin. The RCP4.5 projects a majority of the stations to the increase in mean annual temperature with the highest increase expected to be ~+2.04°C which would occur at GRID3, except Kete-Krachi and Mango, where the mean annual temperature is expected to be ~-0.41 and −0.6°C, respectively. The mean annual temperature in the entire basin is expected to increase by ~+1.47°C. Under the RCP8.5 scenario, an increase in mean annual temperature is projected at all stations in the basin, and the highest increase would be ~+5.61°C which is anticipated to occur at GRID3, while the lowest increase of ~+1.63°C is expected to occur at Kete-Krachi. In the entire basin, the mean annual temperature is expected to increase by ~+4.2°C. These findings align with the study of Sylla et al. (2016), who found that the air temperature over West Africa had increased significantly and was expected to continue to do so up to 6.5°C. Additionally, it supports the findings of Ofori et al. (2021), who found that the average temperature on the African continent is expected to increase by 3–6°C by the end of the century, which is higher than the worldwide mean value. Furthermore, Dembélé et al. (2022) maintain that a 5% increase in the yearly mean temperature results in a corresponding elevation of ~3% in potential evaporation, and this could subsequently result in reduced surface and subsurface runoff, diminished groundwater retention, and complications in water management (Maček et al., 2018).
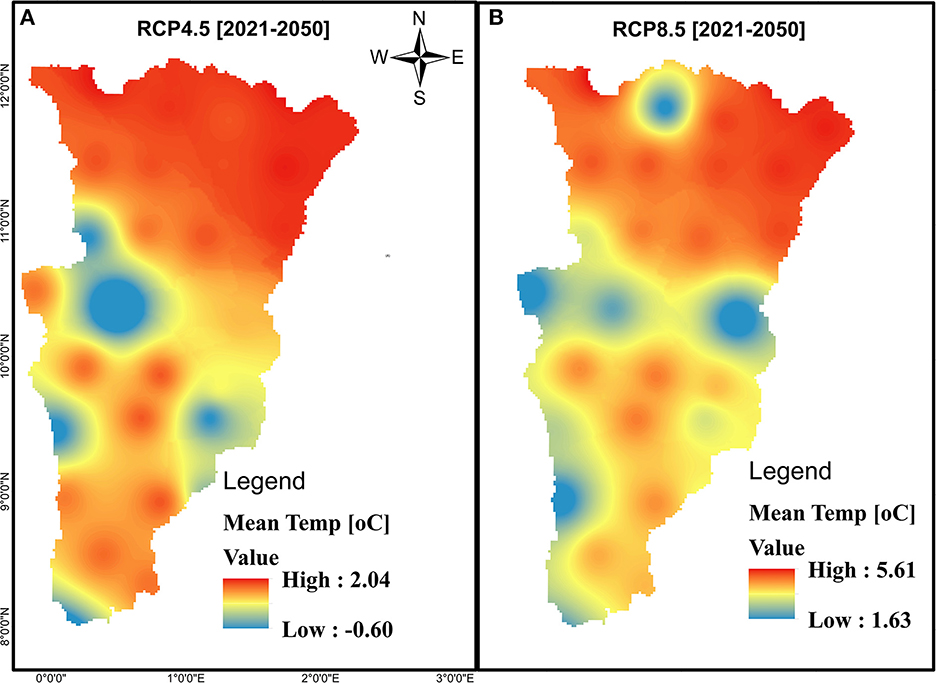
Figure 6. Spatial change of future mean annual temperature in the Oti River basin in the future period (2021–2050) under (A) RCP4.5 scenario and (B) RCP8.5 scenario.
The projected increasing trends in mean temperature over the basin could have severe consequences on the basin. During the onset of dry seasons when limited or no rainwater accumulates, a rise in temperature results in increased rates of evapotranspiration and increasing water demand (Das et al., 2022). In Africa and West Asia, the production of crops that relied on atmospheric temperature variation was reduced by 15%−35%, while a decrease of between 25 and 35% in the Middle East, respectively, was attributed to a rise in mean temperature from 2 to 4°C (Food and Agricultural Organization, 2001). One of the main factors affecting agricultural output is the climate, which includes elements such as rainfall, temperature, sunshine, wind speed, and direction [Food and Agriculture Organization (FAO), 2017]. Consequently, significant changes to these elements could threaten sectors, notably agriculture (Raza et al., 2019). The expected temperature fluctuations might adversely affect the Oti River basin as it provides revenue and a means of subsistence to many different nations. The expected rise in the average annual temperature and its upward pattern might result in less water being available for farming, reducing agricultural output (Bessah et al., 2020). In particular, increased soil aridity could result from the expected rise in temperature which might pose as a risk to plants such as vegetables cultivated in the basin (Diallo et al., 2016; Monerie et al., 2016). It is known that in regions such as the Sahel in West Africa, many plants typically thrive under temperatures that are at the optimum. Therefore, further temperatures rise could result in poorer agricultural output (Amuji et al., 2020), particularly when excessive temperatures occur during a crucial period of plant development (Firmansyah and Argosubekti, 2020). This is supported by the study of Lobell et al. (2008), who discovered that in the coming 20 years, Northern China's main agricultural outputs are anticipated to decline as a result of rising temperatures. In addition to causing the spread of livestock illnesses and parasites from increased temperatures, the amount and value of fodder, grain, and pasture could also be affected in the basin (Henrietta et al., 2020).
A change in the water cycle could emerge from rising temperatures because the atmosphere's ability to hold more water would rise, and consequently, lead to worldwide mean rainfall increment (He et al., 2017; Ahmed et al., 2020; Hu et al., 2020). Depending on the location, temperature rise could decrease rainfall due to the deepening of the seasonal cycle and an increased prevalence of catastrophic incidents according to Piani et al. (2010). Thus, many places may face droughts because of elevated levels of evaporation and altering wind conditions, while other areas may suffer flooding (Ahmed et al., 2020). According to estimates, the length and regularity of the hot summer days have increased in several regions of the world (Ahmed et al., 2020). For instance, at a 2°C increase in temperature in Africa, the amount of water available is likely to decline by 20%−30% (Brahic, 2007). Given that rising temperatures would cause evaporation to rise and could result in droughts, it could also have a detrimental impact on the basin's regular flows (Gulacha and Mulungu, 2016; Karam et al., 2022). Higher evaporation levels, decreased river discharge, and more frequent water deficits are all effects of elevated temperatures (Stagl et al., 2014; Miller et al., 2021). Water shortages brought on by warming temperatures could alter the basin's operational activities and pose risks to water supply facilities (Kundzewicz et al., 2008; Howard et al., 2016).
Along with the effects already described, the coastal people may also experience hardship due to the expected temperature increase because they depend largely on the basin for household tasks. The accessibility of usable water for domestic use by the inhabitants may decrease due to flooding and drought conditions that may be brought on by an increase in temperature (Abedin et al., 2019). According to Hunter et al. (2010), a number of water-borne diseases are also linked to the lack of safe water supplies for domestic use. For instance, Lama et al. (2004) reported that warmer temperatures are linked to water-borne diseases, such as diarrhea, and the breakout and spread of diseases (Elderd and Reilly, 2014). According to Brahic (2007), a rise in temperature of 2°C exposes between 40 and 60 million individuals in Africa to malaria. Additionally, the organic carbon dynamics of soils may be impacted by the anticipated elevated temperatures of +1.47 and +4.2°C in the basin (Biswas et al., 2018). This is supported by Crowther et al. (2016) whose investigation reveals that carbon would be lost from the top soil strata at a rate ranging from 30 to 203 petagrams for every degree Celsius of soil temperature rise (0–15 cm).
This study offers perspectives on the anticipated temperature patterns within West Africa's Oti River basin for the period 2021–2050. It did so by using an ensemble mean of eight RCA4 models from the CORDEX-Africa project (Coordinated Regional Climate Downscaling Experiment), under RCP4.5 and RCP8.5 emission scenarios. The study also evaluated the observed temperature trends for the period 1981–2010, using temperature data from meteorological stations and the National Aeronautics and Space Administration Prediction of Worldwide Energy Resources (NASA POWER). The study identified changes in annual temperature within the basin as well as for the rainy season (April–October) and the dry season (November–March) in the basin for the future period (2021–2050).
The study revealed that the annual cycle of mean monthly temperature was the highest in the month of April at 30.49°C, while the lowest of 25.25°C occurred in December during the observed period. However, the highest mean monthly temperature in the future is expected to be recorded in March (31.70°C) while the lowest (26.58°C) is anticipated in August under the RCP4.5 scenario. Similarly, the RCP8.5 scenario projects the highest mean temperature to be in March (34.86°C) and the lowest to be in August (28.26°C). Moreover, the study projected the mean annual temperature changes in the basin to range between −0.6 and +2.04°C (RCP.45) and +1.63 and +5.61°C (RCP8.5), while the mean annual temperature for the entire basin is projected to be +1.47 and +4.2°C under the RCP4.5 and RCP8.5 emission scenarios, respectively. In addition, the mean annual temperature in the observed period was the highest at 28.74 and the lowest at 25.08°C. The RCP4.5 scenario projects the highest mean annual temperature to be 30.26°C and the lowest to be 26.52°C, whereas the RCP8.5 predicts the highest to be 33.19°C and the lowest to be 27.62°C.
The anticipated changes in temperature could present challenges to agricultural productivity within the basin wherein crop cultivation, animal husbandry, and fishing activities underpin the livelihoods of the surrounding communities. It is plausible that alterations within the hydrological cycle may transpire, an event that could lead to both droughts and flooding within the basin. Such occurrences could have consequential effects on agricultural pursuits and stifle the natural flow of the basin. As a way of adapting to the anticipated changes in temperature in the basin, farmers could engage in cultivating crop varieties that are drought-tolerant or require higher temperatures. Policymakers could also implement measures to conserve water particularly, during times of unassigned and wet conditions, to preserve and enhance the hydrological functions of the basin. This initiative will enable the dispensation of water for agricultural and other vital purposes amidst the adverse climate conditions.
The datasets generated for this study can be found in CORDEX-Africa (https://climate4impact.eu) and NASA POWER (https://power.larc.nasa.gov/data-access-viewer/). Further inquiries on the stations can be directed to the corresponding author.
DK developed the idea and completed the majority of the analysis and writings. DM, SA, and EB supervised the manuscript writing and reviewed it. GY and WA helped with the data analysis and review. All authors contributed to the article and approved the submitted version.
The German Federal Ministry of Education and Research (BMBF) and the West African Science Service Center on Climate Change and Adapted Land Use (WASCAL) are gratefully thanked by the authors for their financial support. For the temperature data, the authors additionally acknowledge Ghana, Togo, and Benin's meteorological services. The authors also thank CORDEX-Africa (https://climate4impact.eu), which provides free access to and downloads of its models, and NASA-POWER (https://power.larc.nasa.gov/data-access-viewer/), which makes its data freely available.
The authors declare that the research was conducted in the absence of any commercial or financial relationships that could be construed as a potential conflict of interest.
All claims expressed in this article are solely those of the authors and do not necessarily represent those of their affiliated organizations, or those of the publisher, the editors and the reviewers. Any product that may be evaluated in this article, or claim that may be made by its manufacturer, is not guaranteed or endorsed by the publisher.
Abedin, M. A., Collins, A. E., Habiba, U., and Shaw, R. (2019). Climate change, water scarcity, and health adaptation in southwestern coastal bangladesh. Int. J. Disaster Risk Sci. 10, 28–42. doi: 10.1007/s13753-018-0211-8
African Development Bank (2018). “African Development Bank Group (AfDB),” in Country Strategy Paper 2018–2022, 77–80. doi: 10.1787/9789264262065-8-en
Aguilar, E., Barry, A. A., Brunet, M., Ekang, L., Fernandes, A., Massoukina, M., et al. (2009). Changes in temperature and precipitation extremes in western central Africa, Guinea Conakry, and Zimbabwe, 1955-2006. J. Geophys. Res. Atmos. 114, 1–11. doi: 10.1029/2008JD011010
Agyekum, J., Annor, T., Lamptey, B., Quansah, E., and Agyeman, R. Y. K. (2018). Evaluation of CMIP5 global climate models over the volta basin: precipitation. Adv. Meteorol. 2018, 1–24. doi: 10.1155/2018/4853681
Ahmed, T., Zounemat-Kermani, M., and Scholz, M. (2020). Climate change, water quality and water-related challenges: a review with focus on Pakistan. Int. J. Environ. Res. Public Health 17, 1–22. doi: 10.3390/ijerph17228518
Akumaga, U., and Tarhule, A. (2018). Projected changes in intra-season rainfall characteristics in the Niger River Basin, West Africa. Atmosphere 9, 1983–1985. doi: 10.3390/atmos9120497
Amuji, C. F., Beaumont, L. J., and Rodriguez, M. E. (2020). Simulating the impact of projected west african heatwaves and water stress on the physiology and yield of three tomato varieties. Adv. Hortic. Sci. 34, 147–156. doi: 10.13128/ahsc-8494
Ankomah-Baffoe, J., Yawson, D. O., and Okae-Anti, D. (2021). Assessment of the impacts of climate change on some hydrological processes of the Densu River Basin, Ghana. Ghana J. Geogr. 13, 147–166. doi: 10.4314/gjg.v13i1.8
Annor, T., Lamptey, B., Wagner, S., Oguntunde, P., Arnault, J., Heinzeller, D., et al. (2017). High-resolution long-term WRF climate simulations over Volta Basin. Part 1: validation analysis for temperature and precipitation. Theor. Appl. Climatol. 133, 829–849. doi: 10.1007/s00704-017-2223-5
Awotwi, A., Annor, T., Anornu, G. K., Quaye-Ballard, J. A., Agyekum, J., Ampadu, B., et al. (2021). Climate change impact on streamflow in a tropical basin of Ghana, West Africa. J. Hydrol. Reg. Stud. 34, 1–25. doi: 10.1016/j.ejrh.2021.100805
Aziz, F., and Obuobie, E. (2017). Trend analysis in observed and projected precipitation and mean temperature over the Black Volta Basin, West Africa. Int. J. Curr. Eng. Technol. 7, 1400–1412.
Badjana, H. M., Renard, B., Helmschrot, J., Edjamé, K. S., Afouda, A., and Wala, K. (2017). Bayesian trend analysis in annual rainfall total, duration and maximum in the Kara River basin (West Africa). J. Hydrol. Reg. Stud. 13, 255–273. doi: 10.1016/j.ejrh.2017.08.009
Badjana, H. M., Selsam, P., Wala, K., Flügel, W.-A., Fink, M., Urban, M., et al. (2014). Assessment of land-cover dynamics in a sub-catchment of Oti basin (West Africa): a case study of Kara river basin. Zbl. Geol. Paläont. Teil I Jg. 1, 151–170. doi: 10.1127/zgpI/2014/0151-0170
Barry, B., Obuobie, E., Andreini, M., Andah, W., and Pluquet, M. (2005). “The Volta River Basin,” in The Volta River Basin. Comprehensive Assessment of Water Management in Agriculture. Comparative Study of River Basin Development and Management. Available online at: http://armspark.msem.univ-montp2.fr/bfpvolta/admin/biblio/CA-VoltaRiver~basin.doc (accessed July 12, 2022).
Bates, B. C., Kundzewicz, Z. W., Wu, S., and Palutikof, J. P., (eds.). (2008). Climate Change and Water. Technical Paper of the Intergovernmental Panel on Climate Change, IPCC Secretariat. Geneva, 210.
Bessah, E., Raji, A. O., Taiwo, O. J., Agodzo, S. K., and Ololade, O. O. (2020). The impact of varying spatial resolution of climate models on future rainfall simulations in the pra river basin (Ghana). J. Water Clim. Change 11, 1263–1283. doi: 10.2166/wcc.2019.258
Biswas, B., Qi, F., Biswas, J. K., Wijayawardena, A., Khan, M. A. I., Naidu, R., et al. (2018). The fate of chemical pollutants with soil properties and processes in the climate change paradigm—a review. Soil Syst. 2, 1–20. doi: 10.3390/soilsystems2030051
Blanc, E. (2012). The impact of climate change on crop yields in Sub-Saharan Africa. Am. J. Clim. Change 01, 1–13. doi: 10.4236/ajcc.2012.11001
Brahic, C. (2007). The impacts of rising global temperatures. Daily News 2. Available online at: https://www.newscientist.com/article/dn11089-the-impacts-ofrising-global-temperatures/ (accessed January 7, 2023).
Choi, Y.-W., Campbell, D. J., Aldridge, J. C., and Eltahir, E. A. (2021). Near-term regional climate change over Bangladesh. Clim. Dyn. 57, 3055–3073. doi: 10.1007/s00382-021-05856-z
Crowther, T. W., Todd-Brown, K. E. O., Rowe, C. W., Wieder, W. R., Carey, J. C., Machmuller, M. B., et al. (2016). Quantifying global soil carbon losses in response to warming. Nature 540 104–108. doi: 10.1038/nature20150
Das, S., Datta, P., Sharma, D., and Goswami, K. (2022). Trends in temperature, precipitation, potential evapotranspiration, and water availability across the Teesta River Basin under 1.5 and 2°C temperature rise scenarios of CMIP6. Atmosphere 13, 1–22. doi: 10.3390/atmos13060941
Dembélé, M., Vrac, M., Ceperley, N., Zwart, S. J., Larsen, J., Dadson, S. J., et al. (2022). Contrasting changes in hydrological processes of the Volta River basin under global warming. Hydrol. Earth Syst. Sci. 26, 1481–1506. doi: 10.5194/hess-26-1481-2022
Dembélé, M., and Zwart, S. J. (2016). Evaluation and comparison of satellite-based rainfall products in Burkina Faso, West Africa. Int. J. Remote Sens. 37, 3995–4014. doi: 10.1080/01431161.2016.1207258
Diallo, I., Giorgi, F., Deme, A., Tall, M., Mariotti, L., Gaye, A. T., et al. (2016). Projected changes of summer monsoon extremes and hydroclimatic regimes over West Africa for the twenty-first century. Clim. Dyn. 47, 3931–3954. doi: 10.1007/s00382-016-3052-4
Diba, I., Camara, M., and Diedhiou, A. (2019). Impacts of the sahel-sahara interface reforestation on West African Climate: intra-annual variability and extreme temperature events. Atmos. Clim. Sci. 09, 35–61. doi: 10.4236/acs.2019.91003
Diodato, N., and Ceccarelli, M. (2005). Interpolation processes using multivariate geostatistics for mapping of climatological precipitation mean in the Sannio Mountains (southern Italy). Earth Surf. Process. Landf. 30, 259–268. doi: 10.1002/esp.1126
Elderd, B. D., and Reilly, J. R. (2014). Warmer temperatures increase disease transmission and outbreak intensity in a host-pathogen system. J. Anim. Ecol. 83, 838–849. doi: 10.1111/1365-2656.12180
Firmansyah and Argosubekti, N.. (2020). A review of heat stress signaling in plants. IOP Conf. Ser. Earth Environ. Sci. 484, 1–11. doi: 10.1088/1755-1315/484/1/012041
Food and Agricultural Organization (2001). Global Forest Resources Assessment 2000: Main Report Forestry Paper 140. Rome: FAO.
Food Agriculture Organization (FAO) (2017). The Future of Food and Agriculture – Trends and challenges. Rome. Available online at: https://www.fao.org/3/i6583e/i6583e.pdf (accessed February 16, 2022).
Food Agriculture Organization Economic Commission for Africa (2018). Regional Africa Overview of Food Security and Nutrition. Available online at: https://www.fao.org/3/CA2710EN/ca2710en.pdf (accessed December 23, 2022).
Gulacha, M. M., and Mulungu, D. M. M. (2016). Generation of climate change scenarios for precipitation and temperature at local scales using SDSM in Wami-Ruvu River Basin Tanzania. Phys. Chem. Earth 100, 62–72. doi: 10.1016/j.pce.2016.10.003
Gurara, M. A., Jilo, N. B., and Tolche, A. D. (2023). Modelling climate change impact on the streamflow in the Upper Wabe Bridge watershed in Wabe Shebele River Basin, Ethiopia. Int. J. River Basin Manag. 21, 181–193. doi: 10.1080/15715124.2021.1935978
He, J., Glotfelty, T., Yahya, K., Alapaty, K., and Yu, S. (2017). Does temperature nudging overwhelm aerosol radiative effects in regional integrated climate models? Atmos. Environ. 154, 42–52. doi: 10.1016/j.atmosenv.2017.01.040
Henrietta, U. U., Fani, D. C. R., Ngo, N. V., Emmanuel, O. N., and Odularu, G. (2020). “Crop and livestock production responses to rainfall and temperature variation in West Africa,” in Nutrition, Sustainable Agriculture and Climate Change in Africa, ed G. Odularu (Springer International Publishing), 13–28. doi: 10.1007/978-3-030-47875-9_2
Howard, G., Calow, R., Macdonald, A., and Bartram, J. (2016). Climate change and water and sanitation: likely impacts and emerging trends for action. Annu. Rev. Environ. Resour. 41, 253–276. doi: 10.1146/annurev-environ-110615-085856
Hu, Y., Gao, M., and Batunacun. (2020). Evaluations of water yield and soil erosion in the Shaanxi-Gansu Loess Plateau under different land use and climate change scenarios. Environ. Dev. 34, 100488. doi: 10.1016/j.envdev.2019.100488
Hunter, P. R., MacDonald, A. M., and Carter, R. C. (2010). Water supply and health. PLoS Med. 7, e1000361. doi: 10.1371/journal.pmed.1000361
Huss, M., Bookhagen, B., Huggel, C., Jacobsen, D., Bradley, R., Clague, J., et al. (2017). Towards mountains without permanent snow and ice : mountains without permanent snow and ice Earth's Future. Earths Future 5, 418–435. doi: 10.1002/2016EF000514
Iheonu, C., Asongu, S., Emeka, E. T., and Orjiakor, E. (2022). Climate change and agricultural productivity in West Africa. SSRN Electron. J. 1–23. doi: 10.2139/ssrn.4235549
Ilori, O. W., and Ajayi, V. O. (2020). Change detection and trend analysis of future temperature and rainfall over West Africa. Earth Syst. Environ. 4, 493–512. doi: 10.1007/s41748-020-00174-6
Intergovernmental Panel on Climate Change (1996). “Climate Change 1995 - the science of climate change,” in The Second Assessment Report of the IPCC: Contribution of Working Group I, eds J. T. Houghton, L. G. Meira Filho, B. A. Callander, N. Harris, A. Kattenberg, and K. Maskell (Cambridge: Cambridge University Press), 572.
IPCC (2013). “Climate change 2013: the physical science basis,” in Contribution of Working Group I to the Fifth Assessment Report of the Intergovernmental Panel on Climate Change, eds T. F. Stocker, D. Qin, G.-K. Plattner, M. Tignor, S. K. Allen, J. Boschung, et al. (Cambridge: Cambridge University Press), 1535.
IPCC (2014). “Climate change 2014 synthesis report,” in Contribution of Working Groups I, II and III to the Fifth Assessment Report of the Intergovernmental Panel on Climate Change, eds Core Writing Team, R. K. Pachauri, and L. A. Meyer (Geneva: IPCC), 151.
IPCC (2018). “Global Warming of 1.5.°C: an IPCC special report on the impacts of global warming of 1.5°C above pre-industrial levels and related global greenhouse gas emission pathways,” in The Context of Strengthening the Global Response to the Threat of Climate Change, Sustainable Development, and Efforts to Eradicate Poverty. Available online at: https://www.ipcc.ch/site/assets/uploads/sites/2/2019/06/SR15_Full_Report_High_Res.pdf (accessed January 20, 2022).
Joseph, J. E., Akinrotimi, O. O., Rao, K. P., Ramaraj, A. P., Traore, P. S. C., Sujatha, P., et al. (2020). “The usefulness of gridded climate data products in characterizing climate variability and assessing crop production the usefulness of gridded climate data products in characterizing climate variability and assessing crop production,” in CCAFS Working Paper no. 322; Issue November [Wageningen: CGIAR Research Program on Climate Change, Agriculture and Food Security (CCAFS)]. doi: 10.13140/RG.2.2.27548.31367
Kabo-Bah, A. T., Diji, C. J., Nokoe, K., Mulugetta, Y., Obeng-Ofori, D., Akpoti, K., et al. (2016). Multiyear rainfall and temperature trends in the Volta River basin and their potential impact on hydropower generation in Ghana. Climate 4, 1–17. doi: 10.3390/cli4040049
Karam, S., Seidou, O., Nagabhatla, N., Perera, D., and Tshimanga, R. M. (2022). Assessing the impacts of climate change on climatic extremes in the Congo River Basin. Clim. Change 170, 1–24. doi: 10.1007/s10584-022-03326-x
Kasei, R. A. (2009). Modelling Impacts of Climate Change on Water Resources in the Volta Basin, West Africa. [Rheinischen Friedrich-Wilhelms-Universität Bonn]. Available online at: http://hss.ulb.uni-bonn.de/diss_onlineelektronisch~publiziert (accessed May 20, 2022).
Kjellström, E., Bärring, L., Nikulin, G., Nilsson, C., Persson, G., Strandberg, G., et al. (2016). Production and use of regional climate model projections—a Swedish perspective on building climate services. Clim. Serv. 2–3, 15–29. doi: 10.1016/j.cliser.2016.06.004
Klassou, K. S., and Komi, K. (2021). Analysis of extreme rainfall in Oti River Basin (West Africa). J. Water Clim. Change 12, 1997–2009. doi: 10.2166/wcc.2021.154
Komi, K., Neal, J., Trigg, M. A., and Diekkrüger, B. (2017). Modelling of flood hazard extent in data sparse areas: a case study of the Oti River basin, West Africa. J. Hydrol. Reg. Stud. 10, 122–132. doi: 10.1016/j.ejrh.2017.03.001
Kruger, A. C., Rautenbach, H., Mbatha, S., Ngwenya, S., and Makgoale, T. E. (2019). Historical and projected trends in near-surface temperature indices for 22 locations in South Africa. S. Afr. J. Sci. 115, 1–9. doi: 10.17159/sajs.2019/4846
Kundzewicz, Z. W., Mata, L. J., Arnell, N. W., Döll, P., Jimenez, B., Miller, K., et al. (2008). The implications of projected climate change for freshwater resources and their management. Hydrol. Sci. J. 53, 3–10. doi: 10.1623/hysj.53.1.3
Kwawuvi, D., Mama, D., Agodzo, S. K., Hartmann, A., Larbi, I., Bessah, E., et al. (2022a). An investigation into the future changes in rainfall onset, cessation and length of rainy season in the Oti River Basin, West Africa. Model. Earth Syst. Environ. 8, 5077–5095. doi: 10.1007/s40808-022-01410-w
Kwawuvi, D., Mama, D., Agodzo, S. K., Hartmann, A., Larbi, I., Bessah, E., et al. (2022b). Spatiotemporal variability and change in rainfall in the Oti River Basin, West Africa. J. Water Clim. Change 13, 1–19. doi: 10.2166/wcc.2022.368
Lafia N'gobi, G. M., Danani, K., and Soulé, M. (2022). Climate change and biodiversity in West Africa Sahel: a review. Res. Ecol. 4, 30–41. doi: 10.30564/re.v4i3.4930
Lama, J. R., Seas, C. R., León-Barúa, R., Gotuzzo, E., and Sack, R. B. (2004). Environmental temperature, cholera, and acute diarrhoea in adults in Lima, Peru. J. Health Popul. Nutr. 22, 399–403.
Larbi, I., Hountondji, F. C. C., Annor, T., Agyare, W. A., Gathenya, J. M., Amuzu, J., et al. (2018). Spatio-temporal trend analysis of rainfall and temperature extremes in the vea catchment, Ghana. Climate 6, 1–17. doi: 10.3390/cli6040087
Lizumi, T., Okada, M., and Yokozawza, M. (2014). A meteorological forcing data set for global crop modeling: development, evaluation, and intercomparison. J. Geophys. Res. Atmos. 119, 363–384. doi: 10.1002/2013JD020130
Lobell, D. B., Burke, M. B., Tebaldi, C., Mastrandrea, M. D., Falcon, W. P., Naylor, R. L., et al. (2008). Prioritizing climate change adaptation needs for food security in 2030. Science 319, 607–610. doi: 10.1126/science.1152339
Lu, G. Y., and Wong, D. W. (2008). An adaptive inverse-distance weighting spatial interpolation technique. Comput. Geosci. 34, 1044–1055. doi: 10.1016/j.cageo.2007.07.010
Luhunga, P., Botai, J., and Kahimba, F. (2016). Evaluation of the performance of CORDEX regional climate models in simulating present climate conditions of Tanzania. J. South. Hemisphere Earth Syst. Sci. 66, 32–54. doi: 10.1071/ES16005
Maček, U., Bezak, N., and Šraj, M. (2018). Reference evapotranspiration changes in Slovenia, Europe. Argic. For. Meteorol. 260, 183–192. doi: 10.1016/j.agrformet.2018.06.014
Miller, O. L., Putman, A. L., Alder, J., Miller, M., Jones, D. K., Wise, D. R., et al. (2021). Changing climate drives future streamflow declines and challenges in meeting water demand across the southwestern United States. J. Hydrol. X 11, 1–16. doi: 10.1016/j.hydroa.2021.100074
Monerie, P. A., Biasutti, M., and Roucou, P. (2016). On the projected increase of Sahel rainfall during the late rainy season. Int. J. Climatol. 36, 4373–4383. doi: 10.1002/joc.4638
Moriasi, D. N., Arnold, J. G., Van Liew, M. W., Bingner, R. L., Harmel, R. D., and Veith, T. L. (2007). Model evaluation guidelines for systematic quantification of accuracy in watershed simulations. Trans. ASABE 50, 885–900. doi: 10.13031/2013.23153
Ndehedehe, C. E., Awange, J. L., Corner, R. J., Kuhn, M., and Okwuashi, O. (2016). On the potentials of multiple climate variables in assessing the spatio-temporal characteristics of hydrological droughts over the Volta Basin. Sci. Total Environ. 557–558, 819–837. doi: 10.1016/j.scitotenv.2016.03.004
Ofori, S. A., Cobbina, S. J., and Obiri, S. (2021). Climate change, land, water, and food security: perspectives from Sub-Saharan Africa. Front. Sustain. Food Syst. 5, 1–9. doi: 10.3389/fsufs.2021.680924
Okafor, G. C., Larbi, I., Chukwuma, E. C., Nyamekye, C., Limantol, A. M., Dotse, S. Q., et al. (2021). Local climate change signals and changes in climate extremes in a typical Sahel catchment: the case of Dano catchment, Burkina Faso. Environ. Chall. 5, 100285. doi: 10.1016/j.envc.2021.100285
Önöz, B., and Bayazit, M. (2003). The power of statistical tests for trend detection. Turk. J. Eng. Environ. Sci. 27, 247–251. doi: 10.3906/sag-1205-120
Piani, C., Weedon, G. P., Best, M., Gomes, S. M., Viterbo, P., Hagemann, S., et al. (2010). Statistical bias correction of global simulated daily precipitation and temperature for the application of hydrological models. J. Hydrol. 395, 199–215. doi: 10.1016/j.jhydrol.2010.10.024
Pingale, S. M., Khare, D., Jat, M. K., and Adamowski, J. (2016). Trend analysis of climatic variables in an arid and semi-arid region of the Ajmer District, Rajasthan, India. J. Water Land Dev. 28, 3–18. doi: 10.1515/jwld-2016-0001
Raza, A., Razzaq, A., Mehmood, S. S., Zou, X., Zhang, X., Lv, Y., et al. (2019). Impact of climate change on crops adaptation and strategies to tackle its outcome: a review. Plants 8, 1–29. doi: 10.3390/plants8020034
Roudier, P., Sultan, B., Quirion, P., and Berg, A. (2011). The impact of future climate change on West African crop yields: what does the recent literature say? Glob. Environ. Change 21, 1073–1083. doi: 10.1016/j.gloenvcha.2011.04.007
Russo, S., Marchese, A. F., Sillmann, J., and Immé, G. (2016). When will unusual heat waves become normal in a warming Africa? Environ. Res. Lett. 11, 1–10. doi: 10.1088/1748-9326/11/5/054016
Saini, A., and Sahu, N. (2021). Decoding trend of Indian summer monsoon rainfall using multimethod approach. Stoch. Environ. Res. Risk Assess. 35, 2313–2333. doi: 10.1007/s00477-021-02030-z
Samuelsson, P., Jones, C. G., Willén, U., Ullerstig, A., Gollvik, S., Hansson, U., et al. (2011). The Rossby Centre Regional Climate model RCA3: model description and performance. Tellus A: Dyn. Meteorol. Oceanogr. 63, 4–23. doi: 10.1111/j.1600-0870.2010.00478.x
Sen, P. (1968). Estimates of the regression coefficient based on Kendall's tau. J. Am. Stat. Assoc. 63, 1379–1389. doi: 10.1080/01621459.1968.10480934
Shrestha, S., and Roachanakanan, R. (2021). Extreme climate projections under representative concentration pathways in the lower Songkhram River Basin, Thailand. Heliyon 7, 1–14. doi: 10.1016/j.heliyon.2021.e06146
Stackhouse, P. W., Zhang, T., Westberg, D., Barnett, A. J., Bristow, T., Macpherson, B., et al (2018). POWER Release 8.0.1 (with GIS applications) Methodology (Data Parameters, Sources, Validation) Documentation Date. NASA Langley Research Center, 8, 1–99. Available online at: https://power.larc.nasa.gov/docs/methodology/
Stagl, J., Mayr, E., Koch, H., and Hattermann, F. F. (2014). “Effects of climate change on the hydrological cycle in central and Eastern Europe,” in Managing Protected Areas in Central and Eastern Europe Under Climate Change, eds S. Rannow, and M. Neubert (Berlin: Springer), 31–43. doi: 10.1007/978-94-007-7960-0_3
Sultan, B., Roudier, P., Quirion, P., Alhassane, A., Muller, B., Dingkuhn, M., et al. (2013). Assessing climate change impacts on sorghum and millet yields in the Sudanian and Sahelian savannas of West Africa. Environ. Res. Lett. 8, 014040. doi: 10.1088/1748-9326/8/1/014040
Sylla, M. B., Annor, F., Kasei, R., and Mbaye, M. L. (2016). “Chapter 5: Water for food, economic growth and environment,” in Climate Variability and Climate Change over the Volta River Basin, 1st Edn.
The New Humanitarian (2013). Worrying Climate Outlook for West Africa's Volta Basin. Available online at: https://reliefweb.int/report/ghana/worrying-climate-outlook-west-africas-volta-basin (accessed January 12, 2023).
van de Giesen, N., Liebe, J., and Jung, G. (2010). Adapting to climate change in the Volta Basin, West Africa. Curr. Sci. 98, 1033–1037.
Keywords: Oti River Basin, temperature, climate change, RCP4.5 scenario, West Africa, NASA POWER, RCP8.5
Citation: Kwawuvi D, Mama D, Agodzo SK, Bessah E, Yangouliba GI and Aklamati WS (2023) Potential consequences for rising temperature trends in the Oti River Basin, West Africa. Front. Clim. 5:1184050. doi: 10.3389/fclim.2023.1184050
Received: 10 March 2023; Accepted: 20 June 2023;
Published: 14 July 2023.
Edited by:
Swadhin Kumar Behera, Japan Agency for Marine-Earth Science and Technology (JAMSTEC), JapanReviewed by:
Netrananda Sahu, University of Delhi, IndiaCopyright © 2023 Kwawuvi, Mama, Agodzo, Bessah, Yangouliba and Aklamati. This is an open-access article distributed under the terms of the Creative Commons Attribution License (CC BY). The use, distribution or reproduction in other forums is permitted, provided the original author(s) and the copyright owner(s) are credited and that the original publication in this journal is cited, in accordance with accepted academic practice. No use, distribution or reproduction is permitted which does not comply with these terms.
*Correspondence: Daniel Kwawuvi, ZGFuaWVsa3dhd3V2aUBnbWFpbC5jb20=; a3dhd3V2aS5kQGVkdS53YXNjYWwub3Jn
Disclaimer: All claims expressed in this article are solely those of the authors and do not necessarily represent those of their affiliated organizations, or those of the publisher, the editors and the reviewers. Any product that may be evaluated in this article or claim that may be made by its manufacturer is not guaranteed or endorsed by the publisher.
Research integrity at Frontiers
Learn more about the work of our research integrity team to safeguard the quality of each article we publish.