 Jan Knappe
 Manfred van Afferden
 Jan Friesen
- 1Centre for Environmental Biotechnology (UBZ), Helmholtz Centre for Environmental Research – UFZ, Leipzig, Germany
- 2Considerate Group, London, United Kingdom
Urban blue-green infrastructures (BGIs) fulfill a variety of functions that enable cities to cope with climate change and additional urban anthropogenic pressures such as increasing population density, heat island effects, biodiversity loss, and progressive sealing of permeable surfaces. In the urban water cycle, BGIs can play an important role when it comes to both managing and mitigating the direct effects of ever-increasing periods of extended drought as well as the temporary excess of stormwater during and after heavy rainfall events. Although BGIs are multifunctional in principle, the individual infrastructure has to be designed and operated toward achieving a set of specific objectives, e.g., stormwater retention, infiltration, or storage for increased overall water resilience. In this study, we focus on green roofs as a key BGI for water resilient urban spaces. Green roofs have the advantage of unlocking underutilized roof space for urban water management and additional co-functions, avoiding additional urban land use conflicts at ground level. Green roofs are available in a multitude of design types based on the selection of vegetation, the make and thickness of the substrate layer, and the absence or presence of additional retention space. With GR2L, we present a robust dual-layer green roof water balance model that is able to cope with a variety of design aspects and was validated and calibrated using a data set of four green roof types with varying technical specifications and different vegetation cover. We used the calibrated models to assess how different green roof types operate under variable climatic conditions using meteo ensembles that consist of dry and wet years as well as a suite of randomly selected years. Calibration results indicate that a green roof factor (based on the classic crop factor) largely depending on the retention capacity of green roofs, makes the results widely applicable in planning. The results provide information on how green roof designs can be optimized for fulfilling a given set of water balance-driven multifunctionality objectives under varying climatic conditions and enabling an assessment of the performance of existing green roof designs against these conditions.
Graphical Abstract.
Introduction
Urban blue-green infrastructure (BGI) fulfills multiple functions that enable cities to cope with climate change as well as further anthropogenic changes such as increasing urban population and increasing impervious surface areas. In turn, ecosystem services and resources, such as water, become scarce and the pressure on urban infrastructure, such as water networks, increases. Properly planned and managed BGI can (i) provide multiple functions in regard to ecosystem services, and (ii) be used to cope with the limited space available in urban settings. The multifunctionality of BGI often encompasses increased green spaces through which biodiversity, the mitigation of urban heat effects, air quality, as well as quality of life or attractiveness of urban spaces can benefit (Liao et al., 2017; Krauze and Wagner, 2019; O'Donnell et al., 2020). In view of urban water management, BGI can be used to mitigate both droughts and stormwater. In combination with hydrological processes such as evapotranspiration for cooling, water storage and retention for flow control and peak discharge attenuation, infiltration for groundwater recharge and water treatment functions (Voskamp and Van de Ven, 2015). Prominent examples for BGI range from water sensitive parks, gardens, and waterbodies to more technical solutions such as bioswales, green walls, tree swales, and green roofs (Almaaitah et al., 2021).
In particular, green roofs are becoming increasingly common for strengthening the water resilience of urban spaces. Green roofs have the advantage of providing under-utilized roof spaces with additional functions, such as retention of stormwater and water storage. In terms of design, a multitude of green roof types are commercially available. Individual design considerations include the selection of plants, the soil layer—ranging from grow mats to soil substrate—and water storage such as specific retention layers with controlled outlets at specified heights (Pérez and Coma, 2018; Gößner et al., 2021; Wang et al., 2021).
Although—in principle—green roofs are multifunctional, the individual infrastructures have to be designed and operated toward site-specific functions for single buildings as well as at city level. In order to assess the effect of green roofs for stormwater mitigation or drought resilience their hydrological performance needs to be monitored and modeled. Existing studies provide monitoring-based analyses of evapotranspiration and storage capabilities (Gößner et al., 2021; Wang et al., 2021). In addition, models have been developed based on lysimeter data including smoothing approaches that are often required to cope with high-resolution lysimeter data and the associated temperature or wind-induced noise (Schrader et al., 2013). Other studies focused on short-term responses to rainfall events using water balance approaches (Liu et al., 2021) or the HYDRUS model that physically models porous media water fluxes (Wang et al., 2022). As a plethora of green roof types and configurations exist, models are needed that allow predicting the performance of different green roof types under different local weather conditions.
In this study we developed a two-layer water balance model to represent green roofs with and without retention or storage layers using data from an existing monitoring setup. Next to the meteorological conditions during the monitoring periods we also utilized meteo ensembles in order to assess the effects of climatic variability. Meteo ensembles are based on meteorological input data from the German Weather Service (DWD) network and consist of dry and wet years as well as a suite of randomly selected years. By forcing the green roof model with meteo ensembles (i) observed data are used and (ii) different meteorological conditions are simulated. Although this does not include forecasting, the use of meteo ensembles including dry and wet conditions can be used to assess climate change effects.
To highlight the variability within green roofs, four green roof types were modeled that vary in technical setup and vegetation layer. Within this study we provide (i) a robust data preprocessing pipeline of lysimeter data including gap filling (ii) a hydrological model, GR2L, specifically aimed at estimating green roof performance, as well as (iii) analysis of green roof response to climate variability utilizing meteo ensembles based on weather station data. Based on a robust Rolling Forward Forecast (RFF) the model is calibrated via a green roof factor, similar to the often used crop factor, that includes not only vegetation differences but also considers technological green roof parameters and operational settings.
Materials and methods
The GR2L model
Model description
The Green Roof 2 Layer (GR2L) model implements an interactive dual-layer water balance bucket model for green roofs with a substrate layer and an optional retention layer underneath on daily time steps. Key compartments and parameters are depicted in Figure 1. Both layers are hydraulically connected. In practice, this is often achieved by using high capillary distribution fleeces for horizontal water distribution at the base of the substrate layer in combination with glass wool or fabric wicks that penetrate into the retention layer for vertical upward movement of water from the retention layer to the substrate layer. Vertically downward movements of excess water from the substrate layer into the retention layer is achieved through direct seepage. The substrate layer is exposed to environmental conditions and experiences rainfall (water input) and evapotranspiration (water loss). Potential irrigation (water input) during operation can be applied both directly to the substrate layer or indirectly via the retention layer as rainfall.
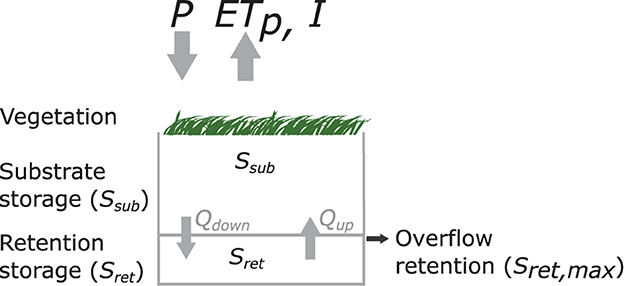
Figure 1. Schematic of dual-layer green roof and GR2L model parameterization overview. P, ETp, and I correspond to precipitation, potential evapotranspiration, and interception.
The substrate layer can exchange water with the top atmospheric boundary and the retention layer beneath. Water exchange between the layers is assumed to be instantaneous in modeling terms, i.e., local equilibria are reached within < 1 day. Thus, given available retention water the substrate is assumed to be at a homogenous water holding capacity that allows the planted vegetation to thrive (see also Gößner et al., 2021).
If the substrate is parameterized sufficiently, e.g., known van Genuchten (1980) parameters, the water storage could also be expressed as soil moisture or volumetric water content. However, due to the relatively coarse and thin substrate layer in green roofs (order of cm to dm, with considerable fractions of gravel), the presence of a shallow water reservoir directly beneath it (retention layer), and a general lack of experimentally-derived soil-moisture release curves for green roof substrates, GR2L does not consider vertical soil moisture gradients in the substrate, but expresses the water content in the substrate layer simply in terms of water head, i.e., water stored, at any given time.
Surplus rainfall or irrigation onto the substrate layer above a maximum water storage capacity will seep into the retention layer while a temporary water deficit in the substrate layer, caused by evapotranspiration will initiate upward movement of water from the retention layer to the substrate layer, if available (Figure 1). Excess water in the retention layer beyond its storage capacity which is usually determined by the position of an outlet or overflow pipe (with or without throttle orifice) is considered as overflow. GR2L does not consider conditions where parts of the water in the system are immobile, e.g., freezing conditions or snow cover.
Model assumptions and parameters
Both the substrate and retention layer have upper and lower boundaries for water storage. In the substrate layer minimum substrate layer storage capacity Ssub; min and maximum substrate layer storage capacity Ssub; max correspond to the substrate's saturated and residual water content, respectively, and are generally estimated experimentally from weighing lysimeter data. In the retention layer, these water storage parameters would be a direct result of the retention space design. In most practical cases, the minimum retention layer storage capacity Sret; min would be zero. When the maximum retention layer storage capacity Sret; max is set to zero, the model acts as a single-layer bucket model, representing a green roof without a retention layer (Equation 1).
Hence, the total water storage Stot in the system is given as the sum of water stored in the substrate layer (Ssub) and water stored in the retention layer (Sret):
with
and
Expressed as a sequential model, storage in the substrate layer on day i depends on the previous day's storage plus incoming water from precipitation P and/or upward pull Qup minus evapotranspiration and/or downward seepage Qdown. Similarly, the retention layer storage on day i depends on the previous day's storage plus downward seepage from the substrate layer minus potential upward transport and/or loss of excess water through the outlet.
Precipitation (i.e., rainfall and/or surface irrigation) and potential evapotranspiration ETp data can be obtained from on-site measurements or publicly available weather time series data for a given location. For this study precipitation and potential evapotranspiration (Penman Monteith, FAO formula) were taken from the German Weather Service (DWD Climate Data Center—CDC, 2019, 2021). The model implements an interception loss term I that reduces the effective precipitation that infiltrates into the substrate layer during each time step. Interception is assumed to remain constant on the scale of one vegetation period, but could be derived from experimental data (if available), e.g., leaf area index (LAI) and a canopy storage function (Liu et al., 2021). The capability of vegetated green roofs to evaporate initial precipitation without transfer into the substrate layer is mainly dependent of vegetation type and overall exposed surface area (Nagase and Dunnett, 2012). A constant value of 1 mm per day was chosen in line with urban roof runoff models (such as Gash et al., 2008). Evapotranspirative loss is either measured directly in lysimeter set-ups or calculated dynamically from ETp data using a moisture extraction function for determining actual evapotranspiration ETa. The moisture extraction function is the ratio of the actual water storage Ssub and the maximum effective water storage Ssub; max in the substrate layer, scaled by a green roof factor kg which is conceptually not dissimilar to a crop factor kc (Allen et al., 1998). Classically, the crop factor is used to convert reference evaporation into actual evapotranspiration for different crop types. By using kg as calibration parameter we do not only consider vegetation type but also aggregate green roof design and operational conditions into kg:
A variety of different moisture extraction function shapes were tested following the parametrizations by Zhao et al. (2013). While the group of non-quadratic functions provided comparable and generally good results, quadratic functions did not perform better in preliminary model evaluations (results not shown). Thus the function of least complexity was chosen (Equation 4). Alternative, step-wise approaches to calculate evapotranspiration on daily time steps can be used, based on available data; similar to Liu et al. (2021) who used a Hargreaves evapotranspiration approach with linear moisture extraction function and a Dalton-type transfer between reservoirs.
The full model parameterization can, hence, be expressed within the two layers as
and
with all parameters as defined above and the respective time step index i or i−1 in the subscript. OUTi is the overflow from the retention layer that occurs when Sret, max (Figure 1; Table 1) is reached. Fluxes such as P, Eta, Etp, Qup, Qdown, I, and OUT are in [mm day−1], the states Ssub, Sret, and Stot are in [mm] and kg is [–].
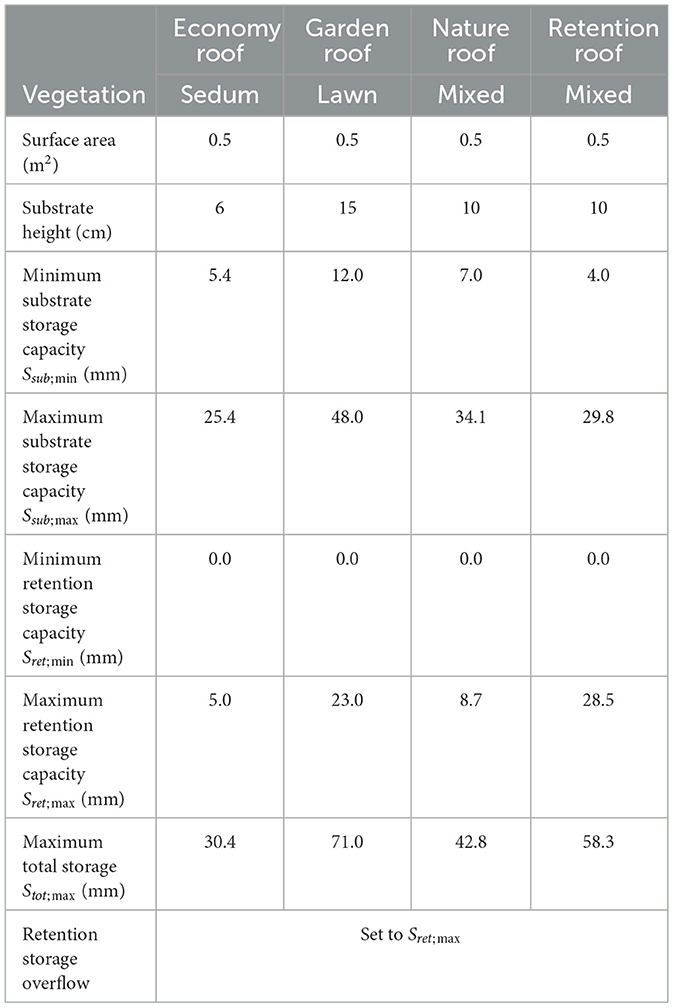
Table 1. Green roof parameters (modified after Gößner et al., 2021).
Model calibration data
Green roof types
Data for calibrating the GR2L model were courteously provided by Optigrün International AG (Krauchenwies-Göggingen, Germany). The dataset consists of time series data spanning 187 days from April 1 to October 4, 2021, gathered from four experimental plots of pilot-scale dual-layer green roof types: an Economy Roof, a Garden Roof, a Nature Roof, and a Retention Roof (Gößner et al., 2021). Each green roof type consists of an upper substrate layer and a lower retention layer separated by a distribution fleece, but differs when it comes to layer thickness, substrate specifications, vegetation, overall water storage capacity, and drainage type. Each roof type was constructed as a weighting-scale lysimeter with additional green roof area surrounding it to limit edge effects. Details about the experimental design including information on location and weather, irrigation schedule, design parameters, sensor specifications, and data acquisition system have previously been presented in Gößner et al. (2021). Key operational and design parameters relevant for this study are summarized in Table 1.
The lysimeters were located at the Optigrün premises in Göggingen (Germany) and instrumented to record weight and outflow at 5-min intervals from April 1 to October 5, 2021. Precipitation and temperature data were collected on site. The exact study set-up, data collection, and a comparative study of evapotranspiration rates are explained in Gößner et al. (2021).
Data pre-processing
The data provided by Optigrün included recorded weight and outflow data on 5-min intervals as well as weather data. The data had to be pre-processed before being suitable for GR2L model calibration. Hereby, we followed four consecutive steps of data pre-processing. First, the raw data (weight, outflow, precipitation) were screened for outliers and physically insensible data. Then, the data were scaled to a common reference area, i.e., 1 m2, and converted into units of water head (mm) to allow for a meaningful analysis of the water balance. Third, missing data (predominantly due to temporary sensor failure) was gap-filled using (i) linear regression for temperature data (0.1% of data); (ii) a bias-corrected replacement from publicly available data for precipitation data (DWD Climate Data Center—CDC, 2021, Station Pfullendorf, ID 3927) (60.1% of data); and (iii) a bias-corrected replacement of lysimeter weight and outflow data across green roof types based on correlation during respective non-zero outflow or non-zero weight change day (7.0% of data). Finally, data were aggregated to daily values, i.e., sums for outflow and precipitation, and differences between midnight observations for lysimeter weight changes.
Parametrization of green roof types
Geometry and time series data provided by Gößner et al. (2021) were used to parametrize four green roof types (Table 1). Water storage capacity in the retention layer is given by green roof design and geometry. While the retention layer minimum water storage capacity for all green roof types is zero, representing an empty retention layer, the retention layer maximum water storage capacity is related to the position of the outlet.
Substrate layer minimum and maximum water storage capacity depend on substrate type and composition, as well as green roof specific parameters such as vegetation type, root depth, and density. These parameters were extracted empirically from the lysimeter and soil moisture time series data. Assuming an empty retention layer, the minimum effective water storage in the substrate layer Ssub; min was approximated by the residual water content θres in the substrate, i.e., at the time of minimum recorded soil moisture. The minimum effective substrate water storage capacity can, then, be derived by scaling θres with the substrate layer thickness dsub. Assuming a filled retention layer, the maximum effective water storage in the substrate layer Ssub; max was approximated by using the median lysimeter weight at times of soil moisture near (i.e., >95% percentile) an apparent saturated water content θsat and subtracting the weight of a filled retention layer. Cleaned and gap-filled substrate water content time series data with derived, corresponding minimum and maximum water storage capacities for all four roof types are shown in Supplementary Figure S1.
Initial substrate and retention layer storage must be supplied to the model as initial conditions. An allocation of available water in the system at t = 0 between substrate and retention layer storage was done based on lysimeter weight and the conception that water accumulates in the substrate layer first, before seeping into the retention layer.
Model parameter optimization
Model parameters are initially optimized using an iterative Rolling Forward Forecast (RFF) approach on the observed data as a time series cross validation method (Korstanje, 2021). Compared to traditional bootstrapping methods, cross validation approaches preserve sequential time series data, and RFF offers a dynamic parameter estimation as it progresses through the available data set, capturing short-term (e.g., rainfall, weather) and long-term (e.g., ground cover changes, vegetation growth and succession, substrate compaction) changes in the green roof system. During the RFF, the data are split into adjacent, moving training and test data set windows of constant size, resulting in balanced folds for error estimation across the entire model parametrization process. Each RFF iteration window are split into an initial n days of training data and a subsequent set of m<n subsequent days of test data for model validation. The Kling-Gupta efficiency (KGE) (Gupta et al., 2009) is used as a general measure for model performance. A KGE > 1–√2 = −0.41 usually indicates that the model predictions perform better than using the mean of observations; a KGE = 1 implies perfect agreement (Knoben et al., 2019).
In each RFF training step, n consecutive time series steps are selected and a series of GR2L models is run using a discrete distribution of physically sensible kg values (i.e., kg ∈[0.0, 3.0]) and starting conditions extracted from the first time series period. The initial kg range was chosen based on kc ranges, from 0.3 to 1.2 (Allen et al., 1998, Chapter 6). We extended the range to 3 as kg is related to but not equal to kc, including technical green roof specifications that are being calibrated into this factor. Then, all models are evaluated against the next m values of observed data using the KGE criterion and the best-fit parameter set is selected. The resulting kg value is, then, used in the RFF test step to predict the subsequent m time series periods which are, in turn, evaluated against the observed test set data, resulting in a iteration specific KGE value for the optimized kg model parameter.
After an optimized kg value with corresponding KGE criterion is derived, both the training set and the test set windows are advanced by m time steps and the process is repeated, thus resulting in a final set of
values of kg, with k being the total number of available time points. The resulting set of j values for kg is, then, used to derive the weighted mean optimized kg value and corresponding 95% confidence intervals (CIs) across the entire observed time series.
Model implementation and statistical analysis
Data analysis was performed using R, version 4.2.1 (R Core Team, 2022). Statistical significance of groupwise time series data comparisons was determined using Wilcoxon signed-rank tests (Rey and Neuhäuser, 2011) and is reported using adjusted padj values with Bonferroni correction (Haynes, 2013). Significance level α = 0.05 was used for all hypothesis testing. Bias-corrected and accelerated bootstrap 95% confidence intervals were computed around the estimates using 5,000 resampling draws (Carpenter and Bithell, 2000; Banjanovic and Osborne, 2016). Confidence intervals are reported in brackets next to the point estimate.
Results and discussion
Model calibration and validation
The GR2L model was calibrated using lysimeter-derived time series data on daily intervals from four green roof types (Economy Roof, Garden Roof, Nature Roof, Retention Roof) spanning k = 187 days from April 1st to October 4th, 2021. An RFF time series cross validation approach was employed using a time span of n = 28 and m = 7 days for the rolling training and testing window, respectively, over a total of 22 iterations. The resulting set of 22 green roof factors kg was evaluated for consistency and quality over time (Figure 2). While for the first 14 iteration, the green roof factors remained fairly constant for all green roof types, the influence of a heavy rainfall event in July and concurrent increased water availability led the model to respond with increased predicted evapotranspiration, thus higher temporary green roof factors for iterations 15–21 (Figure 2A). The available observatory data, unfortunately, only covers one summer period, thus leading to limited insights on green roof behavior during colder winter months at this stage. Corresponding prediction KGE criteria for the test data window remained consistently above −0.41, except for the Garden Roof and Retention Roof, where the KGE fell below the mean-forecast threshold twice and once, respectively, during considerable dry conditions (Figure 2B; Supplementary Figure S1).
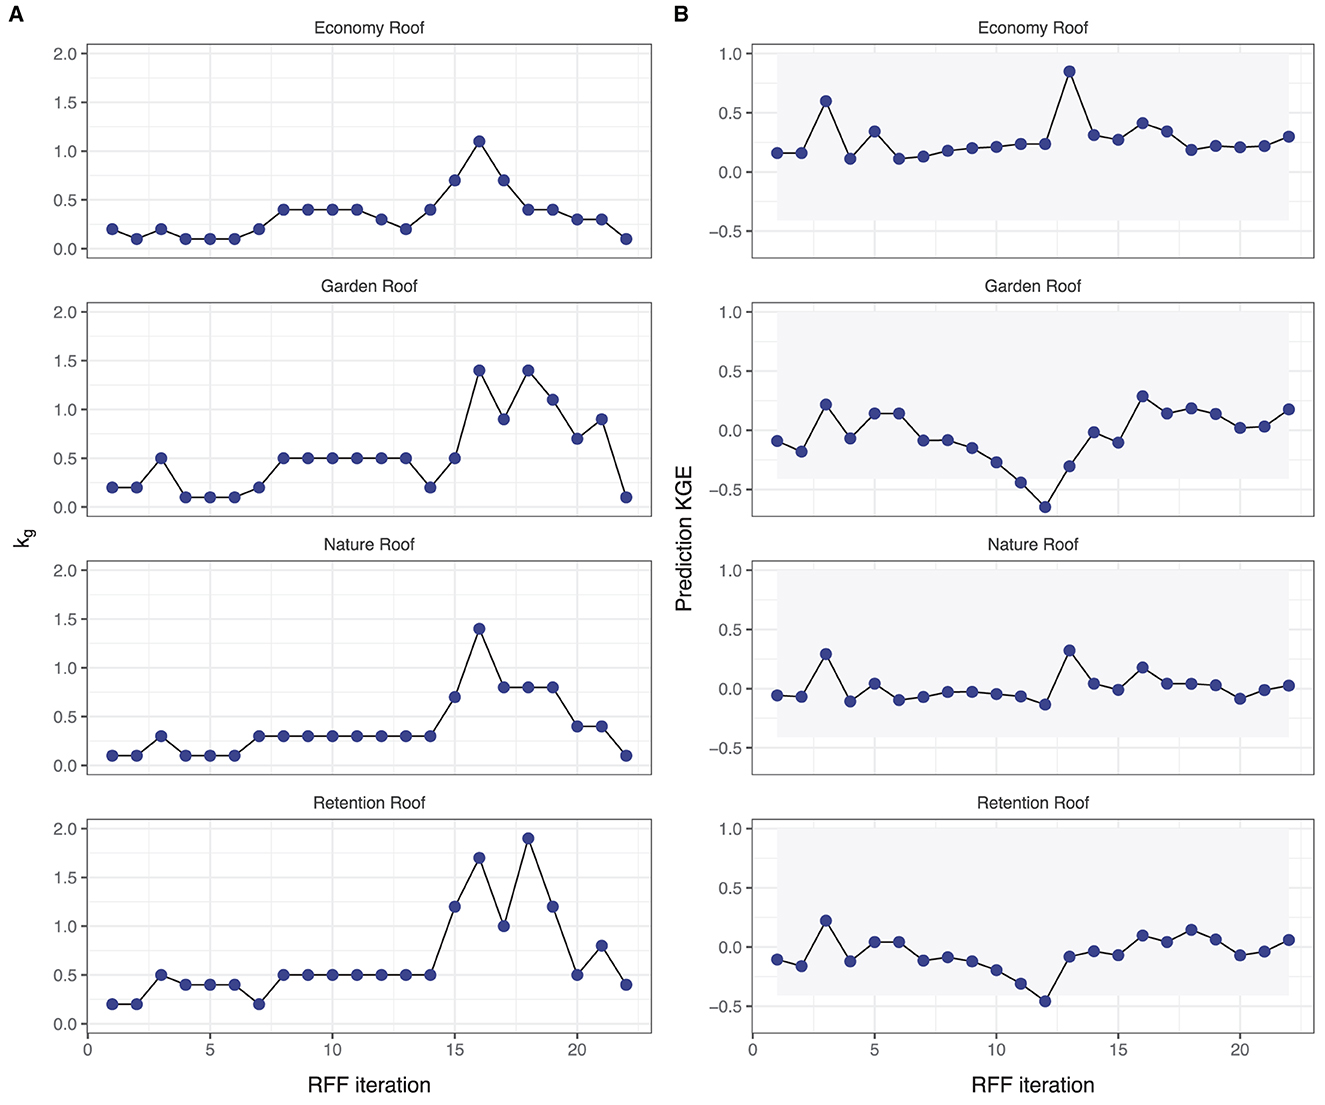
Figure 2. Development of (A) optimized green roof factors kg and (B) corresponding Kling-Gupta Efficiency (KGE) criteria for each iteration of the Rolling Forward Forecast (RFF) for the four green roof types using experimental input data. Gray shaded areas represent KGE values >-0.41, i.e., where the GR2L predicted values on the test data set perform better than a mean-value forecast.
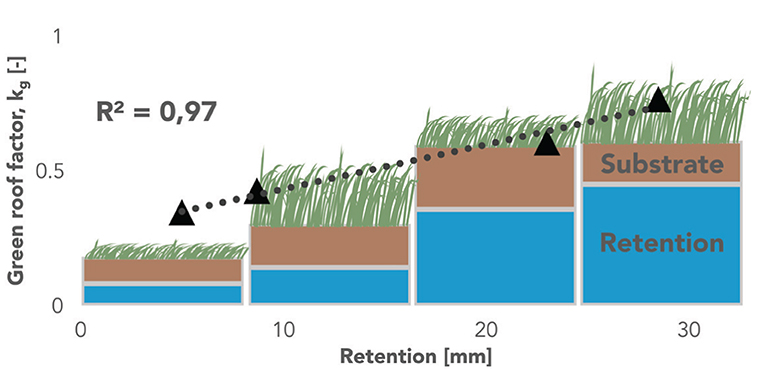
The resulting green roof factors from GR2L calibrated on experimental data during summer months are 0.35 [0.24; 0.46], 0.61 [0.41; 0.81], 0.43 [0.29; 0.57], and 0.77 [0.56; 0.98] for the Economy Roof, Garden Roof, Nature Roof, and Retention Roof, respectively (Table 2). While the factor for the Retention Roof is the only one that is significantly different from others (namely the Economy Roof and Nature Roof), all other pairwise green roof type comparisons have overlapping 95% confidence intervals (Supplementary Table S1). It becomes clear, though, that the two green roof types with minimal retention storage capacity (Economy Roof and Nature Roof) have considerably lower green roof factors as compared to the green roof types with improved retention capacity. As the green roof factor is conceptually similar to crop factors in actual evapotranspiration calculations, this division is comprehensible, owing to the fact that improved water availability in the substrate layer as a direct result of increased water storage capacity in the subjacent retention layer, allows for prolonged and increased evapotranspiration through the planted vegetation. In this case, we observed a mean 2.2-fold increase in evapotranspirative potential when comparing the green roof types with the lowest (Economy Roof) to the green roof type with the highest (Retention Roof) green roof factor, leading to considerable improvements when it comes to operational multifunctionality, i.e., expected improved water- (retention capacity) and climate-resilient (cooling effects) design.
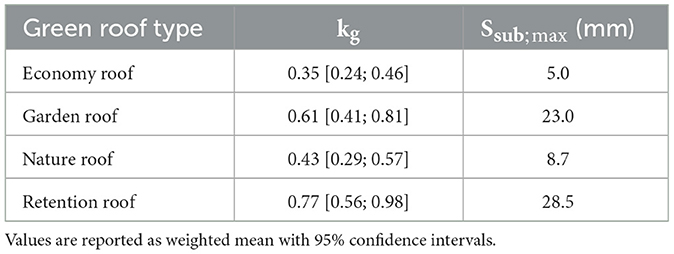
Table 2. Summary statistics of optimized green roof factors kg across all Rolling Forward Forecast (RFF) iterations for the four green roof types.
The calibrated kg values correspond very well (R2: 0.97, padj = 0.013) to the retention storage capacity Sret; max, whereas no obvious relationship to substrate storage capacity (R2: 0.08, padj = 0.70) or vegetation type could be identified.
Simulating observed green roof data
To validate overall model performance, the calibrated GR2L model was initially run for all four green roof types using publicly available weather data (DWD Climate Data Center—CDC, 2019, 2021, Station Pfullendorf, ID 3927) as input over the exact same time period where experimental observations for green roof performance were available. The model results were, then, assessed against experimental observations derived from the lysimeter data using the KGE criterion. Figure 3 shows the results for all four green roof types, including predicted storage and outflow. Overall KGE results of prediction against observed values ranged between 0.61 and 0.78, i.e., show generally good agreement. Observed values fall within 78, 74, 72, and 71% of the predicted model confidence intervals for the Economy Roof, Garden Roof, Nature Roof, and Retention Roof, respectively. The model is robust against changing conditions in the long-term, i.e., over periods of weeks to months, however, tends to capture periods of (relatively constant) maximum storage more accurately than periods of rapidly changing water storage conditions which occur on an order of days (e.g., in April or August 2021), both for rapid drying and wetting events. This could indicate that some model assumptions do not represent the exact physical or time-variable conditions within the substrate layer encountered in the experimental plots.
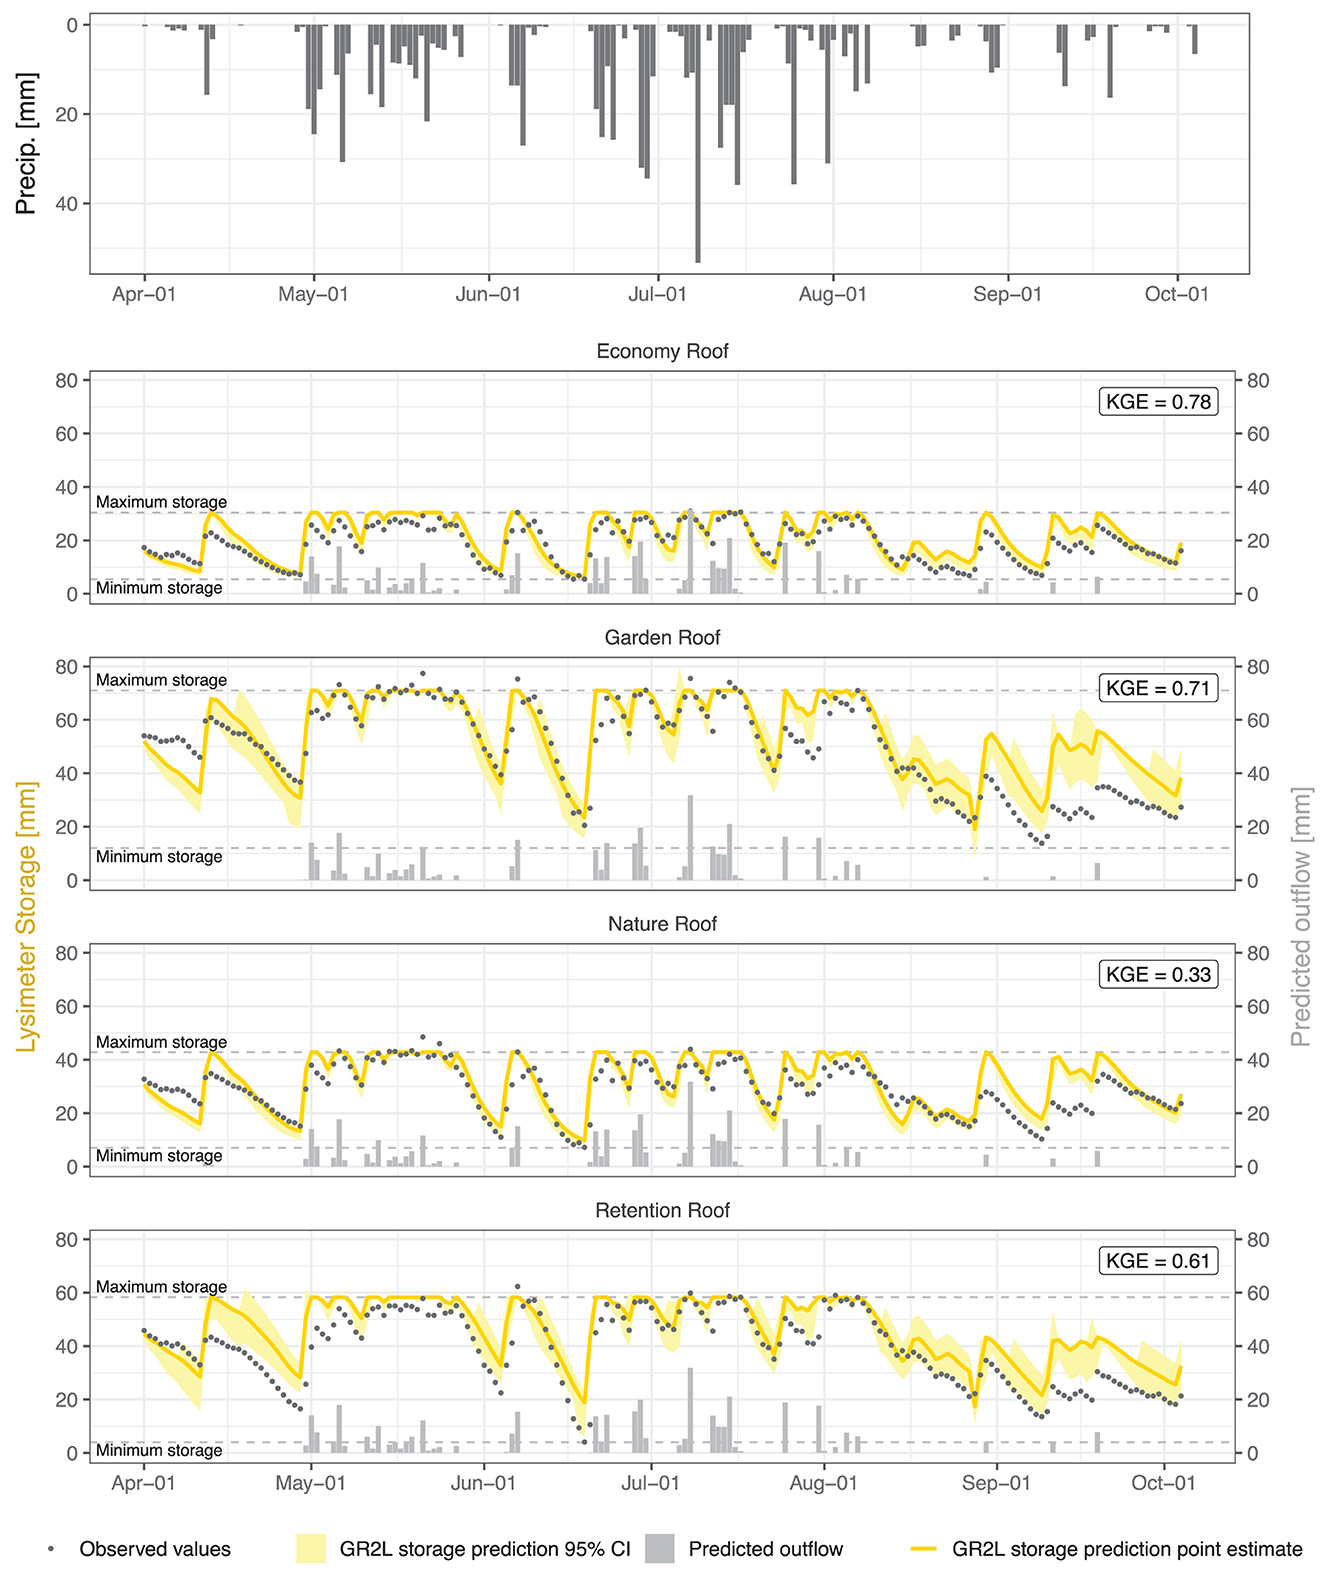
Figure 3. Results of the GR2L simulation using optimized parameters. GR2L results are presented as point estimates with 95% confidence interval (yellow lines with shaded area) for the total storage time series and point estimates (gray columns) for predicted outflow from the four green roof types, respectively. Observed storage over time as derived from lysimeter data is indicated as black points. Dashed lines represent the model limits for minimum and maximum total storage within each green roof type. Corresponding simulation Kling-Gupta efficiency (KGE) values are given in the boxes in the upper right corner of each plot.
Green roof performance under climate variability
Water balance prediction
A key indicator of the progressing climate crisis is the higher frequency and intensity of precipitation extremes (wet and dry periods) globally (Thackeray et al., 2022). Using the calibrated models for each green roof type, we tested their respective performance on historical meteo ensembles. Publicly available rainfall and ETp data from 1991 to 2021 for the weather station located closest to the experimental plot (DWD station 3927 in Pfullendorf) (DWD Climate Data Center—CDC, 2019, 2021) were used to assess the influence of green roof design on overall water balance for three reference years: a dry extreme, a wet extreme, and an average year. The year 2018 was selected as the extreme dry reference year based on having the lowest overall total recorded precipitation (603 mm). 2001 was selected as the extreme wet reference year based on having the highest overall total recorded precipitation (1,041 mm). In addition, an ensemble of 10 randomly selected years within the period 1991 to 2021 was selected to represent climate variability; these were 1993, 1998, 2000, 2005, 2006, 2007, 2009, 2012, 2013, and 2017.
The model water balance prediction for all four green roof types over the course of an entire calendar year is shown for both the extreme dry and extreme wet reference year in Figure 4. All green roof types express similar patterns when it comes to predicted storage and outflow over time, albeit with varying degrees of severity when it comes to gradual filling and emptying. In the extreme dry reference year, the Retention Roof was predicted to have run dry (i.e., reached < 10% of storage capacity) on 76 days throughout the year, despite having the overall largest retention layer capacity. Increased evapotranspirative loss during periods of extended drought through the relatively thinner substrate layer, led to sharper decreases in overall storage as compared to the Garden Roof, which was predicted to risk running dry on 29 days throughout the year. Conversely, the green roofs were predicted to be filled > 90% of their storage capacity on 204, 190, 201, and 140 days for the Economy Roof, Garden Roof, Nature Roof, and Retention Roof, respectively. The Retention Roof, thus, makes most effective use of its retention storage and provides the overall largest scope for evaporative cooling and for retaining heavy rainfall events without outflow in summer months. Both the Garden Roof and Retention Roof provided no considerable outflow between March and November. During the extreme wet year, the Retention Roof again proves to be the roof design that provides the largest scope for additional temporary water retention, because of its relatively high evapotranspirative water loss as the green roofs were predicted to be filled >90% of their storage capacity on 307, 310, 314, and 285 days for the Economy Roof, Garden Roof, Nature Roof, and Retention Roof, respectively. Both the Garden Roof and Retention Roof provided considerable retention of two heavy summer rainfall events in July and August as compared to the Economy Roof and Nature Roof.
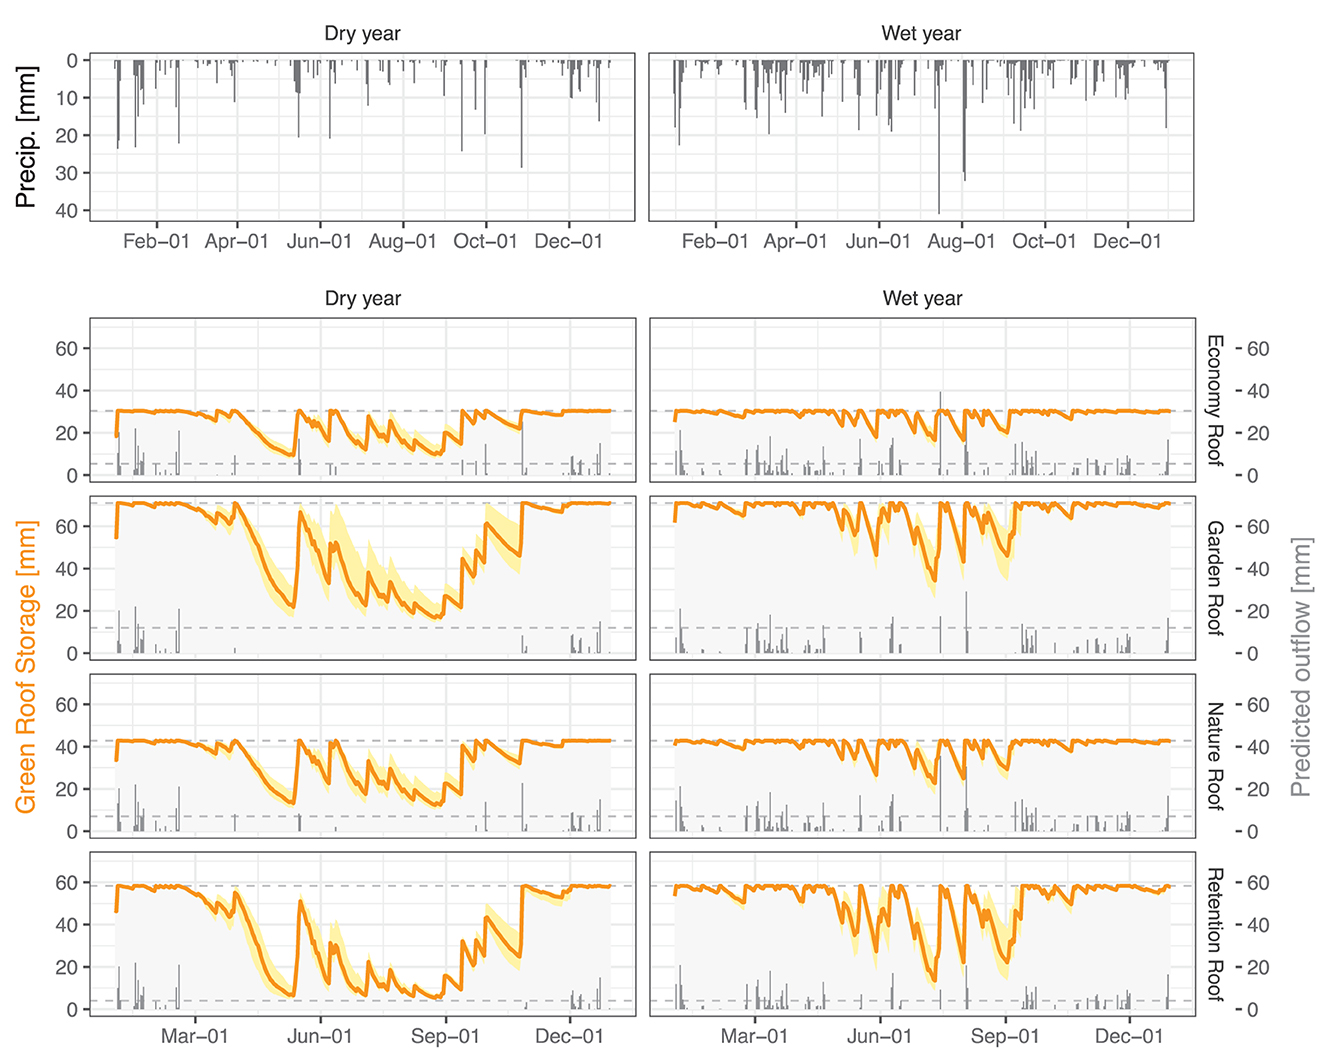
Figure 4. Time series of GR2L water balance predictions for the extreme wet (2001) and extreme dry (2018) reference year. The upper set of panels depicts recorded precipitation from DWD station Pfullendorf. GR2L was run with calibrated parameters for each green roof type. The lower set of panels shows the model prediction over the entire year with predicted storage (yellow line with 95% confidence interval shading) and predicted outflow as gray columns.
When examining the overall water balance over the course of the extreme dry, average, and extreme wet reference years, the Retention Roof and Garden Roof tend to lose the majority of their incoming water through evapotranspiration, while the Economy Roof and Nature Roof lose the majority of their incoming water through direct outflow (Figure 5). While in average years, evapotranspiration losses account for 27, 43, 33, and 46% of the total water balance for the Economy Roof, Garden Roof, Nature Roof, and Retention Roof, respectively, the losses to outflow make up 54, 36, 47, and 34%, respectively. The remainder is attributed to the interception term, which is assumed constant across all green roof types due to lack of reliable experimental data. Thus, the Garden Roof and Retention Roof types tend to have the ability to be more favorable design options when evaporative cooling is preferred over the potential for water reuse through irrigation or groundwater recharge through targeted infiltration.
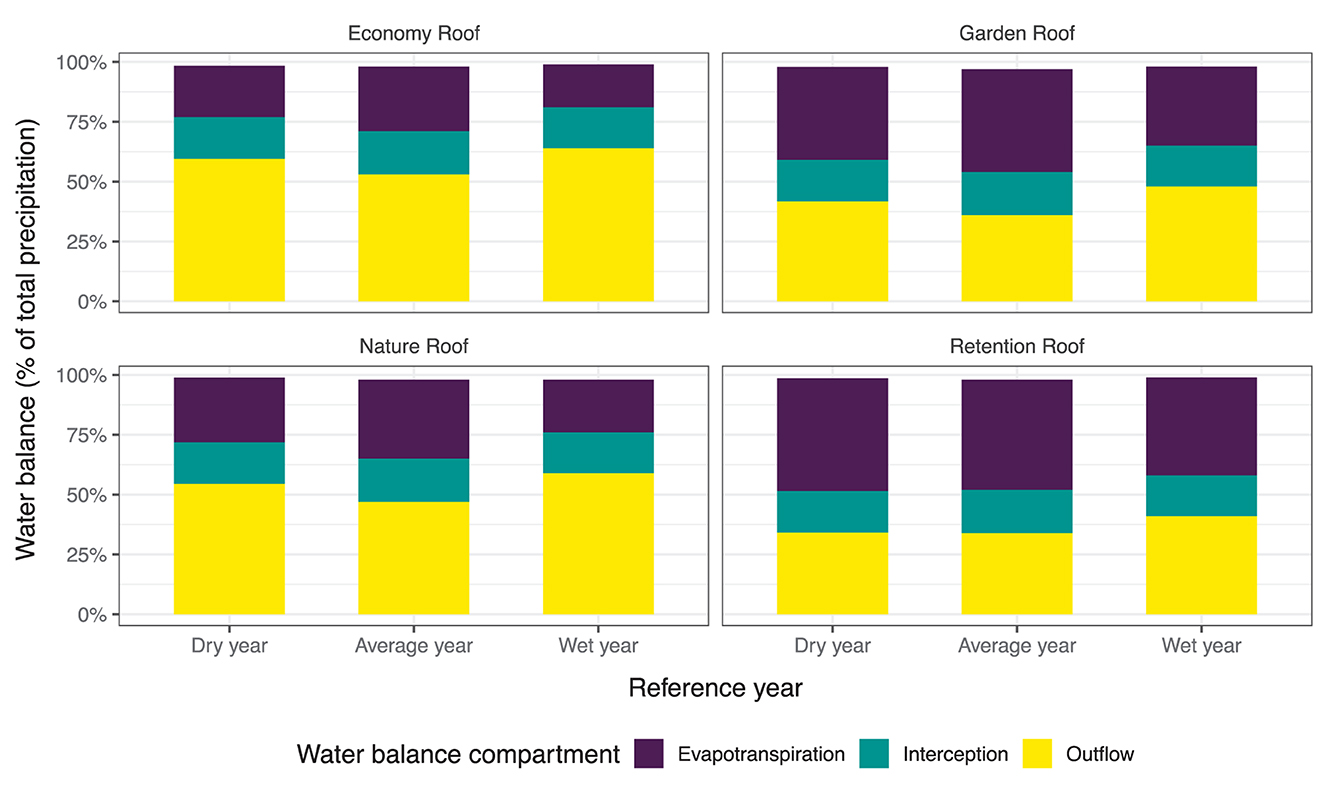
Figure 5. Overall water balance for predicted extreme dry, extreme wet, and average (ensemble) reference years based on 31 years of precipitation and reference evapotranspiration data for DWD station Pfullendorf (1991–2021). GR2L was run with calibrated parameters for each green roof type. Actual evapotranspiration, interception, and outflow are expressed as a fraction of total annual precipitation (input).
Comparison of retention and substrate layer
The distribution of the overall predicted relative storage capacity for each of the two green roof layers—i.e., the available water stored in the retention and substrate layer normalized to the respective layer's total water storage capacity, respectively—for all four green roof types across the reference dry, average, and wet years is shown in Figure 6. All four roof types express similar patterns regarding storage behavior between the three reference years, with dry years having the highest spread and lowest overall median relative storage, average years having the smallest spread and wet years having the highest overall relative storage and similar spread to wet years over the year.
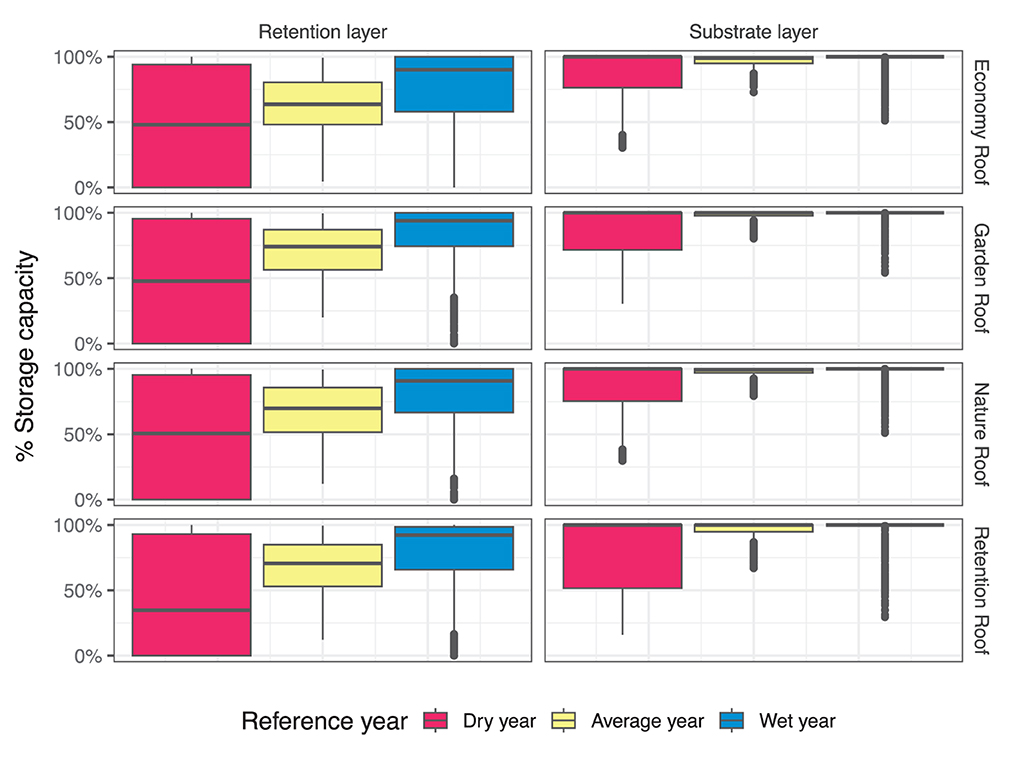
Figure 6. Boxplots of distribution of predicted relative storage capacity for all four green roof types for the extreme dry, average, and extreme wet reference years for the retention and substrate layer, respectively. GR2L was run with calibrated parameters for each green roof type.
For the retention layer, the median water storage over the course of the reference dry, average, and wet year was 48, 64, and 90% for the Economy Roof, 48, 74, and 94% for the Garden Roof, 51, 70, and 91% for the Nature Roof, and 35, 71, and 92% for the Retention Roof, respectively. Retention layers are used to temporally retain stormwater or to irrigate the vegetation and buffer dry periods. It is thus expected that the water level inside the retention layer fluctuates considerably during the course of a year. In dry years, the retention layer of all four roof types runs empty at least once (Figure 6), resulting in a total of 173, 181, 166, and 181 days where the retention layer may run empty in the Economy Roof, Garden Roof, Nature Roof, and Retention Roof, respectively, thus not being able to perform the desired function of providing water during extended dry conditions to the substrate layer. These periods fall predominantly into the summer months of June, July, and August for all four roof types. During these periods, however, the retention layer has its largest capacity to store excess rainfall, such as from localized heavy summer rain events.
Even during the reference wet year, the retention layer falls dry for all green roof types at least once, albeit with two distinct patterns emerging; while the green roof types with considerable retention capacity only show extremely short periods of zero-water storage in the retention layer (5 and 7 days in July for the Garden Roof and the Retention Roof, respectively), the green roof types with lower retention storage capacity dry out more frequently and over longer periods of time (41 and 73 days predominantly in May and July for the Nature Roof and Economy Roof, respectively). During the reference wet year, two major rainfall events in August and September, accounting for a combined approximate 12% of annual rainfall, replenished the retention layer completely after several weeks of extended dry conditions (Figure 4). This is in contrast to the reference average year, where the retention layer never completely emptied in any of the four green roof types. This is a function of both more regular rainfall patterns and lower evapotranspirative pull from the superjacent substrate layer. The Nature Roof and Economy Roof, however, occasionally fell to < 25% storage capacity in the retention layer during average years, thus emphasizing their limited capacity to serve as multifunctional BGI within a larger BGI cascade.
Most pairwise comparisons of the predicted retention layer relative storage capacity time series during the reference years showed no statistically significant differences (Supplementary Table S2). Exceptions are the comparisons between (i) Retention Roof and Economy Roof, and (ii) Garden Roof and Nature Roof during average years which again exemplifies the influence of the presence/absence of a meaningful retention layer across the tested roof types on green roof performance.
The substrate layer in the current model parameterization tries to remain at full water storage capacity. This is clearly reflected in Figure 6, where the median relative water storage for all four green roof types and all three reference years reaches 100%, indicating that the substrate layer is sufficiently served with water throughput a majority of days during the year. Similar to the patterns observed in the retention layer, the Retention Roof made best use of the full range of water storage available throughout the reference dry year and falling only occasionally to relative storage capacities of < 50% following the relatively high evapotranspirative upward water movement in summer months. The Nature Roof and Economy Roof, on the other hand, tend to have the lowest overall median relative storage capacities, which is especially pronounced in the dry year, thus indicating that these green roof types are more susceptible to changing climatic patterns and do not provide sufficient buffering capacity for even their low-transpiration sedum vegetation and mixed vegetation during extended extreme dry conditions. It has to be noted that none of the roofs, however, experienced severe water stress for the substrate layer vegetation over prolonged periods of time (as all tested green roof types have at least some type of retention layer). Due to their generally high relative elevation, wind and solar exposure, and thin and coarse substrate layer, green roofs are extreme environments when compared to natural ecosystems. Adding even small water retention capacity to green roofs appears to reduce water stress considerably.
Unlike the retention layer data, most pairwise comparisons of the predicted substrate layer relative storage capacity time series during the dry, average, and wet reference years showed statistically significant differences (Supplementary Table S2). This is likely to be a result of the fact that the substrate used in the experimental plots was of similar composition across all roof types (lawn substrate for the Garden Roof and extensive multi-layer substrate for all other roof types), resulting in similar total water retention capacities and behavior in their experimental design. Improved parameterization and extended test data time series might improve substrate layer processes modeling, however.
Conclusions
Blue-green infrastructures such as green roofs receive increasing interest as technologies for climate change mitigation in urban settings. We have provided a conceptual water balance model (GR2L) as well as a data preprocessing workflow specifically for green roofs where for example complex soil processes are not necessary. To calibrate the models, we utilized green roof lysimeter data by optimizing the kg value. The kg value is in principle the classic crop factor (kc) but by using only this factor for calibration both vegetation differences and technological green roof settings influence the optimal kg value. First results of the four green roof types indicate that kg is mostly dependent on the retention storage capacity. Further studies should, however, be applied to confirm this for different vegetation types and substrate heights including often applied grow mats with substrate heights even below 1 cm. Although plant type does not seem to play a major role, further investigation into phenological periods for different growth stages should be conducted in the future. At the same time, the strong dependance on retention storage capacity makes it possible to use GR2L to adapt green roofs toward specific functionalities (stormwater, local infiltration, etc.) and local climates.
There is no doubt that GR2L as a robust, simplified model is based on highly idealized systems. As a result, a multitude of processes occurring in real systems, such as water transport in granular media, hysteresis, and changes in hydraulic properties and vegetation cover over time are neglected. Thus, GR2L serves as a benchmark to examine the possibilities and limits of parameter identification under optimal conditions, while still providing insight into green roof design considerations for increasing climate variability. The limitations inherent in estimating key model parameters can be exacerbated in real systems by considering neglected biophysical and operational processes, at the expense of increased model complexity.
Following the assessment of four different green roof types we also assessed climate change effects for the green roofs by analyzing historical meteo ensembles including dry, wet, and random years. The Garden Roof and Retention Roof types tend to have the ability to be more favorable design options when evaporative cooling is preferred. Green roofs (Economy and Nature) with smaller retention offer the potential for water reuse through irrigation or groundwater recharge through targeted infiltration.
Following calibration, GR2L is only forced with rainfall and reference ET data making it widely applicable, i.e., as an integration into BGI cascades at block and city level. In addition, in view of BGI multifunctionality, GR2L can provide water use estimates for different management options—such as for weather forecast coupling. The model as well as the results of our study can be used to select optimal green roof types and designs for different climates and different use cases. This potentially enables green roof functions to be predictively integrated into BGI-level sensor and control systems, an essential precondition to design and scale adaptable nature-based solutions (NBS) (Gómez Martín et al., 2021; Mondejar et al., 2021). Climate scenario modeling approaches including temporal projections are crucial to understand the challenges and limitations of NBS in the context of environmental change (Gómez Martín et al., 2021).
Data availability statement
Publicly available datasets were analyzed in this study and are available from the original sources (referenced in the text). Original green roof lysimeter were and can be requested from the authors of Gößner et al. (2021).
Author contributions
JK and JF conceptualized and validated the model, wrote, and reviewed the manuscript. JK implemented the computer code and supporting algorithms. JF and MA secured the funding. MA reviewed and commented on the manuscript. All authors contributed to the article and approved the submitted version.
Funding
JK and MA were supported under grant 033W110A-K Leipziger BlauGrün – Blue-green district development in Leipzig as part of the funding initiative Resource-efficient urban districts (RES:Z) by the German Federal Ministry of Education and Research (BMBF). JF was supported by the MULTISOURCE and WATERUN projects, which have received funding from the European Union's Horizon 2020 Program under grant agreements 101003527 and 101060922, respectively.
Acknowledgments
The authors would like to thank Dominik Gößner and Milena Mohri of Optigrün International AG for providing the experimental data set for model validation and providing contextual information around the original experimental design.
Conflict of interest
The authors declare that the research was conducted in the absence of any commercial or financial relationships that could be construed as a potential conflict of interest.
Publisher's note
All claims expressed in this article are solely those of the authors and do not necessarily represent those of their affiliated organizations, or those of the publisher, the editors and the reviewers. Any product that may be evaluated in this article, or claim that may be made by its manufacturer, is not guaranteed or endorsed by the publisher.
Supplementary material
The Supplementary Material for this article can be found online at: https://www.frontiersin.org/articles/10.3389/fclim.2023.1115595/full#supplementary-material
References
Allen, R. G., Pereira, L. S., Raes, D., and Smith, M. (1998). Crop Evapotranspiration —Guidelines for Computing Crop Water Requirements. FAO Irrigation and Drainage Paper 56. Rome: Food and Agriculture Organization.
Almaaitah, T., Appleby, M., Rosenblat, H., Drake, J., and Joksimovic, D. (2021). The potential of Blue-Green infrastructure as a climate change adaptation strategy: a systematic literature review. Blue Green Systems 3, 223–248. doi: 10.2166/bgs.2021.016
Banjanovic, E. S., and Osborne, J. W. (2016). Confidence intervals for effect sizes: applying bootstrap resampling. Pract. Assess. Res. Eval. 21, 5. doi: 10.7275/dz3r-8n08
Carpenter, J., and Bithell, J. (2000). Bootstrap confidence intervals: when, which, what? A practical guide for medical statisticians. Stat. Med. 19, 1141–1164. doi: 10.1002/(SICI)1097-0258(20000515)19:9<1141::AID-SIM479>3.0.CO;2-F
DWD Climate Data Center—CDC (2019). Calculated Daily Values for Different Characteristic Elements of Soil and Crops. Version v19.3. Available online at: https://opendata.dwd.de/climate_environment/CDC/derived_germany/soil/daily/ (accessed November 15, 2022).
DWD Climate Data Center—CDC (2021). Historical Daily Station Observations (Temperature, Pressure, Precipitation, Sunshine Duration, etc.) for Germany. Version v21.3. Available online at: https://opendata.dwd.de/climate_environment/CDC/observations_germany/climate/daily/kl/ (accessed November 15, 2022).
Gash, J. H. C., Rosier, P. T. W., and Ragab, R. (2008). A note on estimating urban roof runoff with a forest evaporation model. Hydrol. Processes 22, 1230–1233. doi: 10.1002/hyp.6683
Gómez Martín, E., Máñez Costa, M., Egerer, S., and Schneider, U. A. (2021). Assessing the long-term effectiveness of Nature-Based Solutions under different climate change scenarios. Sci. Total Environ. 794, 148515. doi: 10.1016/j.scitotenv.2021.148515
Gößner, D., Mohri, M., and Krespach, J. J. (2021). Evapotranspiration measurements and assessment of driving factors: a comparison of different green roof systems during summer in Germany. Land 10, 1334. doi: 10.3390/land10121334
Gupta, H. V., Kling, H., Yilmaz, K. K., and Martinez, G. F. (2009). Decomposition of the mean squared error and NSE performance criteria: implications for improving hydrological modelling. J. Hydrol. 377, 80–91. doi: 10.1016/j.jhydrol.2009.08.003
Haynes, W. (2013). “Bonferroni correction,” in Encyclopedia of Systems Biology, eds W. Dubitzky, O. Wolkenhauer, K. H. Cho, H. Yokota (New York, NY: Springer).
Knoben, W. J. M., Freer, J. E., and Woods, R. A. (2019). Technical note: inherent benchmark or not? Comparing Nash–Sutcliffe and Kling–Gupta efficiency scores. Hydrol. Earth Syst. Sci. 23, 4323–4331. doi: 10.5194/hess-23-4323-2019
Korstanje, J. (2021). “Model evaluation for forecasting,” in Advanced Forecasting with Python (Berkeley, CA: Apress).
Krauze, K., and Wagner, I. (2019). From classical water-ecosystem theories to nature-based solutions – contextualizing nature-based solutions for sustainable city. Sci. Total Environ. 655, 697–706. doi: 10.1016/j.scitotenv.2018.11.187
Liao, K.-H., Deng, S., and Tan, P. Y. (2017). “Blue-green infrastructure: new frontier for sustainable urban stormwater management,” in Greening Cities. Advances in 21st Century Human Settlements, eds P. Tan and C. Jim (Singapore: Springer).
Liu, W., Engel, B. A., and Feng, Q. (2021). Modelling the hydrological responses of green roofs under different substrate designs and rainfall characteristics using a simple water balance model. J. Hydrol. 602, 126786. doi: 10.1016/j.jhydrol.2021.126786
Mondejar, M. E., Avtar, R., Diaz, H. L. B., Dubey, R. K., Esteban, J., Gómez-Morales, A., et al. (2021). Digitalization to achieve sustainable development goals: steps towards a Smart Green Planet. Sci. Total Environ. 794, 148539. doi: 10.1016/j.scitotenv.2021.148539
Nagase, A., and Dunnett, N. (2012). Amount of water runoff from different vegetation types on extensive green roofs: effects of plant species, diversity and plant structure. Landscape Urban Plan. 104, 356–363. doi: 10.1016/j.landurbplan.2011.11.001
O'Donnell, E., Thorne, C., Ahilan, S., Arthur, S., Birkinshaw, S., Butler, D., et al. (2020). The blue-green path to urban flood resilience. Blue Green Syst. 2, 28–45. doi: 10.2166/bgs.2019.199
Pérez, G., and Coma, J. (2018). “Chapter 2.3—green roofs classifications, plant species, substrates,” in Nature Based Strategies for Urban and Building Sustainability, eds G. Pérez and K. Perini (Oxford: Butterworth-Heinemann), 65–74.
R Core Team (2022). R: A Language and Environment for Statistical Computing. Vienna: R Foundation for Statistical Computing. Available online at: https://www.R-project.org/ (accessed November 15, 2022).
Rey, D., and Neuhäuser, M. (2011). “Wilcoxon-signed-rank test,” in International Encyclopedia of Statistical Science, eds M. Lovric (Berlin, Heidelberg: Springer).
Schrader, F., Durner, W., Fank, J., Gebler, S., Pütz, T., Hannes, M., et al. (2013). Estimating precipitation and actual evapotranspiration from precision lysimeter measurements. Proc. Environ. Sci. 19, 543–552. doi: 10.1016/j.proenv.2013.06.061
Thackeray, C. W., Hall, A., Norris, J., and Chen, D. (2022). Constraining the increased frequency of global precipitation extremes under warming. Nat. Clim. Change 12, 441–448. doi: 10.1038/s41558-022-01329-1
van Genuchten, M. T. (1980). A closed-form equation for predicting the hydraulic conductivity of unsaturated soils. Soil Sci. Soc. Am. J. 44, 892–898. doi: 10.2136/sssaj1980.03615995004400050002x
Voskamp, I. M., and Van de Ven, F. H. M. (2015). Planning support system for climate adaptation: composing effective sets of blue-green measures to reduce urban vulnerability to extreme weather events. Build. Environ. 83, 159–167. doi: 10.1016/j.buildenv.2014.07.018
Wang, J., Garg, A., Huang, S., Mei, G., Liu, J., Zhang, K., et al. (2021). The rainwater retention mechanisms in extensive green roofs with ten different structural configurations. Water Sci. Technol. 84, 1839. doi: 10.2166/wst.2021.413
Wang, J., Garg, A., Liu, N., Chen, D., and Mei, G. (2022). Experimental and numerical investigation on hydrological characteristics of extensive green roofs under the influence of rainstorms. Environ. Sci. Pollut. Res. 29, 53121–53136. doi: 10.1007/s11356-022-19609-w
Keywords: blue-green infrastructure (BGI), green roof, water balance, climate variability, urban
Citation: Knappe J, van Afferden M and Friesen J (2023) GR2L: A robust dual-layer green roof water balance model to assess multifunctionality aspects under climate variability. Front. Clim. 5:1115595. doi: 10.3389/fclim.2023.1115595
Received: 04 December 2022; Accepted: 20 February 2023;
Published: 16 March 2023.
Edited by:
Laurence Gill, Trinity College Dublin, IrelandReviewed by:
Junsong Wang, South China University of Technology, ChinaRobert V. Rohli, Louisiana State University, United States
Copyright © 2023 Knappe, van Afferden and Friesen. This is an open-access article distributed under the terms of the Creative Commons Attribution License (CC BY). The use, distribution or reproduction in other forums is permitted, provided the original author(s) and the copyright owner(s) are credited and that the original publication in this journal is cited, in accordance with accepted academic practice. No use, distribution or reproduction is permitted which does not comply with these terms.
*Correspondence: Jan Friesen, amFuLmZyaWVzZW5AdWZ6LmRl
†These authors have contributed equally to this work