 Kyotaek Hwang1,2
 Shirley A. Papuga
- 1Department of Environmental Science and Geology, Wayne State University, Detroit, MI, United States
- 2Institute of Arctic and Alpine Research, University of Colorado Boulder, Boulder, CO, United States
- 3Department of Hydrology and Atmospheric Sciences, University of Arizona, Tucson, AZ, United States
Cities such as Detroit, MI in the post-industrial Rust Belt region of the United States, have been experiencing a decline in both population and economy since the 1970's. These “shrinking cities” are characterized by aging infrastructure and increasing vacant areas, potentially resulting in more green space. While in growing cities research has demonstrated an “urban heat island” effect resulting from increased temperatures with increased urbanization, little is known about how this may be different if a city shrinks due to urban decline. We hypothesize that the changes associated with shrinking cities will have a measurable impact on their local climatology that is different than in areas experiencing increased urbanization. Here we present our analysis of historical temperature and precipitation records (1900–2020) from weather stations positioned in multiple shrinking cities from within the Rust Belt region of the United States and in growing cities within and outside of this region. Our results suggest that while temperatures are increasing overall, these increases are lower in shrinking cities than those cities that are continuing to experience urban growth. Our analysis also suggests there are differences in precipitation trends between shrinking and growing cities. We also highlight recent climate data in Detroit, MI in the context of these longer-term changes in climatology to support urban planning and management decisions that may influence or be influenced by these trends.
1. Introduction
Changes on the land surface are increasingly recognized as important yet poorly quantified components of global climate change. Human activity has been a major contributor to these land surface changes. The interplay between the land surface and the atmosphere is a key indicator for assessing human impact on the environment (Ward et al., 2013). In urban areas, the modification of the land surface by human actions, e.g., through the construction of buildings, addition of impervious surfaces and changes in vegetation, is especially evident and has been shown to impact climatology from local to regional scales (Best, 2005; Collier, 2006; Grimmond, 2010; Ward et al., 2013; Yang et al., 2016).
The global population has more than tripled since 1950—from 2.5 to 7.7 billion. From a land use and land cover change perspective, this rapid population growth is important because it supports a resultant shift to an urbanization: in 1950, a third of the world's population lived in urban areas; by 2000 this grew to nearly 50% and is expected to continue to rise (Collier, 2006; Bherwani et al., 2020; Jandaghian and Berardi, 2020). Now home to more than half of the global population, urban areas carry the exceptional burden of showcasing the powerful synergies between climate and human activity (Steffen et al., 2018; Hu and Li, 2020). Significant changes in local and regional climate are a consequence of major modifications of surface energy, water and carbon budgets associated with urbanization (Yang et al., 2015, 2016). Still despite their growing spatial extent, their impact on the land surface and its ecohydrological processes, and their strong feedback with the atmosphere, urban areas remain one of the most relatively understudied land cover types (Collins et al., 2000; Pickett et al., 2001; Oleson et al., 2008; Zhang et al., 2012).
Perhaps one of the most studied phenomena associated with urbanization has been the urban heat island (UHI) in which the surface temperatures within urban areas tend to be higher than in the areas that surround it (Oke, 1973; Zhou et al., 2004; Zhao et al., 2014; Manoli et al., 2019). Still, the causes of the UHI remain difficult to identify and isolate (Manoli et al., 2019). However, it is generally attributed to a reduction in evaporative cooling with other factors including a heat release associated with human activity (Akbari et al., 2001) and an increased storage of energy associated with a reduction in albedo (Taha, 1997; Sailor and Lu, 2004; Collier, 2006; Zhao et al., 2014).
While urbanization has received the majority of attention in global change research, urban shrinkage is emerging as a new challenge (Haase, 2013; Herrmann et al., 2016) with the potential to have important consequences for water, energy, and carbon cycling moving forward. Urban shrinkage is the phenomenon of substantial and long-term declines in population and economic activity that hundreds of cities have been experiencing worldwide (Beauregard, 2009; Haase, 2013; Herrmann et al., 2016)—about one in six globally (Blanco et al., 2009). In the United States (US), large and medium-sized cities that were vibrant industrial centers in the twentieth century, such as Youngstown, Ohio, Buffalo, New York, and Detroit, Michigan, continue to experience population decline (Beauregard, 2009; Herrmann et al., 2016). However, the “shrinking city” phenomenon is not confined to the US—many European and Asian cities have also been impacted (Beauregard, 2009; Haase et al., 2014).
Urban shrinkage has had major impacts on land use and land cover—leaving behind a landscape peppered with vacant lots and brownfields, the extent of which can be quite substantial (Schilling and Logan, 2008; Haase et al., 2014; Kim, 2016). Due to their abundant areal extent and the pressure on cities to recover from this blight, these mostly abandoned and derelict areas are actively being reimagined with potential to contribute to the collective urban “green space” and the services it provides (Haase et al., 2014; Kim, 2016; Meerow and Newell, 2017). Particularly relevant is that greening a city's vacant lots has been shown to be a cost-effective strategy for supplying much needed public services related to climate such as stormwater management, carbon sequestration and storage, and UHI mitigation (Mitchell et al., 2008; McPhearson et al., 2013; Kim, 2016; Kelleher et al., 2020).
Given the emphasis on increasing the green space and its functioning, the influence of shrinking cities in land surface—atmosphere interactions may be different from for cities that are expanding due to urbanization. In particular, we hypothesize that while both shrinking and growing cities are likely to exhibit an increase in temperature over time, the temperature increase in shrinking cities will be smaller relative to growing cities as their populations begin to decline. We attribute this to the additional green space leading to more evaporative cooling and the reduction in number of people using energy. We also hypothesize that both shrinking and growing cities will exhibit an increase in precipitation over time, but that the increase in precipitation in shrinking cities be smaller relative to growing cities as their populations begin to decline. We attribute this to a decrease in industry and a consequent decrease in particulate matter (Burian and Shepherd, 2005).
2. Materials and methods
2.1. Study sites
Our sites are located within the Rust Belt region of the northeastern United States that has been experiencing industrial decline since the 1950–1960's (Figure 1) and generally experiences long warm summer days and long cold winter nights. This enables the comparison of multiple shrinking cities within a similar climatic region. For this research study, we define a shrinking city as a city that has experienced a net negative population change since 1960 and a growing city as a city that has experienced a net positive population change since 1960. The shrinking cities we use in this study include Buffalo, New York, Chicago, Illinois, Cleveland, Ohio, Detroit, Michigan, and Milwaukee, Wisconsin (Table 1). We contrast these shrinking cities with Toronto, Ontario, Canada, a growing city (Figure 1).

Figure 1. Geographic locations of the shrinking cities (open circles) and the growing (open diamond) city within the Rust Belt region, including their long-term population trends. Land cover maps were acquired from the Multi-Resolution Land Characteristics (MRLC) National Land Cover Database (NLCD) 2019 (https://www.mrlc.gov/) for the United States and the Canada Center for Remote Sensing (CCRS) 2015 Land Cover of Canada (https://open.canada.ca/).

Table 1. Geographic and demographic descriptions of the study sites.
2.2. Data collection
Data for all shrinking cities were retrieved using the NOAA Online Weather Data (NOWData) tool (https://www.weather.gov/wrh/Climate?wfo=bou/). For each city, monthly summaries of average maximum and minimum temperatures and total precipitation were collected for a 120-year period, from January 1900 through December 2019. Toronto was not available through NOWData. Instead, data were retrieved through the National Centers for Environmental Information (NCEI; https://www.ncei.noaa.gov/), a subset of NOWData. Maximum and minimum temperature as well as total precipitation were collected for every day between January 1900 and December 2019 from three locations, Agincourt (January 1st, 1900 to May 31st, 1959), Richmond Hill (June 1st, 1959 to December 31st, 2006), and North York (January 1st, 2007 to December 31st 2019).
Population for the US cities was collected using the decennial census between 1900 and 2020 (https://www.census.gov/). Population for Toronto was accessed through Statistics Canada (https://www.statcan.gc.ca/en/start).
2.3. Data analysis
To calculate mean temperature for each month in shrinking cities, we averaged the minimum and maximum temperatures for each city within that month. We calculated yearly average by averaging all of these months within the year. The dataset average is the average of the yearly averages between 1900 and 1999. To calculate the difference from average for each year, we subtracted yearly averages by the dataset average. We processed precipitation in a similar way except the data were summed rather than averaged. All data processing was conducted in MATLAB® using a custom-made script. To put these data in the context of individual years, we show these data alongside data from 2019, a year with a statistically similar temperature and precipitation to the 20-year average (2000–2019) from the non-parametric Wilcoxon ranksum test.
In order to better visualize monthly climate trends of the selected cities, we generated colorwheels of monthly mean temperature and precipitation. We grouped monthly means with decadal means and then compared these with the monthly means between 1900 and 1999.
For this research study, we define seasons as follows: Winter (December, January, and February); Spring (March, April, and May); Summer (June, July, August); Fall (September, October, and November).
Population for each city was calculated by subtracting the census data for the decade by the previous decade and dividing by the previous decade to find the percentage change for each city per decade.
3. Results
3.1. Recent Detroit climate trends
3.1.1. Temperature
Temperature trends in Detroit follow what is typical in the region, experiencing its lowest temperatures in Winter with a steady increase in Spring, reaching a peak in mid-Summer before decreasing again in the Fall (Figure 2). Compared to the previous 20-year mean maximum temperature, monthly maximum temperature in Detroit was cooler in both Winter (−0.4–5.6°C) and Spring (6.1–20.3°C) and warmer in both Summer (25.3–30.4°C) and Fall (5.8–25.0°C) within the standard deviation (SD) range (1.1–3.1°C; Figure 2A). The monthly maximum temperature in 2019 has a slightly larger range (−0.4–30.4°C) than the previous 20-year mean maximum temperature (0.2–28.9°C). Differences from the 20-year means ranged from −3.8 to 2.8°C throughout the year, with the biggest differences occurring in November (−3.8°C) and December (2.8°C).
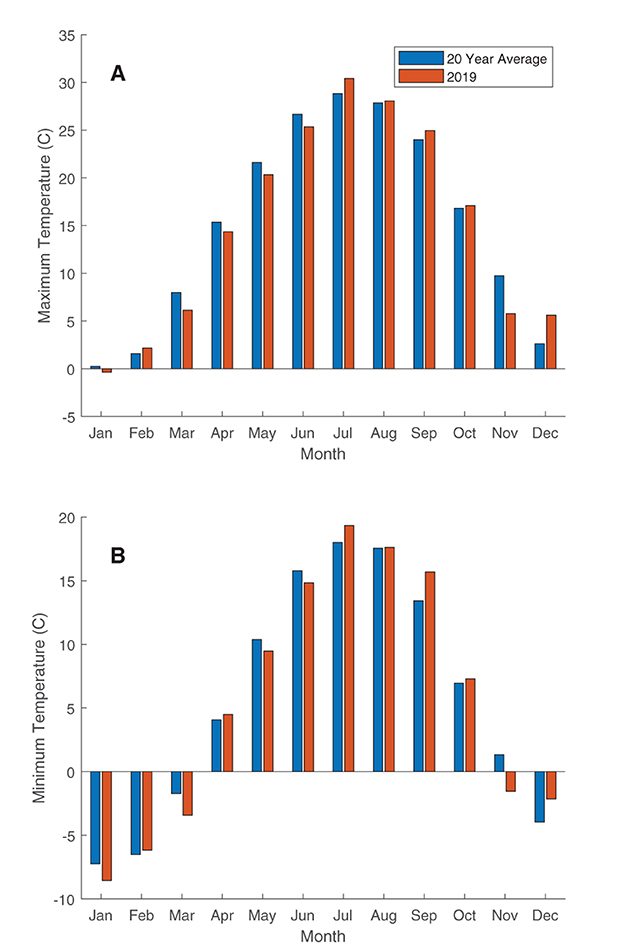
Figure 2. Comparison of the monthly (A) maximum and (B) minimum temperatures in 2019 (red bars) to the 20-year (2000–2019) mean (blue bars) for Detroit.
Similar to the maximum temperature, monthly minimum temperature in Detroit in 2019 was cooler in both Winter (−8.6-−2.1°C) and Spring (−3.4–9.5°C) and warmer in both Summer (14.8–19.3°C) and Fall (−1.6–15.7°C) than the previous 20-year mean minimum temperature within the SD range (1.0–3.1°C) (Figure 2B). The monthly minimum temperature in 2019 also has a slightly larger range (−8.6–19.3°C) than the previous 20-year mean maximum temperature (−7.3–18.1°C). Differences from the 20-year means ranged from −2.7 to 2.2°C throughout the year, with the biggest differences occurring in November (−2.7°C) and September (2.2°C).
3.1.2. Precipitation
Precipitation trends in Detroit follow what is typical in the region, with slightly more precipitation in Spring and Summer (20-year mean ± SD = 504 ± 96 mm; 2019 = 522 mm) than Winter and Fall (20-year = 393 ± 89 mm; 2019 = 404 mm; Figure 3). Detroit's 20-year mean monthly precipitation ranged between a low of 52 mm (January) and a high of 104 mm (May) with SD ranging 20–54 mm. In 2019, monthly precipitation ranged between 42 mm (November) and 148 mm (April). Annual precipitation (926 mm) was slightly higher than the previous 20-year mean annual precipitation (897 ± 133 mm) in part due to unusually high precipitation in April (148 mm) and October (112 mm; Figure 3).
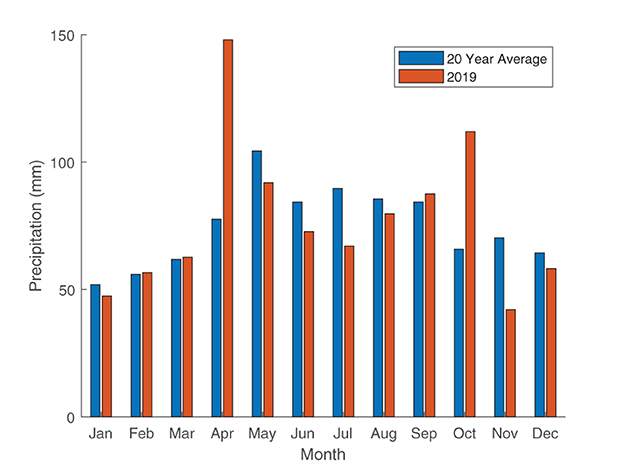
Figure 3. Comparison of the monthly precipitation in 2019 (red bars) with the 2000–2019 mean (blue bars) for Detroit.
The average 20-year cumulative precipitation (897 ± 37 mm) suggests that precipitation in 2019 (926 mm) was near-average compared to the other years, but slightly drier than average early in the year and slightly wetter than average later in the year (Figure 4). Specifically, cumulative precipitation in 2019 was less than most years and slightly below the 20-year mean until April when it was near-average then and slightly greater than the 20-year mean after a period of high precipitation in late April and early May (4/25–5/3; Figure 4). Of the 20 years, total annual precipitation in 2019 ranked seventh.
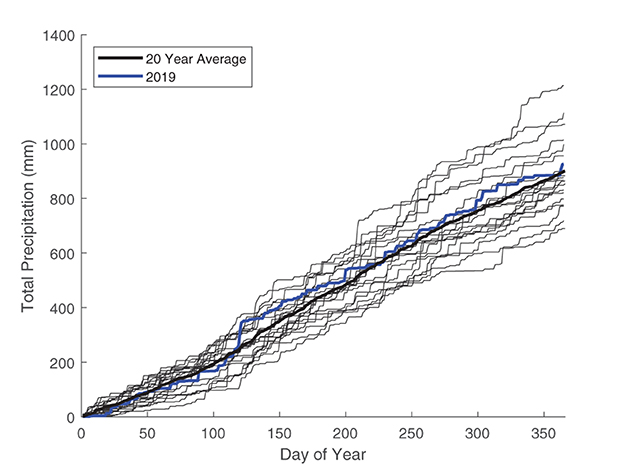
Figure 4. Cumulative precipitation for the 20-year period (2000–2019; black lines) with the 2019 precipitation (thick blue line) for Detroit. The 20-year mean is presented with a thick black line.
3.2. Monthly climate trends in shrinking and growing cities
3.2.1. Temperature
For the last 120 years (1900–2019), monthly mean temperature has gradually increased by decade in three representative shrinking cities (Buffalo, Chicago, and Detroit) and one representative growing city (Toronto) from the Rust Belt region (Figure 5). These cities experienced significant temperature increases from the first half (growing population from all cities; 1900–1959) to the second half (diverging population change; 1960–2019) of the study period from the Wilcoxon ranksum test (p-value < 0.001 from all cities). The cities exhibit similar decadal trends until the 1970's, at which point they begin to deviate from each other. Starting in 1990, warming of all four of these cities is accelerated for all months, with Toronto experiencing a relatively more dramatic warming. Warm and cool months vary by decade. For example, in the 1990's, February and December were relatively warm and September and October were relatively cool. By contrast, in the 2000's, April was relatively warm and July and October were relatively cool. In the 2010's, May and December were relatively warm and November was relatively cool.
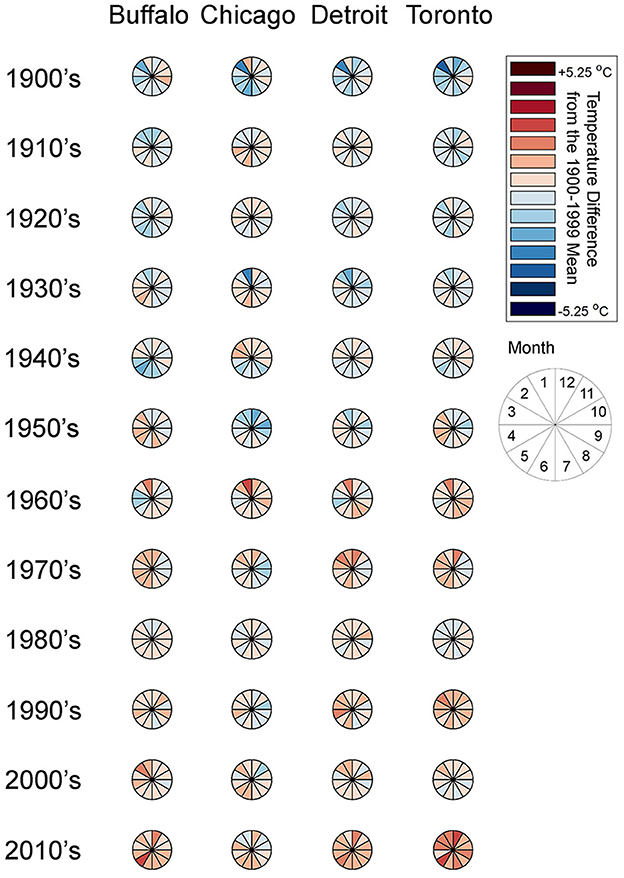
Figure 5. Colorwheels of the 10-year mean monthly temperature difference from the 120-year (1900–2019) mean for Buffalo, Chicago, Detroit, and Toronto.
For the last two decades of the study period, the three shrinking cities exhibited an increase in monthly temperature (−3.9–23.0°C) from the 120-year mean (−4.4–22.3°C) in most months. The monthly temperature increases ranged from 0.5 to 1.1°C. The highest temperature increases were observed in April (1.1°C), May (1.1°C), September (1.1°C), and December (1.1°C). The number of freezing days, i.e., daily temperature below 0°C, decreased from 81.7 days in the last 120 years to 74.5 days in the last 20 years. The frost-free period also extended from day of year (DOY) 89 to 319 (230 days) to DOY 85 to 324 (239 days). Accordingly, the number of growing days for corn, i.e., daily temperature above 0°C, increased from 181 to 189 days.
For the last two decades of the study period, the growing city of Toronto exhibited an increase in monthly temperature (−5.2–21.9°C) from the 1900–1999 mean (−6.5–20.8°C) in all months. The monthly temperature increases ranged from 0.9 to 1.8°C. Unlike the shrinking cities, the highest temperature increases were observed in Winter and early Spring: February (1.8°C), December (1.8°C), and March (1.6°C). These increases were also notably higher than for the shrinking cities. The number of freezing days decreased from 98.4 days in the last 120 years to 85.6 days in the last 20 years. The frost-free period also extended from DOY 97 to 311 (215 days) to DOY 92 to 321 (228 days). Accordingly, the number of growing days for corn, i.e., daily temperature above 0°C, increased from 158 to 171 days.
For the last two decades of the study period, the growing city of Toronto was comparatively hotter than the three shrinking cities in most months (p-value < 0.001). Mean monthly temperature in 1900–1999 was 1.5–2.9°C lower in Toronto (−6.5–20.8°C) than the mean of the shrinking cities (−5.2–21.9°C). In the last 20 years (2000–2019) of the 120-year period, however, mean monthly temperature in Toronto increased by 0.9–1.8°C, which was higher than the mean increase from the shrinking cities (0.5–1.1°C). This pattern is more distinct in the 2010's (by 0.0–1.4°C) than the 2000's (by −0.2–0.8°C; Figure 5).
3.2.2. Precipitation
Overall, the three shrinking cities (Buffalo, Chicago, and Detroit) and one growing city (Toronto) all experienced increases in precipitation for most months (Figure 6). These cities exhibit significant precipitation increases from the first half (1900–1959) to the second half (1960–2019) of the study period from the Wilcoxon ranksum test (p-value < 0.001 from all cities). Monthly precipitation data highlight that the 1900 to 1930's were exceptionally dry (annual total temperature ranging 681–852 mm) and that the 1980–2010's were exceptionally wet (873–1,037 mm). Wet and dry months were not consistent across decades nor across cities.
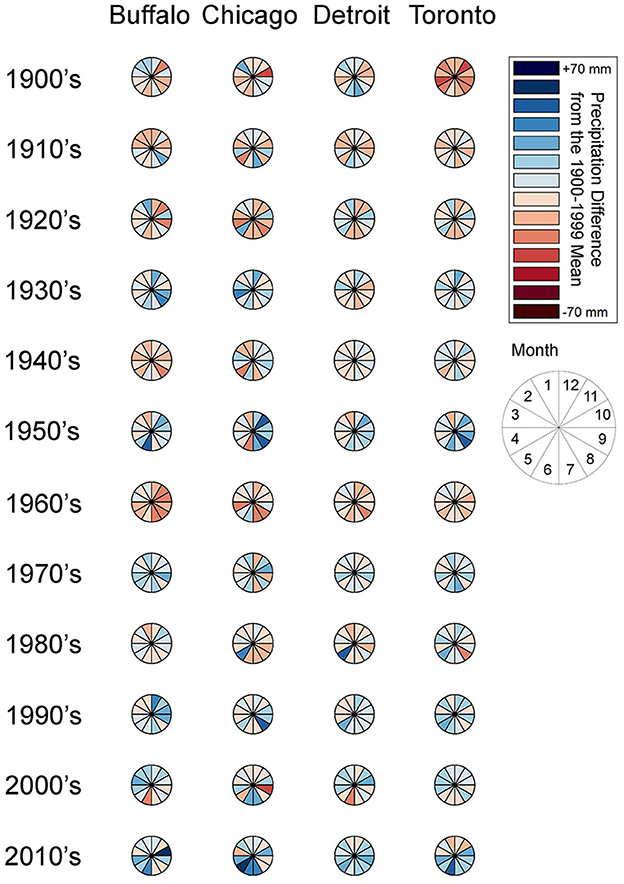
Figure 6. Colorwheels of the 10-year mean monthly precipitation from the 120-year (1900–2019) mean for Buffalo, Chicago, Detroit, and Toronto.
Despite fluctuation over decades, annual precipitation in the three shrinking cities increased in average from 851 mm over the last 120 years to 981 mm over the last 20 years. Monthly precipitation differences range 0–26 mm. The greatest increases and the least increases were observed from late spring and early summer, and late winter and early spring, respectively (Figure 6). Specifically, over the last 20 years (2000–2019) shrinking cities exhibited the largest increase in precipitation from the 120-year means in May (26 mm) and October (24 mm).
Increase in annual precipitation in the growing city of Toronto from over the last 120 years (806 ± 161 mm) to the last 20 years (896 ± 127 mm) is slightly lower than the shrinking cities (120-year mean: 779–939 mm, last 20-year mean: 897–1,045 mm). Monthly precipitation differences ranged from −9 to 33 mm. In the last 20 years, an increase in monthly precipitation is observed for all months except for in January and March. The largest increase was observed in Spring and early Summer, with June yielding the highest increase (28 mm greater than the 120-year mean of 70 mm; Figure 6).
We did not observe any major difference between growing and shrinking cities in terms of precipitation. Mean annual total precipitation in the last 120 years was 62 mm lower in the growing city of Toronto (789 mm) than the mean of the three shrinking cities (851 mm; p-value < 0.001). In last 20 years, mean annual total precipitation in Toronto increased by 107 mm, which is less than the shrinking cities (130 mm).
3.3. Long-term trends in shrinking and growing cities
3.3.1. Temperature
Long-term records of annual mean temperature highlighted progressive warming in the regional cities (Figure 7). The annual temperature trend can generally be characterized as relatively cool in 1900–1920's, relatively warm in 1930–1950's, relatively cool in 1960–1980's, and relatively warm in 1990–2010's. This decadal oscillation was overlaid on an increasing linear trend for both shrinking (slope = 0.009°C yr−1, r2 = 0.12) and growing (slope = 0.013°C yr−1, r2 = 0.21) cities. This trend was amplified in the last 20 years. In that period, Toronto was warmer in all years (ranging 7.5–10.4°C) than the 120-year mean annual temperature (7.4°C; Figure 7B). Mean annual temperatures of the first and last two decades were 8.9 and 10.1°C for shrinking cities and 6.9 and 8.7°C for a growing city, increases of 1.2 and 1.8°C, respectively.
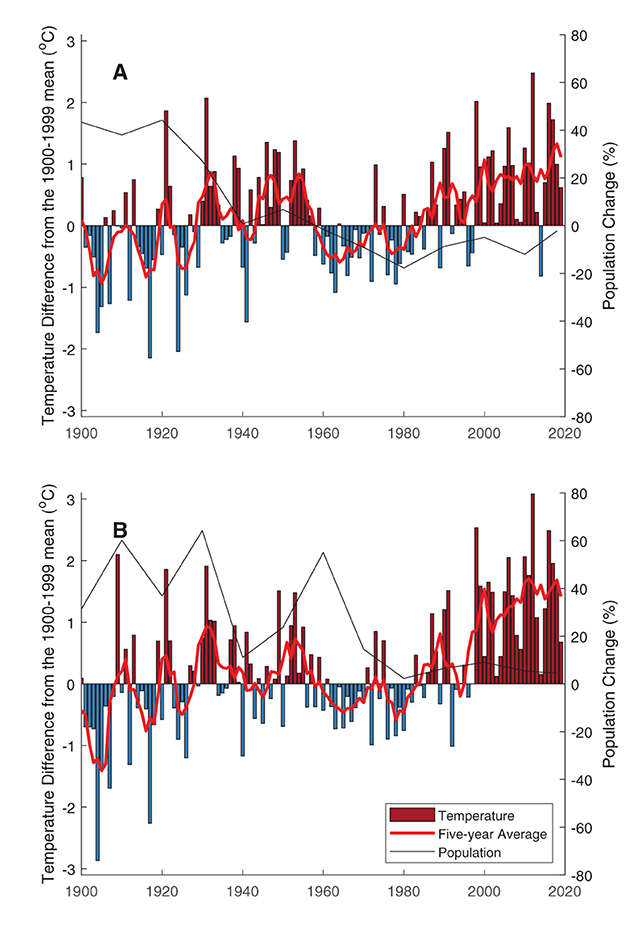
Figure 7. Long-term trends of annual mean temperature difference from the 120-year (1900–2019) mean for (A) the shrinking cities and (B) the growing city.
3.3.2. Precipitation
Similar to temperature, precipitation shows an increasing trend for both shrinking (slope = 2.2 mm yr−1, r2 = 0.35) and growing (slope = 2.4 mm yr−1, r2 = 0.24) cities (Figure 8). Compared to the 120-year means, this trend can be lumped into a dry period in the 1900–1960's and a wet period in the 1970–2010's. Mean annual precipitation of the first and last two decades of the study period was 807 and 981 mm for shrinking cities and 713 and 896 mm for a growing city, increases of 174 and 183 mm, respectively.
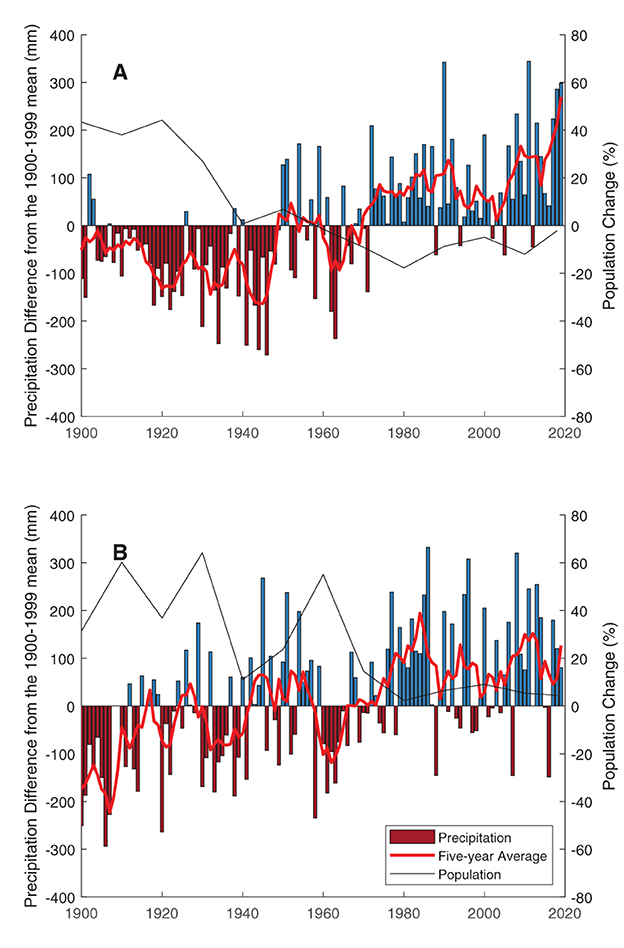
Figure 8. Long-term trends of annual total precipitation difference from the 120-year (1900–2019) mean for (A) the shrinking cities and (B) the growing city.
4. Discussion
4.1. Climate trend comparisons between shrinking and growing Rust Belt cities
Over the 120-year study period, both shrinking and growing cities with the Rust Belt region experienced a persistent increase in temperature. This is consistent with other studies that have compared highly urbanized areas to less populated surrounding or nearby areas (Bohm, 1998; Emmanuel and Kruger, 2012; Martin et al., 2012; Ajaaj et al., 2018; Wang et al., 2022). However, our research also highlights that growing cities may be experiencing elevated temperature increases relative to shrinking cities (Figure 5). This is also consistent with other studies that highlight a significant influence of urbanization on air temperature (Mishra et al., 2015; Ajaaj et al., 2018). In these studies, reduced temperature increases in less populated relative to more populated areas have been in part attributed to smaller fractions of impervious surfaces (Martin et al., 2012; Ajaaj et al., 2018) or increased area of green space or vegetation (Hu and Jia, 2010; Jaganmohan et al., 2016; Anguluri and Narayanan, 2017; Padon et al., 2020).
Unlike the increasing temperature trends for cities, across the globe both increasing and decreasing trends in precipitation have been observed (Mishra et al., 2015; Ajaaj et al., 2018). Our analysis suggests however, that precipitation has increased in cities within the Rust Belt region over the past 120 years (Figures 6, 8). Other statistical analyses of historical time series data have also demonstrated an increase in precipitation in the upper Midwestern region of the United States (Lai and Dzombak, 2019). Past research has also identified a link between increased precipitation and urbanizing coastal cities in the southern United States (Shepherd and Burian, 2003); notably, all of the Rust Belt sites we analyzed in this study were located along coasts of major water bodies (Figure 1).
4.2. Implications for climate modeling
How quickly and to what extent climate will be altered for cities and their surrounding areas remains of critical importance for decision makers. This is especially true for Great Lakes Region, where much of the Rust Belt cities are located, due to its role in harboring a major fraction of the world's freshwater resources (Soonthornrangsan and Lowry, 2021). Climate change projections with enough detail at the local and regional scales are needed to identify vulnerabilities in these areas so that appropriate adaptation and mitigation strategies can be implemented (Byun and Hamlet, 2018; Byun et al., 2019).
In their predications of climate change, general circulation models (GCMs) rely on the representation of land surface types, such as urbanized areas, in the Land-Surface Models (LSMs) within them. In many of these modeling efforts, urban areas are lumped, meaning they are represented with the same parameterizations. This means that cities are often parameterized with the UHI effect in mind (McCarthy et al., 2012; Hamdi et al., 2020). Our research suggests that while this may be appropriate for growing cities, shrinking cities may need to be represented using a different approach. Other research groups have worked on more detailed representations of cities within LSMs. For instance, the Weather Research and Forecasting (WRF) Model is an integrated land–atmosphere framework developed by the National Center for Atmospheric Research (NCAR) designed as a numerical weather prediction model. The WRF Model has been adapted for use in a variety of successful urban applications around the world (Chen et al., 2011; Vahmani and Hogue, 2014; Yang et al., 2015; Salamanca et al., 2018; Yang and Bou-Zeid, 2018). Still, the relative success of these models is limited by an accurate representation of the area being modeled based on local knowledge (Glotfelty et al., 2021). Regardless of the modeling strategy, our research points to the critical importance of differentiating between growing and shrinking cities and how they are represented when making climate change predictions associated with urban areas.
4.3. Implications for urban planning and management
Our study highlights that shrinking cities are experiencing relatively less warming than growing cities (Figures 5, 7). We suspect this is largely due to the change in land use that unintentionally resulted in an apparent increase in green space (Emmanuel, 1997) and the associated cooling effects (Emmanuel and Kruger, 2012; Jaganmohan et al., 2016; Davtalab et al., 2020). For this reason, careful consideration should be taken when looking into the redevelopment of vacant lots and brownfields so that the ecosystem services related to local climate changes such as urban heat mitigation and carbon sequestration could be maximized (Emmanuel and Kruger, 2012; Koch et al., 2018). Structure of green space has been shown to be important in the potential cooling power of urban vegetation (Davtalab et al., 2020). For instance, cooling effects were found to be greater in urban forests than in parks (Jaganmohan et al., 2016) and suggesting that the characteristics of any green spaces that vacant lots or brownfields might be converted to are paramount to maximizing their cooling effects. Importantly, the cooling effects associated with the redevelopment of brownfields may level environmental injustices (Koch et al., 2018) often associated with other greening projects in cities. We believe that our study underscores the unique potential of shrinking cities for maximizing ecosystem services associated with local climatology.
Data availability statement
The temperature and precipitation datasets analyzed for this study were downloaded from the NOAA Online Weather Data (NOWData) tool (https://www.weather.gov/wrh/Climate?wfo=bou/) and the National Centers for Environmental Information (NCEI; https://www.ncei.noaa.gov/).
Author contributions
KH and CV contributed to writing, analysis, and discussion. AE collected data, analyzed and plotted data, and contributed to discussion. SP led and organized the project and contributed to writing, analysis, and discussion. All authors contributed to the article and approved the submitted version.
Funding
This research was supported by Wayne State University College of Liberal Arts and Sciences and the Office for the Vice President for Research, NSF CNH award 1518376, NSF SRN award 1444758, and NSF EAR MCA award 2126206.
Conflict of interest
The authors declare that the research was conducted in the absence of any commercial or financial relationships that could be construed as a potential conflict of interest.
Publisher's note
All claims expressed in this article are solely those of the authors and do not necessarily represent those of their affiliated organizations, or those of the publisher, the editors and the reviewers. Any product that may be evaluated in this article, or claim that may be made by its manufacturer, is not guaranteed or endorsed by the publisher.
References
Ajaaj, A. A., Mishra, A. K., and Khan, A. A. (2018). Urban and peri-urban precipitation and air temperature trends in mega cities of the world using multiple trend analysis methods. Theoret. Appl. Climatol. 132, 403–418. doi: 10.1007/s00704-017-2096-7
Akbari, H., Pomerantz, M., and Taha, H. (2001). Cool surfaces and shade trees to reduce energy use and improve air quality in urban areas. Solar Energy 70, 295–310. doi: 10.1016/S0038-092X(00)00089-X
Anguluri, R., and Narayanan, P. (2017). Role of green space in urban planning: Outlook towards smart cities. Urb. For. Urb. Green. 25, 58–65. doi: 10.1016/j.ufug.2017.04.007
Beauregard, R. A. (2009). Urban population loss in historical perspective: United States, 1820–2000. Environ. Plan. Econ. Space 41, 514–528. doi: 10.1068/a40139a
Best, M. J. (2005). Representing urban areas within operational numerical weather prediction models. Boundary-Layer Meteorol. 114, 91–109. doi: 10.1007/s10546-004-4834-5
Bherwani, H., Singh, A., and Kumar, R. (2020). Assessment methods of urban microclimate and its parameters: A critical review to take the research from lab to land. Urban Climate 34, 18. doi: 10.1016/j.uclim.2020.100690
Blanco, H., Alberti, M., Olshansky, R., Chang, S., Wheeler, S. M., Randolph, J., et al. (2009). Shaken, shrinking, hot, impoverished and informal: Emerging research agendas in planning. Progr. Plan. 72, 195–250. doi: 10.1016/j.progress.2009.09.001
Bohm, R. (1998). Urban bias in temperature time series - A case study for the city of Vienna, Austria. Climatic Change 38, 113–128. doi: 10.1023/A:1005338514333
Burian, S. J., and Shepherd, J. M. (2005). Effect of urbanization on the diurnal rainfall pattern in Houston. Hydrol. Process. 19, 1089–1103. doi: 10.1002/hyp.5647
Byun, K., Chiu, C. M., and Hamlet, A. F. (2019). Effects of 21st century climate change on seasonal flow regimes and hydrologic extremes over the Midwest and Great Lakes region of the US. Sci. Tot. Environ. 650, 1261–1277. doi: 10.1016/j.scitotenv.2018.09.063
Byun, K., and Hamlet, A. F. (2018). Projected changes in future climate over the Midwest and Great Lakes region using downscaled CMIP5 ensembles. Int. J. Climatol. 38, E531–E553. doi: 10.1002/joc.5388
Chen, F., Kusaka, H., Bornstein, R., Ching, J., Grimmond, C. S. B., Grossman-Clarke, S., et al. (2011). The integrated WRF/urban modelling system: Development, evaluation, and applications to urban environmental problems. Int. J. Climatol. 31, 273–288. doi: 10.1002/joc.2158
Collier, C. G. (2006). The impact of urban areas on weather. Quart. J. Royal Meteorol. Soc. 132, 1–25. doi: 10.1256/qj.05.199
Collins, J., Kinzig, A., Grimm, N., Fagan, W., Hope, D., Wu, J., et al. (2000). New urban ecology. Am. Sci. 88, 416. doi: 10.1511/2000.5.416
Davtalab, J., Deyhimi, S. P., Dessi, V., Hafezi, M. R., and Adib, M. (2020). The impact of green space structure on physiological equivalent temperature index in open space. Urban Climate 31, 100574. doi: 10.1016/j.uclim.2019.100574
Emmanuel, R. (1997). Urban vegetational change as an indicator of demographic trends in cities: The case of Detroit. Environ. Plan. B Plan. Design 24, 415–426. doi: 10.1068/b240415
Emmanuel, R., and Kruger, E. (2012). Urban heat island and its impact on climate change resilience in a shrinking city: The case of Glasgow, UK. Build. Environ. 53, 137–149. doi: 10.1016/j.buildenv.2012.01.020
Glotfelty, T., Ramírez-Mejía, D., Bowden, J., Ghilardi, A., and West, J. J. (2021). Limitations of WRF land surface models for simulating land use and land cover change in Sub-Saharan Africa and development of an improved model (CLM-AF v. 1.0). Geosci. Model Dev. 14, 3215–3249. doi: 10.5194/gmd-14-3215-2021
Grimmond, C. S. B. (2010). “The climate of cities,” in The Routledge Handbook of Urban Ecology, eds I. Douglas, D. Goode, M. C. Houck, and D. Maddox (London: Routledge), 103–119.
Haase, D. (2013). “Shrinking cities, biodiversity and ecosystem services,” in Urbanization, Biodiversity and Ecosystem Services: Challenges and Opportunities: A Global Assessment, eds T. Elmqvist, M. Fragkias, J. Goodness, B. Güneralp, P. J. Marcotullio, R. I. McDonald, et al. (Dordrecht: Springer Netherlands), 253–274.
Haase, D., Frantzeskaki, N., and Elmqvist, T. (2014). Ecosystem services in urban landscapes: Practical applications and governance implications. Ambio 43, 407–412. doi: 10.1007/s13280-014-0503-1
Hamdi, R., Kusaka, H., Doan, Q. V., Cai, P., He, H. L., Luo, G. P., et al. (2020). The state-of-the-art of urban climate change modeling and observations. Earth Syst. Environ. 4, 631–646. doi: 10.1007/s41748-020-00193-3
Herrmann, D. L., Schwarz, K., Shuster, W. D., Berland, A., Chaffin, B. C., Garmestani, A. S., et al. (2016). Ecology for the Shrinking City. BioScience 66, 965–973. doi: 10.1093/biosci/biw062
Hu, L., and Li, Q. (2020). Greenspace, bluespace, and their interactive influence on urban thermal environments. Environ. Res. Lett. 15, e034041. doi: 10.1088/1748-9326/ab6c30
Hu, Y. S., and Jia, G. S. (2010). Influence of land use change on urban heat island derived from multi-sensor data. Int. J. Climatol. 30, 1382–1395. doi: 10.1002/joc.1984
Jaganmohan, M., Knapp, S., Buchmann, C. M., and Schwarz, N. (2016). The bigger, the better? The influence of urban green space design on cooling effects for residential areas. J. Environ. Qual. 45, 134–145. doi: 10.2134/jeq2015.01.0062
Jandaghian, Z., and Berardi, U. (2020). Comparing urban canopy models for microclimate simulations in Weather Research and Forecasting Models. Sustain. Cit. Soc. 55, 13. doi: 10.1016/j.scs.2020.102025
Kelleher, C., Golden, H. E., Burkholder, S., and Shuster, W. (2020). Urban vacant lands impart hydrological benefits across city landscapes. Nat. Commun. 11, 11. doi: 10.1038/s41467-020-15376-9
Kim, G. (2016). The public value of urban vacant land: Social responses and ecological value. Sustainability 8, 19. doi: 10.3390/su8050486
Koch, F., Bilke, L., Helbig, C., and Schlink, U. (2018). Compact or cool? The impact of brownfield redevelopment on inner-city micro climate. Sustain. Cit. Soc. 38, 31–41. doi: 10.1016/j.scs.2017.11.021
Lai, Y. C., and Dzombak, D. A. (2019). Use of historical data to assess regional climate change. J. Climate 32, 4299–4320. doi: 10.1175/JCLI-D-18-0630.1
Manoli, G., Fatichi, S., Schläpfer, M., Yu, K., Crowther, T. W., Meili, N., et al. (2019). Magnitude of urban heat islands largely explained by climate and population. Nature 573, 55–60. doi: 10.1038/s41586-019-1512-9
Martin, J., Kurc, S. A., Zaimes, G., Crimmins, M., Hutmacher, A., and Green, D. (2012). Elevated air temperatures in riparian ecosystems along ephemeral streams: The role of housing density. J. Arid Environ. 84, 9–18. doi: 10.1016/j.jaridenv.2012.03.019
McCarthy, M. P., Harpham, C., Goodess, C. M., and Jones, P. D. (2012). Simulating climate change in UK cities using a regional climate model, HadRM3. Int. J. Climatol. 32, 1875–1888. doi: 10.1002/joc.2402
McPhearson, T., Kremer, P., and Hamstead, Z. A. (2013). Mapping ecosystem services in New York City: Applying a social-ecological approach in urban vacant land. Ecosyst. Serv. 5, E11–E26. doi: 10.1016/j.ecoser.2013.06.005
Meerow, S., and Newell, J. P. (2017). Spatial planning for multifunctional green infrastructure: Growing resilience in Detroit. Land. Urb. Plan. 159, 62–75. doi: 10.1016/j.landurbplan.2016.10.005
Mishra, V., Ganguly, A. R., Nijssen, B., and Lettenmaier, D. P. (2015). Changes in observed climate extremes in global urban areas. Environ. Res. Lett. 10, 24005. doi: 10.1088/1748-9326/10/2/024005
Mitchell, V. G., Cleugh, H. A., Grimmond, C. S. B., and Xu, J. (2008). Linking urban water balance and energy balance models to analyse urban design options. Hydrol. Process. 22, 2891–2900. doi: 10.1002/hyp.6868
Oke, T. R. (1973). City size and the urban heat island. Atmos. Environ. 7, 769–779. doi: 10.1016/0004-6981(73)90140-6
Oleson, K. W., Bonan, G. B., Feddema, J., Vertenstein, M., and Grimmond, C. S. B. (2008). An urban parameterization for a global climate model. Part I: Formulation and evaluation for two cities. J. Appl. Meteorol. Climatol. 47, 1038–1060. doi: 10.1175/2007JAMC1597.1
Padon, A., Iamtrakul, P., Punson, B., Klaylee, J., and IEEE. (2020). “The study on association between urban green space and temperature changes in mega city,” in Paper Presented at the International Conference on Energy, Environment, and Climate Change (ICUE), Asian Inst Technol, Pathumthani, Thailand. doi: 10.1109/ICUE49301.2020.9307077
Pickett, S. T. A., Cadenasso, M. L., Grove, J. M., Nilon, C. H., Pouyat, R. V., Zipperer, W. C., et al. (2001). Urban ecological systems: Linking terrestrial ecological, physical, and socioeconomic components of metropolitan areas. Ann. Rev. Ecol. Systemat. 32, 127–157. doi: 10.1146/annurev.ecolsys.32.081501.114012
Sailor, D. J., and Lu, L. (2004). A top-down methodology for developing diurnal and seasonal anthropogenic heating profiles for urban areas. Atmos. Environ. 38, 2737–2748. doi: 10.1016/j.atmosenv.2004.01.034
Salamanca, F., Zhang, Y., Barlage, M., Chen, F., Mahalov, A., and Miao, S. (2018). Evaluation of the WRF-urban modeling system coupled to noah and noah-MP land surface models over a semiarid urban environment. J. Geophys. Res. 123, 2387–2408. doi: 10.1002/2018JD028377
Schilling, J., and Logan, J. (2008). Greening the rust belt: A green infrastructure model for right sizing America's shrinking cities. J. Am. Plan. Assoc. 74, 451–466. doi: 10.1080/01944360802354956
Shepherd, J. M., and Burian, S. J. (2003). Detection of urban-induced rainfall anomalies in a major coastal city. Earth Interact. 7, 1. doi: 10.1175/1087-3562(2003)007<0001:DOUIRA>2.0.CO;2
Soonthornrangsan, J. T., and Lowry, C. S. (2021). Vulnerability of water resources under a changing climate and human activity in the lower Great Lakes region. Hydrol. Process. 35, 14440. doi: 10.1002/hyp.14440
Steffen, W., Rockström, J., Richardson, K., Lenton, T. M., Folke, C., Liverman, D., et al. (2018). Trajectories of the earth system in the anthropocene. Proc. Natl. Acad. Sci. 115, 8252–8259. doi: 10.1073/pnas.1810141115
Taha, H. (1997). Urban climates and heat islands: Albedo, evapotranspiration, and anthropogenic heat. Energy Build. 25, 99–103. doi: 10.1016/S0378-7788(96)00999-1
Vahmani, P., and Hogue, T. S. (2014). Incorporating an urban irrigation module into the noah land surface model coupled with an urban canopy model. J. Hydrometeorol. 15, 1440–1456. doi: 10.1175/JHM-D-13-0121.1
Wang, Y. J., Xiang, Y., Song, L. C., and Liang, X. Z. (2022). Quantifying the contribution of urbanization to summer extreme high-temperature events in the Beijing-Tianjin-Hebei urban agglomeration. J. Appl. Meteorol. Climatol. 61, 669–683. doi: 10.1175/JAMC-D-21-0201.1
Ward, H. C., Evans, J. G., and Grimmond, C. S. B. (2013). Multi-season eddy covariance observations of energy, water and carbon fluxes over a suburban area in Swindon, UK. Atmos. Chem. Phys. 13, 4645–4666. doi: 10.5194/acp-13-4645-2013
Yang, J., and Bou-Zeid, E. (2018). Should cities embrace their heat islands as shields from extreme cold? J. Appl. Meteorol. Climatol. 57, 1309–1320. doi: 10.1175/JAMC-D-17-0265.1
Yang, J. C., Wang, Z. H., Chen, F., Miao, S. G., Tewari, M., Voogt, J. A., et al. (2015). Enhancing hydrologic modelling in the coupled weather research and forecasting-urban modelling system. Bound. Layer Meteorol. 155, 87–109. doi: 10.1007/s10546-014-9991-6
Yang, Z., Dominguez, F., Gupta, H., Zeng, X., and Norman, L. (2016). Urban effects on regional climate: A case study in the phoenix and tucson “sun corridor”. Earth Interact. 20, 1–25. doi: 10.1175/EI-D-15-0027.1
Zhang, C., Tian, H. Q., Chen, G. S., Chappelka, A., Xu, X. F., Ren, W., et al. (2012). Impacts of urbanization on carbon balance in terrestrial ecosystems of the Southern United States. Environ. Pollut. 164, 89–101. doi: 10.1016/j.envpol.2012.01.020
Zhao, L., Lee, X., Smith, R. B., and Oleson, K. (2014). Strong contributions of local background climate to urban heat islands. Nature 511, 216–219. doi: 10.1038/nature13462
Keywords: green space, temperature, precipitation, urbanization, urban heat island, Detroit, vacant lots, brownfields
Citation: Hwang K, Eklund A, Valdez C and Papuga SA (2023) Impacts of urban decline on local climatology: A comparison of growing and shrinking cities in the post-industrial Rust Belt. Front. Clim. 5:1010849. doi: 10.3389/fclim.2023.1010849
Received: 03 August 2022; Accepted: 02 January 2023;
Published: 23 January 2023.
Edited by:
Tobi Eniolu Morakinyo, University College Dublin, IrelandReviewed by:
Roger Clay, University of Adelaide, AustraliaHuade Guan, Flinders University, Australia
Guoyu Qiu, Peking University, China
Copyright © 2023 Hwang, Eklund, Valdez and Papuga. This is an open-access article distributed under the terms of the Creative Commons Attribution License (CC BY). The use, distribution or reproduction in other forums is permitted, provided the original author(s) and the copyright owner(s) are credited and that the original publication in this journal is cited, in accordance with accepted academic practice. No use, distribution or reproduction is permitted which does not comply with these terms.
*Correspondence: Shirley A. Papuga,  c2hpcmxleS5wYXB1Z2FAd2F5bmUuZWR1