 Xiaosong Yang
 Thomas L. Delworth
 Liwei Jia1,2
 Nathaniel C. Johnson
 Feiyu Lu
94% of researchers rate our articles as excellent or good
Learn more about the work of our research integrity team to safeguard the quality of each article we publish.
Find out more
ORIGINAL RESEARCH article
Front. Clim., 14 September 2022
Sec. Predictions and Projections
Volume 4 - 2022 | https://doi.org/10.3389/fclim.2022.972119
This article is part of the Research TopicThe State of the Art in Climate PredictionsView all 9 articles
The rapid day-to-day temperature swings associated with extratropical storm tracks can cause cascading infrastructure failure and impact human outdoor activities, thus research on seasonal prediction and predictability of extreme temperature swings is of huge societal importance. To measure the extreme surface air temperature (SAT) variations associated with the winter extratropical storm tracks, a Temperature Swing Index (TSI) is formulated as the standard deviation of 24-h-difference-filtered data of the 6-hourly SAT. The dominant term governing the TSI variability is shown to be proportional to the product of eddy heat flux and mean temperature gradient. The seasonal prediction skill of the winter TSI over North America was assessed using Geophysical Fluid Dynamics Laboratory's new seasonal prediction system. The locations with skillful TSI prediction show a geographic pattern that is distinct from the pattern of skillful seasonal mean SAT prediction. The prediction of TSI provides additional predictable climate information beyond the traditional seasonal mean temperature prediction. The source of the seasonal TSI prediction can be attributed to year-to-year variations of the El Niño-Southern Oscillation (ENSO), North Pacific Oscillation (NPO), and Pacific/North American (PNA) teleconnection. Over the central United States, the correlation skill of TSI prediction reaches 0.75 with strong links to observed ENSO, NPO, and PNA, while the skill of seasonal SAT prediction is relatively low with a correlation of 0.36. As a first attempt of diagnosing the combined predictability of the first-order (the seasonal mean) and second-order (TSI) statistics for SAT, this study highlights the importance of the eddy-mean flow interaction perspective for understanding the seasonal climate predictability in the extra tropics. These results point toward providing skillful prediction of higher-order statistical information related to winter temperature extremes, thus enriching the seasonal forecast products for the research community and decision makers.
Extratropical storm tracks are regions of frequent synoptic baroclinic waves and associated surface cyclones and anticyclones (Chang et al., 2002). One type of adverse weather extremes associated with extratropical storm tracks is the rapid day-to-day temperature swings often connected with cold snaps. In this study, the temperature swing refers to synoptic surface air temperature (SAT) variations associated with extratropical storm tracks. North America experienced a historical extreme 2013/14 winter with frequent cold outbreaks, snowstorms, and icy weather (van Oldenborgh et al., 2014; Trenary et al., 2015; Yang et al., 2015a; Yu and Zhang, 2015), associated with an extreme storm track activity extending from central Canada down to the Midwestern and Eastern USA (Yang et al., 2015a). Such a climate extreme event with rapid temperature swings can cause cascading infrastructure failure. The frequency and intensity of temperature swings can change the length of mild weather days which are pleasant for human outdoor activities (van der Wiel et al., 2017). The rapid day-to-day temperature swings have been shown to pose a public threat to human health by increasing the risk of mortality especially for the population with certain medical conditions (Guo et al., 2011; Shi et al., 2015), and increasing influenza epidemic risk (Liu et al., 2020). Additionally, the synoptic temperature swing and the mean temperature are both important for characterizing the whole distribution of temperature changes in the context of assessing extreme climate impact (Jahn, 2015). Thus, research on prediction and predictability of extreme temperature swings is of huge societal importance and scientific interest.
On multi-decadal to centennial time scale, the CMIP5 models predicted a robust decrease of the cold-season near-surface daily temperature variance (one type of metric for measuring temperature swings) in the Northern Hemisphere mid- to high-latitudes associated with Arctic amplification under global warming in the twenty-first century (Screen, 2014), and a reduced risk of North American cold extremes (Screen et al., 2015). Schneider et al. (2015) provided some theoretical scaling on the physics of changes in synoptic mid-latitude temperature variance, and it is related to mean potential temperature gradients and mixing lengths near the surface. This scaling shows that the reduction of meridional potential temperature gradients that accompanies polar amplification under global warming leads to a reduction of the synoptic temperature variance near the surface. However, the prediction and predictability of surface temperature swings on the seasonal time scale has not yet been explored.
The skillful predictions of extratropical storm tracks over North America have been achieved on subseasonal (Zheng et al., 2019, 2021) and seasonal time scales (Yang et al., 2015b; Feng et al., 2019). The cold-season temperature swings (or synoptic temperature variance) appear to collocate with storm tracks in the extratropical Northern Hemisphere and show a continental enhancement over North America (Schneider et al., 2015; Lutsko et al., 2019). Thus, skillful prediction of temperature swings associated with extratropical storm tracks is expected over North America. Seasonal prediction of mean SAT has been routinely provided in the real-time North America Multi-Model Ensemble (Kirtman et al., 2014), but the prediction and predictability of the surface temperature swings, related to extreme statistics of SAT, have not been explored. Skillful prediction of temperature swings would potentially enrich the seasonal forecast information from the mean to extreme and therefore improve awareness and preparedness for the extreme-related disasters.
In this study, we use the seasonal retrospective forecasts (SRF) from GFDL's Seamless system for Prediction and EArth system Research (SPEAR, Delworth et al., 2020) to assess prediction skill of surface temperature swings and explore possible sources for the skill. In section Materials and Methods, we describe the prediction model, retrospective forecasts, observations, and methods. In section Extratropical Storm Track Index and Temperature Swing Index, we describe the formulation of Temperature Swing Index (TSI) and the physical process controlling TSI. We present in section Results the complementary effect of the TSI and SAT skill with their distinctive geographical patterns and provide physical understanding of the TSI skill associated with observed major climate modes. A summary is presented in section Conclusions.
The SPEAR models incorporated many components used in the GFDL CM4 model (Held et al., 2019), including the newly developed atmosphere and land components from AM4 to LM4 (Zhao et al., 2018a,b) and ocean and ice components from OM4 (Adcroft et al., 2019). Seamless system for Prediction and EArth system Research has been used for subseasonal (Xiang et al., 2022), seasonal (Lu et al., 2020) to decadal (Yang et al., 2021) climate predictions, and future climate projections (Delworth et al., 2020). Seamless system for Prediction and EArth system Research offers various atmospheric resolutions allowing users to optimize the model configuration toward research interests and/or prediction focus given available computational resources. For seasonal climate prediction, we use the medium resolution model (SPEAR_MED). In SPEAR_MED, the horizontal resolution in the ocean and sea ice components is about 1° with meridional refinements to 1/3° in the Tropics. The hybrid vertical coordinate in the ocean model has 75 layers with layer thickness as fine as 2 m near the surface, including 30 layers in the top 100 m. SPEAR_MED has an atmospheric resolution of approximately 50 km, and it has 33 vertical levels with model top at 1 hPa. The land model in SPEAR_MED has the same horizontal resolution as the atmosphere model. SPEAR_MED has been used for GFDL's real-time seasonal forecasts, contributing to the North American Multimodel Ensemble (NMME) project (Kirtman et al., 2014; Becker et al., 2020) since 2021 (https://www.cpc.ncep.noaa.gov/products/NMME/).
Seamless system for Prediction and EArth system Research's seasonal retrospective forecasts (SPEAR's SRF) were initialized with a 30-member ocean reanalysis using SPEAR's ocean data assimilation (ODA) in combination with a separate set of SPEAR_MED's ensemble coupled nudged (SPEAR_MED_Nudged) simulations. In the SPEAR_MED_nudged simulations with five ensemble members, the atmospheric temperature, horizontal winds, and moisture were nudged toward the 6-hourly data from the Climate Forecast System Reanalysis (CFSR, Saha et al., 2014); and the Sea Surface Temperature (SST) restored toward the daily observations from the Optimum Interpolation Sea Surface Temperature (OISSTv2, Reynolds et al., 2007). The ocean observations for ODA include daily SST from OISSTv2, Argo temperature and salinity data (Wong et al., 2020), daily Global Tropical Moored Buoy Array temperature data from NOAA/Pacific Marine Environmental Laboratory (PMEL) (https://www.pmel.noaa.gov/gtmba/), and XBT (eXpendable BathyThermograph) data from the Global Temperature and Salinity Profile Programme (GTSPP) (Sun et al., 2010). The SRF initial conditions for the atmospheric, land, and sea ice components are from SPEAR_MED_nudged, and the initial conditions of the ocean component are from SPEAR's ODA. The 15-member initial conditions of the ocean component for SRF are directly taken from the first 15 members of the ODA, while members 1–5, 6–10, and 11–15 share the same initial conditions of the atmospheric, land and sea ice components from the five-member SPEAR_MED_Nudged simulations. The SRF with 15 ensemble members were initialized on the first day of each month each year and integrated forward for 12 months from 1991 to 2022. An ocean tendency adjustment derived from ODA's increments is applied to SRF for reducing the model drift. The details of SPEAR's ODA, ocean tendency adjustment and initialization configuration for SRF can be found in Lu et al. (2020). The focus of this study is on the December–January–February (DJF) season from SRF initialized on 1st December. SPEAR's SRF has shown significant seasonal forecast skill in predicting a wide range of essential indicators of climate variability, including but not limited to the SST, SAT over land, mid-latitude baroclinic waves, Antarctic/Arctic sea ice, Kuroshio extension, North American summertime heat extremes, and atmospheric rivers over Western North America (Lu et al., 2020; Bushuk et al., 2021, 2022; Tseng et al., 2021; Zhang et al., 2021; Jia et al., 2022; Joh et al., 2022).
We also analyze another 15-member SPEAR_MED ensemble simulations with historical radiative forcing (hereafter called HIST) to isolate the predictability source from the radiative forcings. Ensemble members of HIST were initialized from conditions in a long 1850 control simulation with atmospheric composition fixed at levels representative of calendar year 1850. In HIST, the time-varying historical natural and anthropogenic forcings were applied before 2014, while projections for the Shared Socioeconomic Pathway 5-8.5 (SSP5-8.5) (Kriegler et al., 2017; Riahi et al., 2017) were applied for years after 2014. Note that the radiative forcing in SRF is identical to those in the HIST simulations.
For the skill assessment and diagnosis for SPEAR's SRF, the forecast anomalies for each variable were obtained by subtracting out the lead-time-dependent climatology from forecasts, which effectively removes the climate drift assuming that the climate drift is systematic as a function of forecast lead time. The anomaly correlation coefficient (ACC) between ensemble mean forecast anomalies and observational anomalies is used for skill assessment. The skill verification data includes 6-hourly horizontal winds and temperature at 850 hPa, 6-hourly and monthly sea level pressure (SLP) and SAT from the European Centre for Medium-Range Weather Forecasts (ECMWF) reanalysis—ERA5 (Hersbach et al., 2020). The observed SST is the monthly SST data from NOAA's OISST V2 (Reynolds et al., 2002).
In this study, the Niño 3.4 index (NINO3.4) is calculated as the area averaged SST anomalies over 5°S−5°N and 170°-120°W. Following Furtado et al. (2012), the North Pacific Oscillation (NPO) index is calculated as the difference of the area-averaged SLP anomalies between a high-latitude North Pacific box (55°-72.5°N; 180°-140°W) and a subtropical North Pacific box (15°-27.5°N; 175°E−147.5°W). The NAO index is the station-based index calculated as the difference of normalized SLP between Lisbon, Portugal, and Stykkisholmur/Reykjavik, Iceland (Hurrell and Deser, 2009). Following Leathers et al. (1991), the Pacific/North American (PNA) teleconnection index is constructed from a linear combination of standardized 700-hPa height anomalies (Z*) at three grid points nearest the anomaly field centers as
The Extratropical Storm Track Index (ESTI) is defined as the seasonal standard deviation of the 24-h-difference filtered 6-hourly SLP at each grid point. The ESTI can be calculated as follows:
where N is the sample size of SLP during the DJF season for each year and n represents the data time step. This filter has half power points of 1.2 and 6 days (Wallace et al., 1988), and the resulting statistical properties of storm tracks are very similar to those obtained from other bandpass filters (Chang and Fu, 2002). Our focus here is on the surface extratropical storm tracks, so SLP is used to calculate ESTI. This method of measuring extratropical storm tracks has been widely used in the future projections (Chang, 2013), the subseasonal (Zheng et al., 2021) and seasonal (Yang et al., 2015b, 2018) climate prediction of extratropical storm tracks, and for attribution analysis of the 2013/14-winter extreme event of extratropical storm tracks over North America (Yang et al., 2015a).
We propose to formulate a TSI with the same 24-h-difference filter as ESTI but with the 6-hourly SAT data as follows:
Temperature Swing Index is physically similar to the standard deviation of synoptic eddy temperature perturbations estimated from 2-to-8-days bandpass filtered data at pressure levels (Trenberth, 1991). The effectiveness of TSI for measuring temperature swings is illustrated in Figure 1 for one mid-latitude location (90°W, 45°N) in the United States. For the season with a high (low) TSI from ERA5, the time series of SAT shows more (less) frequent synoptic fluctuations of SAT with low values below 250 K and high values above 270 K (Figure 1A), and thus TSI measures the synoptic weather extremes. SPEAR's SRF can simulate the observed contrasts of the strong/weak SAT swings associated with corresponding high/low TSI (Figure 1B).
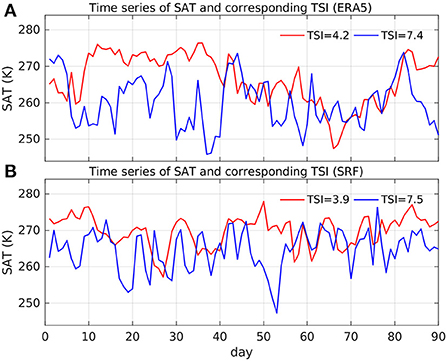
Figure 1. Illustration of daily SAT time series and corresponding TSI at a mid-latitude location (90°W, 45°N) in the United States for two contrasting seasons with weak (red) and strong (blue) temperature swings from (A) ERA5 data and (B) SRF. The corresponding TSI values are prescribed in each line caption. Units of SAT and TSI are K.
As shown in Equation (7) of Trenberth (1991), the synoptic eddy temperature perturbations in the lower troposphere can be approximated as:
where the overbar denotes a time average (DJF season here), and the prime denotes the synoptic eddy perturbations (the 24-h-difference filtered data here). In principle, the synoptic temperature swings are primarily generated by eddy wind advections over the mean temperature gradient, e.g., northerly (southerly) winds advect colder (warmer) air south (north). Without loss of generality, we add the second term on the right-hand side of Equations (4)–(7) of Trenberth (1991) for considering zonal eddy winds interacting with the mean zonal temperature gradient. Multiplying T′ to Equation (4) and then taking a time average give
Therefore, the synoptic temperature variance (or TSI in the form of standard deviation) in the lower troposphere is proportional to the product of eddy heat flux and the mean temperature gradient. The term in the right side of Equation (5) was shown to be the dominant advective term of driving synoptic temperature variations in a moist GCM simulation by Lutsko et al. (2019) using a temperature variance budget analysis (Wilson and Williams, 2006). To further support this theory of synoptic temperature variance regulation, we show in Supplementary Figure 1 that the 850-hPa synoptic temperature variance is highly correlated with the advection term with correlations exceeding 0.8 along the storm tracks in North Pacific, North America, and North Atlantic. Note that the near-surface synoptic eddy heat flux can be estimated from a diffusive closure with the mean temperature gradients (Kushner and Held, 1998), thus the synoptic temperature variance can be related to the mean temperature gradient and mixing length near the surface (Schneider et al., 2015).
The above theory of synoptic temperature variance controls indicates that the variability of TSI is related to the variability of SAT gradient but not SAT itself, so the predictable patterns of TSI are distinctive from those of SAT for a given large-scale climate predictability driver [e.g., the El Niño-Southern Oscillation (ENSO) teleconnection]. In next section, we will use this theory to understand why the skillful predictions of TSI and SAT emerge in different geographical locations over North America.
From the climatological seasonal mean perspective, the dominant cold air mass with high SLP is observed over much of North America while the upstream North Pacific and downstream North Atlantic are occupied with relatively warm air masses with low SLP (Figures 2A,C). For the high-order statistics using the seasonal standard deviation of 24-h-difference filtered SLP, the observed North America surface storm tracks show comparable intensity with the two oceanic storm tracks in the upstream and downstream regions. The observed strong surface temperature swings with TSI exceeding 4 K are firmly localized in the North American continent presumably due to the stronger horizontal temperature gradients in the continent than the ocean basins. SPEAR's SRF shows remarkable agreement with ERA5 in the simulation of climatological ESTI and TSI with very high spatial correlations of 0.98 and 0.95, respectively (Figures 2B,D), although the model tends to overestimate observed ESTI and TSI in Northwestern North America and underestimate TSI in central North America (Supplementary Figure 2). The enhancement of TSI over North America is consistent with the enhanced variance of synoptic 850-hPa temperature in observations and CMIP5 simulations (Schneider et al., 2015). The presence of the Rockies might also contribute to the enhancement of TSI over North America by increasing temperature gradients over North America (Lutsko et al., 2019).
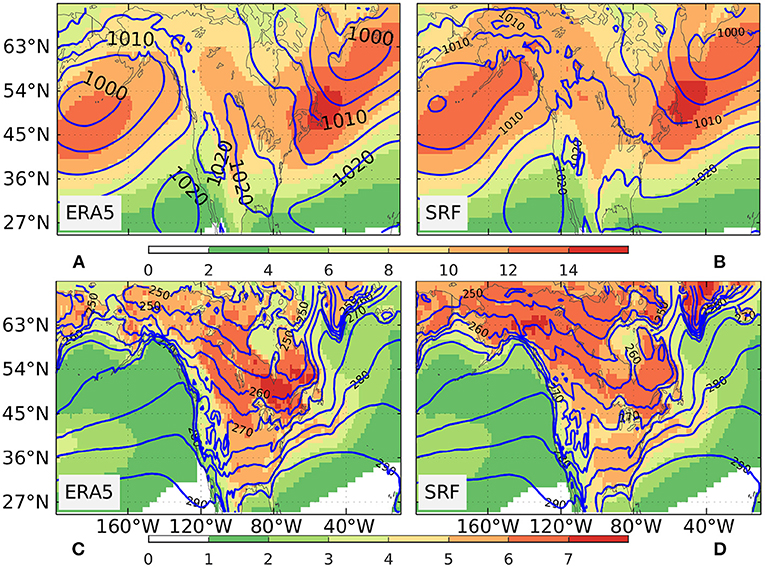
Figure 2. The climatological seasonal mean (December–February, DJF) sea level pressure (SLP) (contour, units in hPa) and extratropical storm tracks (shading, units in hPa) over the period 1992–2022 from (A) ERA5 data and (B) SRF. The climatological seasonal mean SAT (contour, units in K) and TSI (shading, units in K) for the DJF during 1992–2022 from (C) ERA5 data and (D) SRF.
In addition to the model's performance of mean climate simulations, its ability to simulate spatial and temporal climate variability is also essential for the seasonal climate prediction. A year-to-year standard deviation is calculated to measure the temporal climate variability for a given seasonal mean variable. We show in Figure 3 the standard deviation of DJF seasonal anomalies for observed and simulated SLP, ESTI, SAT, and TSI, respectively. SPEAR's SRF broadly captures the spatial structure of SLP and SAT variabilities in North America and its surrounding oceans with high spatial correlations of 0.90 and 0.91, respectively, although the model tends to overestimate the SLP variability in the North Pacific and the SAT variability in Northwestern North America (Supplementary Figure 3). The observed spatial structures of ESTI and TSI variability are also well-simulated by the model with high spatial correlations of 0.92 and 0.87, respectively. The standard deviation bias of ESTI is characterized by a general tripole pattern with positive signs in Northwestern North America and the East Coast of the USA, and the opposite sign in central North America. The standard deviation bias pattern of TSI shows a dipole with a relatively strong positive center in most of Canada and a relatively weak negative center in the central USA.
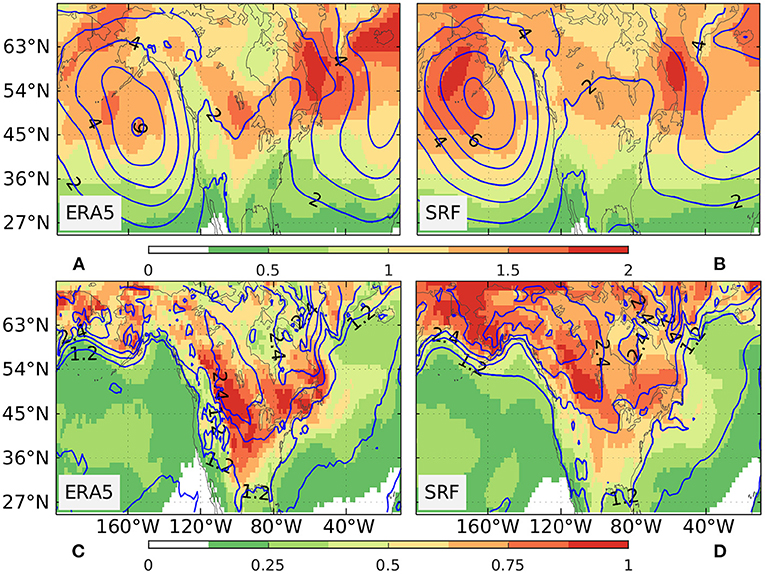
Figure 3. The standard deviation of seasonal SLP anomalies (contour, units in hPa) and Extratropical Storm Track Index (shading, units in hPa) for DJF during 1992–2022 from (A) ERA5 data and (B) SRF. The standard deviation of seasonal SAT anomalies (contour, units in K) and TSI (shading, units in K) for DJF during 1992–2022 from (C) ERA5 data and (D) SRF.
We first assess the skill of predicting seasonal mean SLP/ESTI and SAT/TSI using the ACC as shown in Figure 4. The prediction of seasonal mean SLP shows high skill (ACC > 0.6) over the West Coast of North America and the East Coast of USA and low skill (ACC < 0.4) over the central USA and most of Canada (Figure 4A). In stark contrast to the geographic pattern of seasonal mean SLP skill, the significant prediction skill of ESTI (a second-order statistics of 24-h-difference-filtered SLP) appears to be located in central North America, including the central USA, Eastern and Western Canada (Figure 4B), where the seasonal mean SLP skill tends to be low or non-existent. The spatial distribution of significant ACC for SLP (ESTI) bears a resemblance to the observed and modeled regression patterns of SLP (ESTI) onto the observed NINO3.4 index (Supplementary Figure 4), suggesting that the very high skill of predicting NINO3.4 (ACC = 0.96) is the primary source for the skilful prediction of SLP (ESTI) via the ENSO teleconnection. The spatial pattern and correlation skill level of ESTI over North America are very similar to those estimated from a previous generation GFDL prediction model (Yang et al., 2015b).
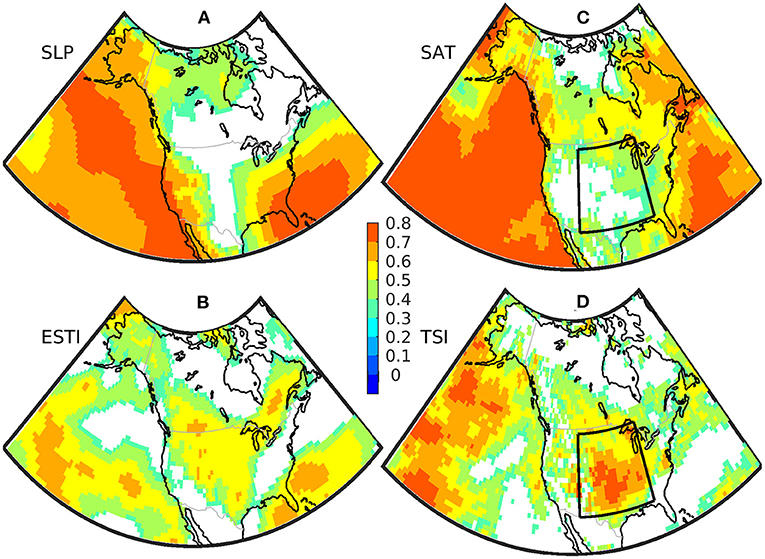
Figure 4. The anomaly correlation coefficient (ACC) between SPEAR's Seasonal Retrospective Forecasts (SRF) and ERA5 for the DJF mean (A) SLP, (B) Extratropical Storm Track Index (ESTI), (C) SAT, and (D) TSI, respectively. ACC values with the statistical p-value larger than 0.05 are not shown. SRF are initialized on 1st December during 1992–2021.
With a similar geographic skill pattern of SLP, the predictive skill of SAT is generally limited over North America especially in the central USA, while it is high over the oceans with ACC larger than 0.6 (Figure 4C). Interestingly, the model exhibits moderate to high skill of predicting TSI in most of the USA and the Western and Southern parts of Canada (Figure 4D). Thus, the predictive skill patterns of both ESTI and TSI, as second-order climate statistics, are geographically distinct from those of their corresponding first-order statistics, i.e., the seasonal mean SLP and SAT. Note that TSI has its spatially distinctive climatology and variability from ESTI (Figures 2, 3), and a direct skill assessment of predicting TSI provides additional value beyond ESTI for considering the climate impacts of extratropical storm tracks. Therefore, the combination of seasonal mean skill and second-order statistics skill has an additive effect for providing useful climate predictions for a variety of end users.
The complementary skill of the seasonal mean and second-order statistics might arise from the extratropical eddy-mean flow interaction aspects that storm-track variations are symbiotically linked to the planetary-scale flow changes (Lau, 1988; Cai and Mak, 1990; Branstator, 1995). The ENSO teleconnection, a primary driver of the seasonal climate predictability, is also characterized by strong transient eddy-mean flow interactions associated with anomalous tropical heating (Held et al., 1989). The eddy-mean flow interaction perspective for diagnosing seasonal extratropical storm track predictability associated with ENSO has been investigated by Yang et al. (2015b). Here, we focus on diagnosing the complementary skill of the seasonal mean SAT and the seasonal TSI associated with the observed major large-scale climate modes.
The leading predictable component of the boreal winter extratropical storm tracks appears to be ENSO-related in GFDL's previous generation prediction model (Yang et al., 2015b), so we first investigate the predictability pattern of DJF SAT and TSI associated with ENSO. The observed regression pattern onto the observed NINO3.4 for DJF SAT derived from ERA5, shown in Figure 5A, is characterized by a south–north dipole over North America with cold anomalies in the Northern Mexico and Southern United States and warm anomalies covering most of Canada. In marked contrast to the SAT regression pattern, the observed TSI regression pattern is generally V-shaped, with a base at the Southern United States and two flanks extending toward the West Coast of Canada and the East Coast of United States, respectively (Figure 5C). The observed V-shaped TSI regression pattern clearly shows its distinction from the south–north dipole pattern of SAT, and the maximum signal of the TSI pattern appears to locate in the middle of the SAT dipole pattern. Remarkably, both the observed dipole pattern of SAT and V-shaped pattern of TSI over North America are well-predicted by the model, with high spatial correlations of 0.81 and 0.84, respectively (Figures 5B,D). The regression analysis indicates that a significant reduction of the synoptic temperature swings is expected in central North America for El Niño and vice versa for La Niña.
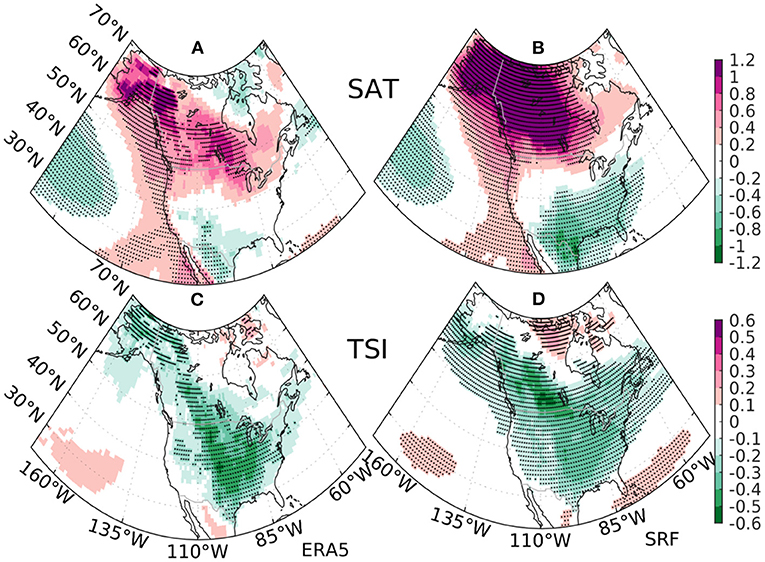
Figure 5. The regression pattern onto the observed normalized NINO34 index for the DJF surface air temperature (SAT) (units in K) from (A) ERA5 reanalysis and (B) the ensemble mean estimates from SPEAR's SRF during 1992–2022. The same regression pattern for the DJF Temperature Swing Index (TSI) (units in K) from (C) ERA5 reanalysis and (D) the ensemble mean estimates from SPEAR's SRF. The stippling indicates regression coefficients significant at 10% level.
To further understand the contrast between the two patterns, we perform the same regression analysis for the 850-hPa meridional temperature gradient and the advection term at 850 hPa in Equation (5), which controls the TSI variability. The regression coefficients of TSI are generally in phase with those of the temperature gradient as well as the advection term (a product of temperature gradient and eddy heat flux) (Figure 6A). Physically, the reduced meridional temperature gradient weakens TSI between 30°N and 50°N during the positive phase of ENSO and vice versa. The model largely predicts the in-phase relationship between TSI and the mean temperature gradient/advection term (Figure 6B, Supplementary Figure 5). The model also predicts the observed ENSO teleconnection pattern of the 850-hPa advection term over the North Pacific/North America sector with a high spatial correlation of 0.83 (Supplementary Figure 5), indicating that the physical process controlling the TSI variability is well represented in the model. In the temporal dimension, the model almost perfectly predicts all observed ENSO events with a very high ACC of 0.96 (Figure 7A). The high spatial similarity between the skill pattern of TSI and the V-shaped TSI regression pattern onto NINO3.4 (Figures 4, 5) and the high skill of predicting NINO3.4 indicate that ENSO is a primary driver of the prediction skill of TSI over North America.
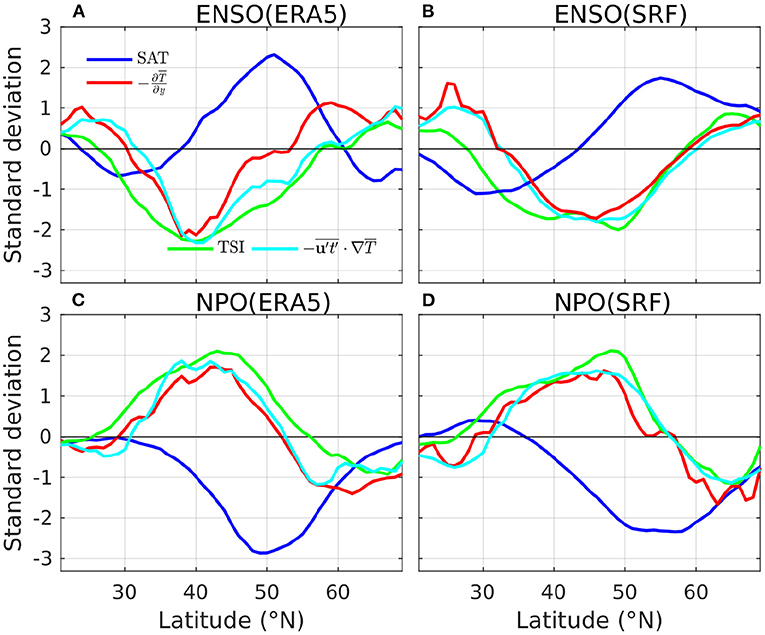
Figure 6. The zonally averaged regression coefficients over 110°W−70°W for the DJF SAT (blue), TSI (green), 850-hPa temperature gradient (red), and the advection term at 850 hPa (cyan) during 1992–2022. The regression onto the observed[[Inline Image]] NINO3.4 from (A) ERA5 reanalysis and (B) SPEAR's SRF, and the observed NPO index from (C) ERA5 reanalysis and (D) SPEAR's SRF. For plotting purpose, all the zonally averaged regression coefficients normalized by the corresponding spatial standard deviations over 20°N−70°N.
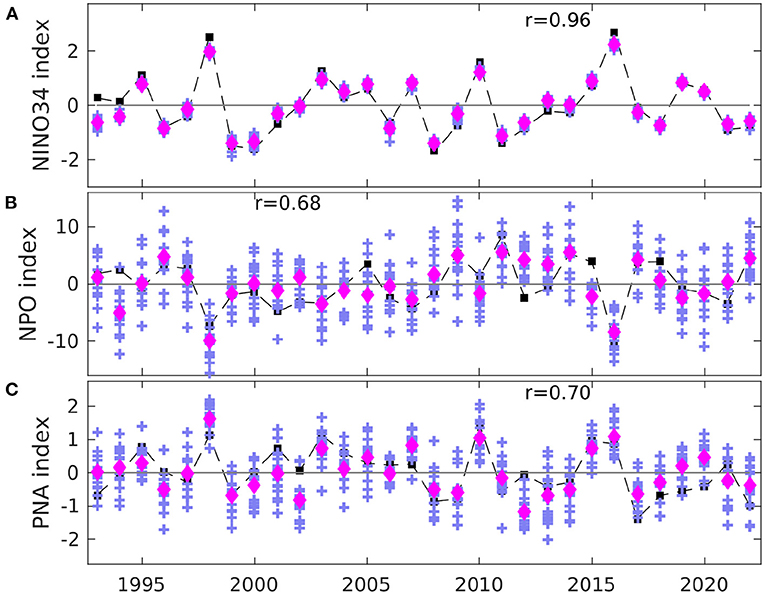
Figure 7. (A) Time series of the DJF NINO34 anomalies from OISST V2 (black square) and SPEAR's SRF (magenta diamond for ensemble mean, plus signs for each ensemble member) during 1992–2022. Panels (B) and (C) are the same plot as (A) but for the NPO and PNA index, respectively.
Beyond ENSO, the NPO variability has substantial impact on winter SATs and storm tracks over North America (Linkin and Nigam, 2008), so we explore the linkage between NPO and predictability of TSI over North America. The observed regression pattern onto the observed NPO index for DJF SAT is predominantly a broad area of cold anomaly encompassing Canada and extending toward the Central and Eastern United States, and a small area of anomalous warmth concentrated around New Mexico (Figure 8A). In contrast, the observed TSI pattern associated with NPO displays with a long vertical arm of positive anomalies extending southward from Alaska across Rocky Mountains and toward the Gulf Coastal Plain and then deflecting toward the Northeast (Figure 8C). The observed TSI regression pattern exhibits an apparent phase shift from the SAT pattern. Akin to the dynamical processes of TSI variability associated with ENSO, the regression coefficients of TSI onto NPO are generally in phase with those of the temperature gradient as well as the advection term (Figures 6C,D). SPEAR's SRF largely predicts the observed regression patterns of SAT and TSI onto the observed NPO index over North America with high spatial correlations of 0.81 and 0.84 with corresponding observations (Figures 8B,D). However, the predicted amplitudes of the regression coefficients of SAT and TSI are substantially weaker than the observations especially over the central North America. The underestimation of the regression amplitudes from the ensemble mean estimates is likely due to relatively lower signal-to-noise ratio (SNR) (larger ensemble spread) and relatively lower skill (ACC = 0.68) in predicting the NPO index in comparison with the high SNR ratio and high skill in predicting the NINO3.4 index (Figures 7A,B). Nevertheless, the large-scale co-location between the skill pattern of TSI and the significant regression coefficients of predicted TSI onto the observed NPO index (Figures 4, 8) indicates that NPO significantly contributes to the prediction skill of TSI over central North America.
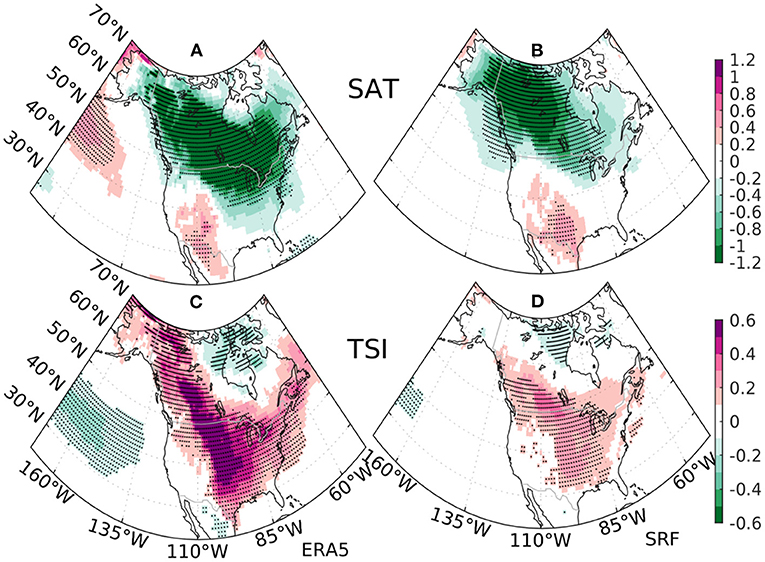
Figure 8. The regression pattern onto the observed normalized NPO index for the DJF surface air temperature (SAT) (units in K) during 1992–2022 from (A) ERA5 reanalysis and (B) the ensemble mean estimates of SPEAR's SRF. The same regression pattern for the DJF Temperature Swing Index (TSI) (units in K) from (C) ERA5 reanalysis and (D) the ensemble estimates of SPEAR's SRF. The stippling indicates regression coefficients significant at 5% level.
The monthly PNA index is highly correlated with regional temperature over the Southeastern and Northwestern parts of the United States during winter (Leathers et al., 1991), and the PNA index also exhibits strong interannual to decadal variability (Leathers and Palecki, 1992). Thus, the PNA teleconnection may drive the seasonal predictability of SAT and TSI over North America. The observed and simulated regression patterns onto the observed PNA index for DJF SAT agree well on a general dipole with significant warm anomalies over the Northwestern United States, Western Canada, and Alaska and significant cold anomalies across Northern Mexico, the Southcentral, and Southeastern United States (Figures 9A,B). Similar to the ENSO teleconnection patterns of TSI (Figures 5C,D), the observed and simulated PNA teleconnections of TSI display a similar V-shaped pattern over North America, and the maximum signal of the TSI pattern appears to locate in the middle of the SAT dipole pattern (Figure 9). The distinctive spatial layout of the SAT and TSI regression patterns associated with PNA is in good agreement with the synoptic temperature variance theory. The PNA index prediction skill (ACC = 0.7) is at a similar skill level as the NPO index (Figure 7). Note that the observed PNA index is strongly correlated with the NINO3.4 index (r = 0.63), therefore the PNA prediction skill may partly arise from the Eastern Tropical Pacific. Nevertheless, the high spatial similarity between the TSI skill pattern and the TSI regression pattern onto the observed PNA index (Figures 4, 9) indicates that PNA significantly contributes to the skillful TSI prediction over central North America, although it is strongly influenced by ENSO.
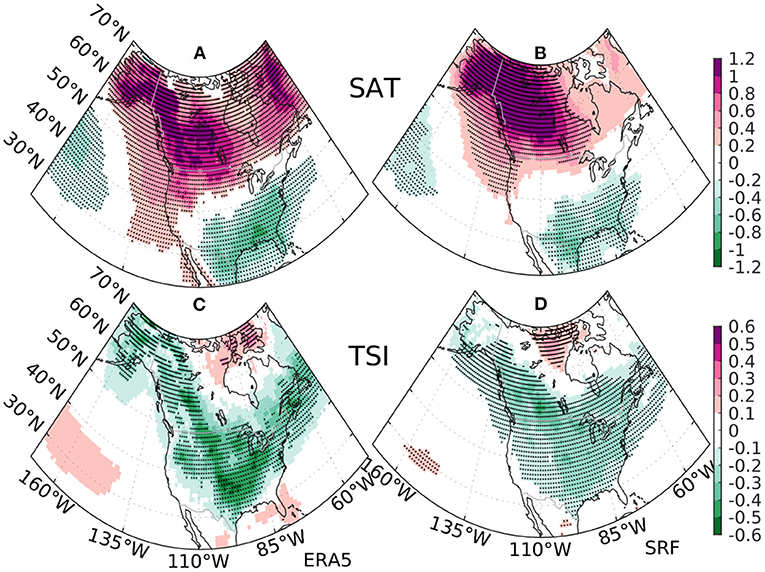
Figure 9. The regression pattern onto the observed normalized PNA index for the DJF surface air temperature (SAT) (units in K) during 1992–2022 from (A) ERA5 reanalysis and (B) the ensemble mean estimates of SPEAR's SRF. The same regression pattern for the DJF Temperature Swing Index (TSI) (units in K) from (C) ERA5 reanalysis and (D) the ensemble estimates of SPEAR's SRF. The stippling indicates regression coefficients significant at 5% level.
The extratropical storm track variability over the far Northeastern United States and Canada is strongly linked to the interannual variability of NAO during the boreal winter (Grise et al., 2013; Chartrand and Pausata, 2020), and therefore the seasonal predictability of TSI associated with NAO over North America may exist. The observed regression pattern of SAT onto the observed NAO index is characterized by a Southwest-Northeast dipole over North America, while the pattern of TSI appears to locate in the middle of the SAT dipole with a broad positive band extending from the central Canada toward the North Atlantic coast (Supplementary Figures 6A,C). The distinctive spatial layout of observed SAT and TSI patterns associated with NAO, similar to those of ENSO, NPO and PNA, is consistent with the synoptic temperature variance theory. The model fails at predicting the observed regression patterns of SAT and TSI associated with NAO over North America (Supplementary Figures 6B,D). This failure is very likely due to the low skill (ACC = 0.51) and large ensemble spread of predicting the observed NAO index (Supplementary Figure 7). However, the regression patterns of SAT and TSI onto the modeled NAO index bears a resemblance to observations (Supplementary Figure 8), suggesting that the NAO-related predictability of TSI could be potentially achieved if the NAO skill is improved. Possible approaches include increasing computational capability to increase the number of ensembles used in prediction and/or improving model physics for enhancing the SNR ratio of NAO (Scaife and Smith, 2018).
We next examine the impact of the historical radiative forcing on the seasonal prediction of TSI over the central United States, where the prediction skill of TSI is high with a maximum ACC over 0.7 (Figure 4). Time series of TSI anomalies averaged over the central United States from ERA5, SPEAR's HIST, and SRF, respectively, shown in Figure 10A, indicates that the historical radiative forcing has no significant contribution (ACC = −0.18) to the high skilful prediction of TSI (ACC = 0.75) from SRF. The SNR ratio, calculated as the ratio between the ensemble mean variance and the ensemble noise variance in SRF, is about 1.21 for TSI, indicating that the predictable signal is larger than the noise. The substantial skill improvement in SRF in comparison with HIST indicates that observation-based initialization for the coupled model is critical for achieving the skilful seasonal prediction of TSI over the central United States. Consistent with high loadings of the ENSO and NPO regression patterns of TSI over the central United States (Figures 5, 8), the observed TSI time series over the central United States shows strong links to ENSO, NPO, and PNA with significant correlation coefficients of −0.57, 0.70, and −0.65, respectively. In contrast, the predictive skill of SAT over the central United States is very low with a weak correlation of 0.36, because the time series of SAT is weakly correlated with NPO (ACC = −0.41) and no significant correlation with NINO3.4 and PNA (Figure 10B), and signals of the ENSO, NPO, and PNA regression patterns of SAT are remarkably weak over the central United States (Figures 5, 8, 9). Unlike the high SNR of TSI, the SAT over the central United States tends to be dominated by noise with a low SNR of 0.63 in the model. Therefore, the high skill of TSI with significant contribution from ENSO, NPO, and PNA provides additional predictable information over the central United States beyond the low skill of SAT.
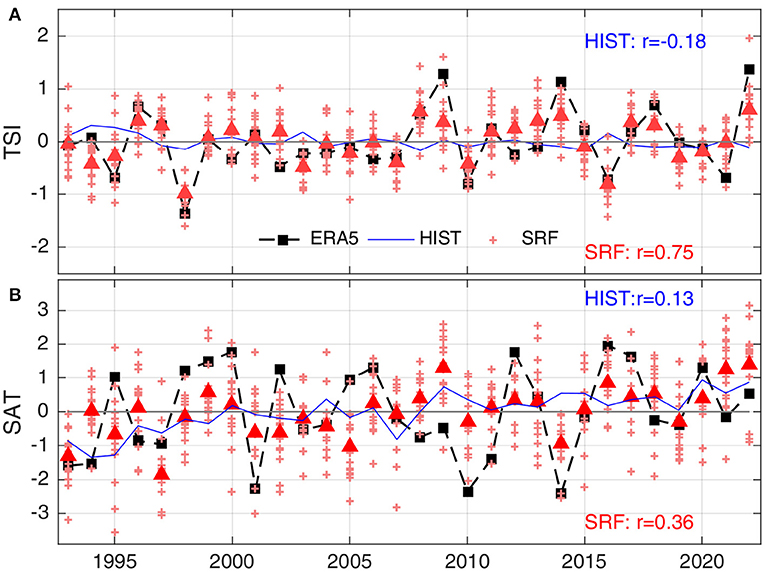
Figure 10. Time series of observations (black squares), ensemble mean estimates from SPEAR's historical simulations (HIST, blue) and SRF (red triangles) averaged over the central United States (marked as a black box in Figure 4) for December–February during 1992–2022 for (A) the Temperature Swing Index (TSI, units in K) and (B) mean surface air temperature (SAT, units in K).
To characterize the surface temperature swings associated with extratropical storm tracks, we have formulated a seasonal TSI, which is defined as the standard deviation of 24-h-difference-filtered data of the 6-hourly SAT. The formulation of TSI is similar in character to the extratropical surface storm track index but calculated for SAT instead of SLP. The physics governing the TSI variability is shown to be proportional to the product of eddy heat flux and the mean temperature gradient, which is the dominant advective term of driving synoptic temperature variations using a temperature variance budget analysis (Lutsko et al., 2019). The fundamental physics of TSI is consistent with the synoptic temperature variance theory in that synoptic temperature variance can be related to the mean temperature gradient and mixing length near the surface (Schneider et al., 2015). The theory of synoptic temperature variance controls indicates that the variability of TSI is related to the variability of SAT gradient but not SAT itself, so the predictable pattern of TSI is distinctive from that of SAT for a given large-scale climate predictability driver.
We have compared the spatial distributions of climatological and interannual variability of TSI in GFDL's SPEAR retrospective seasonal prediction and the ERA5 data and assessed the predictive skill of TSI and SAT over North America. The model shows substantial agreement with ERA5 of simulating climatological TSI with very high spatial correlations and captures the observed regional enhancement of TSI over North America. Over North America, the predictive skill of SAT is generally limited especially in the central USA. In contrast, the model exbibits moderate to high skill of predicting TSI in most of USA and the Western and Southern parts of Canada. Thus, the predictive skill pattern of TSI, as a second-order climate statistic, shows geographically distinct from those of the first-order statistic—the seasonal mean SAT. The combination of seasonal SAT and TSI skill has an additive effect for providing useful climate predictions for a variety of end users, since TSI is relevant to the winter weather extremes.
To further understand the geographical distinctions of the TSI and SAT skill, we have diagnosed the observed and predicted regression patterns of TSI and SAT onto the observed NINO3.4, NPO, PNA, and NAO indices, respectively. Remarkably, along with a very high correlation skill of predicting NINO3.4, both the observed dipole pattern of SAT and V-shaped pattern of TSI over North America regressed onto the observed NINO3.4 index are well-predicted by the model with high spatial correlations. SPEAR's SRF largely predicts the observed regression patterns of SAT and TSI onto the observed NPO index over North America with high spatial correlation. However, the predicted amplitudes of the regression coefficients of SAT and TSI are substantially weaker than the observations especially over the central North America, likely due to the relatively lower SNR ratio (larger ensemble spread) and relatively lower skill of predicting the NPO index in comparison with the high SNR ratio and high skill of predicting the NINO3.4 index. SPEAR's SRF also largely predicts the observed PNA teleconnection patterns of SAT and TSI over North America with high spatial correlation, although the PNA index is strongly influenced by ENSO on seasonal time scale. Consistent with the physics controlling the TSI variability, the regression coefficients of TSI onto NINO3.4, NPO, and PNA are generally in phase with those of the temperature gradient as well as the advection term but not with SAT, and thus the resultant skill patterns of TSI and SAT display their distinct geographical distributions.
We have examined the impact of the historical radiative forcing on the seasonal prediction of TSI over the central United States, where the prediction skill of TSI is locally high. The radiative forcing does not show significant contribution to the skilful prediction of seasonal TSI and SAT over the central United States. In sharp contrast with the low correlation skill (0.36) of SAT prediction, the correlation skill of TSI prediction reaches 0.75 with strong links to observed ENSO, NPO, and PNA variations. This regional skill analysis over the central United States further demonstrates the complementary effect of predictable information for considering both skills of TSI and SAT.
In particular, this study suggests that for La Niña or the positive phase of the NPO or the negative phase of the PNA, much of North America, especially in the central United States, generally experiences larger-than-normal temperature swings. That means we may expect more sudden extreme temperature swings during these winters. This study suggests that we can anticipate this elevated temperature volatility at least by the start of the winter season.
The co-existence of the skilful predictions for the seasonal SAT and TSI from the same predictability drivers (e.g., ENSO, NPO, and PNA) but with their own distinct geographical patterns, might arise from the extratropical eddy-mean flow interaction aspects that storm-track variations are symbiotically linked to the planetary-scale flow changes (Lau, 1988; Cai and Mak, 1990; Branstator, 1995). As a first attempt of diagnosing the combined predictability of the first order and second-order statistics for the SAT, this study highlights the importance of the eddy-mean flow interaction perspective for understanding the seasonal climate predictability in the extra tropics.
The focus of this study is to demonstrate the distinction of TSI skill from SAT and the process level understanding of the achieved skill, so we only examined the predictions of boreal winter season initialized on 1st December. The skill of the primary seasonal predictability drivers (e.g., ENSO) tends to decline with forecast lead times (Yang et al., 2015b; Lu et al., 2020; Jia et al., 2022), so the skill of predicting TSI drops with lead times consequently (Supplementary Figure 9). A detailed analysis of the skill evolution with lead time will be left for future research. We will also assess the forecast skill of TSI for the boreal autumn and spring seasons in the future.
The ERA5 data for this study is publicly available from the Copernicus Climate Change Service Climate Data Store (https://cds.climate.copernicus.eu). NOAA's OISST v2 data is publicly available from the NOAA/OAR/ESRL PSL, Boulder, Colorado, USA (https://psl.noaa.gov/data/gridded/data.noaa.oisst.v2.html). SPEAR's historical simulation data is publicly available at GFDL's ftp server (https://www.gfdl.noaa.gov/spear_large_ensembles/). SPEAR's seasonal retrospective forecasts data can be publicly accessed from the NMME website (https://www.cpc.ncep.noaa.gov/products/NMME/).
XY initialized the study, performed analysis, and wrote a first draft of the paper. FL, TD, NJ, LJ, CM, and XY contributed to the production of seasonal retrospective forecasts. All authors contributed to the final version of the article.
Financial support for this work was provided through base funding from the National Oceanic and Atmospheric Administration to the Geophysical Fluid Dynamics Laboratory.
The authors would like to thank Drs. Liping Zhang and Yongfei Zhang for their helpful comments on an earlier draft, and two reviewers for very constructive comments that helped to improve the manuscript.
Author LJ is employed by University Corporation for Atmospheric Research, Boulder, CO, United States and Author CM is employed by Science Applications International Corporation, Reston, VA, United States.
The remaining authors declare that the research was conducted in the absence of any commercial or financial relationships that could be construed as a potential conflict of interest.
The handling editor AK declared a shared affiliation with the authors.
All claims expressed in this article are solely those of the authors and do not necessarily represent those of their affiliated organizations, or those of the publisher, the editors and the reviewers. Any product that may be evaluated in this article, or claim that may be made by its manufacturer, is not guaranteed or endorsed by the publisher.
The Supplementary Material for this article can be found online at: https://www.frontiersin.org/articles/10.3389/fclim.2022.972119/full#supplementary-material
Adcroft, A., Anderson, W., Balaji, V., Blanton, C., Bushuk, M., Dufour, C. O., et al. (2019). The GFDL global ocean and sea ice model OM4.0: Model description and simulation features. J. Adv. Model. Earth Syst. 11, 3167–3211. doi: 10.1029/2019MS001726
Becker, E., Kirtman, B. P., and Pegion, K. (2020). Evolution of the North American multi-model ensemble. Geophys. Res. Lett. 47:e2020GL087408. doi: 10.1029/2020GL087408
Branstator, G. (1995). Organization of storm track anomalies by recurring low-frequency circulation anomalies. J. Atmos. Sci. 52, 207–226. doi: 10.1175/1520-0469(1995)052<0207:OOSTAB>2.0.CO;2
Bushuk, M., Winton, M., Haumann, F. A., Delworth, T., Lu, F., Zhang, Y., et al. (2021). Seasonal prediction and predictability of Regional Antarctic Sea ice. J. Clim. 34, 6207–6233. doi: 10.1175/JCLI-D-20-0965.1
Bushuk, M., Zhang, Y., Winton, M., Hurlin, B., Delworth, T., Lu, F., et al. (2022). Mechanisms of Regional Arctic Sea ice predictability in two dynamical seasonal forecast systems. J. Clim. 35, 4207–4231. doi: 10.1175/JCLI-D-21-0544.1
Cai, M., and Mak, M. (1990). Symbiotic relation between planetary and synoptic-scale waves. J. Atmos. Sci. 47, 2953–2968. doi: 10.1175/1520-0469(1990)047<2953:SRBPAS>2.0.CO;2
Chang, E. K.M. (2013). CMIP5 projection of significant reduction in extratropical cyclone activity over North America. J. Clim. 26, 9903–9922. doi: 10.1175/JCLI-D-13-00209.1
Chang, E. K.M., Lee, S., and Swanson, K. L. (2002). Storm track dynamics, J. Clim. 15, 2163–2183. doi: 10.1175/1520-0442(2002)015<02163:STD>2.0.CO;2
Chang, E. K. M., and Fu, Y. (2002). Interdecadal variations in Northern Hemisphere winter storm track intensity, J. Clim. 15, 642–658. doi: 10.1175/1520-0442(2002)015<0642:IVINHW>2.0.CO;2
Chartrand, J., and Pausata, F. S. R. (2020). Impacts of the North Atlantic Oscillation on winter precipitations and storm track variability in Southeast Canada and the Northeast United States. Weather Clim. Dynam. 1, 731–744. doi: 10.5194/wcd-1-731-2020
Delworth, T. L., Cooke, W. F., Adcroft, A., Bushuk, M., Chen, J.-H., Dunne, K. A., et al. (2020). SPEAR: the next generation GFDL modeling system for seasonal to multidecadal prediction and projection. J. Adv. Model. Earth Syst. 12:e2019MS001895. doi: 10.1029/2019MS001895
Feng, X., Huang, B., and Straus, D.M. (2019). Seasonal prediction skill and predictability of the Northern Hemisphere storm track variability in Project Minerva. Clim. Dyn. 52, 6427–6440. doi: 10.1007/s00382-018-4520-9
Furtado, J.C., Di Lorenzo, E., Anderson, B.T., and Schneider, N. (2012). Linkages between the North Pacific Oscillation and central tropical Pacific SSTs at low frequencies. Clim. Dyn. 39, 2833–2846. doi: 10.1007/s00382-011-1245-4
Grise, K. M., Son, S., and Gyakum, J. R. (2013). Intraseasonal and interannual variability in North American storm tracks and its relationship to equatorial pacific variability. Month. Weather Rev. 141, 3610–3625. doi: 10.1175/MWR-D-12-00322.1
Guo, Y., Barnett, A. G., Yu, W., Pan, X., Ye, X., et al. (2011). A large change in temperature between neighbouring days increases the risk of mortality. PLoS ONE 6:e16511. doi: 10.1371/journal.pone.0016511
Held, I. M., Guo, H., Adcroft, A., Dunne, J. P., Horowitz, L. W., Krasting, J., et al. (2019). Structure and performance of GFDL's CM4.0 climate model. J. Adv. Model. Earth Syst. 11, 3691–3727. doi: 10.1029/2019MS001829
Held, I. M., Lyons, S. W., and Nigam, S. (1989). Transients and the extratropical response to El Niño. J. Atmos. Sci. 46, 163–174. doi: 10.1175/1520-0469(1989)046<0163:TATERT>2.0.CO;2
Hersbach, H., Bell, B., Berrisford, P., Hirahara, S., Horányi, A., Muñoz-Sabater, J., et al. (2020). The ERA5 global reanalysis. Q. J. R. Meteorol. Soc. 146, 1999–2049. doi: 10.1002/qj.3803
Hurrell, J. W., and Deser, C. (2009). North Atlantic climate variability: the role of the North Atlantic oscillation. J. Mar. Syst. 78, 28–41. doi: 10.1016/j.jmarsys.2008.11.026
Jahn, M. (2015). Economics of extreme weather events: terminology and regional impact models. Weather Clim. Extremes 10, 29–39. doi: 10.1016/j.wace.2015.08.005
Jia, L., Delworth, T. L., Kapnick, S., Yang, X., Johnson, N. C., Cooke, W., et al. (2022). Skillful seasonal prediction of North American summertime heat extremes, J. Clim. 35, 4331–4345. doi: 10.1175/JCLI-D-21-0364.1
Joh, Y., Delworth, T. L., Wittenberg, A. T., Cooke, W. F., Yang, X., Zeng, F., et al. (2022). Seasonal-to-decadal variability and prediction of the kuroshio extension in the gfdl coupled ensemble reanalysis and forecasting system. J. Clim. 35, 3515–3535. doi: 10.1175/JCLI-D-21-0471.1
Kirtman, B. P., Min, D., Infanti, J. M., Kinter, J. L. III., Paolino, D. A., Zhang, Q., et al. (2014). The North American Multimodel Ensemble: phase-1 seasonal-to-interannual prediction; phase-2 toward developing intraseasonal prediction. Bull. Am. Meteorol. Soc. 95, 585–601. doi: 10.1175/BAMS-D-12-00050.1
Kriegler, E., Bauer, N., Popp, A., Humpenöder, F., Leimbach, M., Strefler, J., et al. (2017). Fossil-fueled development (SSP5): an energy and resource intensive scenario for the 21st century. Glob. Environ. Change 42, 297–315. doi: 10.1016/j.gloenvcha.2016.05.015
Kushner, P. J., and Held, I. M. (1998). A test, using atmospheric data, of a method for estimating oceanic eddy diffusivity. Geophys. Res. Lett. 25, 4213–4216, doi: 10.1029/1998GL900142
Lau, N. (1988). Variability of the observed midlatitude storm tracks in relation to low-frequency changes in the circulation pattern. J. Atmos. Sci. 45, 2718–2743. doi: 10.1175/1520-0469(1988)045<2718:VOTOMS>2.0.CO;2
Leathers, D. J., and Palecki, M. A. (1992). The Pacific/North American teleconnection pattern and United States climate. Part II: temporal characteristics and index specification. J. Clim. 5, 707–716. doi: 10.1175/1520-0442(1992)005<0707:TPATPA>2.0.CO;2
Leathers, D. J., Yarnal, B., and Palecki, M. A. (1991). The Pacific/North American teleconnection pattern and United States Climate. Part I: regional temperature and precipitation associations. J. Clim. 4, 517–528. doi: 10.1175/1520-0442(1991)004<0517:TPATPA>2.0.CO;2
Linkin, M. E., and Nigam, S. (2008). The North Pacific Oscillation–West Pacific teleconnection pattern: mature-phase structure and winter impacts. J. Clim. 21, 1979–1997. doi: 10.1175/2007JCLI2048.1
Liu, Q., Tan, Z.-M., Sun, J., Hou, Y., Fu, C., and Wu, Z. (2020). Changing rapid weather variability increases influenza epidemic risk in a warming climate. Environ. Res. Lett. 15:044004. doi: 10.1088/1748-9326/ab70bc
Lu, F., Harrison, M. J., Rosati, A., Delworth, T. L., Yang, X., Cooke, W. F., et al. (2020). GFDL's SPEAR seasonal prediction system: initialization and ocean tendency adjustment (OTA) for coupled model predictions. J. Adv. Model. Earth Syst. 12:e2020MS002149. doi: 10.1029/2020MS002149
Lutsko, N. J., Baldwin, J. W., and Cronin, T. W. (2019). The impact of large-scale orography on Northern Hemisphere winter synoptic temperature variability. J. Clim. 32, 5799–5814. doi: 10.1175/JCLI-D-19-0129.1
Reynolds, R. W., Rayner, N. A., Smith, T. M., Stokes, D. C., and Wang, W. (2002). An improved in situ and satellite SST analysis for climate. J. Clim. 15, 1609–1625. doi: 10.1175/1520-0442(2002)015<1609:AIISAS>2.0.CO;2
Reynolds, R. W., Smith, T. M., Liu, C., Chelton, D. B., Casey, K. S., and Schlax, M. G. (2007). Daily high-resolution-blended analyses for sea surface temperature. J. Clim. 20, 5473–5496 doi: 10.1175/2007JCLI1824.1
Riahi, K., van Vuuren, D. P., Kriegler, E., Edmonds, J., O'Neill, B. C., Fujimori, S., et al. (2017). The shared socioeconomic pathways and their energy, land use, and greenhouse gas emissions implications: an overview. Glob. Environ. Change 42, 153–168. doi: 10.1016/j.gloenvcha.2016.05.009
Saha, S., Moorthi, S., Wu, X., Wang, J., Nadiga, S., Tripp, P., et al. (2014). The NCEP climate forecast system version 2. J. Clim. 27, 2185–2208. doi: 10.1175/JCLI-D-12-00823.1
Scaife, A.A., and Smith, D. (2018). A signal-to-noise paradox in climate science. NPJ Clim. Atmos. Sci. 1:28. doi: 10.1038/s41612-018-0038-4
Schneider, T., Bischoff, T., and Płotka, H. (2015). Physics of changes in synoptic midlatitude temperature variability. J. Clim. 28, 2312–2331. doi: 10.1175/JCLI-D-14-00632.1
Screen, J. (2014). Arctic amplification decreases temperature variance in northern mid- to high-latitudes. Nat. Clim. Change 4, 577–582. doi: 10.1038/nclimate2268
Screen, J. A., Deser, C., and Sun, L. (2015). Reduced risk of North American cold extremes due to continued arctic sea ice loss. Bull. Amer. Meteorol. Soc. 96, 1489–1503. doi: 10.1175/BAMS-D-14-00185.1
Shi, L., Kloog, I., Zanobetti, A., Liu, P., and Schwartz, J. D. (2015). Impacts of temperature and its variability on mortality in New England. Nat. Clim. Change 5, 988–991. doi: 10.1038/nclimate2704
Sun, C., Thresher, A., Keeley, R., Hall, N., Hamilton, M., Chinn, P., et al. (2010). “The data management system for the global temperature and salinity profile programme,” in Proceedings of OceanObs'09: Sustained Ocean Observations and Information for Society (Venice: European Space Agency), 931–938.
Trenary, L., DelSole, T., Doty, B., and Tippett, M. K. (2015). Was the cold Eastern US winter of 2014 due to increased variability? Bull. Amer. Meteorol. Soc. 96, S15–S19. doi: 10.1175/BAMS-D-15-00138.1
Trenberth, K. E. (1991). Storm tracks in the southern hemisphere. J. Atmos. Sci. 48, 2159–2178. doi: 10.1175/1520-0469(1991)048<2159:STITSH>2.0.CO;2
Tseng, K.-C., Johnson, N. C., Kapnick, S. B., Delworth, T. L., Lu, F., Cooke, W., et al. (2021). Are multiseasonal forecasts of atmospheric rivers possible? Geophys. Res. Lett. 48:e2021GL094000. doi: 10.1029/2021GL094000
van der Wiel, K., Kapnick, S. B., and Vecchi, G. A. (2017). Shifting patterns of mild weather in response to projected radiative forcing. Clim. Change 140, 649–658. doi: 10.1007/s10584-016-1885-9
van Oldenborgh, G. J., Haarsma, R., de Vries, H., and Allen, M. R. (2014). Cold extremes in North America vs. mild weather in Europe: the winter 2013/2014 in the context of a warming world. Bull. Amer. Meteor. Soc. 96, 707–714. doi: 10.1175/BAMS-D-14-00036.1
Wallace, J., Lim, G., and Blackmon, M. (1988). Relationship between cyclone tracks, anticyclone tracks and baroclinic waveguides. J. Atmos. Sci. 45, 439–462. doi: 10.1175/1520-0469(1988)045<0439:RBCTAT>2.0.CO;2
Wilson, C., and Williams, R. G. (2006). When are eddy tracer fluxes directed downgradient? J. Phys. Oceanogr. 36, 189–202. doi: 10.1175/JPO2841.1
Wong, A. P. S., Wijffels, S. E., Riser, S. C., Pouliquen, S., Hosoda, S., Roemmich, D., et al. (2020). Argo data 1999–2019: two million temperature-salinity profiles and subsurface velocity observations from a global array of profiling floats. Front. Mar. Sci. 7:700. doi: 10.3389/fmars.2020.00700
Xiang, B., Harris, L., Delworth, T. L., Wang, B., Chen, G., Chen, J., et al. (2022). S2S prediction in GFDL SPEAR: MJO diversity and teleconnections. Bull. Am. Meteorol. Soc. 103, E463–E484. doi: 10.1175/BAMS-D-21-0124.1
Yang, X., Delworth, T. L., Zeng, F., Zhang, L., Cooke, W. F., Harrison, M. J., et al. (2021). On the development of GFDL's decadal prediction system: initialization approaches and retrospective forecast assessment. J. Adv. Model. Earth Syst. 13:e2021MS002529. doi: 10.1029/2021MS002529
Yang, X., Jia, L., Kapnick, S., Delworth, T. L., Vecchi, G. A., Gudgel, R. G., et al. (2018). On the seasonal prediction of the western United States El Niño precipitation during the 2015/16 winter. Clim. Dyn. 51, 3765–3783. doi: 10.1007/s00382-018-4109-3
Yang, X., Vecchi, G. A., Delworth, T. L., Paffendorf, K., Gudgel, R. G., Jia, L., et al. (2015a). Extreme North America winter storm season of 2013/14: roles of radiative forcing and the global warming hiatus. Bull. Am. Meteorol. Soc. 96, S25–S28. doi: 10.1175/BAMS-D-15-00133.1
Yang, X., Vecchi, G. A., Gudgel, R. G., Delworth, T. L., Zhang, S., Rosati, A., et al. (2015b). Seasonal predictability of extratropical storm tracks in GFDL's high-resolution climate prediction model. J. Clim. 28, 3592–3611. doi: 10.1175/JCLI-D-14-00517.1
Yu, B., and Zhang, X. (2015), A physical analysis of the severe 2013/2014 cold winter in North America. J. Geophys. Res. Atmos. 120,149–165. doi: 10.1002/2015JD023116
Zhang, G., Murakami, H., Cooke, W. F., Wang, Z., Jia, L., Lu, F., et al. (2021). Seasonal predictability of baroclinic wave activity. NPJ Clim. Atmos. Sci. 4:50. doi: 10.1038/s41612-021-00209-3
Zhao, M., Golaz, J. -C., Held, I. M., Guo, H., Balaji, V., Benson, R., et al. (2018a). The GFDL global atmosphere and land model AM4.0/LM4.0: 1. Simulation characteristics with prescribed SSTs. J. Adv. Model. Earth Syst. 10, 691–734. doi: 10.1002/2017MS001208
Zhao, M., Golaz, J. -C., Held, I. M., Guo, H., Balaji, V., Benson, R., et al. (2018b). The GFDL global atmosphere and land model AM4.0/LM4.0: 2. Model description, sensitivity studies, and tuning strategies. J. Adv. Model. Earth Syst. 10, 735–769. doi: 10.1002/2017MS001209
Zheng, C., Chang, E. K.-M., Kim, H., Zhang, M., and Wang, W. (2019). Subseasonal to seasonal prediction of wintertime northern hemisphere extratropical cyclone activity by S2S and NMME models. J. Geophys. Res. Atmos. 124, 12057–12077. doi: 10.1029/2019JD031252
Keywords: Temperature Swing Index, seasonal prediction, extratropical storm tracks, ENSO, climate extremes
Citation: Yang X, Delworth TL, Jia L, Johnson NC, Lu F and McHugh C (2022) On the seasonal prediction and predictability of winter surface Temperature Swing Index over North America. Front. Clim. 4:972119. doi: 10.3389/fclim.2022.972119
Received: 17 June 2022; Accepted: 17 August 2022;
Published: 14 September 2022.
Edited by:
Arun Kumar, National Oceanic and Atmospheric Administration (NOAA), United StatesReviewed by:
Kevin Grise, University of Virginia, United StatesCopyright © 2022 Yang, Delworth, Jia, Johnson, Lu and McHugh. This is an open-access article distributed under the terms of the Creative Commons Attribution License (CC BY). The use, distribution or reproduction in other forums is permitted, provided the original author(s) and the copyright owner(s) are credited and that the original publication in this journal is cited, in accordance with accepted academic practice. No use, distribution or reproduction is permitted which does not comply with these terms.
*Correspondence: Xiaosong Yang, WGlhb3NvbmcuWWFuZ0Bub2FhLmdvdg==
Disclaimer: All claims expressed in this article are solely those of the authors and do not necessarily represent those of their affiliated organizations, or those of the publisher, the editors and the reviewers. Any product that may be evaluated in this article or claim that may be made by its manufacturer is not guaranteed or endorsed by the publisher.
Research integrity at Frontiers
Learn more about the work of our research integrity team to safeguard the quality of each article we publish.