
94% of researchers rate our articles as excellent or good
Learn more about the work of our research integrity team to safeguard the quality of each article we publish.
Find out more
ORIGINAL RESEARCH article
Front. Clim., 30 August 2022
Sec. Carbon Dioxide Removal
Volume 4 - 2022 | https://doi.org/10.3389/fclim.2022.959229
This article is part of the Research TopicEnhanced Weathering and Synergistic Combinations with Other CDR MethodsView all 12 articles
 Christina S. Larkin1*
 M. Grace Andrews1
 Christopher R. Pearce2
 Kok L. Yeong3
 David J. Beerling3Joshua Bellamy1
 Suzan Benedick4
 Robert P. Freckleton3Heather Goring-Harford1Satyam Sadekar1
 Rachael H. James1
Modeling studies show that large-scale deployment of enhanced rock weathering on croplands has the potential to reduce levels of atmospheric carbon dioxide by the end of the century. There is, however, a pressing need to verify model predictions through long-term field trials. Here we report results from the first 3 years of an ongoing enhanced weathering field trial, carried out on an oil palm plantation in Sabah, Malaysia. Crushed silicate rock was applied to three hydrologically isolated catchments, and three adjacent (paired) reference catchments were left untreated. The drawdown of atmospheric CO2 was quantified via the export of alkalinity in stream waters and changes in soil carbonate content. The amended and reference catchments were found to have a similar extent of CO2 drawdown via alkalinity export [respectively, 3.8 ± 0.8 (1 SD) and 3.7 ± 0.6 (1 SD) tCO2 ha−1] when all catchments were averaged over the study period (October 2018 to July 2021). However, differences were observed between the different catchment pairs (plots): two of the plots displayed a similar extent of CO2 removal for both the amended and reference catchments, but the third amended catchment had a higher extent of CO2 removal of ~1 tCO2 ha−1 relative to its adjacent reference catchment. The difference in CO2 removal rates determined for this plot can likely be attributed to increased weathering of silicate minerals in the amended catchment. Soil carbonate concentrations were on average < 0.2 wt% CaCO3, but we report a small increase of ~0.03 wt% CaCO3 in the top 30 cm of soil in the amended soils relative to the reference catchments. The magnitude of CO2 drawdown via alkalinity export determined for these agricultural catchments is around an order of magnitude higher than in natural forested catchments in Sabah and similar to that of basaltic catchments. We show that these high weathering rates are primarily driven by weathering of carbonate fertilizers. The data presented from this field trial provide vital contextual information on the real-world efficacy and practicalities associated with the implementation of enhanced weathering for atmospheric CO2 removal that will help to inform further trials as well as wider-scale deployment.
To keep current global warming below dangerous levels (<2°C above pre-industrial), it is widely accepted that in addition to significant emissions reductions, carbon dioxide (CO2) will need to be actively removed from the atmosphere (UN Environment Programme, 2017; Royal Society, 2018). This is because between about 4 and 8% of global CO2 emissions are “hard to avoid,” either because some industries are difficult to decarbonize (such as agriculture), or because of the need to uphold principles of justice including the protection of human rights (UN Environment Programme, 2017; Royal Society, 2018; IPCC, 2022).
Carbon dioxide can be removed from the atmosphere in several ways. These include nature-based methods such as afforestation and restoration of coastal habitats including mangroves and sea grass beds, as well as technological methods such as direct air capture (e.g., IPCC, 2022). Enhancing rates of rock weathering, which naturally removes about 1 Gt of CO2 from the atmosphere every year and plays a key role in the long-term (>105 yrs) regulation of Earth's climate (e.g., Walker et al., 1981), is another proposed CO2 removal strategy (e.g., Hartmann et al., 2013). Modeling studies have shown that the application of crushed calcium (Ca)- and magnesium (Mg)-rich silicate rocks to agricultural soils has the potential to increase weathering rates and draw down 0.5–2 Gt of CO2 per year, equivalent to ~2.5% to 10% of Paris Agreement targets (Beerling et al., 2020). The quantity of additional CO2 removed depends on factors such as application rate, climatic conditions, mineralogy and grain size (Schuiling and Krijgsman, 2006; Renforth, 2012; Hartmann et al., 2013; Taylor et al., 2016; Andrews and Taylor, 2019).
Weathering is a natural geological process whereby atmospheric CO2 dissolved in rainwater or respired by plants reacts with rocks and soils, partly dissolving them (Equation 1 and Equation 2). During the weathering process, CO2 is converted to alkalinity (principally hydrogen carbonate ions) that is transported via soil waters, groundwaters and rivers to the ocean, where it may be securely stored on timescales of ~105 years (e.g., Drever, 1997).
Equation 1 shows that weathering of one mole of a silicate mineral (anorthite) removes two moles of atmospheric CO2 whereas weathering of one mole of carbonate minerals removes only one mole of atmospheric CO2 (Equation 2). However, although silicate weathering is twice as effective at removing CO2 from the atmosphere compared to carbonate weathering, dissolution rates of carbonates are three orders of magnitude faster than those of fastest weathering silicate minerals (e.g., Lasaga, 1984; Hartmann et al., 2013). In arid to semi-arid regions were soils are alkaline carbonate minerals may precipitate from soil waters (Equation 3) forming pedogenic carbonate that is stable on timescales of ~104 years (e.g., Zamanian et al., 2016 and references therein). Note that precipitation of carbonates re-releases half of the CO2 captured by silicate minerals back into the atmosphere, and dissolution and re-precipitation of carbonate minerals has no net impact on levels of atmospheric CO2 (i.e., Equation 3 is the reverse of Equation 2).
Rates of rock weathering are limited by the reactivity of the minerals that make up the rock. For example, olivine and basaltic glass have fast dissolution rates (e.g., Oelkers and Gislason, 2001; Oelkers et al., 2018), whereas quartz is unreactive and has no CO2 removal potential (e.g., Kump et al., 2000). Weathering rates also vary as a function of particle size, with mineral crushing or high erosion rates potentially leading to greater chemical dissolution rates (Riebe et al., 2004). In addition to the availability of weatherable minerals, weathering rates are also controlled by environmental factors (kinetics), such as temperature and water availability, and the saturation state of the soil waters (West et al., 2005; Gabet and Mudd, 2009; Maher and Chamberlain, 2014). Lowland tropical regions are considered to have the fastest potential weathering rates on Earth due to high temperatures and high rainfall, but weathering can be limited by supply of fresh minerals (Stallard and Edmond, 1983) as thick heavily weathered soils develop quickly (e.g., laterites). For this reason, tropical regions are considered prime candidates for the deployment of enhanced weathering (Taylor et al., 2016; Edwards et al., 2017; Manning et al., 2017; Beerling et al., 2018, 2020).
To date, the potential of enhanced weathering for removing atmospheric CO2 has principally been estimated using modeling studies (e.g., Renforth, 2012; Taylor et al., 2016; Beerling et al., 2020; Bullock et al., 2021), or based on results from small-scale mesocosm or laboratory experiments (e.g., Renforth et al., 2015; Amann et al., 2020; Kelland et al., 2020; Pogge von Strandmann et al., 2021). Most mesocosm and laboratory studies to date have focused on amending soils with relatively fast weathering silicate minerals, notably olivine, or fast weathering silicate rocks, such as dunite that contains a high proportion of olivine. While experiments on organic-rich acidic soils incubated with olivine revealed that gross removal of CO2 assessed from the increase in Mg2+ concentrations on soil exchangeable sites was between ~12 to 16 tCO2 ha−1yr−1 (depending on the olivine application rate), no net increase in CO2 removal was observed due to increased rates of soil respiration (Dietzen et al., 2018). Similarly, application of olivine to ryegrass in a pot experiment was observed to increase gross CO2 uptake by ~0.5–4.4 tCO2 ha−1yr−1 (Berge et al., 2012), although amendment of agricultural soils (with and without crops) with olivine-bearing dunite showed significantly lower rates of CO2 removal (0.02–0.05 tCO2 ha−1 yr−1; Amann et al., 2020). Finally, pot experiments focusing on soil amendment with wollastonite (a fast-weathering silicate mineral) reported substantial increases (of up to ~0.6 wt%) in the total inorganic carbon content of wollastonite-amended soil relative to untreated soil over a period of 8 weeks (Haque et al., 2019). Assuming a till depth of 30 cm and sustained inorganic carbon accumulation rates, this could correspond to a removal rate of up to ~500 tCO2 ha−1 yr−1.
At larger scales, only a handful of field trial studies have been carried out on the CO2 removal potential of enhanced rock weathering (Haque et al., 2020; Taylor et al., 2021). In October 1999, in an effort to restore soil calcium that had been depleted by leaching by acid rain, 3.44 t ha−1 of wollastonite was applied to the Hubbard Brook Experimental Forest watershed in New Hampshire, USA. A recent re-analysis of stream water chemistry has revealed that cumulative carbon capture by carbonic acid weathering increased by 0.025–0.13 tCO2 ha−1 over 15 years compared to a reference catchment (Taylor et al., 2021). A study of wollastonite-amended croplands in Ontario, Canada, has reported increased levels of CO2 removal as soil inorganic carbon by up to 0.4 tCO2 ha−1 over 5 months in a field planted with soybean; much higher rates of CO2 removal as soil inorganic carbon were observed in fields planted with leafy vegetables (up to ~1.9 tCO2 ha−1 in 1 year) although this may partly be due to addition of carbonate fertilizers (Haque et al., 2020). Notwithstanding the differences in the results between these field studies, models and laboratory experiments are unlikely to adequately represent the natural system and laboratory experiments in particular have been shown to overestimate field weathering rates (e.g., White and Brantley, 2003). Therefore, it is imperative to conduct large-scale, multi-year field trials to determine the real-world efficacy and safety of enhanced rock weathering, as well as the practicalities associated with its deployment.
This study presents the first quantification of the rate of CO2 drawdown via alkalinity generation as well as soil carbonate formation from an ongoing enhanced rock weathering field trial being conducted on an oil palm plantation in Sabah, Malaysia. As far as we are aware, this is the first field trial of its kind in a tropical region. We set out a methodology for accurately quantifying CO2 removal via alkalinity generation that attributes (i) the weathering source (silicate vs. carbonate minerals) and (ii) the weathering agent (carbonic acid vs. strong acids that do not contribute to carbon dioxide removal) and discuss the challenges with quantifying carbon dioxide removal via soil carbonate formation in low pH tropical soils. The results from this ongoing field trial provide vital contextual information for the application of enhanced weathering in tropical environments.
Here we provide a general overview of the experiment and study site, with further analytical details given under Materials and Methods and in Supplementary Text 1. Our study site is located on an oil palm plantation in Sabah, Malaysia (Figure 1) and is characterized by a tropical climate with an annual rainfall of ~2,000 mm and a mean annual temperature of ~28°C (monitored by the onsite weather station, Supplementary Text 1, Figure 2). The plantation sits on heavily weathered tropical soils that are underlain by Oligocene to mid Miocene volcaniclastic deposits and Quaternary river alluvium (Lim, 1985). The oil palms are planted in terraces as the site has significant topography (Figure 1, ~100 to 400 m elevation range).
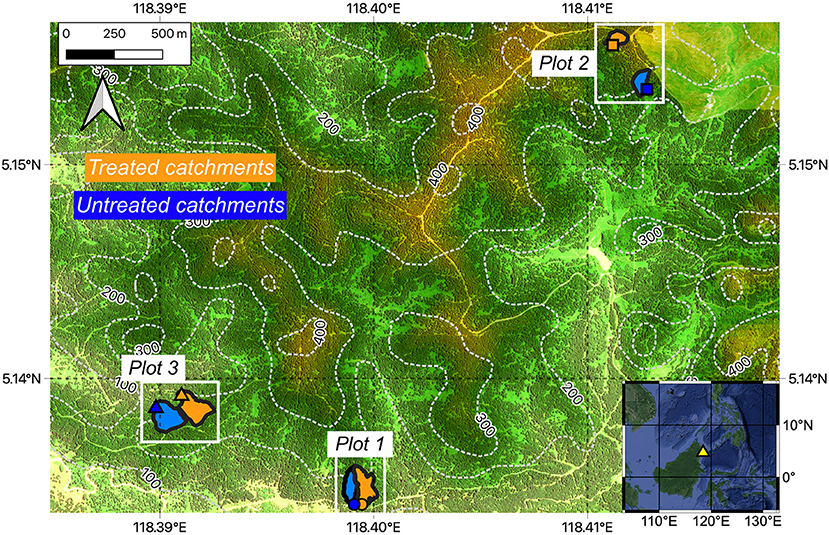
Figure 1. Map of the study site in Sabah, Malaysia. The three experimental plots are indicated by the white rectangles, with each plot consisting of (1) an untreated (reference) catchment and (2) a catchment amended with crushed silicate rock (treated). The two catchments within each plot are hydrologically isolated from each other. Stream sampling locations at the base of each catchment are indicated by the symbols (circles: plot 1, squares: plot 2, triangles: plot 3). Elevation is superimposed on a Google Map Satellite basemap, with dashed white contours and numbers indicating elevation (in meters). Yellow triangle in map insert (Google Satellite basemap) indicates the location of study area within Sabah Malaysia.
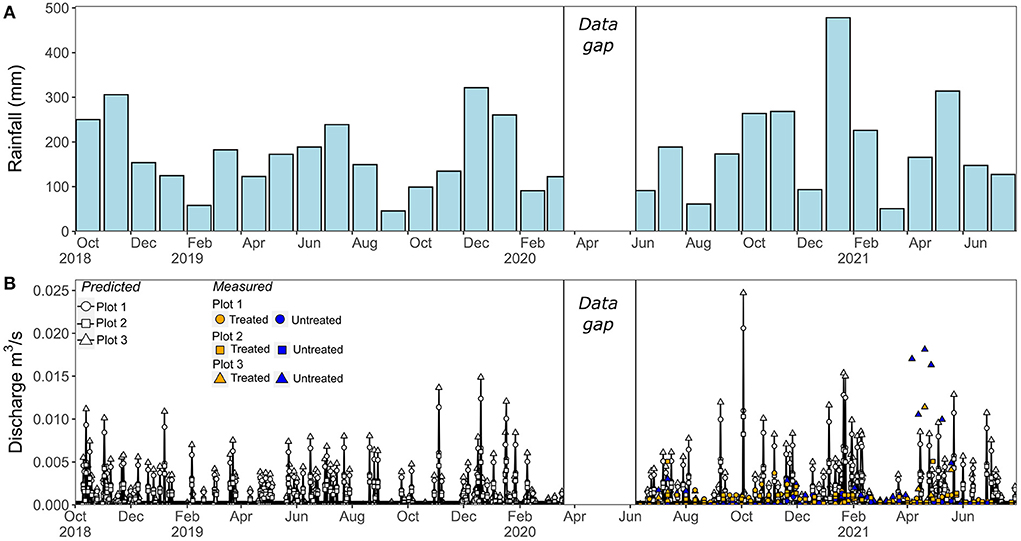
Figure 2. Rainfall and measured vs predicted discharge in stream catchments throughout the monitoring period (October 2018 to July 2021). (A) Total monthly rainfall in mm. (B) Predicted instantaneous daily discharge in m3/s (black lines, and white symbols). Measured discharge (from June 2020 onwards) is also show for comparison (colored symbols). The white box indicates a data gap during the COVID-19 lockdown of 2020.
Three plots were selected within the plantation. Each of the three plots consists of a pair of hydrologically isolated catchments that drain into a small stream and range in size from 0.6 to 1.8 ha (Figure 1). Prior to the start of the experiment, the existing mature (20–25 year old) oil palms were felled and the plots were re-planted with young (~2–3 years old) oil palms in 2017. A cover crop was also planted to stabilize and minimize soil loss. One catchment from each plot was applied with 50 tons per hectare (t ha−1) of crushed silicate rock after planting, and the other catchment was left untreated to act as a reference catchment (Figure 1). Application of crushed rock to the treated catchments was repeated every year throughout the course of the experiment, usually between August and December (Supplementary Text 1.1). The crushed rock was applied in the same way as fertilizers, that is, by hand to the base of the oil palms as well as in between the palms. Hereafter, the silicate rock-amended catchments are referred to as “treated” catchments and the reference catchments are referred to as “untreated” catchments. Note, however, that as there were pre-existing differences in stream water chemistry prior to rock application (see results, Figure 3), and the sizes of treated and untreated catchments were different (Figure 1, Supplementary Table 4), the untreated catchment stream water data cannot strictly be considered as a “control,” so all stream water data were processed separately for each individual catchment.
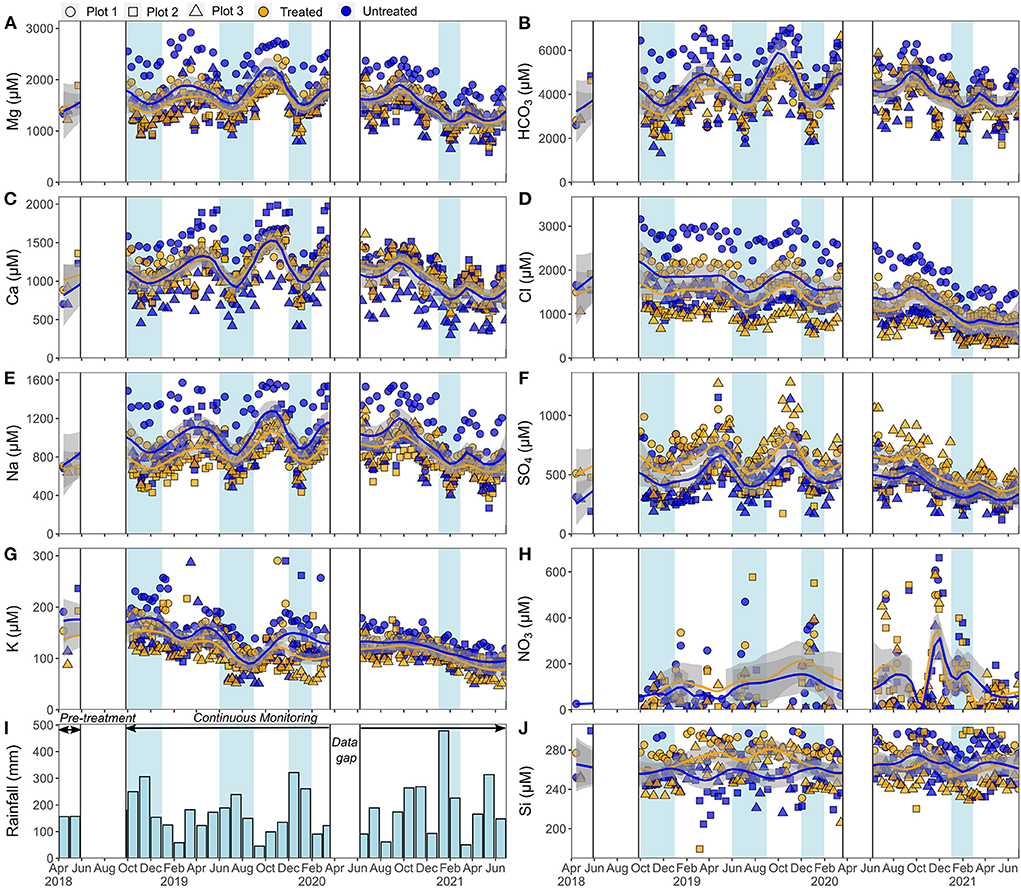
Figure 3. Stream water chemistry. Major cation concentrations are shown on the left-hand side (A,C,E,G) and major anion and silicon concentrations on the right-hand side (B,D,F,H,J). Smoothed fit (lines and gray bands) through data is a Loess regression, which averages the treated and untreated datasets for all three catchments. The gray band is the 95% confidence interval on this fit. Rainfall (I) is the monthly sum, in mm. Light blue shading indicate times of higher rainfall that correlate with a decrease in some major elemental concentrations. White boxes indicate data gaps prior to rock application and during the COVID-19 lockdown.
To assess the effects of rock treatment on stream water chemistry, samples of stream water were taken from each site prior to the first application of the rock in April/May 2018, with continuous monitoring and sampling starting in October 2018. However, due to COVID-19 pandemic prevention measures, sampling was suspended between March and June 2020. Soil cores were taken to assess changes in soil chemistry between April and May 2018 prior to the first application of the crushed rock, and thereafter twice a year (Supplementary Text 1.5). The experiment is ongoing, but here we report data from the first 3 years of the experiment, up until July 2021.
In this section, we firstly summarize our approach to the quantification of CO2 removal and then secondly, we provide specific details relating to our analytical protocols. We calculate CO2 removal as alkalinity (Equations 1 and 2) directly, via (i) measurement of elements and compounds dissolved in the stream waters and (ii) measurement of the water flux (discharge) from each catchment. This approach ensures that we capture net CO2 removal from waters that exit the weathering zone to drainage, although we do not consider any modification to the alkalinity flux during riverine transport to the ocean. While it is possible to determine weathering rates from the loss of soluble cations from the soils (e.g., Riebe et al., 2004), this is usually applied in studies aiming to characterize long-term weathering rates because soils have very high concentrations of e.g., Ca and Mg (wt% levels) relative to soil waters, making cation loss difficult to detect. Furthermore, the fate of weathering products cannot be assessed with this method. If, for example, the products of weathering are taken up by biomass or adsorbed on soil cation exchange sites, then CO2 will be regenerated on short timescales.
In addition to characterizing water chemistry and discharge, it is also essential to determine the proportion of alkalinity derived from silicate vs. carbonate minerals, because whereas all alkalinity (HCO) generated by weathering of silicate minerals comes from CO2 (Equation 1), only half of the alkalinity derived from weathering of carbonate minerals comes from CO2 (the other half coming from carbonate; Equation 2). Characterization of the chemical composition of all soil mineral phases enables the relative proportion of silicate vs. carbonate weathering to be determined via measurement of cation concentrations and the radiogenic strontium isotopic composition (87Sr/86Sr) of stream waters, corrected for inputs from rainwater and water-soluble fertilizers (Section Quantification of CO2 drawdown via pedogenic carbonate formation). The alkalinity derived from weathering reactions can be calculated from cation concentrations, as the HCO produced is charge balanced by base cations (Equations 1 and 2).
Calculation of CO2 removal via pedogenic carbonate (inorganic carbon, predominately calcium carbonate) formation can be determined from the difference in the carbonate concentration of soils prior to the start of the experiment and those collected after application of crushed rock, although any contribution from weathering and re-precipitation of carbonate-based fertilizers (or carbonate in the applied crushed rock) needs to be subtracted because CO2 removed during the weathering process will be re-released when the carbonate re-precipitates (Equations 2 and 3).
Stream water discharge can either be measured directly or derived from measurements of rainfall and estimated rates of evapotranspiration. Rainfall and other climate parameters (humidity, temperature, windspeed and solar radiation) were monitored at the plantation (Figure 2, Supplementary Text 1.2), allowing the predicted discharge from each catchment to be calculated daily from the difference between rainfall and potential evapotranspiration (see Supplementary Text 1.2 for full details). This approach was validated by comparing predicted discharge with discharge measured bi-weekly in the streams from June 2020 onwards. Direct instantaneous measurements were obtained from readings of water depth within a Cutthroat Flume (OpenChannelFlow, 36 × 16-inch) that was installed at the water sampling points (symbols in Figure 1) at the lowest topographic point of each catchment. Measured discharge was in reasonable agreement with predicted daily discharge (Figure 2): differences can be expected as the instantaneous manual readings were only made every 2 weeks and may have missed individual rain events; in addition, readings could only be made when the streams were flowing, thus also missing periods of low or no flow (Figure 2).
Stream waters were collected from each catchment under free-flowing conditions at an approximately biweekly frequency, with water temperature and pH measured in situ at the time of sampling. Rainwater samples were periodically collected at the plantation. All waters were filtered at 0.45 μm immediately after sampling. A sub-sample of the filtered water was acidified to pH 2 with concentrated HNO3 in acid-cleaned HDPE bottles for analysis of cations. Sub-samples for anion analysis were collected in MilliQ rinsed LPDE bottles and were not acidified. Sub-samples for analysis of dissolved organic carbon (DOC) and total dissolved nitrogen (TDN) were collected in amber borosilicate glass vials and acidified with HCl.
Total alkalinity was determined for stream waters immediately after sampling using a Gran titration technique (Stumm and Morgan, 1996). Precision and accuracy were monitored using a sodium carbonate standard and were always better than ±5%. Bicarbonate (HCO) concentrations were calculated from total alkalinity, temperature and pH using CO2SYS v2.1 (Pierrot et al., 2006) using the stoichiometric equilibrium constants derived for freshwater by Millero (1979). For this calculation only [HCO], [CO], [OH−], and [H+] were included in the definition of total alkalinity (Pierrot et al., 2006). Borate was not included in the definition of total alkalinity as measured B concentrations (see section Analysis of cation and anion concentrations and results) indicated that borate could only account for <0.1% of the total alkalinity so is considered negligible. The pH and alkalinity data indicate that >99% of stream water alkalinity consists of HCO. Moreover, as DOC concentrations are low (ranging from 75 to 540 μM C), it can be assumed that alkalinity ≈ [HCO].
All concentration analyses were carried out in laboratories in the National Oceanography Centre, Southampton.
Concentrations of major and some trace elements (B, Ba, Ca, K, Mg, Na, Si, Sr) were measured on a Thermo Scientific iCAP 6000 Inductively Coupled Plasma Optical Emission Spectrometry (ICP-OES). Accuracy and precision were monitored using repeated measurements of a multi-elemental ICP standard (VWR) and an in-house drift standard, with known values reproduced always within ±10%. Aluminum concentrations in stream waters were low or below the typical detection limit (<~0.05 ppm) in the stream waters, and so were monitored to check for potential contamination from particulate material but are not reported. The DOC and TDN concentrations in the stream waters were determined on a Total Organic Carbon Analyzer (Shimadzu TOC-VCPH). Accuracy was monitored using consensus reference material from the University of Miami (UM Hansell CRM); our values were within ±10% of the consensus values. Precision was determined via repeat measurements of the same sample (n > 3) and was better than ±2%.
Anion (SO, NO, Cl−) concentrations were measured by ion chromatography (IC, Thermo Scientific Dionex Aquion) with a 9 mM sodium carbonate eluent. A multi-elemental standard (Dionex Seven Anion Standard II) was repeatedly measured to monitor accuracy and precision, with values reproduced to within ±6% of known concentrations. The normalized inorganic charge balance (NCIB = (Σ+- Σ−)/(Σ++ Σ−) in %, where Σ+ is the sum of cations and Σ− is the sum of anions, in equivalents) was on average 1.8% for all stream water measurements (n = 562) and was always better than ±10% (Supplementary Table 8).
The radiogenic strontium isotopic composition (87Sr/86Sr) of the stream waters was determined by Thermal Ionization Mass Spectrometry (TIMS) at the University of Southampton. Briefly, 200 to 500 ng of Sr was separated from the rest of the sample matrix with Sr-Spec resin, using established chromatographic procedures (following Pearce et al., 2015 and Kelland et al., 2020 and references therein). The Sr fraction was loaded on a single Re filament and measured on the TIMS (Thermo Scientific). The 86Sr/88Sr ratio was normalized to 0.1194 using an exponential law. External and analytical reproducibility was monitored using standards: NBS 987 and an IAPSO seawater standard regularly passed through column chemistry (Supplementary Text 1.4). Repeated measurements of NBS 987 yielded 0.710252 ± 6 ppm (2SD, n = 73). The uncertainty associated with a sample measurement is taken as the uncertainty on these repeated measurements of NBS 987 (i.e., ±6 ppm).
After collection, soil cores were split into two fractions, 0–10 cm and 10–30 cm, and dried in an oven at 80°C. Soil pH was measured at the oil palm plantation by mixing dry soil with distilled water in a 1:5 ratio.
Dried soils were first sieved to <2 mm, and then subjected to a chemical leaching procedure to separate the exchangeable (plant available), carbonate, and silicate fractions of the soils. The exchangeable fraction was isolated by leaching the soils in 1M ammonium chloride (NH4Cl) for 24 h and the carbonate fraction was isolated by leaching the residue remaining after the NH4Cl leach in 4M acetic acid (AcOH) for 24 h. After both leaches were completed, the residual soil was rinsed 3 times in MilliQ water, dried, and completely digested on at hotplate at 130°C in a mix of HF, HNO3 and HClO4. The residual soil is assumed to principally consist of relatively insoluble silicate minerals. The chemical compositions of each of the soil leachates, and the digested soil residue, was determined by ICP-OES as described in Sections Analysis of cation and anion concentrations; selected soil leachates were also analyzed for 87Sr/86Sr as described in Section Analysis of radiogenic Sr isotope ratios (87Sr/86Sr).
The inorganic carbon (carbonate) content of the dried and sieved soil samples was assessed using a UIC CM5015 CO2 Coulometer in the SEAPORT Stable Isotope Lab, University of Southampton. However, the carbonate content of all the soils analyzed was below the detection limit of the instrument (<0.2 wt% CaCO3). For this reason, we assessed changes in soil carbonate by chemical leaching (reaction with 4M AcOH for 24 h after the exchangeable fraction was removed, as above) on a selection of soil samples (Supplementary Table 5) from 2018 (pre-treatment), 2019 and 2020. To calculate wt% CaCO3 we assumed that the Ca in the leachate measured by ICP-OES was from dissolution of CaCO3. Calculated CaCO3 values (see Section Composition of the soils, applied rock, and fertilizers) were consistent with the results from coulometry (i.e., <0.2 wt%). We applied inferential statistics to assess the significance of differences in carbonate content in soils between treated and untreated plots and different years. The data were normalized to homogenize the variance between data sets by transforming to a log scale with the time point (year) treated as a continuous variable. The variance was analyzed using a 3-way ANOVA (time, treatment, and plot) on the transformed model. To assess differences between years, the model was refitted with the time point (year) included as a discrete factor and contrasts and Tukey-adjusted p-values were then calculated.
The crushed rock that was applied to the treated catchments was donated by Onika Quarry (owned by Leeka Holdings) in Tawau, Sabah, and its composition is described in detail in Lewis et al. (2021). Briefly, the rock is andesitic in composition and is derived from Pleistocene magmatic-arc volcanic deposits (Lewis et al., 2021). The mineralogy is dominated by plagioclase (45 wt%), sanidine feldspar (13 wt%) and diopside (clinopyroxene, 12 wt%) minerals and has a relatively high quartz content (19 wt%). The rock also contains trace carbonate minerals (~0.8 wt%, Lewis et al., 2021). The applied rock has a grainsize of p80 = 1,767 μm and its whole rock specific surface area [determined by (BET)-N2 adsorption] was 2.73 ± 0.06 m2/g (Lewis et al., 2021).
The chemical composition of carbonate minerals in the applied rock was determined by leaching the ground rock in 4M acetic acid in the same way as for the soils. The material remaining after removal of the carbonate fraction, which can be assumed to represent the silicate fraction, was subsequently digested on a hotplate at 130°C in a mix of HF and HNO3. The leachates and digestates were dried down and redissolved in 3% HNO3 and cation concentrations and 87Sr/86Sr ratios were measured as described in Sections Analysis of cation and anion concentrations and Analysis of radiogenic Sr isotope ratios (87Sr/86Sr).
Throughout the experiment, fertilizers were applied to the oil palms in accordance with usual agricultural practice at the plantation. Fertilizers consisted of ground Mg-limestone, potash, magnesium sulfate and sodium borate, as well as various other compound (e.g., NPK) fertilizers. The full fertilizer application schedule is given in Supplementary Table 3. Most notably, ground Mg-limestone was added to all catchments between April and August 2018, and again in January 2019. Approximately 2 kg of Mg-limestone was applied to the base of each oil palm on both occasions. As carbonate minerals have high dissolution rates relative to silicate minerals, this fertilizer can be expected to undergo rapid chemical weathering and will contribute to CO2 drawdown (Equation 2).
The chemical composition of water-soluble fertilizers (NK, NPK, Na-borate, urea, muriate of potash and MgSO4) was determined by dissolving the fertilizer in MilliQ water and then acidifying to pH 2 with concentrated distilled HNO3. Non-water-soluble fertilizers (rock phosphate and ground Mg-limestone) were digested on a hotplate at 130°C in a mix of HF, HNO3 and HClO4. The dissolved/digested fertilizers were then dried down and redissolved in 3% HNO3 and cation concentrations were measured as described in Section Analysis of cation and anion concentrations.
All data obtained in this study are available in the Supplementary Tables 1–8 and summarized here. Our data characterize the chemical composition of the stream waters, soils and different soil phases and include radiogenic strontium isotope data that can be used to trace cation sources.
Concentrations of key solutes in stream waters are shown together with rainfall data in Figure 3. The variation in concentrations followed a similar pattern across all catchments, with lower concentrations of major dissolved ions (Ca2+, Mg2+, Na+, HCO) coinciding with higher rainfall (>600 mm). This likely reflects a greater influence of surface runoff during periods of high rainfall with proportionally higher base flow during drier conditions.
The DOC concentration of all the stream waters was lower than the global average river concentration (Liu and Wang, 2022, Supplementary Table 8), ranging from 75 to 540 μM C. Bicarbonate (HCO) accounted for >99% of total alkalinity (Supplementary Table 8) which is expected due to the low DOC and because the inorganic charge balance was close to zero and stream water pH was neutral [proton activity mean = 6.76 ± 0.40 (1SD, n = 582)]. Stream waters have HCO concentrations that are relatively high (in some cases >99% of world rivers, which fall between 47 to 5,950 μeq/L; Meybeck, 2003), varying from 1,323 to 7,097 μeq/L across all catchments (n = 579). Stream water cations are dominated by Mg2+, Ca2+, and Na+, with concentrations ranging from 584 to 2,921, 301 to 2,050, and 268 to 1,690 μM, respectively (n = 579). Sulfate and chloride concentrations are nearly always higher than the global river average (ranging from 118 to 1,280 and 281 to 3,159 μM, respectively, whereas world river average concentrations are 175 and 167 μM, respectively; Meybeck, 2003). Nitrate concentrations in stream waters were on average 122 μM and often below the typical analytical detection limit (<8 μM, Supplementary Table 8). Stream water concentrations of elemental B ranged from 9 to 66 μM, which is higher than the range of most natural waters (average value of the world's largest rivers = 0.94 μM; Gaillardet et al., 2014).
Radiogenic Sr isotope (87Sr/86Sr) compositions can be used to trace the weathering source in waters and soils. Since 87Rb decays into 87Sr (half-life = 49 Gyr), the 87Sr/86Sr ratios of waters and soils are set by source rock composition which differs according to rock type and age. Strontium is a mobile element and has a similar atomic radius to Ca, so it readily substitutes for Ca in minerals. Therefore, 87Sr/86Sr compositions of waters, sediments and soils also trace the weathering of carbonate minerals, which usually have higher 87Sr/86Sr ratios than silicate minerals (e.g., Gaillardet et al., 1999). For this reason, the Sr isotopic compositions of the stream waters, the soils and the applied rock were also measured to help determine the proportion of weathering of carbonate vs. silicate minerals (Figure 4). Stream water 87Sr/86Sr values ranged from 0.706556 to 0.707471, overlapping with soil carbonate phases (that ranged from 0.707167 to 0.708338). Silicate phases had a wide range of 87Sr/86Sr values, with the lowest values measured in post-treatment soils (Figure 4).
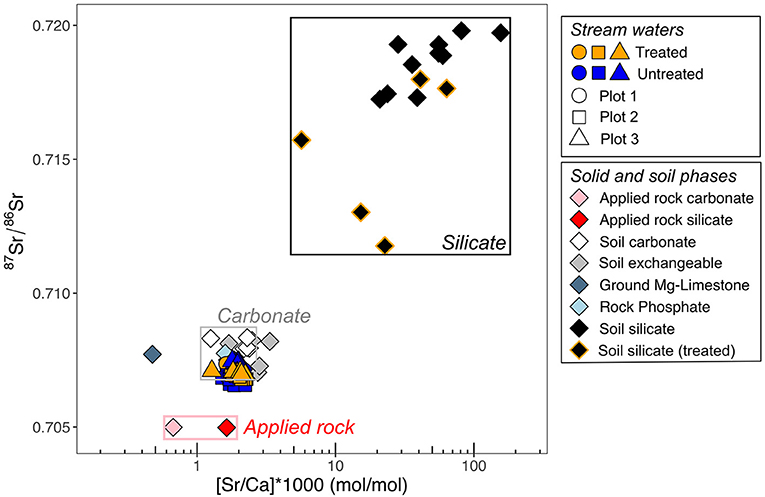
Figure 4. 87Sr/86Sr isotope geochemistry of stream waters, soil phases (exchangeable, carbonate and silicate, the applied rock (silicate and carbonate phases) and fertilizers. Boxes enclose the range of soil silicates, soil carbonates and the applied rock. Treated silicate refers to the silicate fraction of soils post rock application in treated catchments. Analytical error is smaller than the symbol size.
The soils in all catchments were acidic with soil pH = 5.10 ± 0.55 (proton activity mean, ± 1 SD, n = 402). The chemical compositions of the different soil fractions (exchangeable, carbonate and silicate), fertilizers and the applied rock, which are all potential sources of solutes in the stream waters, are summarized in Supplementary Table 5.
We estimate the soil inorganic carbon content to be on average <0.2 wt% using the Ca concentrations mobilized in the acetic acid leachates (Figure 5). Chemical extractions are imperfect and additional phases, such as phosphate minerals and potentially silicate or clay minerals, may be mobilized (Tessier et al., 1979), so estimates of carbonate concentrations derived by chemical leaching represent maximum values. Differences in the mean values of calculated calcium carbonate concentrations (CaCO3 wt%) were observed between treated and untreated plots for all 3 time points analyzed: 2018 (pre-treatment), treated = 0.032 ± 0.019 (SD) and untreated = 0.035 ± 0.026 (SD); 2019, treated = 0.059 ± 0.049 (SD) and untreated = 0.028 ± 0.016 (SD) and 2020, treated = 0.099 ± 0.079 (SD) and untreated = 0.068 ± 0.064 (SD) (Figure 5A). The calculated CaCO3 concentration was ~0.03 wt% higher in the treated plot when compared to untreated plot at the final time point analyzed (2020). All three effects (year, plot, treatment) significantly contributed to the variance (plot p = 0.010052*, treatment p = 0.004561** and year p = 0.001734**, Figure 5B). There were also significant differences between the means of 2019 and 2020 (p = 0.0102*) and of 2018 and 2020 (p = 0.0146*), but no significant difference between 2018 and 2019 (Figure 5B).
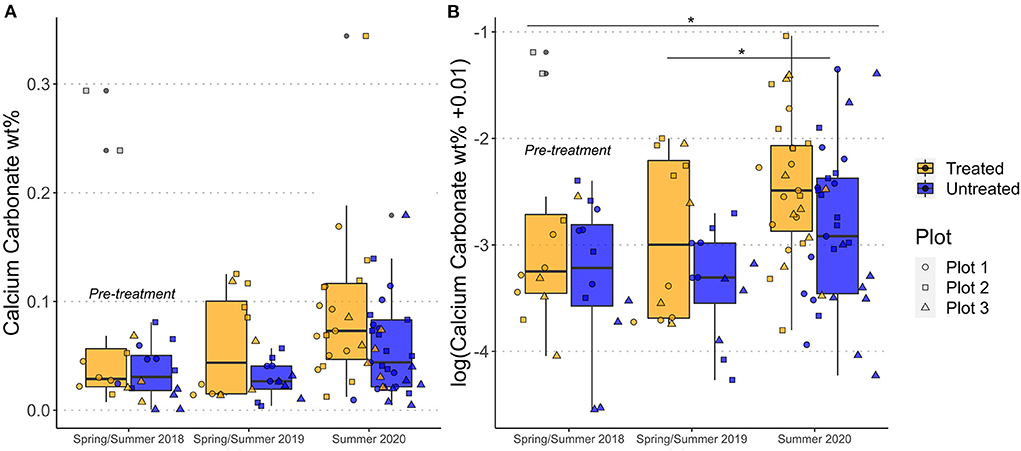
Figure 5. Change in soil carbonate concentration (derived from analysis of soil leachates) over the course of this study as wt% calcium carbonate (A) and transformed to a log scale (B). Box plots are for data from all three plots, with the thick black line indicating the median value. Individual data points are the colored symbols. Gray colored squares indicate extreme outliers excluded from the data analysis. *Indicates the calculated p-value was between 0.01 and 0.05.
The chemical composition of carbonate phases (ground Mg-limestone fertilizer and the acetic acid extractable portion of the soil and the applied rock) and the silicate phases (residual fractions of the soil and applied rock, after leaching of non-silicate phases) was also determined to partition sources of cations derived from weathering of silicate vs. carbonate phases for each individual catchment. Cross plots of Na/Σ+, Ca/Σ+ and Mg/Σ+ (where Σ+ is the sum of the base cations in equivalents), demonstrate that this approach is valid as the silicate phases are characterized by relatively high Na/Σ+ and the carbonate phases are characterized by high Ca/Σ+. In addition, carbonate phases all plot on a mixing line between Mg- and Ca-carbonate or rock phosphate endmembers, whereas the silicate phases lie off the mixing line (Figure 6B). Figure 5A also shows that mobilization of Na relative to other major cations was minimal in the acetic acid leach, confirming that the acetic acid leach targeted mostly carbonate phases. The chemical composition of the soil exchangeable fraction overlaps with that of carbonate (dolomite and limestone and Mg-limestone fertilizer; Figure 6); note that the soil exchangeable fraction may also include any water-soluble fertilizers present in the soil.
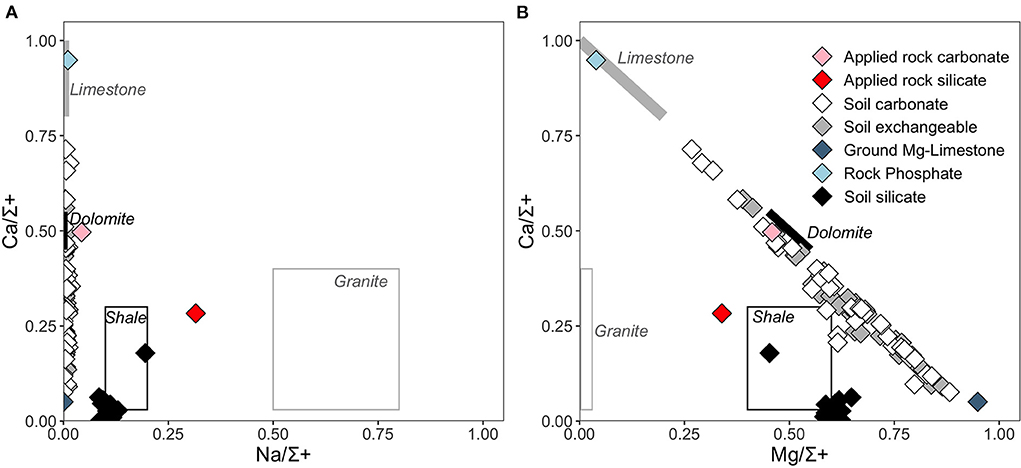
Figure 6. Geochemical composition of the applied rock (carbonate and silicate phases), soil phases (exchangeable, carbonate, and silicate) and rock-based fertilizers compared to generalized lithological endmember compositions spanning a wide range (silicates represented by shale and granite, carbonates represented by dolomite and limestone). (A) Na/Σ+ and Ca/Σ where Σ+ is the sum of major cations (Ca, Mg, Na, K) in equivalents and (B) Mg/Σ+ and Ca/Σ+. Composition of generalized global lithological endmembers (boxes) are from Torres et al. (2016).
The chemical composition of fertilizers considered as potential cation sources applied to the oil palms over the course of this study is provided in Supplementary Table 3. The fertilizers are (i) water-soluble salts (e.g., MgSO4, Na-borate, potash and NPK fertilizers) that add cations to stream waters but do not draw down any atmospheric CO2, and (ii) rock-based fertilizers (e.g., ground Mg-limestone and rock phosphate) that will undergo chemical weathering and contribute to the CO2 budget. Rock-based fertilizer compositions are also plotted in Figure 6.
Here, we quantify and discuss the evidence for CO2 removal via alkalinity generation and soil carbonate formation over the course of this field trial. Firstly, we assess CO2 drawdown via pedogenic carbonate formation in the soils. Secondly, we set out a model framework for quantifying CO2 removal via alkalinity generation in waters which considers inputs from fertilizers and strong acid weathering, as well as carbonic acid weathering of silicate and carbonate minerals. This model framework is similar to those applied in natural riverine and weathering studies (e.g., Gaillardet et al., 1999; Galy and France-Lanord, 1999; Torres et al., 2016; Bufe et al., 2021; Kemeny and Torres, 2021). Finally, we place our quantifications in a global context, comparing estimations of CO2 removal via alkalinity generation to selected comparator catchments.
As shown by Equation 3, CO2 removal associated with enhanced weathering deployed in croplands or with plants can also occur via pedogenic carbonate formation (e.g., Manning and Renforth, 2013). Soil carbonate concentrations (inferred from the chemistry of the acetic acid leaches) indicate that <0.2 wt% CaCO3 was, on average, present in the soils. Over the course of the experiment, the calculated soil carbonate concentration increased significantly in all plots and in both treated and untreated catchments (Figure 5). To date (i.e., by 2020), the increase in the soil carbonate concentration is ~0.03 wt% higher in the treated catchments relative to the untreated catchments (Figure 5A). Trace carbonate minerals from the applied rock in treated catchments may contribute to this difference, as three rock applications at 50 tons per ha with 0.8 wt% calcite would result in ~0.03 wt% increase in carbonate minerals in the soil, but only if this calcite was retained in the upper 30 cm of the soil (i.e., and not weathered, or migrated deeper in the soil profile). If this increase resulted solely from silicate mineral weathering and subsequent pedogenic carbonate formation (Eqn 1 and Eqn 3) over the top 30 cm of the soil, this would be approximately equivalent to a removal of 0.51 tCO2 ha−1 (assuming a bulk soil density of 1.3 g/cm3) or 0.26 tCO2 ha−1 yr−1. This idealized calculation highlights that small and difficult to detect changes in soil inorganic carbon content may equate to the removal of significant quantities of CO2. However, we are unable to verify if this increase in soil carbonate concentration between treated and untreated plots resulted from enhanced silicate mineral weathering, as additional isotopic measurements (e.g., δ13CCaCO3) would be needed to verify the proportion of soil inorganic carbon derived from CO2. The low inorganic carbon content of the soils meant that δ13C CaCO3 could not be measured directly on the soils from this field trial.
Overall, we emphasize that most carbonate minerals present in both the treated and untreated soils are likely to be predominately derived from fertilizer application, explaining the significant increase in calculated soil inorganic carbon content with time in both treated and untreated plots (Figure 5). This interpretation is supported by 87Sr/86Sr isotope and cation molar ratios, which indicate that the carbonate phases have high Mg and lie on a mixing line between a phosphate or limestone endmember, and a high-Mg limestone endmember (Figure 6). The radiogenic Sr isotope compositions of the soil carbonates (Figure 4) also overlap with the fertilizer endmember compositions.
Low concentrations of soil carbonate are consistent with the relatively low pH of the soils, as well as local climate conditions. Mean annual precipitation (MAP) is ~2,000 mm at our field sites (Figure 2) and soil inorganic carbon mainly forms under dry arid conditions, so is not likely to accumulate in areas where MAP exceeds 1,000 mm (e.g., Zamanian et al., 2016). Continued monitoring of soil inorganic carbon concentration at this field site will be necessary to ascertain whether carbonate accumulates at this site long-term, thereby becoming a demonstrably permanent store of CO2. Although the climatic conditions specific to our field site mean that pedogenic carbonate formation is not likely to be a substantial CO2 removal pathway, carbonate formation could be an important pathway for CO2 sequestration under different climatic and geologic regimes.
Here we set out a model framework for rigorously quantifying CO2 removal via alkalinity generation. Before the proportion of dissolved solutes derived from weathering of silicate vs. carbonate minerals can be quantified, contributions of dissolved solutes not derived from weathering need to be eliminated. These non-weathering sources are primarily atmospheric (cyclic) salts principally delivered by rainfall, and water-soluble fertilizer salts (e.g., compound fertilizers and potash).
The influence of fertilizers on stream chemistry is evidenced by the high sulfate and chloride concentrations sourced from MgSO4 and KCl (muriate of potash) fertilizers, respectively (Figure 3). Furthermore, Mg concentrations are similar to or higher than Ca in stream waters (Figure 3), which is the opposite of most freshwater systems where typically Ca is more concentrated (Meybeck, 2003). This is consistent with the dissolution of high-Mg fertilizers (MgSO4 and ground Mg-limestone). High B concentrations are indicative of input from dissolution of Na-borate fertilizer, and low DOC concentrations consistent with the lack of significant organic fertilizer input.
Atmospheric inputs to the stream waters were accounted for using average cation/chloride ratios measured in rainwater samples (see Supplementary Text 2). Following this, a series of corrections were made to subtract the contributions of water-soluble fertilizer salts (summarized in Supplementary Text 2). These corrections allow us to isolate the cation contribution to stream waters derived only from chemical weathering of silicate and carbonate minerals (referred to herein as “rock-derived” cations).
None of the water-soluble salt fertilizers were a significant source of Ca (or Sr) to the sampled stream waters. However, inputs from water-soluble salt fertilizers were significant for K+ and Na+, and as our fertilizer correction is non-exhaustive this likely induces unquantified error into the calculated rock-derived stream concentrations. However, the validity of our approach for extracting the rock-derived weathering signature is verified by cross plots of [HCO] and [Ca2+ + Mg2+]rock (Figure 7), which shows that the gradient of our rain-corrected and fertilizer-corrected [HCO] and [Ca2+ + Mg2+]rock data is ~2, consistent with the carbonic acid weathering of carbonate or silicate minerals (Equations 1 and 2).
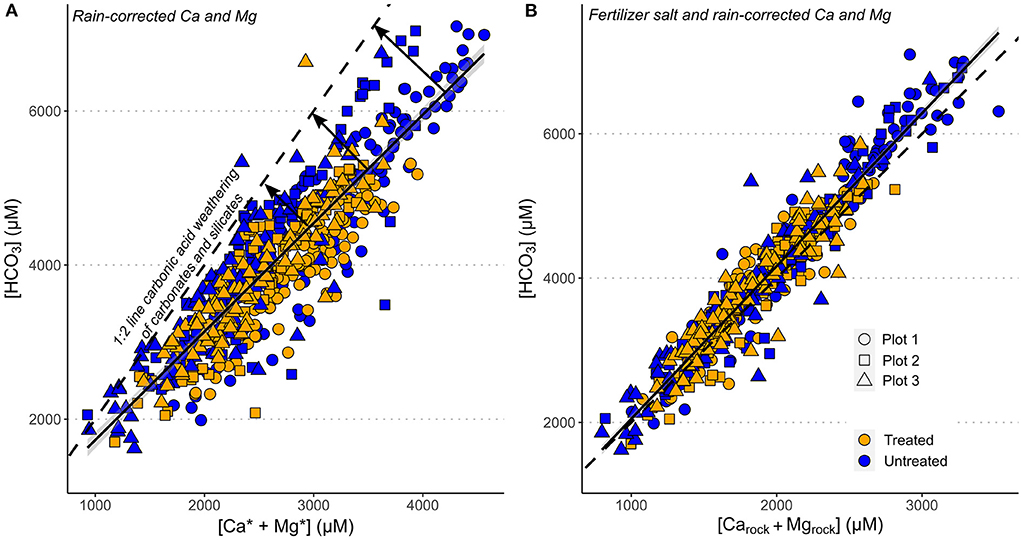
Figure 7. Cross plots of dissolved stream water chemistry g. (A) HCO vs. Ca2+ + Mg2+ (corrected for atmospheric inputs). (B) HCO vs. fertilizer salt and rain corrected Ca and Mg concentrations ([Ca2++Mg2+]rock). Dashed black line shows the stoichiometry of carbonic acid weathering of silicate and carbonate minerals, and the solid black lines are the linear regressions through the data.
Our radiogenic Sr isotope data (Figure 4) also indicate that a large proportion of stream water [K+] and [Na+] must be derived from fertilizer inputs rather than weathering of silicate minerals, because the 87Sr/86Sr ratios of the stream waters is consistent with weathering of carbonate phases.
Following correction of stream water chemistry for atmospheric and fertilizer salt inputs, the proportions of cations derived from the weathering of silicate vs. carbonate minerals were assessed using an idealized two-endmember mixing model (Supplementary Text 3). In this case, the endmembers are silicate minerals and carbonate minerals, which are defined as the chemical compositions of, respectively, the soil residue (silicate phases remaining after removal of exchangeable ions and carbonate phases) and the soil carbonate phase (phases leachable in acetic acid after removal of exchangeable ions). The soils contain silicate and carbonate minerals derived from the applied rock (treated catchments), the background soil and rock-based fertilizers, and they therefore integrate all of the potential carbonate and silicate mineral endmembers. This simplified approach does not account for weathering of the rock phosphate fertilizer; however, phosphate weathering had a minor influence on stream chemistry as phosphate concentrations in stream waters were ~0.1–4 μM (Supplementary Text 4).
The model calculates the instantaneous fraction of cations derived from carbonate and silicate weathering (fcarb and fsil, where fcarb + fsil =1) for each stream water sample, using the measured elemental molar ratios (Na/Σ+, Ca/Σ+ and Mg/Σ+, corrected for atmospheric and fertilizer salt inputs) and, where available, radiogenic Sr isotopes combined with Sr/Σ+. Radiogenic Sr isotope data were not corrected for atmospheric inputs, as rainwaters had negligible Sr concentrations (Supplementary Table 7). We solve 4 equations for fsil and fcarb simultaneously using a Bayesian endmember mixing package in R (simmr; Parnell et al., 2010), which calculates 10,000 possible solutions, and takes account of the error in the endmember compositions (Supplementary Text 3). The fsil and fcarb values reported are the mean and standard deviation of these possible solutions (Figure 8A).
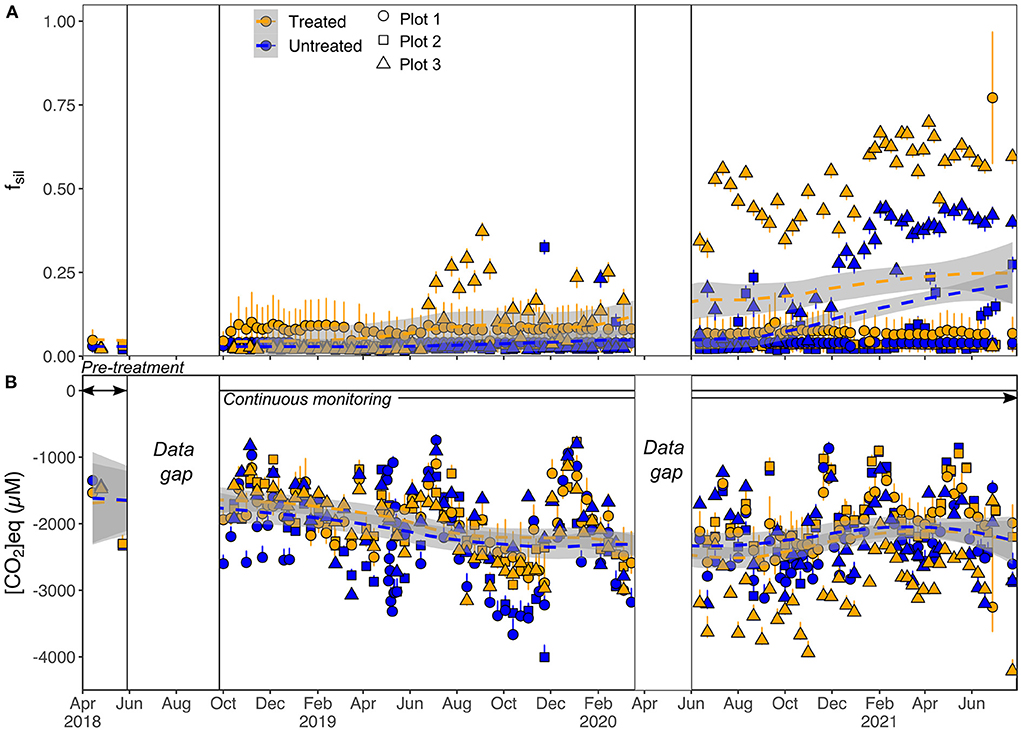
Figure 8. (A) Fraction of cations derived from silicate weathering (fsil) in stream waters calculated using the endmember mixing model. Symbols show mean values from the Bayesian endmember mixing model, and error bars are equal to 1SD. (B) Calculated moles of CO2 produced (positive) or drawn down (negative) per L of stream water as a result of rock weathering. Error bars are propagated 1SD errors from fsil and fcarb. Smoothed fit (dashed lines and gray bands) through all catchment data is a Loess regression. White boxes indicate data gaps prior to the start of continuous monitoring, and during the COVID-19 lockdown.
Model results indicate that >90% of stream cations were derived from carbonate mineral weathering over the first ~1–2 years of the study for all catchments, and for the whole duration of the study for plots 1 and 2 (Figure 8A). The high Mg concentrations in both soil carbonate leachates and stream waters (e.g., Figures 3, 6) are indicative of significant input of cations from weathering of high-Mg carbonate, likely sourced from the ground Mg-limestone fertilizer.
Stream waters from both treated and untreated catchments in plots 1 and 2 had similar fsil values [plot 1 average: untreated fsil = 0.040 ± 0.002 (1 SD), treated fsil = 0.08 ± 0.07 (1 SD) and plot 2 average: untreated fsil = 0.05 ± 0.06 (1 SD), treated fsil = 0.035 ± 0.002 (1 SD)]. Since the middle of 2019, a greater proportion of stream cations have been derived from silicate weathering in plot 3, with the treated catchment values exceeding the untreated catchment values (Figure 7A, from 25th June 2019, average fsil (untreated) = 0.19 ± 0.17 (1 SD) and average fsil (treated) = 0.38 ± 0.21(1 SD), Figure 7A).
The instantaneous amount of CO2 transferred to the stream waters ([CO2]eq; Figure 7A) and converted to alkalinity per unit volume of weathering fluid is given by:
where concentrations of cations and anions are in equivalents. Note that Equation 4 represents the drawdown of atmospheric CO2 as negative values, whereas the release of CO2 from the stream waters back into the atmosphere is represented by positive values.
In addition to weathering by carbonic acid, Equation 4 also accounts for the effects of weathering by nitric acid. The weathering of carbonates by strong acids [sulfuric (H2SO4) and nitric (HNO3)] can result in the release of CO2 (Spence and Telmer, 2005; Oh and Raymond, 2006; Calmels et al., 2007; Hamilton et al., 2007; Perrin et al., 2008; Torres et al., 2014; Raymond and Hamilton, 2018; Bufe et al., 2021; Relph et al., 2021), for example:
Although the absence of sulfide minerals within the soils mean that sulfuric acid weathering is unlikely to occur at our study site, the addition of N-fertilizer to the plots may result in the production of nitric acid. The extent of instantaneous CO2 release or consumption with both carbonic and nitric acid weathering can be estimated from the measured stream water NO concentrations [similar to the approach used by Bufe et al. (2021) for sulfuric acid weathering] by removing cations charge balanced by NO to calculate a net CO2 value (Equation 4). This CO2 calculation does not depend on whether the nitric acid reacts with carbonates or silicates (Bufe et al., 2021). We note that NO concentrations were generally low (Figure 3H), and the gradient of the cross plots of [HCO] and [Ca2++Mg2+]rock is close to 2 (Figure 6B), which both suggest that carbonic acid weathering was the principal weathering agent (nitric acid weathering can be expected to shift the gradient closer to 1 or even lower; Perrin et al., 2008).
Figure 9B shows that there was net removal of CO2 from the atmosphere via weathering in all of our study catchments over the entire sampling period. The annual variations in calculated [CO2]eq and total alkalinity for each plot are compared in Figure 9. Generally, higher alkalinity values correspond to higher CO2 removal (more negative [CO2]eq, Figure 9), as might be expected from Equations 1 and 2. In 2021, CO2 removal was higher in the treated catchment in plot 3 relative to the untreated catchment, due to increased silicate weathering (Figures 8A, 9B), even though there was little difference in alkalinity between the two catchments (Figure 9A). This highlights the need to partition sources of solutes in enhanced weathering experiments to determine the relative proportions of carbonate to silicate weathering. Accurate partitioning of cation sources is particularly important when the rocks used to amend soils contain trace carbonate minerals (Lewis et al., 2021), as the fast dissolution kinetics of carbonate minerals mean they would be expected to weather first (White et al., 1999; Jacobson and Blum, 2000).
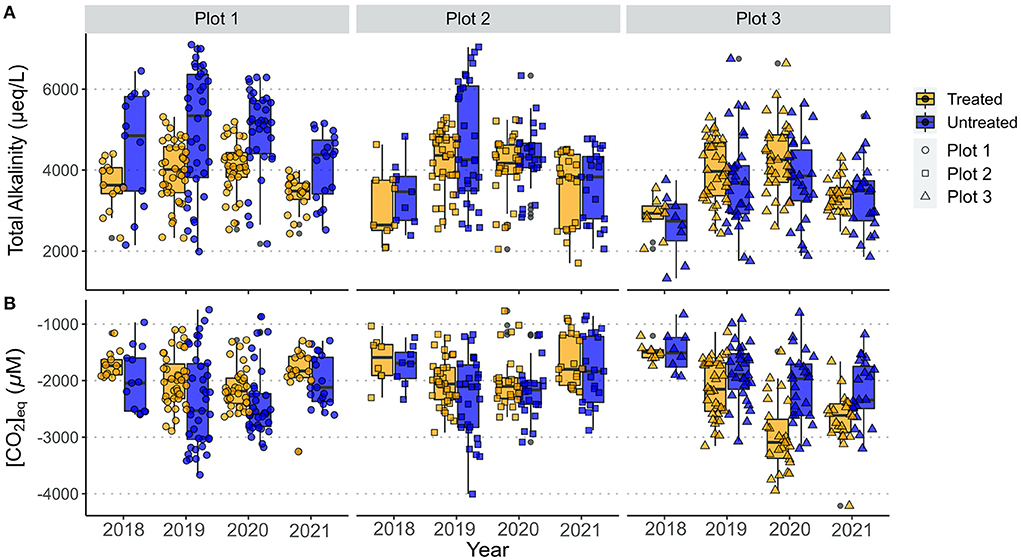
Figure 9. Annual variation in (A). Total Alkalinity of stream waters, and (B). amount of CO2 produced (positive) or drawn down (negative) as a result of rock weathering for treated and untreated catchments in all 3 study plots. Symbols show individual data points.
The cumulative quantity of CO2 removed from the atmosphere (in tCO2 ha−1) as alkalinity since the start of continuous monitoring in our field trial can be calculated by multiplying -[CO2]eq by the daily stream discharge and dividing by plot area (see Supplementary Text 5 for full details, Figure 10). Values of [CO2]eq were derived by linear interpolation between the sampling points, including over the COVID-19 lockdown. Considering all three plots together, the average (±1SD) amount of CO2 removal was 3.8 ± 0.8 tCO2 ha−1 for the treated catchments and 3.7 ± 0.6 tCO2 ha−1 for the untreated catchments over the continuous monitoring period (Figure 10). Thus, application of silicate rock did not result in a change in CO2 removal via alkalinity generation outside of the error range. The quantity of CO2 removed over the continuous monitoring period was similar for both the treated and untreated catchments in plots 1 and 2 (plot 1: treated = , untreated = tCO2 ha−1, plot 2: treated = , untreated = tCO2 ha−1). However, the amount of CO2 drawdown in plot 3 was higher in the treated catchment ( tCO2 ha−1) than in the untreated catchment ( tCO2 ha−1). This increase in CO2 drawdown within the treated catchment of plot 3 corresponds to an increase in the proportion of weathering of silicate minerals (Figure 8).
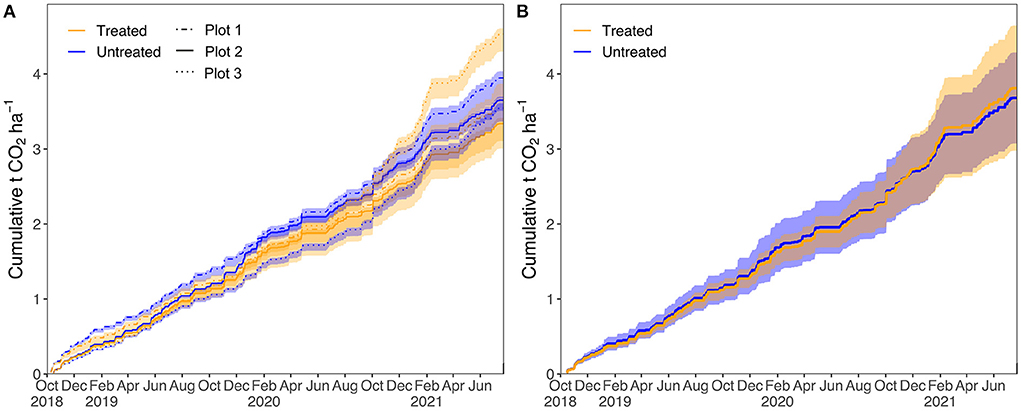
Figure 10. Cumulative CO2 drawdown in tons CO2 per hectare (tCO2 ha−1) via alkalinity generation. (A) Individual plots, error envelope is the propagated error [68% confidence interval (CI)]. (B) Mean of all three plots. Error envelope is 1 SD.
There are several potential reasons for the apparent lack of an increase in silicate weathering in treated catchments in plots 1 and 2. Rock weathering releases nutrients (e.g., K) to soil waters, making them plant available. If nutrients released by chemical weathering of the applied silicate rock are not in excess of plant uptake, then they will not contribute to stream water cation or anion fluxes (e.g., Manning et al., 2017). Similarly, if cations released by enhanced weathering are retained on the cation exchange sites in soils this leads to delayed or muted signals in stream waters (e.g., Pogge von Strandmann et al., 2021). Nevertheless, our analyses of the soil exchangeable fraction did not reveal an obvious signature of enhanced weathering as, for example, the 87Sr/86Sr isotope ratio of the exchangeable fraction was similar to that of the stream waters (Figure 6). It should also be noted that the baseline rates of chemical weathering recorded in all the streams on the plantation were extremely high. For example, average alkalinity concentrations were 4,035 μM (n = 579) in this study, whereas the average alkalinity concentration observed in natural forested catchments in Sabah is an order of magnitude lower (407 μM, n = 90; Yamashita et al., 2014). The high rates of fertilizer application on oil palm plantations leads to very high levels of weathering in all catchments, making the addition of less soluble silicate rock difficult to detect. High loadings of easily-solubilised fertilizers may also inhibit dissolution of applied silicate materials as soil waters may become saturated and therefore may limit weathering rates (e.g., Maher and Chamberlain, 2014).
Although plot 1 and 2 do not show any difference in CO2 drawdown via alkalinity generation between treated and untreated catchments, in plot 3 the difference was ~1.1 tCO2 ha−1. A difference of ~1.1 tCO2 ha−1 is consistent with what would be expected based on reactive transport modeling of weathering of the crushed silicate rock used in this study (Lewis et al., 2021). Model results predict that one application of 50 t ha−1 of Tawau andesite could be expected to remove 2.9 tCO2 ha−1 over a period of 15 years (Lewis et al., 2021). This is equivalent to ~1.1 tCO2 ha−1 for 3 annual applications of rock at 50 tons per hectare as was the case for the period of this study (just under 2 years). A predicted (maximum) difference of ~1.1 tCO2 ha−1 is relatively small relative to our study baseline (on the order of 3 tCO2 ha−1). As discussed above, weathering is currently dominated by weathering of fertilizers and as such the effects of enhanced weathering of the applied rock may be difficult to detect in all catchments. It is highly likely that the cumulative effect of rock application may take more time (i.e. >3 years) to become detectable. In settings with lower baseline stream water concentrations (e.g., forested regions with no fertilizer input) it may be that the signature of enhanced weathering is easier to detect.
Rates of CO2 removal as alkalinity determined in this study are high relative to rates determined for natural forests in Sabah, catchments draining the world's largest rivers and carbonate rock weathering (Figure 11). Carbonate CO2 removal rates are derived from Suchet et al., 2003 with CO2 release from nitric acid weathering calculated after (Perrin et al., 2008). We note, however, that few of these comparator catchments have been adequately characterized with a complete CO2 budget (e.g., taking into account CO2 release due to strong acid weathering); most published CO2 removal rates represent maximum values (e.g., Hilton and West, 2020). The high rates of CO2 consumption on the palm oil plantation are not, however, unexpected, as it has long been established that agriculture and agricultural liming can enhance weathering rates and increase alkalinity fluxes relative to non-agricultural settings (Pacheco and Van der Weijden, 2002; Hamilton et al., 2007; Raymond et al., 2008).
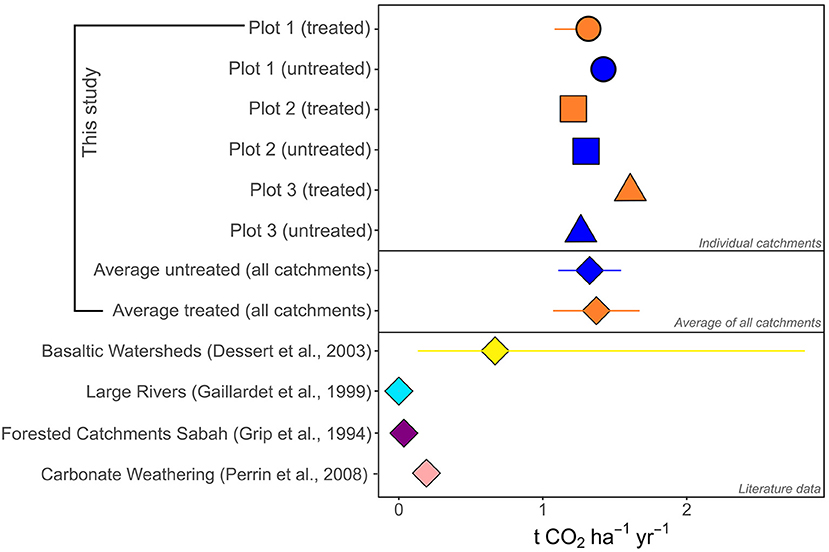
Figure 11. Rates of CO2 removal via alkalinity generation calculated in this study compared to rates of CO2 removal from: (i) carbonate weathering, (ii) natural forested catchments in Sabah, (iii) the world's largest rivers and (iii) small basaltic watersheds. For this study the individual catchments with the 1 SD propagated errors are shown (where greater than the symbol size), and the average and 1 SD error of all catchments is also shown (diamonds). For literature data (Grip et al., 1994; Gaillardet et al., 1999; Dessert et al., 2003; Perrin et al., 2008), the average is shown (symbol), and the error bar is the range. For the world's largest rivers, carbonate watersheds and forested catchments in Sabah, the range is smaller than the symbol size. CO2 consumption data for rivers draining lowland forest in Sabah are calculated using data from Grip et al. (1994), with partitioning of carbonate and silicate weathering after West et al. (2005). This calculation does not account for any CO2 release due to strong acid weathering, and so should be considered a maximum value. Carbonate CO2 removal data are calculated after Perrin et al. (2008), using data from Suchet et al. (2003).
Our study demonstrates that the high rates of weathering and CO2 drawdown in both the treated and untreated catchments on the palm oil plantation are driven primarily by weathering of a carbonate fertilizer. The rates of weathering are on the same order of magnitude as basaltic catchments which are thought to constitute 30–35% of global continental weathering fluxes (Dessert et al., 2003), on the order of ~1 tCO2 ha−1 yr−1. These values are also around an order of magnitude higher than that calculated for natural forested catchments in Sabah which experience similar climatic conditions (ranging from 0.02 to 0.08 tCO2 ha−1 yr−1 for two catchments; Grip et al., 1994; West et al., 2005). This indicates that the tropics should be considered as a key location for further enhanced weathering trials, as their large capacity to drawdown atmospheric CO2 via alteration of soils (in this instance with carbonate fertilizers) and enhanced chemical weathering is clear. If enhanced rock weathering was deployed without agricultural liming, and if fast weathering silicate minerals were to replace carbonates, the potential longer-term CO2 drawdown could be higher.
The study provides the first quantification of the extent of atmospheric CO2 removal via alkalinity generation in a field trial of enhanced weathering in a tropical environment. We present a method for quantifying CO2 removal via alkalinity generation that accounts for the influence of fertilizers and the potential for CO2 release associated with the weathering of carbonate minerals by strong acids. Using this method, we show that the acidification of soils due to nitrogen fertilizer application resulted in no net CO2 release in these catchments and that the rates of chemical weathering are high throughout the study site. Although the extent of CO2 removal via alkalinity generation associated with soils amended with silicate rock was similar to the untreated plots when all replicated catchments were considered, the results from one plot suggest an increased removal of ~0.4 tCO2 ha−1yr−1. This result is in agreement with the CO2 removal predicted from modeling (Lewis et al., 2021). If the carbon dioxide removal estimates from this plot are transferable to global tropical croplands (accounting for an area of 676 × 106 ha; Edwards et al., 2017), this equates to a removal of ~0.3 Gt CO2 yr−1, which is within range of the mitigation potential of other proposed carbon dioxide removal methods (IPCC, 2022). This evidently idealized calculation does not account for any emissions resulting from implementation (i.e., crushing and transportation of the applied rock), but if valid would represent ~3% of the ~10 Gt CO2 yr−1 of carbon dioxide removal by 2050 that is likely required to reach the Paris agreement target of limiting global average temperatures to 1.5°C (e.g., UN Environment Programme, 2017; IPCC, 2022).
We emphasize that this field trial is ongoing and unequivocal evidence for changes in pedogenic carbonate content, as well as the cumulative effect of rock application on weathering rates of treated vs. untreated catchments that currently show no detectable differences, may only be revealed in the coming years. Silicate mineral dissolution can be a slow process under most natural conditions, and modeling studies indicate that years to several decades may be required for the full CO2 removal potential to be reached (e.g., Taylor et al., 2016; Lewis et al., 2021). Longer-term monitoring is also important for assessing any potential impacts to soil, plant, and stream water quality to verify the safety of enhanced rock weathering. Notwithstanding, our results demonstrate that tropical croplands have a large capacity to help draw down atmospheric CO2, even when, as in this instance, CO2 drawdown is driven largely by application of carbonate fertilizers.
The original contributions presented in the study are included in the article/Supplementary material, further inquiries can be directed to the corresponding author/s.
MA, DJB, CP, RJ, RF, and KY contributed to conception and design of the study. KY and MA carried out field sampling and analysis. CL, MA, HG-H, JB, and KY conducted geochemical analysis. CL interpreted the data, carried out data analysis and calculations, and wrote the manuscript with input from all authors. All authors contributed to the article and approved the submitted version.
This research was funded through a Leverhulme Research Centre Award (RC-2015-029) from the Leverhulme Trust.
We thank Cynthia Dumousseaud, Gabriella Jardine, and Matt Cooper for technical assistance at the University of Southampton. We thank Onika Quarry for donating the rock used in this experiment as well as Glen Reynolds (Director of SEARRP) who helped to make sure the project ran smoothly. We thank the Sabah Biodiversity Centre that provided approval for both accessing the experimental site and exporting samples.
The authors declare that the research was conducted in the absence of any commercial or financial relationships that could be construed as a potential conflict of interest.
All claims expressed in this article are solely those of the authors and do not necessarily represent those of their affiliated organizations, or those of the publisher, the editors and the reviewers. Any product that may be evaluated in this article, or claim that may be made by its manufacturer, is not guaranteed or endorsed by the publisher.
The Supplementary Material for this article can be found online at: https://www.frontiersin.org/articles/10.3389/fclim.2022.959229/full#supplementary-material
Amann, T., Hartmann, J., Struyf, E., de Oliveira Garcia, W., Fischer, E. K., Janssens, I., et al. (2020). Enhanced Weathering and related element fluxes – a cropland mesocosm approach. Biogeosciences 17, 103–119. doi: 10.5194/bg-17-103-2020
Andrews, M. G., and Taylor, L. L. (2019). Combating climate change through enhanced weathering of agricultural soils. Elements 15, 253–258. doi: 10.2138/gselements.15.4.253
Beerling, D. J., Kantzas, E. P., Lomas, M. R., Wade, P., Eufrasio, R. M., Renforth, P., et al. (2020). Potential for large-scale CO 2 removal via enhanced rock weathering with croplands. Nature 583, 242–248. doi: 10.1038/s41586-020-2448-9
Beerling, D. J., Leake, J. R., Long, S. P., Scholes, J. D., Ton, J., Nelson, P. N., et al. (2018). Farming with crops and rocks to address global climate, food and soil security. Nat. Plants 4, 138–147. doi: 10.1038/s41477-018-0108-y
Berge, H. F. M. ten, van der Meer, H. G., Steenhuizen, J. W., Goedhart, P. W., Knops, P., and Verhagen, J. (2012). Olivine weathering in soil, and its effects on growth and nutrient uptake in ryegrass (lolium perenne l.): A pot experiment. PLoS ONE. 7, e42098. doi: 10.1371/journal.pone.0042098
Bufe, A., Hovius, N., Emberson, R., Rugenstein, J. K. C., Galy, A., Hassenruck-Gudipati, H. J., et al. (2021). Co-variation of silicate, carbonate and sulfide weathering drives CO 2 release with erosion. Nat. Geosci. 14, 211–216. doi: 10.1038/s41561-021-00714-3
Bullock, L. A., James, R. H., Matter, J., Renforth, P., and Teagle, D. A. H. (2021). Global carbon dioxide removal potential of waste materials from metal and diamond mining. Front. Clim. 3:77. doi: 10.3389/fclim.2021.694175
Calmels, D., Gaillardet, J., Brenot, A., and France-Lanord, C. (2007). Sustained sulfide oxidation by physical erosion processes in the Mackenzie River basin: climatic perspectives. Geology 35, 1003–1006. doi: 10.1130/G24132A.1
Dessert, C., Dupr,é, B., Gaillardet, J., François, L. M., and Allègre, C. J. (2003). Basalt weathering laws and the impact of basalt weathering on the global carbon cycle. Chem. Geol. 202, 257–273. doi: 10.1016/j.chemgeo.2002.10.001
Dietzen, C., Harrison, R., and Michelsen-Correa, S. (2018). Effectiveness of enhanced mineral weathering as a carbon sequestration tool and alternative to agricultural lime: an incubation experiment. Int. J. Greenhouse Gas Control 74, 251–258. doi: 10.1016/j.ijggc.2018.05.007
Drever, J. I. (1997). The Geochemistry of Natural Waters: Surface and Groundwater Environments. Upper Saddle River, N.J.: Prentice Hall.
Edwards, D. P., Lim, F., James, R. H., Pearce, C. R., Scholes, J., Freckleton, R. P., et al. (2017). Climate change mitigation: potential benefits and pitfalls of enhanced rock weathering in tropical agriculture. Biol. Lett. 13:20160715. doi: 10.1098/rsbl.2016.0715
Gabet, E. J., and Mudd, S. M. (2009). A theoretical model coupling chemical weathering rates with denudation rates. Geology 37, 151–154. doi: 10.1130/G25270A.1
Gaillardet, J., Dupré, B., Louvat, P., and Allègre, C. J. (1999). Global silicate weathering and CO2 consumption rates deduced from the chemistry of large rivers. Chem. Geol. 159, 3–30. doi: 10.1016/S0009-2541(99)00031-5
Gaillardet, J., Viers, J., and Dupré, B. (2014). “7.7 - Trace elements in river waters,” in Treatise on Geochemistry, 2nd Edn, Eds H. D. Holland and K. K. Turekian (Oxford: Elsevier), 195–235.
Galy, A., and France-Lanord, C. (1999). Weathering processes in the Ganges–Brahmaputra basin and the riverine alkalinity budget. Chem. Geol. 159, 31–60. doi: 10.1016/S0009-2541(99)00033-9
Grip, H., Malmer, A., and Wong, F. K. (1994). Converting tropical rain forest to forest plantation in sabah, malaysia. Part I. Dynamics and net losses of nutrients in control catchment streams. Hydrol. Processes 8, 179–194. doi: 10.1002/hyp.3360080302
Hamilton, S. K., Kurzman, A. L., Arango, C., Jin, L., and Robertson, G. P. (2007). Evidence for carbon sequestration by agricultural liming. Glob. Biochem. Cycle. 21, GB2021. doi: 10.1029/2006GB002738
Haque, F., Santos, R. M., and Chiang, Y. W. (2020). CO2 sequestration by wollastonite-amended agricultural soils – an Ontario field study. Int. J. Greenhouse Gas Control 97:103017. doi: 10.1016/j.ijggc.2020.103017
Haque, F., Santos, R. M., Dutta, A., Thimmanagari, M., and Chiang, Y. W. (2019). Co-benefits of wollastonite weathering in agriculture: Co2 sequestration and promoted plant growth. ACS Omega 4, 1425–1433. doi: 10.1021/acsomega.8b02477
Hartmann, J., West, A. J., Renforth, P., Köhler, P., Rocha, C. L. D. L., Wolf-Gladrow, D. A., et al. (2013). Enhanced chemical weathering as a geoengineering strategy to reduce atmospheric carbon dioxide, supply nutrients, and mitigate ocean acidification. Rev. Geophys. 51, 113–149. doi: 10.1002/rog.20004
Hilton, R. G., and West, A. J. (2020). Mountains, erosion and the carbon cycle. Nat. Rev. Earth Environ. 1, 284–299. doi: 10.1038/s43017-020-0058-6
IPCC (2022). “Climate change 2022: mitigation of climate change,” in Contribution of Working Group III to the Sixth Assessment Report of the Intergovernmental Panel on Climate Change, Eds P.R. Shukla, J. Skea, R. Slade, A. Al Khourdajie, R. van Diemen, D. McCollum, et al. (Cambridge; New York, NY: Cambridge University Press).
Jacobson, A. D., and Blum, J. D. (2000). Ca/Sr and 87Sr/86Sr geochemistry of disseminated calcite in Himalayan silicate rocks from Nanga Parbat: Influence on river-water chemistry. Geology 28, 463–466. doi: 10.1130/0091-7613(2000)28andlt;463:SASGODandgt;2.0.CO;2
Kelland, M. E., Wade, P. W., Lewis, A. L., Taylor, L. L., Sarkar, B., Andrews, M. G., et al. (2020). Increased yield and CO2 sequestration potential with the C4 cereal Sorghum bicolor cultivated in basaltic rock dust-amended agricultural soil. Glob. Chang. Biol. 26, 3658–3676. doi: 10.1111/gcb.15089
Kemeny, P. C., and Torres, M. A. (2021). Presentation and applications of mixing elements and dissolved isotopes in rivers (MEANDIR), a customizable MATLAB model for Monte Carlo inversion of dissolved river chemistry. Am. J. Sci. 321, 579–642. doi: 10.2475/05.2021.03
Kump, L. R., Brantley, S. L., and Arthur, M. A. (2000). Chemical weathering, atmospheric CO2, and climate. Annu. Rev. Earth Planet. Sci. 28, 611–667. doi: 10.1146/annurev.earth.28.1.611
Lasaga, A. C. (1984). Chemical kinetics of water-rock interactions. J. Geophys. Res. Solid Earth 89, 4009–4025. doi: 10.1029/JB089iB06p04009
Lewis, A. L., Sarkar, B., Wade, P., Kemp, S. J., Hodson, M. E., Taylor, L. L., et al. (2021). Effects of mineralogy, chemistry and physical properties of basalts on carbon capture potential and plant-nutrient element release via enhanced weathering. Appl. Geochem. 132:105023. doi: 10.1016/j.apgeochem.2021.105023
Lim, P. S., Malaysia, Jabatan Penyiasatan Kajibumi (1985). Peta geologi negeri Sabah = Geological Map of Sabah. Ipoh, Perak, Peninsular Malaysia: Director of Geological Survey of Malaysia.
Liu, F., and Wang, D. (2022). Dissolved organic carbon concentration and biodegradability across the global rivers: a meta-analysis. Sci. Tot. Environ. 818:151828. doi: 10.1016/j.scitotenv.2021.151828
Maher, K., and Chamberlain, C. P. (2014). Hydrologic regulation of chemical weathering and the geologic carbon cycle. Science 343, 1502–1504. doi: 10.1126/science.1250770
Manning, D. A. C., Baptista, J., Sanchez Limon, M., and Brandt, K. (2017). Testing the ability of plants to access potassium from framework silicate minerals. Sci. Tot. Environ. 574, 476–481. doi: 10.1016/j.scitotenv.2016.09.086
Manning, D. A. C., and Renforth, P. (2013). Passive sequestration of atmospheric CO2 through coupled plant-mineral reactions in urban soils. Environ. Sci. Technol. 47, 135–141. doi: 10.1021/es301250j
Meybeck, M. (2003). “5.08 - global occurrence of major elements in rivers,” in Treatise on Geochemistry, eds H. D. Holland and K. K. Turekian (Oxford: Pergamon), 207–223. doi: 10.1016/B0-08-043751-6/05164-1
Millero, F. J. (1979). The thermodynamics of the carbonate system in seawater. Geochim. Cosmochim. Acta 43, 1651–1661. doi: 10.1016/0016-7037(79)90184-4
Oelkers, E. H., Declercq, J., Saldi, G. D., Gislason, S. R., and Schott, J. (2018). Olivine dissolution rates: a critical review. Chem. Geol. 500, 1–19. doi: 10.1016/j.chemgeo.2018.10.008
Oelkers, E. H., and Gislason, S. R. (2001). The mechanism, rates and consequences of basaltic glass dissolution: I. An experimental study of the dissolution rates of basaltic glass as a function of aqueous Al, Si and oxalic acid concentration at 25°C and pH = 3 and 11. Geochim. Cosmochim. Acta 65, 3671–3681. doi: 10.1016/S0016-7037(01)00664-0
Oh, N.-H., and Raymond, P. A. (2006). Contribution of agricultural liming to riverine bicarbonate export and CO2 sequestration in the Ohio River basin. Glob. Biochem. Cycle. 20, GB3012. doi: 10.1029/2005GB002565
Pacheco, F. A. L., and Van der Weijden, C. H. (2002). Mineral weathering rates calculated from spring water data: a case study in an area with intensive agriculture, the Morais Massif, northeast Portugal. Appl. Geochem. 17, 583–603. doi: 10.1016/S0883-2927(01)00121-4
Parnell, A. C., Inger, R., Bearhop, S., and Jackson, A. L. (2010). Source partitioning using stable isotopes: coping with too much variation. PLoS ONE 5:e9672. doi: 10.1371/journal.pone.0009672
Pearce, C. R., Parkinson, I. J., Gaillardet, J., Charlier, B. L. A., Mokadem, F., and Burton, K. W. (2015). Reassessing the stable (δ88/86Sr) and radiogenic (87Sr/86Sr) strontium isotopic composition of marine inputs. Geochim. Cosmochim. Acta 157, 125–146. doi: 10.1016/j.gca.2015.02.029
Perrin, A.-S., Probst, A., and Probst, J.-L. (2008). Impact of nitrogenous fertilizers on carbonate dissolution in small agricultural catchments: implications for weathering CO2 uptake at regional and global scales. Geochim. Cosmochim. Acta 72, 3105–3123. doi: 10.1016/j.gca.2008.04.011
Pierrot, D. E., Lewis, E., Wallace, D. W. R., and Wallace, D. W. R. (2006). MS Excel Program Developed for CO2 System Calculations. doi: 10.3334/CDIAC/otg.CO2SYS_XLS_CDIAC105a
Pogge von Strandmann, P. A. E., Renforth, P., West, A. J., Murphy, M. J., Luu, T.-H., and Henderson, G. M. (2021). The lithium and magnesium isotope signature of olivine dissolution in soil experiments. Chem. Geol. 560:120008. doi: 10.1016/j.chemgeo.2020.120008
Raymond, P. A., and Hamilton, S. K. (2018). Anthropogenic influences on riverine fluxes of dissolved inorganic carbon to the oceans. Limnol. Oceanogr. Lett. 3, 143–155. doi: 10.1002/lol2.10069
Raymond, P. A., Oh, N.-H., Turner, R. E., and Broussard, W. (2008). Anthropogenically enhanced fluxes of water and carbon from the Mississippi River. Nature 451, 449–452. doi: 10.1038/nature06505
Relph, K. E., Stevenson, E. I., Turchyn, A. V., Antler, G., Bickle, M. J., Baronas, J. J., et al. (2021). Partitioning riverine sulfate sources using oxygen and sulfur isotopes: implications for carbon budgets of large rivers. Earth Planet. Sci. Lett. 567:116957. doi: 10.1016/j.epsl.2021.116957
Renforth, P. (2012). The potential of enhanced weathering in the UK. Int. J. Greenhouse Gas Control 10, 229–243. doi: 10.1016/j.ijggc.2012.06.011
Renforth, P., Pogge von Strandmann, P. A. E., and Henderson, G. M. (2015). The dissolution of olivine added to soil: implications for enhanced weathering. Appl. Geochem. 61, 109–118. doi: 10.1016/j.apgeochem.2015.05.016
Riebe, C. S., Kirchner, J. W., and Finkel, R. C. (2004). Erosional and climatic effects on long-term chemical weathering rates in granitic landscapes spanning diverse climate regimes. Earth Planet. Sci. Lett. 224, 547–562. doi: 10.1016/j.epsl.2004.05.019
Schuiling, R. D., and Krijgsman, P. (2006). Enhanced weathering: an effective and cheap tool to sequester CO2. Clim. Change 74, 349–354. doi: 10.1007/s10584-005-3485-y
Spence, J., and Telmer, K. (2005). The role of sulfur in chemical weathering and atmospheric CO2 fluxes: evidence from major ions, δ13CDIC, and δ34SSO4 in rivers of the Canadian Cordillera. Geochim. Cosmochim. Acta 69, 5441–5458. doi: 10.1016/j.gca.2005.07.011
Stallard, R. F., and Edmond, J. M. (1983). Geochemistry of the Amazon: 2. The influence of geology and weathering environment on the dissolved load. J. Geophys. Res. Oceans 88, 9671–9688. doi: 10.1029/JC088iC14p09671
Stumm, W., and Morgan, J. J. (1996). Aquatic Chemistry: Chemical Equilibria and Rates in Natural Waters. John Wiley and Sons.
Suchet, P. A., Probst, J. -L., and Ludwig, W. (2003). Worldwide distribution of continental rock lithology: Implications for the atmospheric/soil CO2 uptake by continental weathering and alkalinity river transport to the oceans. Glob. Biochem. Cycle. 17, 1038. doi: 10.1029/2002GB001891
Taylor, L. L., Driscoll, C. T., Groffman, P. M., Rau, G. H., Blum, J. D., and Beerling, D. J. (2021). Increased carbon capture by a silicate-treated forested watershed affected by acid deposition. Biogeosciences 18, 169–188. doi: 10.5194/bg-18-169-2021
Taylor, L. L., Quirk, J., Thorley, R. M. S., Kharecha, P. A., Hansen, J., Ridgwell, A., et al. (2016). Enhanced weathering strategies for stabilizing climate and averting ocean acidification. Nat. Clim. Chang. 6, 402–406. doi: 10.1038/nclimate2882
Tessier, A., Campbell, P. G. C., and Bisson, M. (1979). Sequential extraction procedure for the speciation of particulate trace metals. Anal. Chem. 51, 844–851. doi: 10.1021/ac50043a017
Torres, M. A., West, A. J., Clark, K. E., Paris, G., Bouchez, J., Ponton, C., et al. (2016). The acid and alkalinity budgets of weathering in the Andes–Amazon system: insights into the erosional control of global biogeochemical cycles. Earth Planet. Sci. Lett. 450, 381–391. doi: 10.1016/j.epsl.2016.06.012
Torres, M. A., West, A. J., and Li, G. (2014). Sulphide oxidation and carbonate dissolution as a source of CO2 over geological timescales. Nature 507, 346–349. doi: 10.1038/nature13030
UN Environment Programme (2017). Emissions Gap Report 2017. UNEP - UN Environment Programme. Available online at: http://www.unep.org/resources/emissions-gap-report-2017 (accessed March 2, 2022).
Walker, J. C. G., Hays, P. B., and Kasting, J. F. (1981). A negative feedback mechanism for the long-term stabilization of Earth's surface temperature. J. Geophys. Res. Oceans 86, 9776–9782. doi: 10.1029/JC086iC10p09776
West, A. J., Galy, A., and Bickle, M. (2005). Tectonic and climatic controls on silicate weathering. Earth Planet. Sci. Lett. 235, 211–228. doi: 10.1016/j.epsl.2005.03.020
White, A. F., and Brantley, S. L. (2003). The effect of time on the weathering of silicate minerals: why do weathering rates differ in the laboratory and field? Chem. Geol. 202, 479–506. doi: 10.1016/j.chemgeo.2003.03.001
White, A. F., Bullen, T. D., Vivit, D. V., Schulz, M. S., and Clow, D. W. (1999). The role of disseminated calcite in the chemical weathering of granitoid rocks. Geochim. Cosmochim. Acta 63, 1939–1953. doi: 10.1016/S0016-7037(99)00082-4
Yamashita, N., Sase, H., Kobayashi, R., Leong, K.-P., Hanapi, J. M., Uchiyama, S., et al. (2014). Atmospheric deposition versus rock weathering in the control of streamwater chemistry in a tropical rain-forest catchment in Malaysian Borneo. J. Trop. Ecol. 30, 481–492. doi: 10.1017/S0266467414000303
Keywords: climate change mitigation, enhanced weathering, tropical croplands, carbon dioxide removal, oil palm
Citation: Larkin CS, Andrews MG, Pearce CR, Yeong KL, Beerling DJ, Bellamy J, Benedick S, Freckleton RP, Goring-Harford H, Sadekar S and James RH (2022) Quantification of CO2 removal in a large-scale enhanced weathering field trial on an oil palm plantation in Sabah, Malaysia. Front. Clim. 4:959229. doi: 10.3389/fclim.2022.959229
Received: 01 June 2022; Accepted: 11 August 2022;
Published: 30 August 2022.
Edited by:
Etsushi Kato, Institute of Applied Energy, JapanReviewed by:
Thorben Amann, University of Hamburg, GermanyCopyright © 2022 Larkin, Andrews, Pearce, Yeong, Beerling, Bellamy, Benedick, Freckleton, Goring-Harford, Sadekar and James. This is an open-access article distributed under the terms of the Creative Commons Attribution License (CC BY). The use, distribution or reproduction in other forums is permitted, provided the original author(s) and the copyright owner(s) are credited and that the original publication in this journal is cited, in accordance with accepted academic practice. No use, distribution or reproduction is permitted which does not comply with these terms.
*Correspondence: Christina S. Larkin, Yy5zLmxhcmtpbkBzb3Rvbi5hYy51aw==
Disclaimer: All claims expressed in this article are solely those of the authors and do not necessarily represent those of their affiliated organizations, or those of the publisher, the editors and the reviewers. Any product that may be evaluated in this article or claim that may be made by its manufacturer is not guaranteed or endorsed by the publisher.
Research integrity at Frontiers
Learn more about the work of our research integrity team to safeguard the quality of each article we publish.