 Annette Stellema
 Alex Sen Gupta
 Andréa S. Taschetto
 Ming Feng
- 1Climate Change Research Centre, University of New South Wales, Sydney, NSW, Australia
- 2ARC Centre of Excellence for Climate Extremes, University of New South Wales, Sydney, NSW, Australia
- 3Centre for Marine Science Innovation, University of New South Wales, Sydney, NSW, Australia
- 4CSIRO Oceans and Atmosphere, Indian Ocean Marine Research Centre, Crawley, WA, Australia
- 5Centre for Southern Hemisphere Oceans Research (CSHOR), CSIRO Oceans and Atmosphere, Hobart, TAS, Australia
The Equatorial Undercurrent (EUC) stretches across the Pacific, transporting cool waters rich in oxygen and nutrients eastward to one of the most productive regions in the ocean. As an intricate part of the global climate system, EUC dynamics are essential to understanding future climate change but are poorly represented in global coupled climate models. This study examines EUC representation and future changes in the latest generations of the Coupled Model Intercomparison Project (CMIP6 and CMIP5) and an eddy-permitting ocean model. We also examine historical and projected changes in EUC source waters, including the Mindanao Current (MC), New Guinea Coastal Undercurrent (NGCU), and interior thermocline convergence. The circulation features in the models are broadly consistent with observations and ocean reanalyses, but improvements from CMIP5 to CMIP6 are limited. In the future projections, the EUC is enhanced in the western Pacific, with less prominent changes in CMIP6, but more so in the eddy-permitting model. The western Pacific EUC enhancement is likely associated with a wind-driven redirection of waters south of the equator, in which the NGCU boundary flow increases while the interior thermocline convergence decreases. This is superimposed on an overall weakening of the North Pacific subtropical overturning cell, including the MC, interior thermocline convergence, and Ekman divergence. As EUC heat and nutrient composition is linked to its sources, these projected changes have implications for the EUC's role in air–sea feedbacks, nutrient replenishment, and oxygen minimum zone ventilation in the eastern Pacific.
Introduction
The Equatorial Undercurrent (EUC) flows eastward along the equator over the vast length of the Pacific (Johnson et al., 2002). The cool waters, rich in oxygen and nutrients, transported by the EUC have an important influence on regional ocean variability, global climate, and marine ecosystems (Firing et al., 1983; Chavez et al., 1999; Slemons et al., 2012). In the eastern equatorial Pacific, EUC waters help enrich the ecosystems, ventilate the oxygen minimum zones, and upwell old carbon that subsequently outgases into the atmosphere (Feely et al., 1999; Takahashi et al., 2006; Busecke et al., 2019). In particular, the EUC supports high primary productivity by replenishing the limiting-micronutrient iron, primarily carried from continental shelves around Papua New Guinea by low-latitude western boundary currents (LLWBCs; Vichi et al., 2008; Slemons et al., 2010, 2012).
There are two primary low-latitude sources of EUC waters as follows: Thermocline convergence in the basin interior and LLWBCs, such as the Mindanao Current (MC) and New Guinea Coastal Undercurrent (NGCU; Figure 1) (Tsuchiya et al., 1989; Johnson and McPhaden, 1999). This convergence forms part of the subtropical meridional overturning cells (STCs), the waters rise to the surface with the EUC, diverge from the equator in the Ekman layer, and sink back into the thermocline in the subtropics (Lu et al., 1998; Johnson and McPhaden, 1999). The equatorial easterlies and off-equatorial wind stress curl help modulate whether these waters converge in the interior or along the boundary (Johnson and McPhaden, 1999). The equatorial easterlies also help set up a pressure head in the west that drives the EUC eastward along the shoaling thermocline (Johnson et al., 2001). In the central and eastern Pacific, the EUC brings cold waters close to the surface to supply the wind-driven Ekman divergence (Johnson et al., 2001). This upwelling amplifies the east-west sea surface temperature difference, further reinforcing the easterlies that make up the lower branch of the Walker Circulation in the Pacific (Bjerknes, 1969).
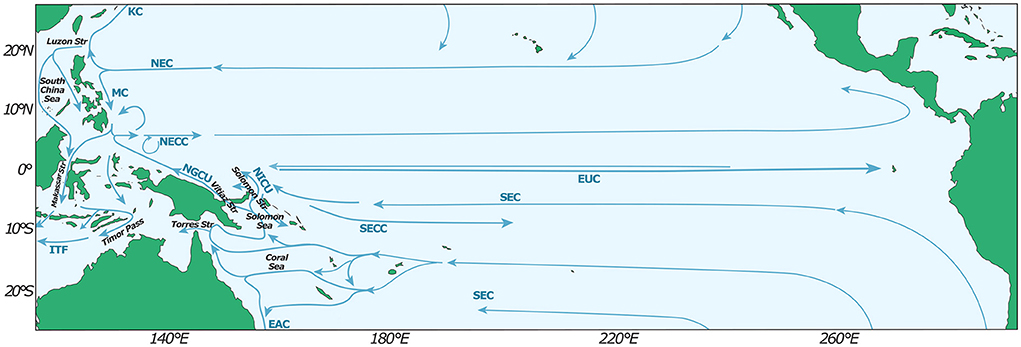
Figure 1. Schematic of Tropical Pacific Ocean circulation. KC, Kuroshio Current; NEC, North Equatorial Current; MC, Mindanao Current; NECC, North Equatorial Counter Current; EUC, Equatorial Undercurrent; NGCU, New Guinea Coastal Undercurrent; NICU, New Ireland Coastal Undercurrent; ITF, Indonesian Throughflow; SEC, South Equatorial Current; SECC, South Equatorial Counter Current; EAC, East Australian Current. Figure adapted from Hu et al. (2015).
The future state of circulation in the equatorial Pacific is the focus of numerous studies (e.g., Vecchi and Soden, 2007; Luo et al., 2009; Karnauskas and Cohen, 2012; Sen Gupta et al., 2012). Coupled Model Intercomparison Project (CMIP) ensembles project an enhancement of the EUC in the western Pacific, while further east, the projected weakening of equatorial easterlies reduces Ekman divergence and upwelling (DiNezio et al., 2009; Luo et al., 2009; Karnauskas and Cohen, 2012; Sen Gupta et al., 2012; Terada et al., 2020). Additionally, models project a shallower equatorial thermocline and associated shoaling of the EUC (Vecchi and Soden, 2007; DiNezio et al., 2009; Terada et al., 2020). As the projected shoaling is greatest in the west, this reduces the eastward upward slope of the EUC and decreases along isopycnal upwelling within the core of the EUC (Terada et al., 2020).
Previous studies suggest that the EUC projected changes are linked to source water changes, including the projected strengthening of the NGCU, weakening of the MC, and interior convergence (Luo et al., 2009; Sen Gupta et al., 2012). The future changes to EUC source waters indicate modifications in the water masses and biogeochemical properties of the EUC and, importantly, the water upwelled in the eastern Pacific (Ruggio et al., 2013; Qin et al., 2016).
However, the realistic representation of the EUC in coupled climate models may be a bottleneck to improving our understanding of future climate change. The EUC is particularly challenging to model as it is dynamically linked to the atmosphere and meridional overturning cells, which vary over a range of timescales (Johnson et al., 2002). Indeed, studies have found that global climate models show systematic biases, including weak velocities and unrealistic thinning of the EUC in the eastern equatorial Pacific (Busecke et al., 2019; Karnauskas et al., 2020; Kuntz and Schrag, 2020; Graffino et al., 2021).
This study examines the ability of climate models to simulate the strength and seasonality of the EUC and its LLWBC source waters, the MC and NGCU. We also discuss the projected changes under a warming climate scenario and investigate the mechanisms driving the future changes of the EUC, including changes in the interior and boundary convergence pathways. We compare two generations of climate models from the Coupled Model Intercomparison Project (CMIP), versions 5 and 6 and the eddy-permitting model Ocean Forecasting Australia Model version 3 (OFAM3) to identify any improvements in tropical circulation fidelity. The following section describes the climate models, data, and methods. In the results, we examine the modelled representation of the EUC and LLWBCs, including the differences between the model generations. Next, we examine the future projections of the EUC and LLWBCs in the annual mean and seasonal cycle. We also investigate the mechanisms driving the projected circulation changes, including the role of wind forcing and convergence pathways. Finally, we conclude the paper with a summary and discussion of the results.
Materials and methods
Climate models
We use monthly historical and high-emission future scenario output from 29 CMIP6 and 28 CMIP5 models (Supplementary Tables 1, 2). The CMIP6 and CMIP5 historical simulations are forced with observationally derived natural and anthropogenic forcing (Taylor et al., 2012; Eyring et al., 2016). The future projections are based on simulations forced by the high-emissions scenario RCP8.5 for CMIP5 and SSP5-8.5 for CMIP6 models. Both scenarios assume a rapid increase of greenhouse gases over the 21st century that reaches radiative forcing of approximately 8.5 W m−2 in 2100 (Taylor et al., 2012; Eyring et al., 2016). We use the highest emission scenarios to identify the most robust estimate of anthropogenically forced change. To look at mean state and projected changes, we examine the long-term monthly climatologies over 1900–2000 and 2050–2100. We use multi-decadal averages to reduce the influence of low-frequency variability and allow sufficient time for the ocean to adjust to surface forcing changes.
We use a single ensemble member from each CMIP model with the available ocean variables for each experiment archived. We bilinearly interpolate each model's wind stress to a standard 1° × 1° grid to examine wind forcing. We do not use three CMIP5 and one CMIP6 model in wind stress curl related analyses due to unrealistic meridional banding in their derived wind stress curl (excluded models indicated in Supplementary Tables 1, 2).
We also use output from OFAM3, a near-global eddy-rich (0.1°) ocean model developed by the Commonwealth Scientific and Industrial Research Organization (Oke et al., 2013). The historical OFAM3 simulation is driven by atmospheric forcing from the 6-hourly Japanese 55-year Reanalysis (Kobayashi et al., 2015) and initialized from a 20-year spin-up driven by repeated 1979 JRA-55 forcing (Zhang et al., 2016). A combined atmospheric forcing drives the future projection as follows: JRA-55 mean state (1986–2005), repeated daily-to-interannual variability, and the long-term climate change signal derived from the average of 17 CMIP5 models run under RCP8.5 (Zhang et al., 2017). The CMIP5 models were selected based on the availability of atmospheric variables to derive the air-sea flux forcing at the time the OFAM3 simulation was performed (Zhang et al., 2017). The climate change signal for each model is derived over a sliding 20-year window with reference to its 1986–2005 baseline (Zhang et al., 2017). As a result, OFAM3 projections do not reflect projected changes in seasonality (or interannual variability) present in the driving CMIP5 models. Therefore, we do not examine seasonal trends for OFAM3 in this study. For OFAM3, we compare climatologies averaged over the historical 1981–2012 and the future 2070–2101 time slices.
Observational data and reanalysis products
To validate EUC velocity and depth in the models, we compare to monthly zonal velocity from Tropical Atmosphere Ocean Triangle Trans-Ocean Buoy Network (TAO/TRITON) acoustic Doppler current profilers (ADCP) observations. We calculate the monthly climatologies using available data from ~1988 to 2016, which varies between the sites, on the equator at 147, 165, 190, 220, and 250°E. The measurements typically capture the upper 300 m, but we discard months when the deepest velocity exceeds the mean EUC core velocity (defined as ≥75% maximum velocity) at each site. We also use a mean-fit of synoptic conductivity-temperature-depth (CTD) and shipboard ADCP measurements from Johnson et al. (2002) to validate EUC velocity and transport. The mean-fit is primarily based on equatorial measurements taken over the 1990s (Johnson et al., 2002), which is shorter than the multi-decadal periods used for the TAO/TRITON observations, reanalyses, and models. Since the EUC exhibits decadal variability (Kuntz and Schrag, 2021), any comparison must be made with caution. As such, we generally compare the reanalyses and models to the TAO/TRITON observations rather than the Johnson et al. (2002) mean-fit. Additionally, we compare EUC and LLWBC transport and seasonality to several observational estimates quoted in past studies (compiled in Supplementary Table 3).
We also compare the CMIP models to five ocean reanalysis products, which synthesize observational data via data assimilation. These are the CMCC Global Ocean Reanalysis System (C-GLORS), Ocean Reanalysis System 5 (ORAS5), Global Ocean Data Assimilation System (GODAS), Simple Ocean Data Assimilation (SODA) ocean/sea ice reanalysis and the German contribution to the Estimating the Circulation and Climate of the Ocean project (GECCO3). The reanalysis climatologies are calculated using data over 1993–2018 for C-GLORS, ORAS5 and GODAS, 1980–2017 for SODA, and 1980–2018 for GECCO (Supplementary Table 4).
Transport calculations
We calculate oceanic transport using velocity in the flow direction within a fixed depth and width range, based on the long-term annual mean velocity. We define EUC transport as the eastward velocity between ±2.5° and 0–350 m, similar to the previous studies (Sen Gupta et al., 2012; Karnauskas et al., 2020). For most models and reanalysis products, these boundaries amply capture the EUC core without including nearby westward flow, such as the South Equatorial Current (SEC; Supplementary Figures 1–4). To find EUC maximum velocity and depth, we reduce the latitude range to ±2.2°. As the LLWBCs generally follow the coastlines, we integrate meridional velocity in the upper 750 m between the coast and a vertically uniform distance offshore (4° for the MC; 7° for the NGCU; Supplementary Figures 5–8). We tested the sensitivity of transports to integration boundaries and velocity criteria. We find the magnitude of transport varies by a small amount with definition; however, our conclusions are qualitatively unchanged (Supplementary Figures 9A–C).
To examine Ekman divergence and interior basin convergence in the CMIP ensembles, we calculate meridional transport across the Pacific at ±8° (east of the LLWBCs). We derive the meridional Ekman transport (VEk) using the zonal wind stress (τx), and calculate the interior convergence (Vint) as the net transport above 500 m minus the Ekman transport, such that
where ρ0 is the reference water density (= 1,025 kg m−3) and f is the Coriolis frequency. This definition captures meridional transport at EUC depths in a way that is robust to model differences in Ekman transport depths and structural projected changes (e.g., isopycnal and LLWBC depth changes). For comparison, the net transports of interior and LLWBCs at depths of 0–60 m and 60–300 m in reanalysis products, OFAM3 and CMIP ensembles are listed in Supplementary Table 5.
We also derive vertical transport into the upper 500 m of the tropical Pacific using continuity. For this, we add the transport along ±8° and the along the western border of the Pacific. The west border includes the transport between Borneo and Mindanao and the ITF. We define the ITF as the transport between the western-most longitude of Australia (~113°E) and, depending on the model topography, Borneo or Indonesia (Figure 1). There are regions where unaccounted transport may enter or leave this domain in some models (e.g., the Torres Strait) and we do not account for the vertical transport across the ocean surface related to evaporation and precipitation. We exclude the output of several models from the budget with unrealistic interior or western border transports (excluded models listed in Supplementary Tables 1, 2).
Statistical analysis
We typically quote CMIP multi-model median (MMM) metrics and the associated ensemble interquartile range (IQR). We determine the significance (p ≤ 0.05) of projected changes using the Wilcoxon signed-rank test and the differences between CMIP generations using the Mann–Whitley rank test. We measure the strength and direction of a monotonic relation between the two variables by applying the non-parametric Spearman rank correlation (r), where the associated significance is based on a two-tailed t-test. Inferences based on these tests may be overly confident, particularly as the assumption of sample independence is not fully satisfied (e.g., CMIP models are not independent of each other and share common components).
Results
Mean state representation
In this section, we examine the model representation of the EUC, MC, and NGCU in comparison to observations and reanalysis products. We examine maximum velocity and the corresponding depth, as well as the long-term mean and seasonal cycle of transport.
Equatorial Undercurrent
The EUC typically sits between ±2° latitude and reaches a maximum of ~1.15 ms−1 near 240°E in the TAO/TRITON and Johnson et al. (2002) observational climatologies (Figure 2A). There is a broad spread of maximum EUC velocities in reanalysis products (Figure 2A). Moreover, C-GLORS and GODAS exhibit good agreement with the observations across the basin, and SODA overestimates velocities in the eastern basin (Figure 2A). On the other hand, ORAS5 and GECCO3 are consistently weak, particularly around the central and eastern Pacific–where the EUC is strongest (Figure 2A). The CMIP ensembles also systematically underestimate EUC maximum velocities in the central and eastern Pacific compared to observations but lie within the broad range of reanalysis estimates (Figure 2A).
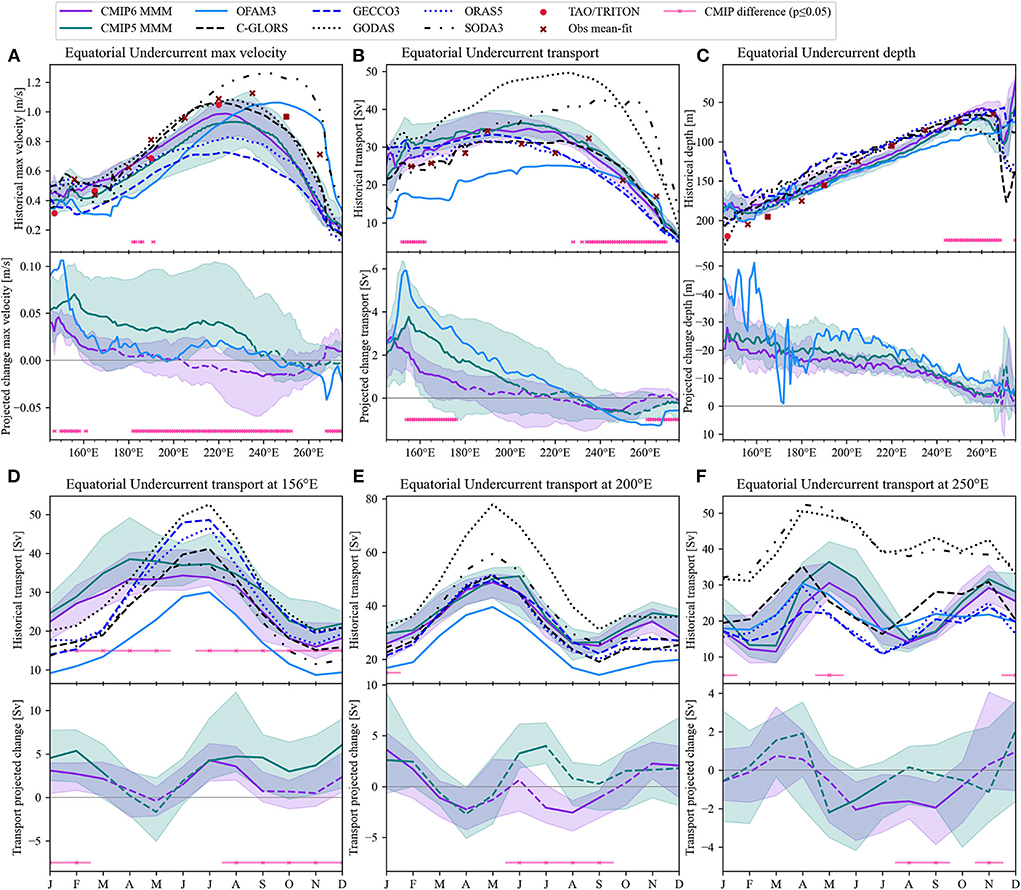
Figure 2. Equatorial Undercurrent mean state and the future changes. The mean state (upper panels) and projected change (lower panels) for (A) maximum EUC velocity, (B) transport, (C) depth of maximum EUC velocity, and monthly mean transport at (D) 156°E, (E) 200°E, and (F) 250°E. Shown are CMIP6 (purple) and CMIP5 (green) multi-model median (MMM; solid lines) and interquartile range (shaded), OFAM3 (blue lines), reanalysis products (black/blue broken lines), TAO/TRITON moorings (red circles) and the Johnson et al. (2002) observational mean-fit (dark red crosses). In lower panels, dashed lines indicate where MMM projected changes are not significant. Pink crossed lines indicate where CMIP5 and CMIP6 differences are significant.
The slow velocity bias in CMIP6 shows some improvement over the western and central Pacific (west of ~230°E), but the differences to CMIP5 are only significant at a few longitudes (Figure 2A). OFAM3 shows a slow bias over the western and central Pacific (west of ~240°E), but the maximum velocity peaks further east than observed, with a fast bias before reaching the Galapagos Islands (Figures 1, 2A). As the EUC does not always sit on the equator, these primarily equatorial observations may underestimate the maximum velocities, which suggests the slow (fast) biases may be larger (smaller) than indicated (Johnson et al., 2002; Leslie and Karnauskas, 2014).
The transport of the EUC in C-GLORS, GECCO3 and ORAS agrees well with observations, with weaker transports in GECCO3 and ORAS than in C-GLORS in the eastern Pacific (Figure 2B). On the other hand, GODAS and SODA3 strongly overestimate transport over the central and eastern Pacific (Figure 2B, Table 1). The larger transports in these two reanalysis products are related to a less pronounced eastward “thinning” of the EUC (Supplementary Figure 3). Also, GODAS and SODA3 use the same ocean model but do not use the same surface flux forcing or resolution that explains the larger transports (Supplementary Table 4). In CMIP6 and CMIP5, the MMM transports are systematically overestimated in the western Pacific, with some improvement in CMIP6 (Figure 2B). The CMIP MMM transports are in better agreement with observations further east–in the region where there is a weak bias in the velocity (Figures 2A,B).

Table 1. Summary of historical and projected transport changes.
In OFAM3, the EUC transport is generally lower than in the Johnson et al. (2002) mean-fit (Figure 2B). OFAM3 is also weaker than the CMIP6 and CMIP5 MMMs in the western Pacific, despite relatively similar maximum velocities because the EUC is much broader in the coarse resolution models (and reanalysis products). The relatively low EUC transports in this run of OFAM3 may be related to the JRA-55 bulk formula atmospheric forcing used since the previous ERA-Interim forced OFAM3 run had stronger equatorial easterlies (Supplementary Figure 10) and EUC transport (Qin et al., 2016).
The depth of the EUC (defined as the depth of maximum EUC velocity) rises eastward from about 200–75 m in observations (Figure 2C), typically following the thermocline (Johnson et al., 2002). We find reanalysis products are systematically shallow in the west compared to observations (Figure 2C). Similarly, in both CMIP model ensembles, the EUC is shallower than the observations to the west of the dateline, while broadly consistent with observations in the east (Figure 2C). The EUC in CMIP6 is significantly shallower (MMM difference of 21 m at 265°E) than in CMIP5 east of ~240°E (Figure 2C). In OFAM3, the EUC sits near the observed depth over the western and central Pacific and is too deep in the east, leading to a weaker east-west gradient (Figure 2C).
The EUC has a robust seasonality in observations, reanalysis products, and models. In observations, the EUC is strongest around May in the eastern Pacific, peaking later in June over the central and western Pacific (Johnson et al., 2002) regions. The annual cycle peak is, in part, associated with a weakening of equatorial easterlies that reduces the surface SEC and the westward momentum imparted on the EUC (Kessler, 2006). The westward-propagating trade wind seasonality also influences the EUC by triggering equatorial Kelvin and Rossby waves (Kessler, 2006). The seasonal timing of EUC transport is reproduced in the reanalysis products, with annual ranges of 31–47 Sv at 200°E (Figure 2E). In CMIP6 and CMIP5, the seasonal intensification in the western basin (at 156°E) broadly occurs over April–July, compared to the observed June peak (Figure 2D). The large MMM transport and inter-model spread is likely influenced by the seasonality of the eastward North Equatorial Counter Current, which is included within the EUC transport definition around April in some models. The CMIP MMM seasonality in the central Pacific is broadly consistent with the observations and reanalysis products, but the seasonal peak occurs a month later than reanalysis products in the eastern Pacific (Figures 2E,F). The large MMM transport and inter-model spread is likely influenced by the seasonality of the eastward North Equatorial Counter Current, which is included within the EUC transport definition around April in some models. The monthly transport in the western Pacific is significantly weaker in CMIP6 (Figure 2D). However, the seasonality timing did not significantly change between the model generations (Figures 2D–F).
Mindanao Current
In the northwestern Pacific, the MC travels southward along the Philippines coastline (Figure 1). Part of the MC feeds into the Indian Ocean via the ITF (Gordon, 1986; Fine et al., 1994), while part enters the North Equatorial Counter Current and EUC in the far western basin (Grenier et al., 2011; Qin et al., 2015; Wang et al., 2019; Zhou et al., 2021). Based on the annual mean climatologies, we calculate the magnitude of MC transport as the southward meridional velocity at 8°N, within 4° (~440 km) of the coasts and between the depths of 0–750 m (Supplementary Figures 5, 6). Except for GECCO, which has a weak MC (−12 Sv; negative values signify a southward flow), the other reanalysis range between −25 and −32 Sv (Table 1). This lies above the observational estimate of −18 to −25 Sv (Wijffels et al., 1995; Schönau et al., 2015; Schönau and Rudnick, 2017). Most CMIP models exceed the observed upper bound of −25 Sv, with IQR of −26 to −32 Sv in CMIP6 and −25 to −36 Sv in CMIP5 (Table 1). The transport MMM and IQR in CMIP5 and CMIP6 are very similar, with no significant difference in the mean transports (Table 1). The simulated MC transport in OFAM3 of −23 Sv is within the observational range (Table 1).
Observational studies find the MC is strongest from March to May and weakest from September to November, linked to the strength of the North Equatorial Current and position of its bifurcation (Qiu and Lukas, 1996; Ren et al., 2018). There is a lack of observed annual range transport estimates, but previous model estimates of the annual range are 9–10 Sv (Qiu and Lukas, 1996; Wattimena et al., 2021). The annual range in GODAS (11 Sv) and C-GLORS (8.2 Sv) are broadly consistent with past model estimates, while the annual range is much weaker in GECCO3 (2.4 Sv), SODA3 (4.1 Sv) and ORAS5 (5.2 Sv; Figure 3A). Excluding GECCO3, the reanalyses show a March–May peak and a September trough (Figure 3A) that is broadly consistent with the observed seasonality. The CMIP6 MMM peak around July is inconsistent with both observational estimates and reanalysis products (Figure 3A). The CMIP5 MMM peak around May is in better agreement with observations, but most individual models and the IQR show the transport peaks in July (Figure 3A). The CMIP6 MMM is significantly weaker around the observed peak; otherwise, the seasonality is not significantly different between CMIP ensembles (Figure 3A). The MC seasonality in OFAM3 is consistent with the observed March–May peak and September–November trough (Figure 3A). However, the annual range of 3.5 Sv is smaller than the range of model estimates from past studies and four of the five reanalyses (Figure 3A).
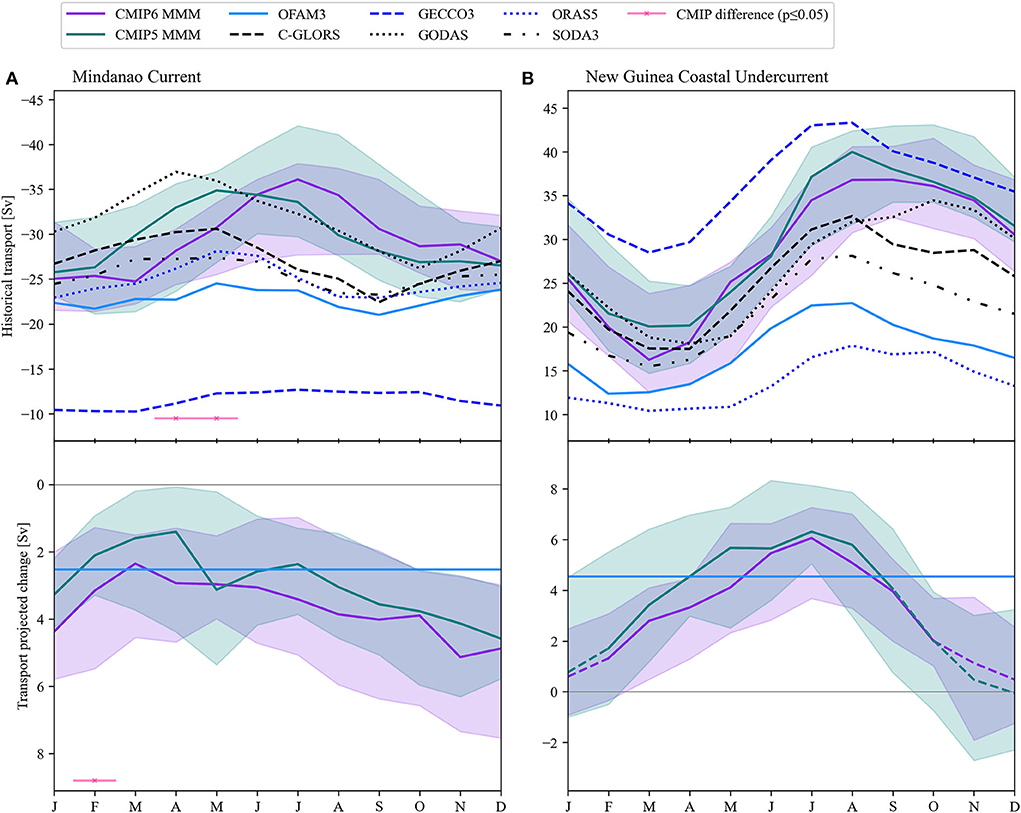
Figure 3. Monthly transport of the (A) Mindanao Current and (B) New Guinea Coastal Undercurrent in the historical scenario (upper panels) and projected change (lower panels). Shown are CMIP6 (purple) and CMIP5 (green) multi-model median (MMM; solid lines) and interquartile range (shaded), OFAM3 (blue lines) and reanalysis products (black/blue broken lines). MMM projected changes that are not statistically significant are represented by dashed lines. Pink crossed lines indicate where CMIP5 and CMIP6 differences are statistically significant. In (A), southward direction is represented by negative values (y-axis reversed), and a corresponding positive projected change indicates a weakening.
New Guinea Coastal Undercurrent
In the southwestern tropical Pacific, the NGCU flows through the Solomon Sea and primarily continues to the Equatorial System through the Vitiaz Strait and Solomon Strait (Figure 1; Grenier et al., 2011; Gasparin et al., 2012). The topography of this region is not well-resolved and tends to vary across the CMIP models (Supplementary Figure 11). As such, we examine the combined LLWBC transport to the east of New Guinea before it diverges through the straits–at 8°S in the Solomon Sea (Figure 1). Specifically, we define NGCU transport as the northward meridional velocity within 7° (~770 km) of the New Guinea coast and above depths of 750 m. This definition encompasses the core of the northward flow despite very different simulated NGCU structures (Supplementary Figures 7, 8).
The long-term observational estimates of NGCU transport passing through the Solomon Sea varies from 15 to 29 Sv (Cravatte et al., 2011; Gasparin et al., 2012; Kessler et al., 2019). The NGCU transport in four reanalyses (14–27 Sv) is generally consistent with the large range of observations, while the transport in GECCO3 is much larger than observed (36 Sv). NGCU transport in the CMIP ensembles is at the high-end of the observed range: IQR of 24–32 Sv in CMIP6 and 26–36 Sv in CMIP5 (Table 1). The considerable variations in bathymetry and NGCU structures in the models likely contribute to the large range of transport estimates (Supplementary Figures 7, 8). OFAM3 estimates 17 Sv of NGCU transport, which is within the range of in situ measurements (Table 1).
Seasonal variability in the Solomon Sea is related to basin-wide wind forcing but complicated by the interaction of Rossby waves with the coastlines (Melet et al., 2010). The annual gyre spin-up increases equatorward transport around 8°S from August to October, with the weakest transports around December to February (Melet et al., 2010; Cravatte et al., 2011; Alberty et al., 2019; Kessler et al., 2019). This seasonality is generally reproduced in the reanalysis products, OFAM3 and CMIP ensembles, although the CMIP ensembles show a broader peak from August to November (Figure 3B). The annual range of the NGCU in observations is 10 Sv (Kessler et al., 2019) and estimates from reanalysis products vary between 7.5 and 16 Sv (Figure 3B). The NGCU annual range is similar to observations in OFAM3 (10 Sv) but much larger in the CMIP ensembles: 19 Sv (15–25 Sv) in CMIP6 and 23 Sv (15–29 Sv) in CMIP5 (Figure 3B).
Future projections
Equatorial Undercurrent
In the future projections, there is a consistent enhancement of EUC maximum velocity in the far western basin, where almost all CMIP6 and CMIP5 models project an acceleration around 150°E (Figure 2A). The MMM maximum velocity is projected to increase to the west of ~240°E in CMIP5, while the enhancement in CMIP6 is lower in magnitude and limited to the west of ~180°E (Figure 2A). There is a robust projected shoaling of the EUC in both CMIP ensembles, with the projected shoaling largest in the west (~25 m CMIP6 MMM) that decreases eastward (Figure 2C). Similar to maximum velocity, the EUC transport is projected to strengthen in the western Pacific, and the change is lower in both magnitude and extent in the more recent CMIP generation (Figure 2B).
There is a significantly lower model spread in velocity and transport projections around the western and central Pacific in CMIP6 (Figures 2A,B), as there are less extreme outlier models that project a much stronger EUC enhancement (e.g., CMIP5 models NorESM1-ME and NorESM1-M). The previous studies found potential emergent constraints on CMIP projections (e.g., Sen Gupta et al., 2016, 2021; Stellema et al., 2019): if the strength of the historical and projection is related across the models, then the observational range can be used to constrain the projections. For the EUC, however, no such inter-model relationships are evident in the CMIP6 or CMIP5 ensembles.
The projected changes in EUC transport in the CMIP ensembles are not significant in all months (Figures 2D–F). In the far western Pacific, the magnitude of the projected changes varies considerably by season in both CMIP5 and CMIP6 (Figure 2D). Specifically, most models project a significant increase in transport from December to March and July to September. Further east, the projected changes are only significant in some months of the year (Figures 2E,F).
In OFAM3, the EUC transport is projected to strengthen in the west and weaken in the far east (Figures 2A,B). Over the western and central Pacific, OFAM3 projects a relatively large strengthening of EUC transport despite small or negligible increases in maximum velocity, which suggests structural (e.g., widening) and source water changes (Figures 2A,B). Similar to CMIP6 and CMIP5, the EUC is projected to be shallower, particularly in the western Pacific (Figure 2C). The projected changes of the EUC are typically larger in magnitude than the CMIP ensembles. However, we emphasize that the projected change in OFAM3 is not directly comparable to the CMIP ensembles due to differences in their climatology time slices (OFAM3: 2070 to 2101; CMIP 2050 to 2101).
Mindanao Current
The MC transport is projected to weaken over the last half of the 21st century in most models (Figure 3A). Specifically, the MC decreases by 4.2 Sv (1.6–5.4; −14%) in CMIP6, larger than the 2.7 Sv (1.9–4.5 Sv; −9%) weakening in CMIP5 (Table 1). The OFAM3 also projects a weakening of the MC, with a reduction of 2.5 Sv (−11%; Table 1). Most of the weakening is associated with transport changes below the core of the MC (~200 m), which results in an overall shoaling of the current (Supplementary Figure 12B). As with the EUC, there is no relationship between the strength of historical transport and the projected change across each CMIP ensemble. The CMIP ensembles show a similar seasonality in the projected changes, with the largest MMM decrease around October–December and the smallest decrease around February–April (Figure 3A). However, there is low confidence in the seasonality projections because the CMIP ensembles poorly represent the observed MC seasonality (Figure 3A).
New Guinea Coastal Undercurrent
All but two of the 28 CMIP6 models project a strengthening of the NGCU, with a MMM increase of 2.6 Sv (1.6–4 Sv), only slightly smaller than the CMIP5 MMM of 3.1 Sv (1.3–5.5 Sv; Table 1). As with the EUC, we find a larger magnitude projected change of the NGCU (4.6 Sv) in OFAM3 (Table 1). There is a strong and consistent seasonality of the projected change in both CMIP ensembles (Figure 3B). Specifically, the transport strengthens between February and September that is largest around June–August (Figure 3B). In contrast to the MC, the projected strengthening is surface intensified with negligible change below ~250 m (Supplementary Figure 12D), which is consistent with CMIP3 projections (Sen Gupta et al., 2012). Interestingly, we found that CMIP6 models with weaker historical transport (i.e., closer to the observational range) tend to project a more substantial intensification (r = −0.46, p = 0.01). This provides a possible emergent constraint for the projections, which suggests that higher estimates of the future NGCU strengthening may be more likely.
Mechanisms driving projected changes
Certain factors that may help explain the EUC projections are investigated in this section. In particular, we investigate the role of STC projected changes, including the equatorial and off-equatorial wind forcing and the transport of the LLWBCs, interior convergence and Ekman divergence.
Low-latitude western boundary currents
The LLWBCs are the largest source of EUC waters in the western Pacific, with the largest contribution from south of the equator (Grenier et al., 2011; Qin et al., 2015). Given the strong projected EUC intensification west of ~165°E, the injection of water from the NGCU is potentially an important factor in the western intensification. Indeed, the NGCU intensification (2.6, 3.1, and 4.6 Sv in CMIP6, CMIP5, and OFAM3, respectively) is of similar magnitude to the EUC intensification at 155°E (2.1, 3.8, and 5.3 Sv, respectively). Within the ensembles, however, inter-model differences in NGCU and EUC transport projections in the western basin are not significantly related, despite a significant historical relationship (Supplementary Figures 13A,B). The varying impact of the NGCU increase in models may be explained by confounding model differences in other EUC-related changes, such as the structural differences and additional source water changes (e.g., less MC water contribution).
In addition, the differing model representations of bathymetry in the Solomon Sea may influence NGCU transport to the EUC (Melet et al., 2010). In particular, many coarse resolution models do not resolve a pathway through the Vitiaz Strait and artificially force NGCU waters to travel further east near the Solomon Strait (4 CMIP6 and 15 CMIP5 models; Supplementary Figure 11). As the main NGCU pathways to the EUC (Grenier et al., 2011), different upstream paths through the Vitiaz Strait and Solomon Strait may be playing an important role in the EUC enhancement and could contribute to inter-model differences. Interestingly, CMIP models that resolve both straits tend to project the largest strengthening through the Vitiaz Strait than further east, whereas the reverse is seen in OFAM3 and models with a closed Vitiaz Strait (Supplementary Figure 11).
The northwestward pathway from the Vitiaz Strait to the EUC is less direct than the path further east near the Solomon Islands (Melet et al., 2010; Grenier et al., 2011). Therefore, an increase in transport around the Solomon Islands may contribute a more direct increase to EUC transport than via the Vitiaz Strait pathway along New Guinea. In agreement, we find that the longitude where the EUC transport increase is greatest coincides with the Vitiaz Strait in CMIP6 (~148°E) and Solomon Strait in CMIP5 and OFAM3 (155°E; Figures 1, 2B). Additionally, all of the CMIP6 models with a closed Vitiaz Strait also project an EUC increase that is above the IQR, while 5 of the 8 CMIP5 models that resolve both straits project an EUC change below the IQR around 155°E (not shown). As such, this may explain why inter-model differences in the NGCU increase are not linearly related to the EUC increase in the western Pacific (Supplementary Figure 13B) and why the EUC change in CMIP6 is smaller than in OFAM3 (Figure 2B). It also suggests the larger EUC change in CMIP5 than CMIP6 is related to an artifact of coarse model resolution, which coincidently resembles the response in the eddy-permitting model.
The MC weakening, on the other hand, is inconsistent with the EUC enhancement. Variations in MC and EUC transports are not significantly related within the CMIP6 ensemble in the mean state or future projections (Supplementary Figures 13C,D). This is not surprising because observational studies suggest that a large fraction of the MC flows to the ITF (Gordon and Fine, 1996; Kashino et al., 2001). Consistent with this, the ITF is also projected to weaken in CMIP6 by a multi-model mean of 2.8 Sv (from −12 Sv; Figure 4), similar to the previous studies (Sen Gupta et al., 2016, 2021; Feng et al., 2018; Stellema et al., 2019). Indeed, we find that CMIP6 models which project a greater MC weakening also tend to project a greater ITF reduction (r = 0.48, p = 0.009), although no equivalent relationship is found in the CMIP5 ensemble (Supplementary Figures 13D,F). Previous studies found the ITF weakening is linked to a reduction of deep waters upwelled over the Pacific in CMIP5 models (Sen Gupta et al., 2016) and OFAM3 (Feng et al., 2018). To examine the contribution of vertical transport from below the EUC, we construct a closed transport budget (see Transport calculations section and Figure 4) and derive upwelling from continuity in the CMIP models. Consistent with past studies, we find upwelling through the 500 m layer is projected to weaken (Figure 4). The combination of these results suggests the EUC compensates for most of the NGCU increase, but only a fraction of the MC transport decrease (the remainder flows onto the ITF).
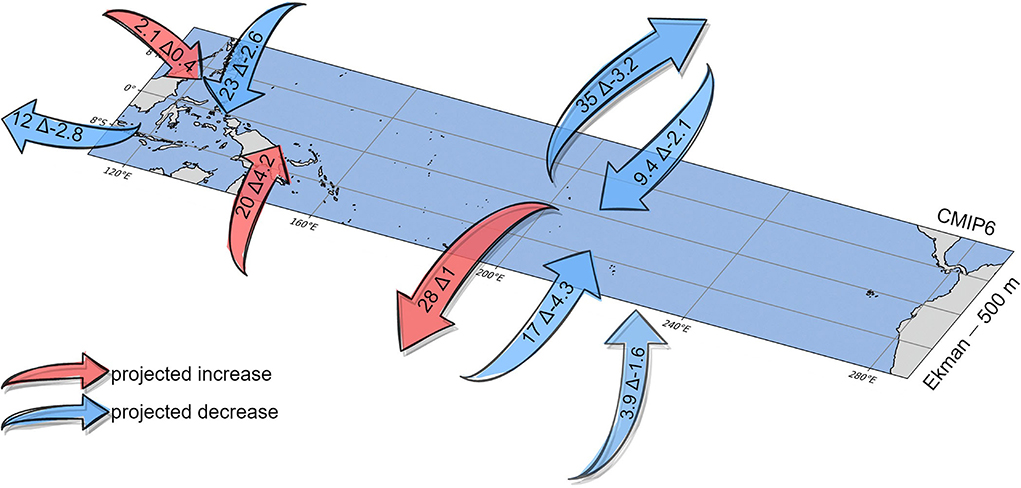
Figure 4. CMIP6 multi-model mean interior and Ekman transport. Arrows indicate the direction of flow in the historical scenario and arrow colors indicate the sign of the projected changes. Transport values (in Sv) are given inside each arrow in the form: historical Δ projected change. The interior transport is calculated from the edge of the LLWBCs. The LLWBCs, ITF and sum of transport through the remaining straits are integrated between 0 and 500 m.
While we do not explicitly examine this feature, we also calculated the transport from the South China Sea to the Celebes Sea to account for all transport entering or leaving the budget. This transport is projected to significantly increase by a multi-model mean of −0.8 Sv (from −3.1 Sv) in CMIP6 and −0.3 Sv (from −3.1 Sv) in CMIP5. This is surprising, considering that most nearby regions examined here are projected to weaken.
Equatorial wind stress
There is a consistent projected decrease in the equatorial easterlies that is largest around the central and eastern basin (e.g., CMIP6 MMM decrease of 13% at 225°E; Figure 5A), similar to CMIP3 and CMIP5 model projections (Sen Gupta et al., 2012; Terada et al., 2020). Terada et al. (2020) found the projected weakening of equatorial easterlies is consistent with a reduction of Ekman divergence and upwelling, as well as a flatter east-west EUC slope in CMIP5 models. In agreement, we find models with a larger projected weakening of wind stress also project a greater shoaling of the EUC over most of the Pacific (Supplementary Figure 14). However, the weaker equatorial winds would act to weaken the east-west pressure gradient and the eastward intensification of the EUC, which cannot explain the western Pacific EUC enhancement (Luo et al., 2009; Sen Gupta et al., 2012). Indeed, we do not find the historical or projection differences among the CMIP models in basin-wide averaged equatorial easterlies are significantly related to EUC transport in the western Pacific.
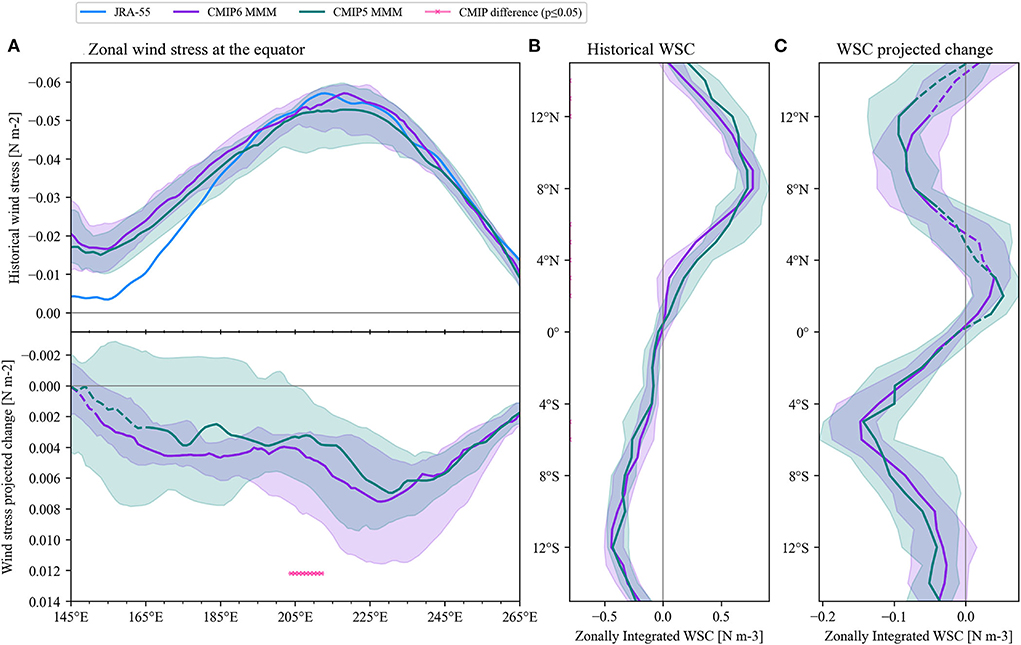
Figure 5. Zonal wind stress and wind stress curl. (A) Zonal wind stress at the equator (mean ±2°) climatological historical mean (upper panel) and projected change (lower panel) as a function of longitude. Wind stress curl zonally integrated over the Pacific for the (B) historical mean and (C) projected change. Wind forcing estimates are shown for CMIP6 (purple) and CMIP5 (green) multi-model median (MMM; solid lines) and interquartile range (shaded) and the JRA-55 reanalysis product (blue lines). MMM projected changes that are not statistically significant are represented by dashed lines. Pink crossed lines indicate where differences between CMIP5 and CMIP6 are statistically significant. In (A), easterly direction is represented by negative values (y-axis reversed), and a corresponding positive projected change indicates a weakening.
Off-equatorial wind stress curl
The off-equatorial wind stress curl modulates the strength of LLWBCs on multiple time scales, as it affects the strength of the potential vorticity barrier that directs water converging onto the equator (Johnson and McPhaden, 1999; Lee and Fukumori, 2003). Indeed, we find historical LLWBC transport differences across models co-vary with differences in wind stress curl (Supplementary Figures 15A,C).
The projected weakening of equatorial easterlies is bordered by a weakening of the northeasterly trades and a strengthening of the southeasterly trades. Therefore, the off-equatorial wind stress curl is projected to decrease to the north and increase to the south of the equator (Figures 5B,C). Sen Gupta et al. (2012) suggest that similar LLWBC projections in CMIP3 are consistent with the off-equatorial wind stress curl driving a redistribution of interior and boundary convergence. In agreement, the wind stress curl anomalies are consistent with the transport projected changes of both LLWBCs in CMIP6 and CMIP5 models. Specifically, models that simulate a larger projected increase in wind stress curl (mean 8 ± 1°S) also simulate a larger projected increase of NGCU transport (CMIP6 r = 0.81, p < 0.001; CMIP5 r = 0.95, p < 0.001; Supplementary Figure 15B). Similarly, models with larger projected decreases in wind stress curl (mean 8±1°N) tend to have a larger projected decrease of MC transport (CMIP6 r = 0.69, p < 0.001; CMIP5 r = 0.68, p < 0.001; Supplementary Figure 15D). This suggests the basin-wide changes in wind forcing are driving the MC weakening and NGCU strengthening in the models.
Ekman and interior transport
The EUC is a part of the overturning circulation of the tropical and subtropical cells: where interior and boundary thermocline water converge into the EUC and diverge at the surface by Ekman transport. Here, we examine the flow into and out of the tropical Pacific in the upper 500 m.
We first examine the Ekman transport changes, based on the zonal wind, at 8°N and 8°S. The Ekman divergence helps us understand the strength of STCs in the Ekman layer (Klinger and Marotzke, 2000). However, it will not necessarily match the amount of water upwelling and diverging away from the EUC, as some may recirculate closer to the equator within the tropical cells (Johnson and McPhaden, 1999). In CMIP6, there is a multi-model mean net projected decrease of divergence (i.e., the sum of Ekman transport at 8°N and 8°S) of 2.2 Sv (−4% from −62 Sv; Figure 4). At 8°N, the total northward Ekman transport is projected to weaken by −3.2 Sv from 35 Sv. On the other hand, the southward Ekman transport increases by −1 Sv (from −28 Sv; Figure 4), with some weakening in the eastern Pacific. In contrast to CMIP6, there is no significant divergence change in CMIP5 because the MMM decrease of northward Ekman transport is compensated by the increase in southward Ekman transport (both 1.9 Sv). This is reflected by the different amounts of model agreement in CMIP6 and CMIP5. All CMIP6 models agree on the divergence decrease, compared to 14 of 25 CMIP5 models. Interestingly, the model disagreement is primarily in the Southern Hemisphere for CMIP6 and in the Northern Hemisphere for CMIP5.
The interior thermocline and western boundary convergence is calculated here as the net transport between 0–500 m at ±8°, with Ekman transport removed (see Transport calculations section). There is a net projected decrease in the convergence of −4.8 Sv (−7% from 69 Sv) in the CMIP6 multi-model mean. The weakening is predominantly from the north (−4.7 Sv), while there is a small net decrease from the south (−0.1 Sv). Here, all but one CMIP6 model agree on a weakening of interior transport from the north, while, like the Ekman transport, only 60% of CMIP5 models project a weakening. Studies suggest that the variability of interior thermocline and western boundary flow tend to approximately compensate for each other across a range of timescales (McPhaden and Zhang, 2002; Lee and Fukumori, 2003). Consistent with this, we find the NGCU increase (0–500 m, 4.2 Sv) is mostly compensated by a decrease in south interior transport (−4.3 Sv) in the CMIP6 multi-model mean (Figure 4). On the other hand, both the MC (−2.6 Sv) and north interior transport (−2.1 Sv) are projected to weaken (Figure 4).
While there are many similarities between the CMIP6 and CMIP5 ensembles, the tropical budget suggests some important differences in the projected changes (Figure 2B). The CMIP6 ensemble projects a significantly (p = 0.04) larger magnitude weakening of convergence from the north than CMIP5 (−4.7 Sv in CMIP6; −2.5 Sv in CMIP5; Figure 4; Supplementary Figure 16). This is broadly consistent with the weaker CMIP6 EUC transport increase in the western Pacific (Figure 2B). In addition, CMIP6 projects a larger decrease in interior transport from the south (−4.3 Sv in CMIP6; −2.7 Sv in CMIP5). The larger magnitude of weakening is not compensated by the NGCU increase, which is similar (4.2 Sv in CMIP6; 3.9 Sv in CMIP5). However, these multi-model mean boundary and interior transport differences are not statistically significant between CMIP6 and CMIP5. In OFAM3, the larger western Pacific EUC enhancement appears to relate to a larger NGCU increase, combined with a smaller MC decrease (Supplementary Figure 17). Otherwise, the projected divergence and interior convergence changes in OFAM3 are relatively similar to the CMIP ensemble means (Supplementary Table 5).
Summary and discussion
This study examines the representation and the high-emissions future projections of the Pacific EUC and its source waters using two generations of CMIP ensembles and an eddy-permitting ocean model. In particular, we examine the multi-decadal mean and seasonality of the EUC, MC, and NGCU across models. We assess the model representation in comparison to observational data and five ocean reanalysis products. We also investigate the mechanisms driving EUC projected changes, focusing on the role of LLWBC and interior thermocline convergence. In summary, our results provide the following new insights:
• There are some minor improvements of multi-decadal mean EUC representation in CMIP6 models, particularly in model spread, and the seasonality of the EUC and MC is poorly represented in CMIP5 and CMIP6 models.
• The high-resolution ocean model simulates a more realistic seasonality of the EUC and LLWBCs, but the strength of the EUC is weaker than observations and the CMIP ensembles.
• There is a projected enhancement and shoaling of the EUC and NGCU and weakening around the thermocline of the MC, south and north interior convergence, which is generally consistent with OFAM3 projections and the previous studies (e.g., Luo et al., 2009; Sen Gupta et al., 2012).
• The projected NGCU intensification in the CMIP ensembles is strongest around the time of its seasonal peak, while the seasonality of the MC weakening is less pronounced and highly uncertain due to the poor historical representation.
• The projected EUC enhancement is weaker in CMIP6 than CMIP5 and strongest in OFAM3, and these inter-model differences are not related to the differences in mean historical current strength.
• The ensembles mean LLWBC projections did not significantly change between the CMIP generations, and similar to the EUC, the NGCU intensification is stronger in OFAM3 than CMIP ensembles.
• The EUC changes are likely related to a combination of stronger and weaker source waters, since the strength of individual source or wind forcing changes could not individually explain inter-model differences across CMIP ensembles.
The maximum velocity of the EUC in CMIP ensembles is systematically weak over the central and eastern Pacific (Figure 2A). Several previous studies also found this weak bias, which they find may be linked to low model resolution (Karnauskas et al., 2012; Busecke et al., 2019; Kuntz and Schrag, 2020). Despite an overall increase in model resolution (Supplementary Tables 1, 2), we do not find that velocity strength significantly improved over this region in CMIP6 (Figure 2A). Although, Karnauskas et al. (2020) identified minor improvements in EUC velocity (1990's mean) to the east of ~200°E in CMIP6. Similar to previous studies (e.g., Karnauskas et al., 2020), we do not find the systematically weak EUC velocity translates into weak transports in the CMIP ensembles (Figure 2B). We find that EUC transport improved around the western and eastern Pacific in CMIP6, but both MMM transports are generally too strong in the western Pacific (Figure 2B). The depth of the EUC to the west of the dateline is typically too shallow in both ensembles, which did not significantly improve in CMIP6 (Figure 2C). EUC seasonality in CMIP ensembles compares well with reanalysis products around the central Pacific (Figure 2E). However, the ensembles do not reproduce the observed east-west variation in seasonality (Figures 2D–F; Johnson et al., 2002). The CMIP6 and CMIP5 ensembles typically simulate LLWBC transports around the high end of the observed range (Table 1), and they could not reproduce the observed seasonality of the MC (Figure 3A).
In the high-resolution ocean model OFAM3, EUC transport and velocity (to a lesser extent) are too weak over the western and central Pacific and peaks too far to the east (Figures 2A,B). This may be partly related to the atmospheric forcing used, as a previous model version is driven by stronger equatorial easterlies (Supplementary Figure 10) produced more realistic EUC strength (Qin et al., 2015). EUC seasonality and LLWBCs are generally well represented in OFAM3 (Table 1; Figures 2D–F, 3A,B).
In the future climate scenarios, the EUC is projected to be stronger in the western Pacific in CMIP6, CMIP5 and OFAM3 (Figures 2A,B). We investigate several wind-driven mechanisms that might explain the EUC projections and the differences across models. The transport along the EUC is primarily driven by the equatorial winds and off-equatorial wind stress curl (Johnson and McPhaden, 1999; Lee and Fukumori, 2003). As described by Sen Gupta et al. (2012), the projected wind stress curl strengthening in the Southern Hemisphere (Figure 5C) is consistent with an intensification of the NGCU at the boundary and a weakening of interior thermocline convergence (Figure 4). This redirection of convergence pathways explains the EUC enhancement in the western Pacific that is gradually balanced by weaker interior thermocline convergence further east (Figures 2A,B). In addition, we find the wind stress curl weakening in the Northern Hemisphere is consistent with an overall weakening of the MC, interior convergence and Ekman divergence (Figure 4). However, the compensation for each weakening source by the EUC is unclear. In particular, the MC weakening likely contributes to the projected ITF weakening to a greater extent than the EUC. Additionally, the projected weakening of equatorial easterlies (Figure 5A) is also expected to drive a weakening of the EUC related to a reduction of the east-west pressure gradient. However, inter-model differences in the basin-wide weakening of equatorial easterlies are not significantly related to the EUC projections in the CMIP ensembles.
While the projections and driving mechanisms are qualitatively similar across the CMIP model generations and the eddy-permitting model, we find a number of differences in the magnitude of projected changes. The projected EUC enhancement in the west Pacific is weaker in CMIP6 than the previous generation, but strongest in the eddy-permitting model, which is not related to differences in the simulated historical strength of the EUC (Figures 2A,B). The stronger EUC enhancement in the eddy-permitting model is consistent with the larger projected NGCU strengthening combined with a smaller weakening of MC and interior source waters. While it is not possible to directly compare CMIP ensembles and OFAM3 due to the different time periods considered, this suggests the eddy-permitting model may be more sensitive to the future atmospheric changes than the coarse resolution CMIP models.
Although the NGCU increase is thought to be the primary source of the EUC increase, the strength of the NGCU change does not explain the smaller EUC change in CMIP6 or the inter-model differences within the CMIP ensembles. However, the smaller EUC change in CMIP6 is consistent with a larger weakening of MC and interior source waters offsetting the increased transport from the NGCU. Inter-model differences in the strength of the EUC projections are not explained by the strength of individual source water or wind forcing changes. This may reflect that there are multiple mechanisms affecting the change in EUC strength associated with different currents, flow pathways, and structural model differences, rather than suggest the models disagree on the underlying cause. In particular, the model differences may be related to the amount of transport that each source contributes to the EUC. For example, Sen Gupta et al. (2012) suggest that the projected MC reduction in transport may primarily flow on to the ITF, but the relative proportion of water the MC supplies to EUC and ITF may vary between the models. Additionally, the direct contribution of increased NGCU transport to the EUC may be affected by model differences in the representation of bathymetry out of the Solomon Sea. The NGCU increase in OFAM3 predominantly flows northeastward along the most direct route to the EUC (Melet et al., 2010; Grenier et al., 2011), while in most CMIP models it is largest along the western-most coastline. However, the western-most path is not resolved in many CMIP5 models, which forces all NGCU transport to flow further east via the more direct pathway to the EUC. These pathway differences to the EUC are likely a factor in the lack of a robust NGCU and EUC inter-model relationship. Since the majority of CMIP6 models project a large fraction of increased NGCU water along a less direct pathway to the EUC, it may also explain why the western Pacific EUC enhancement in CMIP6 is smaller than in OFAM3 and CMIP5.
Validating models can help future model improvements and provides confidence in climate change projections. Because of the low availability of sustained observational data, there are limitations of our model validation associated with observational uncertainty and estimates that represent shorter timescales than the models. Reanalyses are powerful tools for model validation (Storto et al., 2019), however, our results underscore the need to carefully assess their performance as well. We found that, despite the observational constraints, the range of transport estimates across reanalyses is often wider than CMIP IQRs (Table 1). In several cases, reanalysis products showed similar systematic biases to the CMIP ensembles, such as overestimating LLWBC transport (Table 1) or were extreme outliers. For example, GECCO3, which uses the relatively uncommon adjoint data assimilation approach (Köhl, 2020), underestimated the MC and overestimated the NGCU (Figures 2A,B).
The projected circulation changes of the equatorial Pacific have several implications for biogeochemical processes and marine ecosystems. The EUC enhancement may increase topographic upwelling around islands in the western and central equatorial Pacific (Karnauskas and Cohen, 2012). The additional upwelling of cool, nutrient-rich water may help offset the negative effects of hotter ocean temperatures and weaker wind-driven upwelling (Karnauskas and Cohen, 2012). However, the weaker EUC enhancement in CMIP6 (Figures 2A,B) suggests the mitigating effect for these coral reef ecosystems will be less effective (Karnauskas et al., 2016). Moreover, the projected changes in source waters may alter EUC water mass properties, even in the eastern equatorial Pacific, where projected transport changes are not significant (Figures 2A,B). In particular, the NGCU intensification may lead to an increase in iron supply from the New Guinea margin to the iron-limited eastern Pacific. Conversely, the projected weakening of wind-driven upwelling may reduce nutrient supply to the surface and may also act to warm the eastern equatorial Pacific (Graffino et al., 2019; Terada et al., 2020). Further examination of the combined effects of circulation, water temperature, biological activity and the future alkalinity changes is needed to understand the environmental and ecosystem impacts.
Data availability statement
Publicly available datasets were analyzed in this study. This data can be found at: Equatorial Pacific mean-fit zonal velocity fields are available from https://floats.pmel.noaa.gov/gregory-c-johnson-home-page. TAO/TRITON mooring data was downloaded from https://www.pmel.noaa.gov/tao/drupal/disdel/. SODA files were obtained from www.soda.umd.edu. GECCO3 were files obtained from https://icdc.cen.uni-hamburg.de/en/gecco3.html. C-GLORSv7 files were obtained from https://dds.cmcc.it/#/dataset/cglorsv7/monthly. ORAS5 files were obtained from https://resources.marine.copernicus.eu/?option=com_csw&view=details&product_id=GLOBAL_REANALYSIS_PHY_001_026. GODAS files were obtained from https://www.psl.noaa.gov/data/gridded/data.godas.html. The ERA-Interim data was obtained from https://doi.org/10.5065/D6CR5RD9. The JRA-55 data was obtained from https://doi.org/10.5065/D6HH6H41. CMIP6 model output is available at https://esgf-node.llnl.gov/projects/cmip6/, and CMIP5 model output is available at https://esgf-node.llnl.gov/search/cmip5/. OFAM3 downscaling experiment is archived on NCI, and all processed data files presented in this paper are available upon request through the corresponding author.
Author contributions
AS performed the calculations, figure preparation, data analysis, and wrote the manuscript. ASG conceptualized the study and provided background information. MF facilitated the acquisition of the OFAM3 data. ASG, AT, and MF reviewed the manuscript. All authors contributed with the result discussion and interpretation.
Funding
This research was supported by the Australian Research Council (ARC) Centre of Excellence for Climate Extremes and National Computational Infrastructure (NCI) at the Australian National University, Canberra. AT acknowledges support from the ARC FT160100495, CE170100023, and the Australian Government's National Environmental Science Programme (NESP). MF acknowledges support from the Centre for Southern Hemisphere Oceans Research (CSHOR), which is a joint initiative between the Qingdao National Laboratory for Marine Science and Technology (QNLM), CSIRO, the University of New South Wales, and the University of Tasmania.
Acknowledgments
For their role in producing the OFAM3 downscaling results, the authors acknowledge the CSIRO Ocean Downscaling Strategic Project, Bluelink team and NCI. For their role in making the OFAM3 output available, the authors thank Xuebin Zhang, CSIRO and NCI. For their roles in producing, coordinating and making available CMIP5 and CMIP6 model output, the authors acknowledge the climate modeling groups (listed in Supplementary Tables 1, 2), the World Climate Research Programme's Working Group on Coupled Modeling and the Global Organization for Earth System Science Portals. For making the TAO/TRITON data available, the authors would thank the Global Tropical Moored Buoy Array (GTMBA) Project Office of the National Oceanic and Atmospheric Administration (NOAA) Pacific Marine Environment Laboratory (PMEL). The authors acknowledge the Japanese 55-year Reanalysis (JRA-55) project carried out by the Japan Meteorological Agency (JMA). For their roles in producing the ERA-Interim dataset and access to the JRA-55 dataset, the authors acknowledge the European Centre for Medium-Range Weather Forecasts (ECMWF) and National Center for Atmospheric Research, Computational and Information Systems Laboratory.
Conflict of interest
The authors declare that the research was conducted in the absence of any commercial or financial relationships that could be construed as a potential conflict of interest.
Publisher's note
All claims expressed in this article are solely those of the authors and do not necessarily represent those of their affiliated organizations, or those of the publisher, the editors and the reviewers. Any product that may be evaluated in this article, or claim that may be made by its manufacturer, is not guaranteed or endorsed by the publisher.
Supplementary material
The Supplementary Material for this article can be found online at: https://www.frontiersin.org/articles/10.3389/fclim.2022.933091/full#supplementary-material
References
Alberty, M., Sprintall, J., MacKinnon, J., Germineaud, C., Cravatte, S., and Ganachaud, A. (2019). Moored observations of transport in the solomon sea. J. Geophys. Res. Ocean. 124, 8166–8192. doi: 10.1029/2019JC015143
Bjerknes, J. (1969). Teleconnections from the equatorial Pacific. Mon. Weather Rev. 97, 163–172. doi: 10.1175/1520-0493(1969)097<0163:ATFTEP>2.3.CO;2
Busecke, J. J. M., Resplandy, L., and Dunne, J. P. (2019). The Equatorial Undercurrent and the oxygen minimum zone in the Pacific. Geophys. Res. Lett. 46, 6716–6725. doi: 10.1029/2019GL082692
Chavez, F. P., Strutton, P. G., Friederich, G. E., Feely, R. A., Feldman, G. C., Foley, D. G., et al. (1999). Biological and chemical response of the equatorial pacific ocean to the 1997-98 El Nino. Science 286, 2126–2131. doi: 10.1126/science.286.5447.2126
Cravatte, S., Ganachaud, A., Duong, Q. P., Kessler, W. S., Eldin, G., and Dutrieux, P. (2011). Observed circulation in the solomon sea from SADCP data. Prog. Oceanogr. 88, 116–130. doi: 10.1016/j.pocean.2010.12.015
DiNezio, P. N., Clement, A. C., Vecchi, G. A., Soden, B. J., Kirtman, B. P., and Lee, S. K. (2009). Climate response of the equatorial pacific to global warming. J. Clim. 22, 4873–4892. doi: 10.1175/2009JCLI2982.1
Eyring, V., Bony, S., Meehl, G. A., Senior, C. A., Stevens, B., Stouffer, R. J., et al. (2016). Overview of the coupled model intercomparison project phase 6 (CMIP6) experimental design and organization. Geosci. Model Dev. 9, 1937–1958. doi: 10.5194/gmd-9-1937-2016
Feely, R. A., Wanninkhof, R., Takahashi, T., and Tans, P. (1999). Influence of El Niño on the equatorial Pacific contribution to atmospheric CO2 accumulation. Nature 398, 597–601. doi: 10.1038/19273
Feng, M., Zhang, N., Liu, Q., and Wijffels, S. (2018). The Indonesian throughflow, its variability and centennial change. Geosci. Lett. 5, 3. doi: 10.1186/s40562-018-0102-2
Fine, R. A., Lukas, R., Bingham, F. M., Warner, M. J., and Gammon, R. H. (1994). The western equatorial Pacific: a water mass crossroads. J. Geophys. Res. 99, 25063. doi: 10.1029/94JC02277
Firing, E., Lukas, R., Sadler, J., and Wyrtki, K. (1983). Equatorial undercurrent disappears during 1982-1983 El Nino. Science 222, 1121–1123. doi: 10.1126/science.222.4628.1121
Gasparin, F., Ganachaud, A., Maes, C., Marin, F., and Eldin, G. (2012). Oceanic transports through the Solomon Sea: the bend of the New Guinea Coastal Undercurrent. Geophys. Res. Lett. 39, L15608. doi: 10.1029/2012GL052575
Gordon, A. L. (1986). Interocean exchange of thermocline water. J. Geophys. Res. 91, 5037. doi: 10.1029/JC091iC04p05037
Gordon, A. L., and Fine, R. A. (1996). Pathways of water between the Pacific and Indian oceans in the Indonesian seas. Nature 379, 146–149. doi: 10.1038/379146a0
Graffino, G., Farneti, R., and Kucharski, F. (2021). Low-frequency variability of the Pacific subtropical cells as reproduced by coupled models and ocean reanalyses. Clim. Dyn. 56, 3231–3254. doi: 10.1007/s00382-021-05639-6
Graffino, G., Farneti, R., Kucharski, F., and Molteni, F. (2019). The effect of wind stress anomalies and location in driving pacific subtropical cells and tropical climate. J. Clim. 32, 1641–1660. doi: 10.1175/JCLI-D-18-0071.1
Grenier, M., Cravatte, S., Blanke, B., Menkes, C., Koch-Larrouy, A., Durand, F., et al. (2011). From the western boundary currents to the Pacific equatorial undercurrent: modeled pathways and water mass evolutions. J. Geophys. Res. Ocean. 116, 1–16. doi: 10.1029/2011JC007477
Hu, D., Wu, L., Cai, W., Sen Gupta, A., Ganachaud, A., Qiu, B., et al. (2015). Pacific western boundary currents and their roles in climate. Nature 522, 299–308. doi: 10.1038/nature14504
Johnson, G. C., and McPhaden, M. J. (1999). Interior pycnocline flow the subtropical to the equatorial Pacific Ocean. J. Phys. Oceanogr. 29, 3073–3089. doi: 10.1175/1520-0485(1999)029<3073:IPFFTS>2.0.CO;2
Johnson, G. C., McPhaden, M. J., and Firing, E. (2001). Equatorial pacific ocean horizontal velocity, divergence, and upwelling. J. Phys. Oceanogr. 31, 839–849. doi: 10.1175/1520-0485(2001)031<0839:EPOHVD>2.0.CO;2
Johnson, G. C., Sloyan, B. M., Kessler, W. S., and McTaggart, K. E. (2002). Direct measurements of upper ocean currents and water properties across the tropical Pacific during the 1990s. Prog. Oceanogr. 52, 31–61. doi: 10.1016/S0079-6611(02)00021-6
Karnauskas, K. B., and Cohen, A. L. (2012). Equatorial refuge amid tropical warming. Nat. Clim. Chang. 2, 530–534. doi: 10.1038/nclimate1499
Karnauskas, K. B., Cohen, A. L., and Gove, J. M. (2016). Mitigation of coral reef warming across the central Pacific by the equatorial undercurrent: a past and future divide. Sci. Rep. 6, 1–9. doi: 10.1038/srep21213
Karnauskas, K. B., Jakoboski, J., Johnston, T. M. S., Owens, W. B., Rudnick, D. L., and Todd, R. E. (2020). The Pacific equatorial undercurrent in three generations of global climate models and glider observations. J. Geophys. Res. Ocean. 125, e2020JC016609. doi: 10.1029/2020JC016609
Karnauskas, K. B., Johnson, G. C., and Murtugudde, R. (2012). An equatorial ocean bottleneck in global climate models. J. Clim. 25, 343–349. doi: 10.1175/JCLI-D-11-00059.1
Kashino, Y., Firing, E., Hacker, P., Sulaiman, A., and Lukiyanto (2001). Currents in the celebes and maluku seas, February 1999. Geophys. Res. Lett. 28, 1263–1266. doi: 10.1029/2000GL011630
Kessler, W. S. (2006). The circulation of the eastern tropical pacific: a review. Prog. Oceanogr. 69, 181–217. doi: 10.1016/j.pocean.2006.03.009
Kessler, W. S., Hristova, H. G., and Davis, R. E. (2019). Equatorward western boundary transport from the South Pacific: glider observations, dynamics and consequences. Prog. Oceanogr. 175, 208–225. doi: 10.1016/j.pocean.2019.04.005
Klinger, B. A., and Marotzke, J. (2000). Meridional heat transport by the subtropical cell. J. Phys. Oceanogr. 30, 696–705. doi: 10.1175/1520-0485(2000)030<0696:MHTBTS>2.0.CO;2
Kobayashi, S., Ota, Y., Harada, Y., Ebita, A., Moriya, M., Onoda, H., et al. (2015). The JRA-55 reanalysis: general specifications and basic characteristics. J. Meteorol. Soc. Japan 93, 5–48. doi: 10.2151/jmsj.2015-001
Köhl, A. (2020). Evaluating the GECCO3 1948–2018 ocean synthesis – a configuration for initializing the MPI-ESM climate model. Q. J. R. Meteorol. Soc. 146, 2250–2273. doi: 10.1002/qj.3790
Kuntz, L. B., and Schrag, D. P. (2020). Representation of the equatorial undercurrent in CMIP5 models. J. Phys. Oceanogr. 50, 2997–3007. doi: 10.1175/JPO-D-20-0007.1
Kuntz, L. B., and Schrag, D. P. (2021). Subtropical modulation of the equatorial undercurrent: a mechanism of Pacific variability. Clim. Dyn. 56, 1937–1949. doi: 10.1007/s00382-020-05568-w
Lee, T., and Fukumori, I. (2003). Interannual-to-decadal variations of tropical–subtropical exchange in the Pacific Ocean: boundary versus interior pycnocline transports. J. Clim. 16, 4022–4042. doi: 10.1175/1520-0442
Leslie, W. R., and Karnauskas, K. B. (2014). The equatorial undercurrent and TAO sampling bias from a decade at SEA. J. Atmos. Ocean. Technol. 31, 2015–2025. doi: 10.1175/JTECH-D-13-00262.1
Lu, P., McCreary, J. P. Jr., and Klinger, B. A. (1998). Meridional circulation cells and the source waters of the Pacific equatorial undercurrent. J. Phys. Oceanogr. 28, 62–84.
Luo, Y., Rothstein, L. M., and Zhang, R. H. (2009). Response of pacific subtropical-tropical thermocine water pathways and transports to global warming. Geophys. Res. Lett. 36, L04601. doi: 10.1029/2008GL036705
McPhaden, M. J., and Zhang, D. (2002). Slowdown of the meridional overturning circulation in the upper Pacific Ocean. Nature 415, 603–608. doi: 10.1038/415603a
Melet, A. L., Gourdeau, L., Kessler, W. S., Verron, J., and Molines, J. M. (2010). Thermocline circulation in the solomon sea: a modeling study. J. Phys. Oceanogr. 40, 1302–1319. doi: 10.1175/2009JPO4264.1
Oke, P. R., Griffin, D. A., Schiller, A., Matear, R. J., Fiedler, R., Mansbridge, J., et al. (2013). Evaluation of a near-global eddy-resolving ocean model. Geosci. Model Dev. 6, 591–615. doi: 10.5194/gmd-6-591-2013
Qin, X., Menviel, L., Sen Gupta, A., and van Sebille, E. (2016). Iron sources and pathways into the pacific equatorial undercurrent. Geophys. Res. Lett. 43, 9843–9851. doi: 10.1002/2016GL070501
Qin, X., Sen Gupta, A., and van Sebille, E. (2015). Variability in the origins and pathways of pacific equatorial undercurrent water. J. Geophys. Res. Ocean. 120, 3113–3128. doi: 10.1002/2014JC010549
Qiu, B., and Lukas, R. (1996). Seasonal and interannual variability of the north equatorial current, the mindanao Current, and the Kuroshio along the pacific western boundary. J. Geophys. Res. Ocean. 101, 12315–12330. doi: 10.1029/95JC03204
Ren, Q., Li, Y., Wang, F., Song, L., Liu, C., and Zhai, F. (2018). Seasonality of the Mindanao Current/undercurrent system. J. Geophys. Res. Ocean. 123, 1105–1122. doi: 10.1002/2017JC013474
Ruggio, R., Vichi, M., Paparella, F., and Masina, S. (2013). Climatic trends of the equatorial undercurrent: a backup mechanism for sustaining the equatorial pacific production. J. Mar. Syst. 121–122, 11–23. doi: 10.1016/j.jmarsys.2013.04.001
Schönau, M. C., and Rudnick, D. L. (2017). Mindanao Current and undercurrent: thermohaline structure and transport from repeat glider observations. J. Phys. Oceanogr. 47, 2055–2075. doi: 10.1175/JPO-D-16-0274.1
Schönau, M. C., Rudnick, D. L., Cerovecki, I., Gopalakrishnan, G., Cornuelle, B. D., McClean, J. L., et al. (2015). The Mindanao Current: mean structure and connectivity. Oceanography 28, 34–45. doi: 10.5670/oceanog.2015.79
Sen Gupta, A., Ganachaud, A., Mcgregor, S., Brown, J. N., and Muir, L. C. (2012). Drivers of the projected changes to the Pacific Ocean equatorial circulation. Geophys. Res. Lett. 39, 1–7. doi: 10.1029/2012GL051447
Sen Gupta, A., McGregor, S., van Sebille, E., Ganachaud, A., Brown, J. N., and Santoso, A. (2016). Future changes to the indonesian throughflow and pacific circulation: the differing role of wind and deep circulation changes. Geophys. Res. Lett. 43, 1669–1678. doi: 10.1002/2016GL067757
Sen Gupta, A., Stellema, A., Pontes, G. M., Taschetto, A. S., Vergés, A., and Rossi, V. (2021). Future changes to the upper ocean western boundary currents across two generations of climate models. Sci. Rep. 11, 1–12. doi: 10.1038/s41598-021-88934-w
Slemons, L., Murray, J. W., Resing, J., Paul, B., and Dutrieux, P. (2010). Western Pacific coastal sources of iron, manganese, and aluminum to the equatorial undercurrent. Global Biogeochem. Cycles 24, 1–16. doi: 10.1029/2009GB003693
Slemons, L., Paul, B., Resing, J., and Murray, J. W. (2012). Particulate iron, aluminum, and manganese in the Pacific equatorial undercurrent and low latitude western boundary current sources. Mar. Chem. 142–144, 54–67. doi: 10.1016/j.marchem.2012.08.003
Stellema, A., Sen Gupta, A., and Taschetto, A. S. (2019). Projected slow down of South Indian Ocean circulation. Sci. Rep. 9, 17705. doi: 10.1038/s41598-019-54092-3
Storto, A., Alvera-Azcárate, A., Balmaseda, M. A., Barth, A., Chevallier, M., Counillon, F., et al. (2019). Ocean reanalyses: recent advances and unsolved challenges. Front. Mar. Sci. 6, 1–10. doi: 10.3389/fmars.2019.00418
Takahashi, T., Sutherland, S. C., Feely, R. A., and Wanninkhof, R. (2006). Decadal change of the surface water pCO2 in the North Pacific: a synthesis of 35 years of observations. J. Geophys. Res. Ocean. 111, 1–20. doi: 10.1029/2005JC003074
Taylor, K. E., Stouffer, R. J., and Meehl, G. A. (2012). An overview of CMIP5 and the experiment design. Bull. Am. Meteorol. Soc. 93, 485–498. doi: 10.1175/BAMS-D-11-00094.1
Terada, M., Minobe, S., and Deutsch, C. (2020). Mechanisms of future changes in equatorial upwelling: CMIP5 intermodel analysis. J. Clim. 33, 497–510. doi: 10.1175/JCLI-D-19-0128.1
Tsuchiya, M., Lukas, R., Fine, R. A., Firing, E., and Lindstrom, E. (1989). Source waters of the pacific equatorial undercurrent. Prog. Oceanogr. 23, 101–147. doi: 10.1016/0079-6611(89)90012-8
Vecchi, G. A., and Soden, B. J. (2007). Global warming and the weakening of the tropical circulation. J. Clim. 20, 4316–4340. doi: 10.1175/JCLI4258.1
Vichi, M., Masina, S., and Nencioli, F. (2008). A process-oriented model study of equatorial pacific phytoplankton: the role of iron supply and tropical instability waves. Prog. Oceanogr. 78, 147–162. doi: 10.1016/j.pocean.2008.04.003
Wang, Q., Wang, F., Feng, J., Hu, S., Zhang, L., Jia, F., et al. (2019). The equatorial undercurrent and its origin in the region between mindanao and new guinea. J. Geophys. Res. Ocean. 124, 2313–2330. doi: 10.1029/2018JC014842
Wattimena, M. C., Atmadipoera, A. S., Purba, M., Nurjaya, I. W., and Syamsudin, F. (2021). Volume transport variability in the western equatorial pacific and its relations to halmahera throughflow. Pertanika J. Sci. Technol. 29, 1171–1197. doi: 10.47836/pjst.29.2.26
Wijffels, S., Firing, E., and Toole, J. (1995). The mean structure and variability of the Mindanao Current at 8°N. J. Geophys. Res. 100, 18421. doi: 10.1029/95JC01347
Zhang, X., Church, J. A., Monselesan, D., and McInnes, K. L. (2017). Sea level projections for the Australian region in the 21st century. Geophys. Res. Lett. 44, 8481–8491. doi: 10.1002/2017GL074176
Zhang, X., Oke, P. R., Feng, M., Chamberlain, M. A., Church, J. A., Monselesan, D., et al. (2016). A near-global eddy-resolving OGCM for climate studies. Geosci. Model Dev. Discuss. [Preprint], 1–52. doi: 10.5194/gmd-2016-17
Keywords: tropical Pacific, climate change, Equatorial Undercurrent, Mindanao Current, New Guinea Coastal Undercurrent, ocean circulation and currents, model validation, CMIP
Citation: Stellema A, Sen Gupta A, Taschetto AS and Feng M (2022) Pacific Equatorial Undercurrent: Mean state, sources, and future changes across models. Front. Clim. 4:933091. doi: 10.3389/fclim.2022.933091
Received: 30 April 2022; Accepted: 14 July 2022;
Published: 08 August 2022.
Edited by:
Swadhin Kumar Behera, Japan Agency for Marine-Earth Science and Technology (JAMSTEC), JapanCopyright © 2022 Stellema, Sen Gupta, Taschetto and Feng. This is an open-access article distributed under the terms of the Creative Commons Attribution License (CC BY). The use, distribution or reproduction in other forums is permitted, provided the original author(s) and the copyright owner(s) are credited and that the original publication in this journal is cited, in accordance with accepted academic practice. No use, distribution or reproduction is permitted which does not comply with these terms.
*Correspondence: Annette Stellema, YS5zdGVsbGVtYUB1bnN3LmVkdS5hdQ==