- 1Graduate School of Natural Science and Technology, Okayama University, Okayama, Japan
- 2Center for Advanced Marine Core Research, Kochi University, Nankoku, Japan
- 3Geological Survey of Japan, National Institute of Advanced Industrial Science and Technology (AIST), Tsukuba, Japan
- 4Research and Technology Center for Application of Isotope and Radiation, National Research and Innovation Agency, Jakarta, Indonesia
- 5National Nuclear Energy Agency (BATAN), Jakarta, Indonesia
Coral geochemical tracers have been used in studies of the paleoclimatology and paleoceanography of the tropics and subtropics. We measured Sr/Ca and oxygen isotope ratios (δ18O) in a coral sample collected from the southern part of Lombok Strait, a significant outlet of the Indonesian Throughflow (ITF) to the Indian Ocean, to reconstruct the historical record of sea surface temperature (SST) and seawater δ18O. Seawater δ18O can be used to approximate sea surface salinity (SSS) because it reflects the balance of evaporation and precipitation. The resulting time series reconstructed SST and SSS, covering the period 1962–2012, shows no clear trend of global warming, although the record includes a large cooling event (~4°C) during 1996–1997. Although neither SST nor SSS shows a systematic relationship with El Niño–Southern Oscillation and Indian Ocean Dipole (IOD), weak but significant correlations are found partly. In addition, the coral data show signals of major IOD and El Niño events in 1994 and 1997, respectively, although climatic trends recorded in the coral are not consistent with those found along the Java-Sumatra coast. To evaluate other influences on the ITF in Lombok Strait, we compared our coral record with coral records from sites in the Java Sea, the southern part of Makassar Strait, and Ombai Strait. During the northwest monsoon (December–January–February), variations in SST and SSS at Lombok Strait site are similar to those at the Java Sea and southern Makassar sites for the period 1962–1995, which suggests that low-salinity water from the Java Sea is carried at least to the southern part of Makassar Strait where it suppresses the ITF upstream from Lombok Strait. However, the SST and SSS records differ at the three sites during the southeast monsoon (June–July–August), indicating that surface conditions in Lombok Strait vary separately from those in the Java Sea. In the longer term, although global warming has been widely identified in the Indonesian Seas, the coral record shows no clear warming trend in the southern part of Lombok Strait, where fluctuations in the ITF may be modulating the distribution of heat in the surface waters of the western Pacific and eastern Indian Ocean.
Introduction
The Indonesian Throughflow (ITF) is the portion of the global thermohaline circulation that connects the Pacific Ocean to the Indian Ocean. The ITF passes through Makassar Strait and then enters the Indian Ocean through either Lombok Strait, Ombai Strait, or Timor Passage (Figure 1A). The throughflow carries surface water originating in the north Pacific Ocean across the equator (Gordon and Fine, 1996), and its water properties change by vertical mixing and the influx of fresh water from the surrounding land as it passes through the Indonesian archipelago (Gordon, 2005). The ITF plays an important role in the heat transport, water budget, and air–sea heat flux, and thus, it may modulate climate variability in the Pacific and Indian Oceans (Sprintall et al., 2014). The ITF is driven by the pressure gradient between the Pacific and Indian Oceans (Potemra et al., 1997). The El Niño–Southern Oscillation (ENSO) and Indian Ocean Dipole (IOD), which account for the typical climate variability of the Pacific and Indian Oceans, respectively, affect the ITF through changes in the sea surface level (Sprintall and Révelard, 2014). Sea surface currents in Lombok Strait turn northward during austral summer (Chong et al., 2000), but flow southward in that season during year when the El Niño phase coincides with the positive IOD phase (Susanto et al., 2007). Oceanographic observations in the Indonesian archipelago including temperature, salinity, and current velocity have informed studies of the behavior and variability of the ITF, but the paucity of continuous records extending decades or more hinders better understanding of the relationship between the ITF and climate variability.
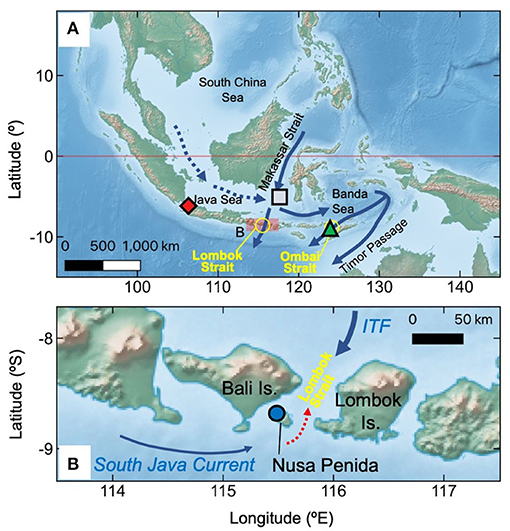
Figure 1. (A) Map of the Indonesian Seas. Solid arrows indicate the Indonesian Throughflow (ITF) from the Pacific Ocean to the Indian Ocean. Dashed arrows indicate sea surface currents from the South China Sea to the south end of Makassar Strait during the northwest monsoon. Symbols indicate sampling site in the previous study: (red diamond) Seribu Islands (Genda et al., 2022), (gray square) southern Makassar Strait (Murty et al., 2017), and (green triangle) Ombai Strait (Cahyarini et al., 2014). (B) Map of Lombok Strait showing sampling site location (blue circle) on the northwest side of Nusa Penida, which is the enlargement of pinky shaded area in (A). The red dotted arrow indicates the northward surface flow in Lombok Strait during the northwest monsoon. Panels A and B are made with Natural Earth (https://www.naturalearthdata.com).
Coral skeletons have been widely used to investigate the paleoclimatology and paleoceanography of the tropics and subtropics. Among reef corals that secrete aragonite skeletons (CaCO3), long-lived massive corals with annual bands such as Porites spp. have been recognized as useful recorders of surface marine environments. With such corals, it is possible to establish age models easily by counting the bands and to reconstruct past marine environmental conditions, such as sea surface temperature (SST), oxygen isotope ratios in seawater (δ18Osw), and marine pollution, with high time resolution. Because δ18Osw depends on the balance between evaporation and precipitation in surface waters, δ18Osw variations are regarded as proxies of sea surface salinity (SSS). Strontium to calcium ratio (Sr/Ca) and oxygen isotope ratios in coral skeletons (δ18Ocoral) are well-known SST proxies. As δ18Ocoral also reflects δ18Osw, a combination of Sr/Ca and δ18Ocoral data from coral skeletons can be used in the absence of direct seawater measurements to reconstruct SSS (Gagan et al., 1998; Ren et al., 2003; Cahyarini et al., 2008).
Geochemical data from coral skeletons have been used in the Indonesian Seas, mostly in basins involved in the ITF. For example, Murty et al. (2017) reconstructed δ18Osw for the previous century based on δ18Ocoral data from Doangdoangan Besar in the southern Makassar Strait, where seawater is moved by monsoon winds from the different regions. For example, during the northwestern monsoon, water from Luzon Strait and the Java Sea flows into the southern Makassar Strait. Reconstructed SSS correlated with the East Asian winter monsoon for interannual scale, and the mixing ratio of surface water in the southern Makassar Strait varies with the intensity of the East Asian winter monsoon (Murty et al., 2017). In addition, Murty et al. (2018) elucidated the relationship between surface water circulation and the East Asian winter monsoon by using δ18Ocoral data to reconstruct long-term changes in SSS. Lombok Strait is the ITF outlet closest to Makassar Strait, and SSS reconstructions based on δ18Ocoral data from the northern part of Lombok Strait are similar to those for Makassar Strait. However, SSS reconstructions for the southern part of Lombok Strait differ from those for the northern part which are similar to SSS data for the Indian Ocean. Thus, it appears that the circulation of surface water differs between the northern and southern parts of Lombok Strait. Other coral records covering over the past decades also helped us to examine the interaction with ENSO or IOD and to detect in the South Pacific Convergence Zone zonal events (Charles et al., 2003; Cahyarini et al., 2014; Linsley et al., 2017).
In this study, we reconstructed long-term SST and SSS records by analyzing Sr/Ca and δ18O in a coral skeleton sample collected from Nusa Penida, an island in southern part of Lombok Strait (Figure 1B). Although previous studies have analyzed δ18Ocoral to understand long-term environmental changes in the strait (Charles et al., 2003; Murty et al., 2018), SST was not reconstructed in those works. In this paper, we compare the temporal and spatial variations of SST and SSS in the Indonesian Seas from this and other studies using coral proxies, and we discuss the response of SST and SSS to climate phenomena such as ENSO, IOD, and monsoons.
Material and Methods
Study Site
Nusa Penida lies in Lombok Strait between the islands of Bali and Lombok (Figure 1B). Data from the Integrated Global Ocean Services System (IGOSS) show that SST in Lombok Strait varies within a range of 2.5–4°C (Figure 2A); average monthly temperatures are usually warmer from November to May and cooler from July to September (Figure 2B). The mean SSS in Lombok Strait from 1991 to 2000, obtained from the Simple Ocean Data Assimilation (SODA), was ≈33.3 g/kg with an approximate range of 2 g/kg. Conditions are relatively fresh from March to May and relatively saline from August to October (Figure 2B).
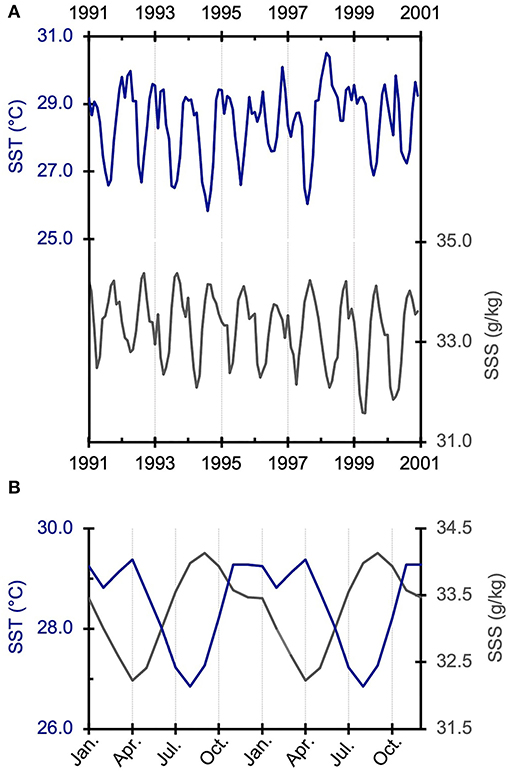
Figure 2. (A) SST and SSS in Lombok Strait from 1991 to 2000, covering the El Niño and IOD events occurred in 1994 and 1997. (B) Seasonal variation of monthly average SST (dark blue line) and SSS (gray line) for the period 1991–2000. SST data were obtained from IGOSS (115.5°E, 8.5°S) and SSS data from SODA (115.75°E, 8.25°S).
Coral Sample
A core of living massive Porites skeletal material (BAL13-09) was collected at 5-m depth from Nusa Penida (115.51°E, 8.67°S) in October 2012. The coral core was cut into slabs for X-radiography to visualize and count annual density bands (Figure 3). Although density bands are narrow in the upper part of the core and wide in the lower part, the mean growth rate of the coral was ≈18.5 mm/year. Powder samples were collected at 0.4-mm intervals along the growth axis. Geochemical tracers were measured in every fourth sample (1.6-mm intervals), corresponding to a temporal resolution of ≈1 month.
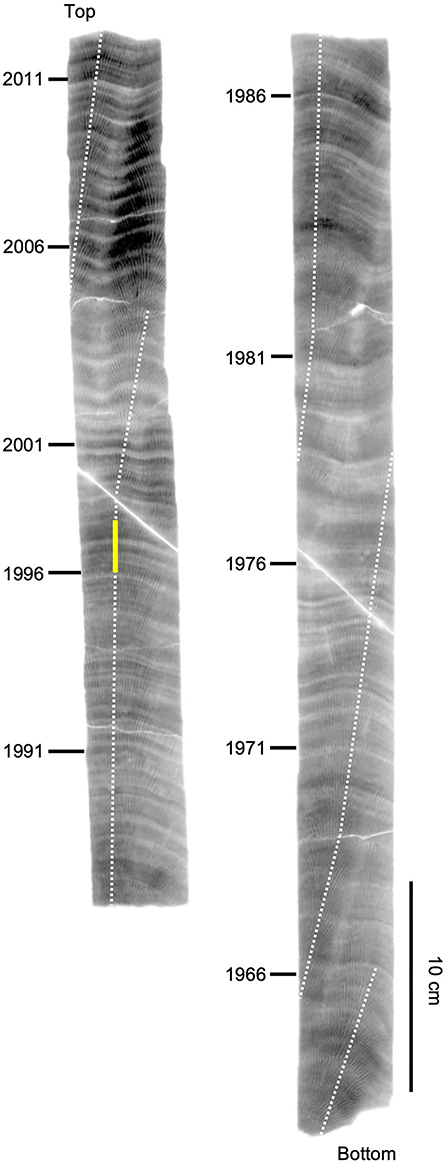
Figure 3. X-radiograph of core BAL13-09. The dotted white line represents the micro-sampling array; the yellow portion corresponds to cool event in 1996–1997.
Chemical Analysis
Concentrations of Sr and Ca were measured by using an inductively coupled plasma optical emission spectrometer (720 series, Agilent, USA) at Okayama University, Japan. Sample solutions were prepared by dissolving powder samples (100 μg) in 2% HNO3 (5 mL), prepared by dilution of TAMAPURE AA-100 (Tama chemicals CO., Ltd., Japan). A standard solution was prepared from geochemical reference material JCp-1, provided by the Geological Survey of Japan (GSJ) (Okai et al., 2002). The relative standard deviation based on reanalysis of JCp-1 at each run was 0.3% for Sr/Ca ratios, and the standard deviation (1σ) is 0.026 mmol/mol.
Measurements of δ18O were performed by an online system employing an IsoPrime isotope-ratio mass spectrometer (GV Instruments Ltd., UK) at the Center for Advanced Marine Core Research (CMCR), Kochi University, Japan, and the GSJ. All δ18O data were normalized to the Vienna Pee Dee Belemnite (V-PDB) scale using the international standards NBS19 (δ18O = −2.2%) of the National Institute of Standards and Technology, USA, and the IAEA-603 (δ18O = −2.37% ± 0.04) of the International Atomic Energy Agency, Austria. The standard deviation for replicate measurements of δ18O was 0.05% (n = 6, GSJ) and 0.04% (n = 120, CMCR).
Chronology
Age determinations in this study mainly relied on seasonal cycles in the δ18Ocoral records of temperature and salinity rather than counting annual bands since the width of density bands is different between upper and lower parts of the core. IGOSS data for Lombok Strait (115.5°E, 8.5°S) generally recorded warmer SSTs from November to May and cooler SSTs from July to September (Figure 2B), whereas SODA data (115.75°E, 8.25°S) generally exhibit the lowest SSS in April and the highest SSS in August and September. Because δ18Ocoral has a negative correlation with SST and a positive correlation with SSS (δ18Osw), high SST and low SSS in April are recorded as relatively low δ18Ocoral, and low SST and high SSS in August are recorded as high δ18Ocoral. Thus, we anchored annual low and high values of δ18Ocoral to April and August, respectively, and interpolated linearly for dates between these months. The age estimated from clear annual cycle of δ18Ocoral is 51 years, whereas the number of density bands is around 65. Although a density bands in skeleton of massive coral are generally formed once a year, it has been discussed the relationship between density bands and several environmental factors such as temperature, wave height, and rainfall (e.g., Dodge and Vaisnys, 1975; Tanzil et al., 2016). The mechanism of formation of annual bands in addition to the reason of a discrepancy between δ18Ocoral cycle and the number of density bands found in BAL13-09 should be clarified in future.
Climatology Data
For our consideration of SST and SSS variations in the Indonesian Seas, we used other coral proxy data as follows: the Seribu Islands in the Java Sea near Jakarta (1931–2002, Genda et al., 2022; red diamond in Figure 1A); Doangdoangan Besar in the southern Makassar Strait (1926–2010, Murty et al., 2017; gray square in Figure 1A); and Kupang Bay in the western side of Timor Island facing Ombai Strait (1914–2004, Cahyarini et al., 2014; green triangle in Figure 1A). Data in Seribu and Ombai Strait consist of SST and Δδ18Osw (SSS proxy) records reconstructed from Sr/Ca and δ18Ocoral. Data in southern Makassar Strait consist of only SSS record reconstructed from δ18Ocoral and Hadley Center for Sea Ice and Sea Surface Temperature (117–118°E, 5–6°S). The data of coral proxies for southern Makassar Strait and Ombai Strait were obtained from the National Centers for Environmental Information (https://www.ncei.noaa.gov/products/paleoclimatology).
To examine the response of SST and SSS to climate phenomena, we used two climate index datasets. The Oceanic Niño Index (ONI), the monitoring index for El Niño events, is calculated from Niño 3.4 SST in the central equatorial Pacific (170–120°W, 5°N−5°S). The Dipole Mode Index (DMI) is estimated from the difference in SST anomalies between the western Indian Ocean (50–70°E; 10–10°N) and southeastern Indian Ocean (90–110°E; 10–0°S). Both datasets, based on NOAA Extended Reconstructed SST (ERSST) v5, were obtained from the Royal Netherlands Meteorological Institute (KNMI) climate explorer (https://climexp.knmi.nl/).
Results
Coral records in core BAL13-09 cover half a century (1962–2012) with a time resolution of ≈1 month, excluding 2004–2005 when the sampling line was not connected. Sr/Ca ratios ranged from 8.29 to 8.67 mmol/mol (Figure 4A), and the average value was 8.46 mmol/mol. The δ18Ocoral values ranged from −6.58% to −4.58%, and the average value was −5.37% (Figure 4B). Because both Sr/Ca and δ18Ocoral are dependent on temperature, both proxies were calibrated with the IGOSS SST record from Lombok Strait (115.5°E, 8.5°S) for 1982–2012. Our regression analysis, using the maximum Sr/Ca values that correspond to August SST and minimum Sr/Ca values that correspond to April SST, yielded the regression equations
(Figure 5A; r2 = 0.48, p < 0.001, n = 60) and
(Figure 5B; r2 = 0.69, p < 0.001, n = 60).
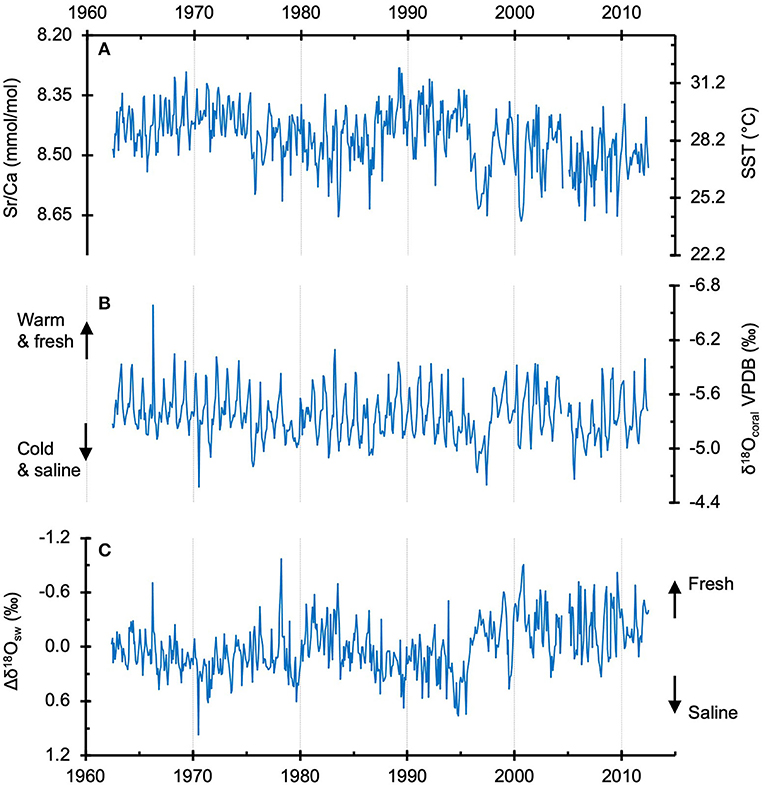
Figure 4. Coral proxy data for the period 1962–2012 with monthly resolution. (A) Sr/Ca and SST, (B) δ18Ocoral in core BAL13-09, and (C) salinity proxy Δδ18Osw estimated from Sr/Ca and δ18Ocoral. The axis of Sr/Ca, δ18Ocoral, and Δδ18Osw is inverted.
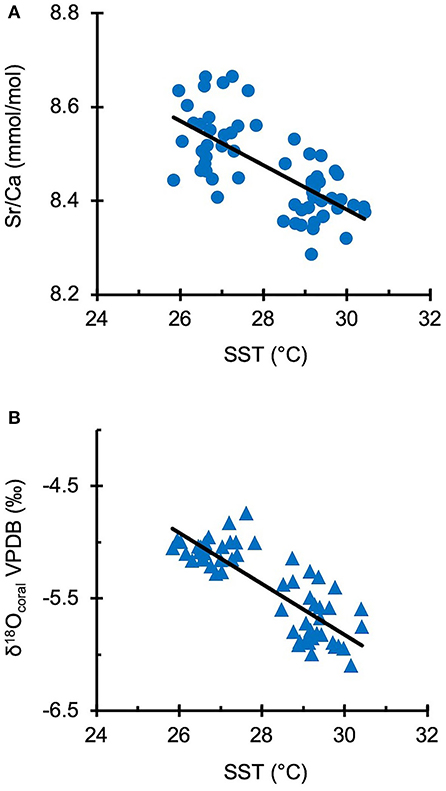
Figure 5. Calibration of coral geochemical tracer vs. IGOSS SST for the period 1982–2012. (A) Calibration of coral Sr/Ca vs. IGOSS SST (Sr/Ca = −0.047 * SST + 9.799, r2 = 0.48, p < 0.001). (B) Calibration of δ18Ocoral vs. IGOSS SST (δ18Ocoral = −0.227 * SST + 0.971, r2 = 0.69, p < 0.001).
The regression slope of −0.047 (mmol mol−1 °C−1) for Sr/Ca is at the low end of the published range (−0.04 to −0.08 mmol mol−1 °C−1; Correge, 2006). We used Equation 1 to convert Sr/Ca data for core BAL13-09 to SST values.
The regression slope of −0.23%/°C for δ18Ocoral is roughly the same as the published range (−0.13 to −0.22%/°C; Gagan et al., 1994, 1998; Mitsuguchi et al., 1996; Wellington et al., 1996; Quinn et al., 1998; Suzuki et al., 1999; Felis et al., 2000, 2004; Stephans et al., 2004). Because δ18Ocoral also depends on δ18Osw, we estimated values of δ18Osw by subtracting temperature components from δ18Ocoral to obtain the corrected Δδ18Osw (Gagan et al., 1998; Ren et al., 2003; Cahyarini et al., 2008) as our SSS proxy, using a centering method that incorporates the temperature dependency of Sr/Ca and δ18Ocoral (Cahyarini et al., 2008):
where the overbar represents the mean value, γ is the regression slope of δ18Ocoral-IGOSS SST from Equation 2, and β is the regression slope of Sr/Ca–IGOSS SST from Equation 1.
We estimated the uncertainty of δ18Osw referring to Cahyarini et al. (2008).
where σδc and σδSr/Ca mean the analytical precision in δ18Ocoral and Sr/Ca, respectively. γ is −0.227 (%/°C), and β is −0.047 (mmol mol−1 °C−1). The uncertainty of δ18Osw (σδsw) estimated from Equation 4 is ±0.135‰.
The reconstructed SST record is shown in Figure 4A, and the reconstructed SSS record (δ18Osw) is shown in Figure 4C. The SST record based on Sr/Ca shows no warming trend, although a strong cool anomaly of about −4°C was seen in 1996–1997 (Figure 6A). In addition, Δδ18Osw shifted toward fresh conditions at the time of large cool events (Figures 4C, 6B).
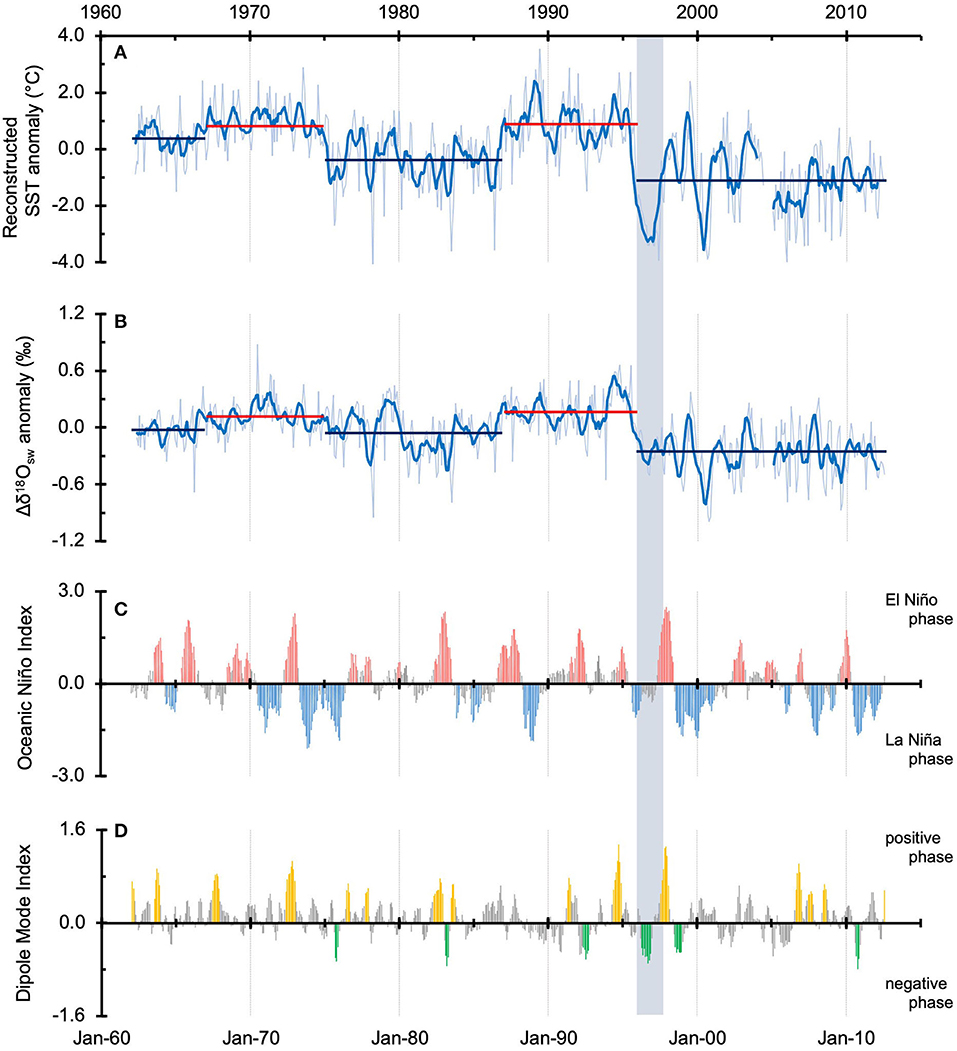
Figure 6. Temporal record of (A) SST anomaly, and (B) Δδ18Osw anomaly from core BAL13-09 for the period 1962–2012. Time series show monthly values (thin lines) and 6-month moving averages (thick solid lines). Red bars indicate periods of warm and saline conditions: 1967–1974 (+0.8°C, +0.1%) and 1987–1995 (+0.9°C, +0.2%). Blue bars indicate periods of cool and fresh condition: 1962–1966 (+0.4°C, 0.0%), 1975–1986 (−0.4°C, −0.1%) and 1996–2012 (−1.2°C, −0.3%). Time series of (C) the Oceanic Niño Index and (D) the Dipole Mode Index for the period 1962–2012.
There was no clear, systematic relationship between reconstructed SST and SSS and phase of ENSO or the IOD (Figures 6C,D). When the monthly data were aggregated into four seasons, weak correlation between the Oceanic Niño Index and SST/SSS in December–January–February (DJF)/March–April–May (MAM) (Figure 7) and the Dipole Mode Index and SSS in MAM (Figure 8) were found, but we found no consistent relationship between SST or SSS and climate factor in other seasons, including the large cool event of 1996–1997. The X-radiograph of the core showed no abnormality in growth around the time of the 1996–1997 cool event (yellow line in Figure 3), which suggests that this large SST anomaly is not the result of a vital effect.
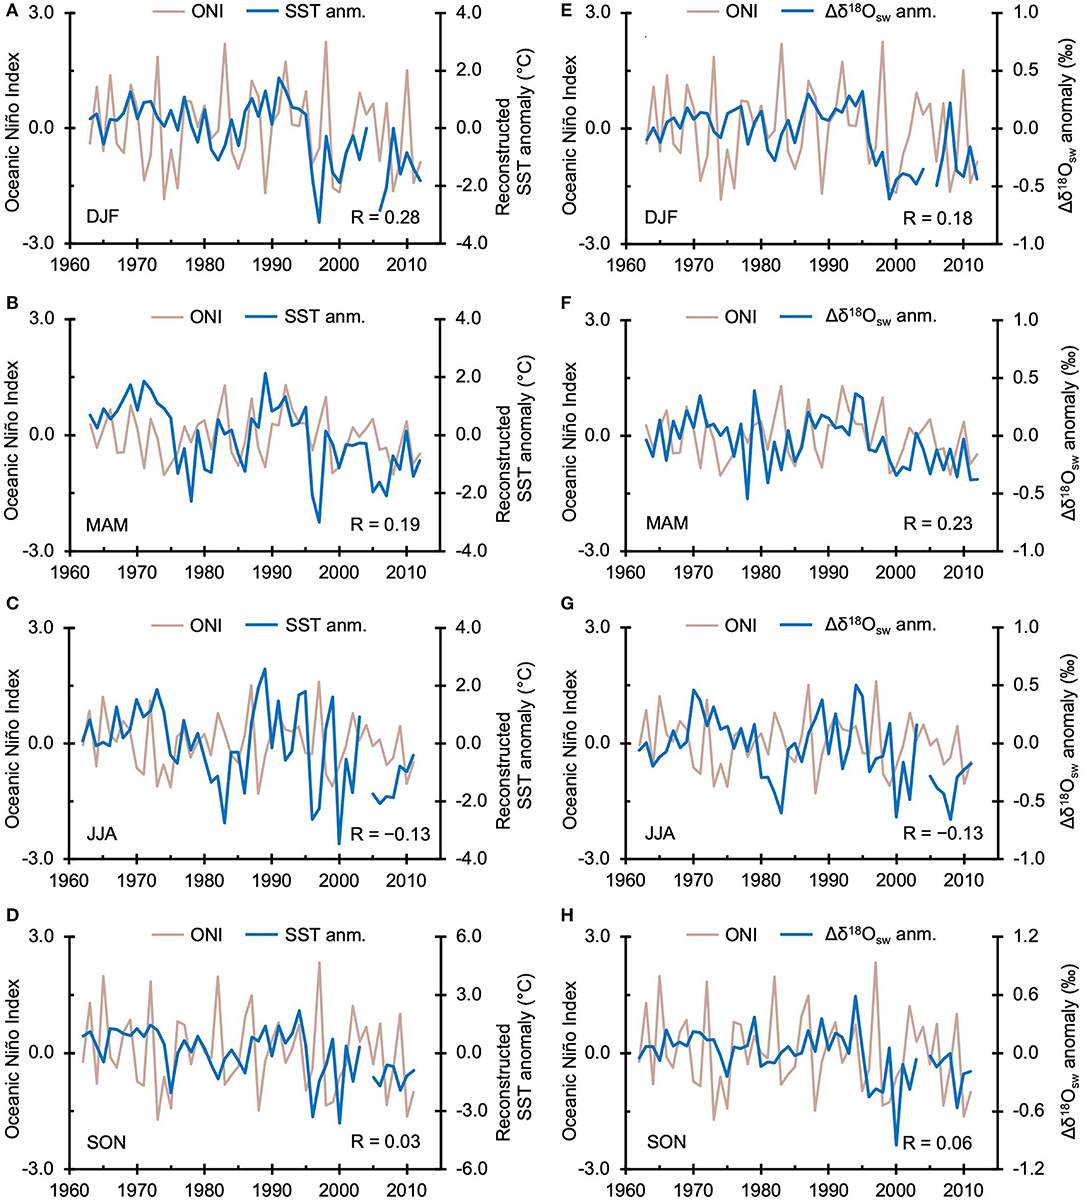
Figure 7. Seasonal Oceanic Niño Index (ONI) compared seasonal SST anomaly (left panels) and seasonal Δδ18Osw anomaly (right panels): (A,E) December–January–February (DJF), (B,F) March–April–May (MAM), (C,G) June–July–August (JJA), and (D,H) September–October–November (SON).
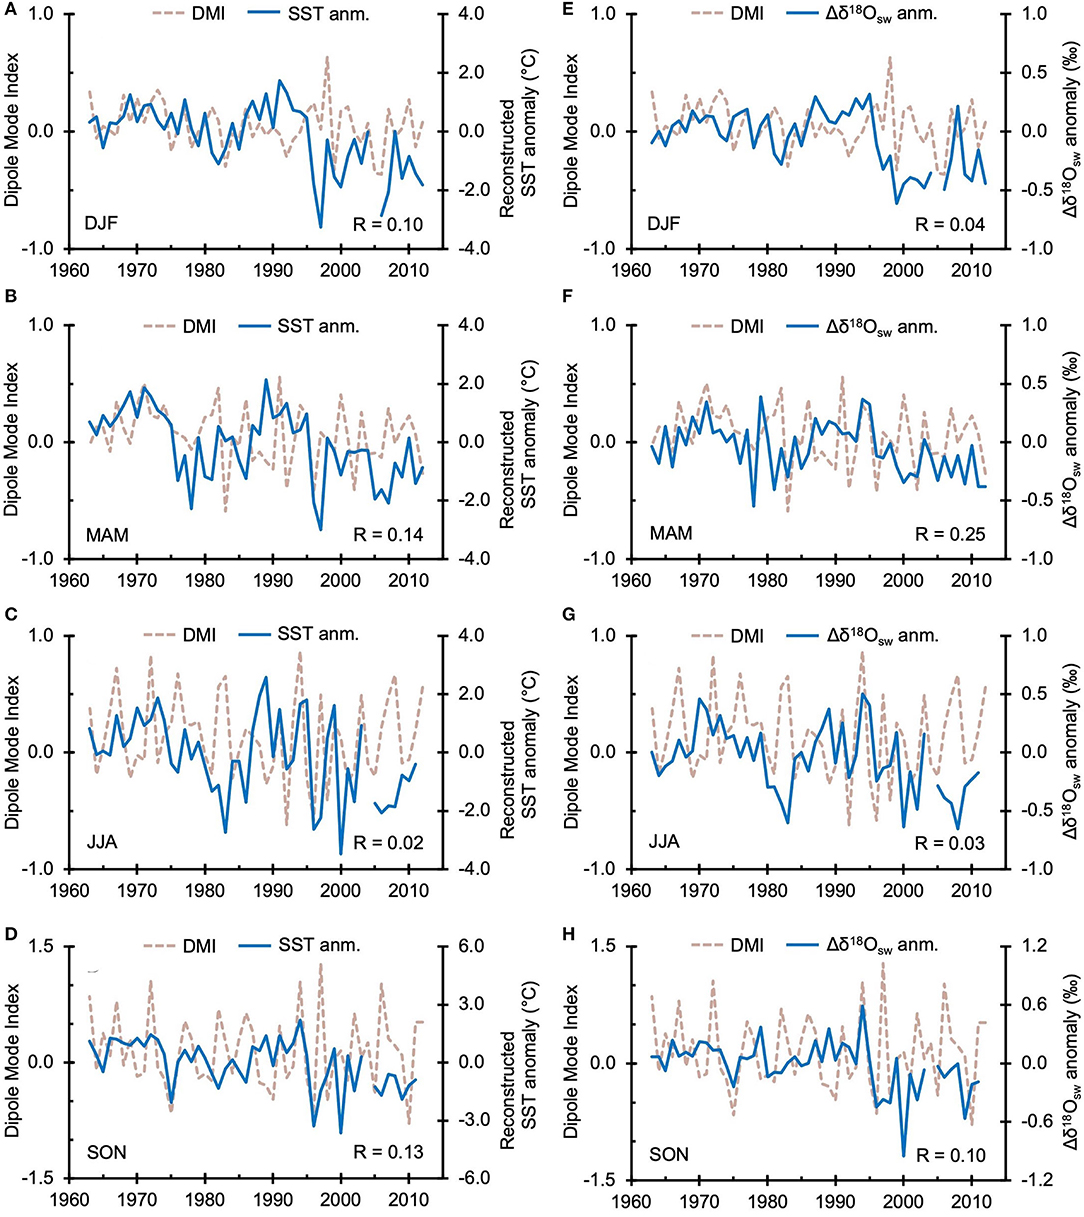
Figure 8. Seasonal Dipole Mode Index (DMI) compared with seasonal SST anomaly (left panels) and seasonal Δδ18Osw anomaly (right panels): (A,E) DJF, (B,F) MAM, (C,G) JJA, and (D,H) SON.
Figure 9 shows the variability of SST and SSS during season of the southeast [June–July–August (JJA)] and the northwest (DJF) monsoons. The mean value of reconstructed SST and SSS at Nusa Penida in JJA (27.8 ± 1.4°C, 0.06 ± 0.27%) is slightly cooler and higher than that in DJF (28.8 ± 1.0°C, 0.04 ± 0.22%). For further insight into the SST and SSS variations, we compared seasonally aggregated data from core BAL13-09 (the Bali record hereafter) and coral records from the Seribu Islands (the Seribu record hereafter), the southern part of Makassar Strait (the S. Makassar record hereafter; only SSS proxy data), and Ombai Strait (the Ombai record hereafter). During the southeast monsoon (JJA), the mean value of SST of the Bali record is lower than that of the Seribu record (29.2 ± 0.6°C), but higher than that of the Ombai record (26.0 ± 0.9°C), and the mean value of SSS of the Bali, Seribu, S. Makassar, and Ombai records is almost consistent (Seribu: 0.08 ± 0.24%, S. Makassar: 0.01 ± 0.17%, Ombai: −0.04 ± 0.23%) (Figure 9A). During the northwest monsoon (DJF), the mean value of SST of the Bali record is almost the same with Seribu record (28.6 ± 0.75°C) and higher than that of the Ombai record (27.6 ± 0.64°C). For SSS data, the mean value of the Bali record is close to that of the Ombai record (0.10 ± 0.26%) and higher than that of the Seribu (−0.11 ± 0.17%) and the S. Makassar records (−0.16 ± 0.18%) (Figure 9B). Before 1995, the SSS of Bali record during DJF is mostly higher than that of Seribu and S. Makassar, while after 1996, the SSS of the Bali record shifted fresh conditions and is lower than the Seribu and S. Makassar records (Figure 9B).
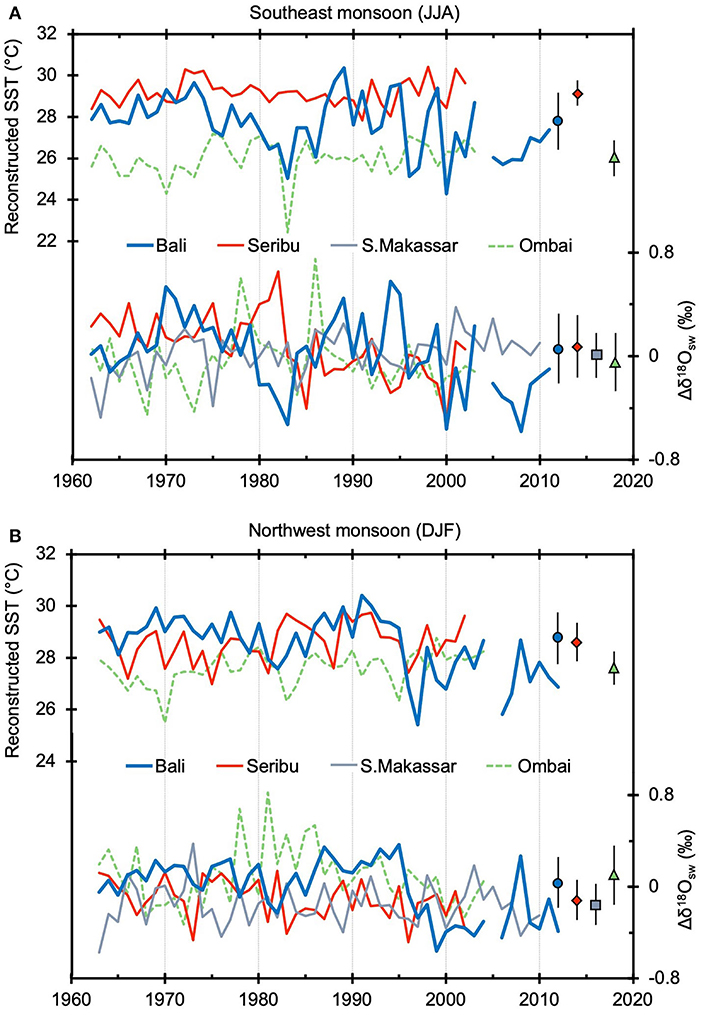
Figure 9. Time series of SST and Δδ18Osw reconstructed from coral Sr/Ca and δ18O in Bali (blue, in this study), Seribu (red, Genda et al., 2022), southern Makassar Strait (gray, Murty et al., 2017), and Ombai Strait (green, Cahyarini et al., 2014) records for (A) the southeast monsoon (JJA) and (B) the northwest monsoon (DJF). The mean value with error bar (±1SD) at each site is represented at right side in the graph.
Discussion
Temporal (and Spatial) Variations of SST and SSS at the Lombok Strait
Lombok Strait is the nearest and most closely aligned sea passage to Makassar Strait, which is the major outlet of the ITF. During the northwest monsoon, the winds produce northward surface currents in Lombok Strait (Chong et al., 2000). However, southward flows have been reported during this season in year with combined El Niño and positive IOD phases (Susanto et al., 2007); thus, surface currents in Lombok Strait are affected by both monsoons and climate variations. In addition, the upwelling off Java-Sumatra coast, which affects the sea surface environments, is associated with ENSO and IOD (Susanto et al., 2001; Du and Zhang, 2015). In 1994 and 1997 El Niño year, low-SST area spreads along the Java-Sumatra coast off compared with normal year due to the enlargement of upwelling by anomalous easterly winds, while in La Niña year, the opposite case occurs (weakening upwelling) (Susanto et al., 2001). Also, SSS along the Java-Sumatra coast increases during positive IOD phase and decreases during negative IOD phase (Du and Zhang, 2015). Although neither reconstructed SST nor SSS shows systematic and clear relations with ENSO and IOD as seen in Figures 7, 8, weak but significant correlations (p ≤ 0.1, ν = 48) are found between SST and ONI in DJF (r = 0.28; Figure 7A), Δδ18Osw and ONI in March–April–May (MAM) (r = 0.23; Figure 7F), and Δδ18Osw and DMI in MAM (r = 0.25; Figure 8F). In addition, both El Niño and positive IOD co-occurred in 1994 and 1997. Coral records show warm and saline anomalies in 1994, while anomalies of cool and lower salinity are found in 1997. Although climatic trends recorded in the coral are not consistent with those found along the Java-Sumatra coast, variations of coral signal would reflect influences from ENSO and/or IOD to some extent as seen in a large cooling event (~4°C) during 1996–1997.
Regarding monsoons, the linkages among various regional monsoons have been recognized such as Indian and Australian monsoons (e.g., Meehl, 1987) and the East Asian and Australian monsoon (e.g., Wang et al., 2003). Then, it is difficult to compare our results to a specific monsoon. Consequently, no simple factor explaining SST and SSS variations at Lombok Strait has been found. Nevertheless, recent cooling and freshening trends after 1996 (Figure 6) may be attributed to climate variations through the monsoon activities. Wang et al. (2014) examined future change in Asian–Australian monsoon, which is the Asian monsoon closely connected to the Indonesian–Australian monsoon (or Australian monsoon for short), under anthropogenic warming scenario and suggested that the total Asian–Australian monsoon precipitation at both land and ocean will increase significantly by the end of the 21st century. In their simulated records of precipitation from 1860 to 2090, the monsoon rainfall appeared to start to rise since the latter half of 1990s, corresponding to the freshening shift at Lombok Strait in this study (Figure 6B). In addition, a joint monsoon index for East Asian–Australian monsoons during boreal summer has been defined by Chen and Guan (2017) and they found that the East Asian–Australian monsoon has become stronger since 1993 whereas weaker before that for the period 1979–2013. In their study, colder SST anomalies are observed around north coast of Australia including Lombok Strait when the East Asian–Australian monsoon is anomalously strong. Then, recent cooling found in this study could be partially due to the intensified East Asian–Australian monsoon, although the timing of cooling in this study is delayed to the stronger shift of East Asian–Australian monsoon with 2–3 years.
The study on a joint monsoon index of East Asian–Australian monsoon has also found that the zonal wind anomaly around Indonesia in the key region (10°S−10°N, 95–145°E) plays a crucial role in the close relation between the East Asian summer monsoon and Australian winter monsoon. It is suggested that the anomalous convergence found around Kalimantan Island seems to connect Australian High and northwestern subtropical anticyclonic circulation (Chen and Guan, 2017). Therefore, we examined the temporal and spatial variations of SST and SSS in the Java Sea and south part of Makassar Strait located at south of Kalimantan, Lombok Strait, and Ombai Strait which is the major outlet of the ITF. The Java Sea is also important place where low-salinity buoyant water is passed to the southern Makassar Strait by South China Sea throughflow during the northwest monsoon (DJF). This “freshwater plug” interferes with transport of the surface layer in Makassar Strait and modulates heat transport into the Indian Ocean and air-sea flux; thus, it may affect the Asian monsoon and the climate variation of the Indian Ocean (Gordon et al., 2003). In addition, it has been considered that the major source of freshwater plug is precipitation around the Java Sea in the northwest monsoon (Lee et al., 2019). Figure 10 presents time series of SST and SSS anomalies from all records during the seasons of the northwest (DJF) and southeast (JJA) monsoons. In the year before 1995, the amplitude and mean values of SST and SSS anomalies in the Seribu, S. Makassar, and Bali records were mostly similar during the northwest monsoon (DJF) (Figure 10B), which suggests that the influence of the freshwater plug extended from the Java Sea to around Lombok Strait. Murty et al. (2018) reconstructed a century-long SSS record from δ18O in two coral cores from the northern and southern Lombok Strait and suggested that the northward flow in Lombok Strait from the South Java Current has been reduced since the 1960s due to the weakening of the East Asian winter monsoon. When the influence of the South Java Current is strong and northward flow occurs in Lombok Strait, the ITF in Makassar Strait cannot pass through Lombok Strait. Our conclusion that a similar water mass covered the surface of the Java Sea and Lombok Strait during the northwest monsoon from 1960 to 1995, signifying a small influence from the South Java Current at that time, supports the hypothesis of Murty et al. (2018). During the southeast monsoon (JJA), the Bali records of both SST and SSS anomalies differ from those of the Seribu and S. Makassar, particularly for SSS anomaly (Figure 10A). Because the Bali record of SST varies more widely than the Seribu and S. Makassar record during the southeast monsoon (JJA), surface conditions in Lombok Strait appear to be sensitive to mixing of water from the Mindanao current, the Indian Ocean, and the Banda Sea. After 1996, coral records in the Bali and Ombai show the decline in SSS during the northwest monsoon (DJF) that is not shown in the Seribu and S. Makassar (Figure 10B). In addition, the absolute value of SSS of the Bali record becomes lower than that of the Seribu and S. Makassar after 1996 (Figure 9B). Therefore, after 1996, the freshwater plug is not the primary factor of SSS variability in the Bali; instead, it seems that the surface condition in Lombok Strait has been changed.
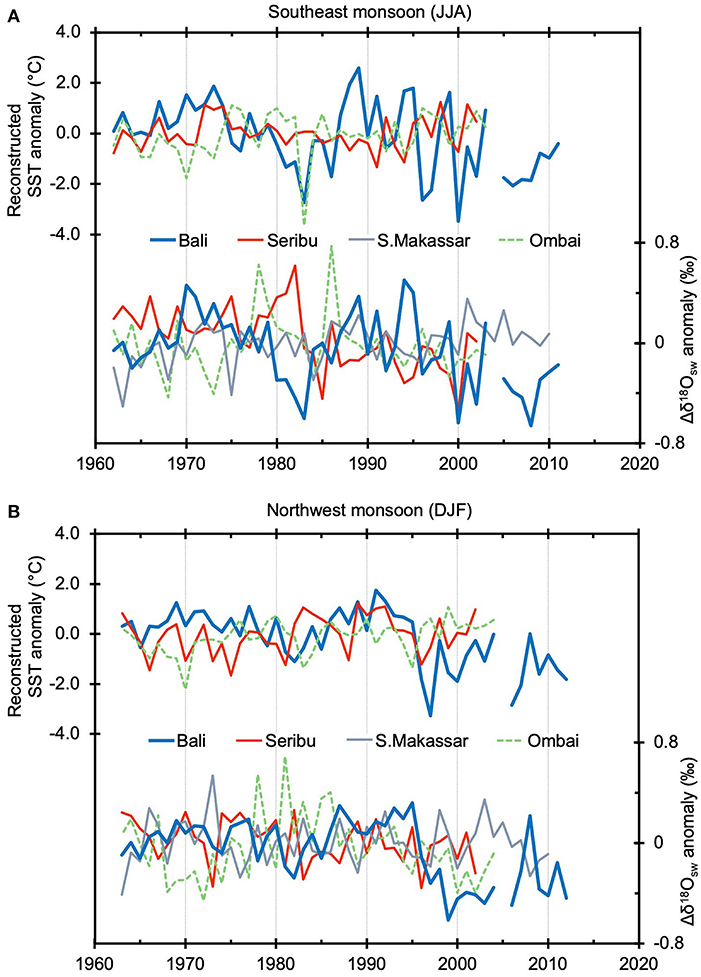
Figure 10. Time series of anomalies of reconstructed SST and Δδ18Osw in the Bali (blue), Seribu (red), southern Makassar Strait (gray), and Ombai Strait (green) records for (A) the southeast monsoon (JJA) and (B) the northwest monsoon (DJF).
Decadal Variability in SST and SSS in the Lombok Strait
The Bali record of SST and SSS displays alternating periods of warm (saline) and cool (fresh) conditions (Figure 6). Although Murty et al. (2018) suggested that the influence of the South Java Current has decreased since 1960s, the influence of the freshwater plug might vary on a decadal scale. According to Gordon et al. (2003), the freshwater plug suppresses the southward flow of warm surface water in Makassar Strait from the western Pacific into the Indian Ocean, leading to a cooler Indian Ocean sea surface. Given that the water in Lombok Strait is directly affected by the water in Makassar Strait, our coral record from Nusa Penida may document the impact of the freshwater plug. It may be that during warm and saline periods such as 1967–1975 and 1987–1995 (Figure 6), the influence of the freshwater plug is reduced and hence warm water of the ITF enters Lombok Strait unimpeded. On the contrary, cool and fresh condition periods are found in 1976–1986 and after 1996 (Figure 6), but each condition may be attributed to a different mechanism. In the period of 1976–1986, anomalies of reconstructed SSS and SST decreased only during the southeast monsoon (JJA), while those after 1996 decreased during both seasons with more extensive reduction in the northwest monsoon (DJF) (Figure 10). Therefore, it can be suggested that the former cool and fresh period could be due to the weakening of the southeast monsoon wind which usually remove the freshwater plug and bring warm and saline water from the Banda Sea. In this case, the impact of the freshwater plug is probably not diminished completely, leading to cool and fresh conditions. On the contrary, the most recent cool and fresh period (after 1996) seems to be the result of the combination of weakening of the southeast monsoon and the intensified northwest monsoon. Especially, a reduction in SSS of the Bali record is larger during the northwest monsoon (DJF), and there was also a decrease in SSS in the Ombai record (Figure 10B). As seen in Figure 6, the degrees of cooling and freshening appear to be small in 1976–1986 compared to those after 1996. Even if the former cool and fresh period was due to the weakening of the southeast monsoon, warm and saline water from the Banda Sea would contribute to some extent around the southern Makassar Strait. In contrast, after 1996, cool and fresh effect has been intensified probably due to the increase in local precipitation (Asian–Australian monsoonal precipitation) and the intensify of East Asian–Australian monsoon as mentioned above in addition to the persistent stay of the freshwater plug.
The mean decadal values of SSS and SST in the Seribu, Bali, and Ombai records demonstrate a freshening shift that started mostly in the 1980s (Figure 11). Although the Seribu and Ombai records show steady or slightly increasing SST in the 1980s and 1990s, the Bali record shows a continuous decrease from the 1980s to the 2000s. Because the surface of the Java Sea is not directly affected by the ITF passing through Makassar Strait, its slight warming is probably due to global warming, as has been reported at other sites in the Indonesian Seas. Also at Ombai Strait, coral records indicate that SST had risen by ~1.7°C in the 20th century (Cahyarini et al., 2014). In addition, at Kalimantan Island, the reconstructed SST shows a warming trend of 0.26°C per decade (Krawczyk et al., 2020). North of Sulawesi, at the edge of the western Pacific, an extensive warming trend of 0.25–0.40°C per decade during DJF has been reported for the 1982–2014 period (Iskandar et al., 2020). Unfortunately, long-term in situ temperature records do not exist, and reconstructed or satellite records of SST do not support the recent cooling found in this study. However, a cooling trend in Lombok Strait arising from reduced heat transport via the ITF is consistent with the observed warming trends at the western edge of the tropical western Pacific.
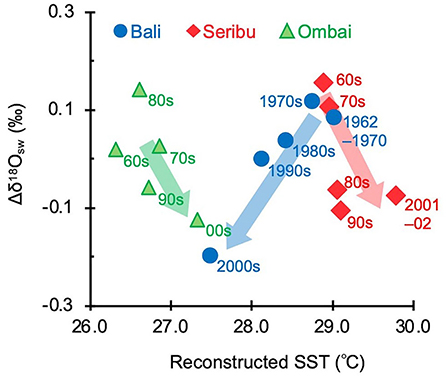
Figure 11. Temporal relationship of Δδ18Osw and SST at decadal timescales from 1960s to 2000s in Bali (blue circle) and Seribu (red diamond), and Ombai Strait (green triangle) records.
Although reconstructed SSS and SST of Seribu and Bali are plotted at almost same range in the 1960s and 1970s, a direction of the variation is different after the 1980s (Figure 11). Regarding the global warming, it has been suggested that a recent warming has started since 1975 based on statistical analyses (Papalexiou et al., 2020). Anthropogenic warming accelerated since 1975 may have some impacts on this variation. Since freshening trends on the decadal scale are also observed from the 1980s to the present in the previous study in Lombok Strait (Murty et al., 2018), freshening may be one of the effects or signals of the global warming at this site. In fact, as mentioned above, the future projections made by the selected multi-model mean suggested an increase in the total Asian–Australian monsoon precipitation under RCP4.5 warming scenario (Wang et al., 2014). Lombok Strait could be an important place to evaluate marine conditions in the Indonesian Seas through the variation of the ITF despite its very local and narrow strait.
Regarding the cooling trend, Varela et al. (2016) detected reduced upwelling and cooling of subsurface water near the southern coast of Java and suggested that changes in the water-column structure caused surface cooling. Their results also indicated subsurface water cooling in the southern part of Lombok Strait; thus, the cooling tendency in the southern part of Lombok Strait may also be associated with changes in the water column. However, if the influence of the South Java Current has been reduced since the 1960s (Murty et al., 2018), impacts from the Indian Ocean side of the strait may be negligible at our study site. For other explanation about the cooling trends, Cai et al. (2014) calculated the frequency of positive IOD event for the period 2000–2099 under RCP8.5 scenario. As a result, they found increased frequency of extreme positive IOD which induces cooling anomaly in the eastern Indian Ocean, due to greenhouse warming. They also found the negative anomaly of precipitation around the Java region (105.5–108.5°E, 6–8°S), which is inconsistent with recently freshening trend seen in our result. Based on SST and SSS records reconstructed from Seribu coral (Genda et al., 2022), it is suggested that the predominant climatic factor(s) controlling the SST and SSS variations around the Java Sea should be considered separately. Therefore, the cooling trend might be related to increase in frequency of positive IOD event while freshening trend could be more related to the Asian–Australian monsoon variation.
It may be that at Lombok Strait, the progress of global warming, which has been widely found in other areas in the Indonesian Seas and global, would be stagnation. Our hypothesis is based on the cooling trend reconstructed by coral Sr/Ca which is not observed in IGOSS SST. It would be more important to observe in situ local SST and SSS continuously, because it seems that SST and SSS vary from place to place in the Indonesian Seas. In other words, there is high diversity in marine conditions in this area, which is required to be examined more precisely in future.
Conclusions
We analyzed geochemical tracers (Sr/Ca and δ18O) in a coral sample collected from Nusa Penida located at the southern part of Lombok Strait to reconstruct SST and SSS for the period 1962–2012 and to evaluate their temporal and spatial variations in the Indonesian Seas. Although the interannual variabilities of SST and SSS at Lombok Strait have no systematic relation with ENSO and/or IOD, weak but significant correlations are found partly. Whereas, coral signals for climate variability are not consistent with the climatic tendency along the Java-Sumatra coast found from previous studies (Susanto et al., 2001; Du and Zhang, 2015), they would reflect influences from major ENSO and/or IOD to some extent as seen in a large cooling events during 1996–1997. On the contrary, the sea surface conditions in the southern part of Lombok Strait seem to be linked with several monsoons affecting on the Maritime Continent such as East Asian–Australian monsoon, Asian–Australian monsoon, and East Asian winter monsoon. For example, during the northwest monsoon (DJF), variation patterns of anomaly of SST and SSS in the southern part of Lombok Strait are similar to those in the western part of Java Sea and S. Makassar for the period 1962–1995, suggesting that the contribution of the freshwater plug reached around the Lombok Strait. On the contrary, during the southeast monsoon (JJA), Lombok Strait may be affected by the mixing of the water from the Mindanao current, the Indian Ocean, and the Banda Sea. For the decadal scale, we found decadal to sub-decadal variations in which warm (cold) and saline (fresh) conditions co-occur that could be explained by behaviors of the freshwater plug. During the warm and saline periods, the influence from the freshwater plug is reduced and hence warm surface water from the western Pacific contributes to the warming at Lombok Strait. On the contrary, during cool and fresh periods, the freshwater plug probably stays at the southern Makassar Strait persistently; hence, the surface of Lombok Strait becomes cool with little influence from the western Pacific. In addition, cooling and freshening trend was observed since 1996–2012. This is out of the trend of global warming, but mostly consistent with a trend demonstrated by recently proposed monsoon index of East Asian–Australian monsoon (Chen and Guan, 2017) and projected IOD development under greenhouse warming (Cai et al., 2014). Although this cooling trend is not found in IGOSS SST, the variation of freshwater plug which is strongly affected by the Asian–Australian monsoon is likely to have direct impact on surface of Lombok Strait, hence the behavior of the ITF.
Data Availability Statement
The δ18O and Sr/Ca data in a coral core BAL13-09 will be archived at the NOAA National Centers for Environmental Information for paleoclimatology at https://www.ncei.noaa.gov/access/paleo-search/study/36597.
Author Contributions
AG performed the experiments, analyzed the data, and wrote the manuscript. MIk, AS, and MIn supported the experiment. AA and MIn designed the project, and AA collected the coral sample. MIn coordinated the research and secured funding. All authors read and approved the manuscript.
Funding
This work was supported by a Japan Society for the Promotion of Science KAKENHI (Grant Numbers JP15H05329 and JP20K12135) and Yakumo Foundation for Environmental Science.
Conflict of Interest
The authors declare that the research was conducted in the absence of any commercial or financial relationships that could be construed as a potential conflict of interest.
Publisher's Note
All claims expressed in this article are solely those of the authors and do not necessarily represent those of their affiliated organizations, or those of the publisher, the editors and the reviewers. Any product that may be evaluated in this article, or claim that may be made by its manufacturer, is not guaranteed or endorsed by the publisher.
Acknowledgments
We thank the Ministry of RISTEK for issuing the permits for the research, measuring oceanographic parameters, and collecting the coral sample at Nusa Penida. This study was performed under the cooperative research program of the Center for Advanced Marine Research Core (CMCR), Kochi University (Accept numbers 19B058, 20A021, and 20B019), and Technical Cooperation of International Atomic Energy Agency (IAEA TC INS/7/006). We are grateful to T. Ishimura and Y. Yoshinaga for their help and support with the preparation and performance of δ18O measurements at the Geological Survey of Japan, National Institute of Advanced Industrial Science and Technology.
References
Cahyarini, S. Y., Pfeiffer, M., Nurhati, I. S., Aldrian, E., Dullo, W. C., and Hetzinger, S. (2014). Twentieth century sea surface temperature and salinity variations at Timor inferred from paired coral δ18O and Sr/Ca measurements. J. Geophys. Res. Oceans 119, 4593–4604. doi: 10.1002/2013jc009594
Cahyarini, S. Y., Pfeiffer, M., Timm, O., Dullo, W. C., and Schonberg, D. G. (2008). Reconstructing seawater δ18O from paired coral δ18O and Sr/Ca ratios: methods, error analysis and problems, with examples from Tahiti (French Polynesia) and Timor (Indonesia). Geochim. Cosmochim. Acta 72, 2841–2853. doi: 10.1016/j.gca.2008.04.005
Cai, W. J., Susanto, A., Wang, G. J., Weller, E., Wu, L. X., Ashok, K., et al. (2014). Increased frequency of extreme Indian Ocean Dipole events due to greenhouse warming. Nature 510, 254–258. doi: 10.1038/nature13327
Charles, C. D., Cobb, K. M., Moore, M. D., and Fairbanks, R. G. (2003). Monsoon-tropical ocean interaction in a network of coral records spanning the 20th century. Mar. Geol. 201, 207–222. doi: 10.1016/s0025-3227(03)00217-2
Chen, W., and Guan, Z. Y. (2017). A joint monsoon index for East Asian-Australian monsoons during boreal summer. Atmos. Sci. Lett. 18, 403–408. doi: 10.1002/asl.782
Chong, J. C., Sprintall, J., Hautala, S., Morawitz, W. L., Bray, N. A., and Pandoe, W. (2000). Shallow throughflow variability in the outflow straits of Indonesia. Geophys. Res. Lett. 27, 125–128. doi: 10.1029/1999gl002338
Correge, T. (2006). Sea surface temperature and salinity reconstruction from coral geochemical tracers. Palaeogeogr. Palaeoclimatol. Palaeoecol. 232, 408–428. doi: 10.1016/j.palaeo.2005.10.014
Dodge, R. E., and Vaisnys, J. R. (1975). Hermatypic coral growth banding as environmental recorder. Nature 258, 706–708. doi: 10.1038/258706a0
Du, Y., and Zhang, Y. H. (2015). Satellite and Argo observed surface salinity variations in the tropical Indian Ocean and their association with the Indian Ocean Dipole mode. J. Clim. 28, 695–713. doi: 10.1177/jdli-d14-00435.1
Felis, T., Lohmann, G., Kuhnert, H., Lorenz, S. J., Scholz, D., Patzold, J., et al. (2004). Increased seasonality in Middle East temperatures during the last interglacial period. Nature 429, 164–168. doi: 10.1038/nature02546
Felis, T., Patzold, J., Loya, Y., Fine, M., Nawar, A. H., and Wefer, G. (2000). A coral oxygen isotope record from the northern Red Sea documenting NAO, ENSO, and North Pacific teleconnections on Middle East climate variability since the year 1750. Paleoceanography 15, 679–694. doi: 10.1029/1999pa000477
Gagan, M. K., Ayliffe, L. K., Hopley, D., Cali, J. A., Mortimer, G. E., Chappell, J., et al. (1998). Temperature and surface-ocean water balance of the mid-Holocene tropical western Pacific. Science 279, 1014–1018. doi: 10.1126/science.279.5353.1014
Gagan, M. K., Chivas, A. R., and Isdale, P. J. (1994). High-resolution isotopic records from corals using ocean temperature and mass-spawning chronometers. Earth Planet. Sci. Lett. 121, 549–558. doi: 10.1016/0012-821x(94)90090-6
Genda, A., Ikehara, M., Suzuki, A., Hantoro, W. S., and Inoue, M. (2022). Unique behavior of marine conditions in the Java Sea reconstructed from 70 yr coral δ18O and Sr/Ca record from the Seribu Islands, Indonesia. Geochem J. 56, e1–e7. doi: 10.2343/geochemj.GJ22007
Gordon, A. L. (2005). Oceanography of the Indonesian Seas and their throughflow. Oceanography 18, 14–27. doi: 10.5670/oceanog.2005.01
Gordon, A. L., and Fine, R. A. (1996). Pathways of water between the Pacific and Indian oceans in the Indonesian seas. Nature 379, 146–149. doi: 10.1038/379146a0
Gordon, A. L., Susanto, R. D., and Vranes, K. (2003). Cool Indonesian throughflow as a consequence of restricted surface layer flow. Nature 425, 824–828. doi: 10.1038/nature02038
Iskandar, I., Mardiansyah, W., Lestari, D. O., and Masumoto, Y. (2020). What did determine the warming trend in the Indonesian sea? Prog. Earth Planet. Sci. 7, 20. doi: 10.1186/s40645-020-00334-2
Krawczyk, H., Zinke, J., Browne, N., Struck, U., McIlwain, J., O'Leary, M., et al. (2020). Corals reveal ENSO-driven synchrony of climate impacts on both terrestrial and marine ecosystems in northern Borneo. Sci. Rep. 10, 3678. doi: 10.1038/s41598-020-60525-1
Lee, T., Fournier, S., Gordon, A. L., and Sprintall, J. (2019). Maritime Continent water cycle regulates low-latitude chokepoint of global ocean circulation. Nat. Commun. 10, 2103. doi: 10.1038/s41467-019-10109-z
Linsley, B. K., Wu, H. C., Rixen, T., Charles, C. D., Gordon, A. L., and Moore, M. D. (2017). SPCZ zonal events and downstream influence on surface ocean conditions in the Indonesian Throughflow region. Geophys. Res. Lett. 44, 293–303. doi: 10.1002/2016gl070985
Meehl, G. A. (1987). The annual cycle and interannual variability in the tropical Pacific and Indian-Ocean regions. Mon. Weather Rev. 115, 27–50. doi: 10.1175/1520-0493(1987)115<0027:tacaiv>2.0.co;2
Mitsuguchi, T., Matsumoto, E., Abe, O., Uchida, T., and Isdale, P. J. (1996). Mg/Ca thermometry in coral-skeletons. Science 274, 961–963. doi: 10.1126/science.274.5289.961
Murty, S. A., Goodkin, N. F., Halide, H., Natawidjaja, D., Suwargadi, B., Suprihanto, I., et al. (2017). Climatic influences on southern Makassar Strait salinity over the past century. Geophys. Res. Lett. 44, 11967–11975. doi: 10.1002/2017gl075504
Murty, S. A., Goodkin, N. F., Wiguna, A. A., and Gordon, A. L. (2018). Variability in coral-reconstructed rea surface salinity between the northern and southern Lombok Strait linked to East Asian winter monsoon mean state reversals. Paleoceanogr. Paleoclimatol. 33, 1116–1133. doi: 10.1029/2018pa003387
Okai, T., Suzuki, A., Kawahata, H., Terashima, S., and Imai, N. (2002). Preparation of a new geological survey of Japan geochemical reference material: coral JCp-1. Geostand. Newsl.: J. Geostand. Geoanal. 26, 95–99. doi: 10.1111/j.1751-908X.2002.tb00627.x
Papalexiou, S. M., Rajulapati, C. R., Clark, M. P., and Lehner, F. (2020). Robustness of CMIP6 historical global mean temperature simulations: trends, long-term persistence, autocorrelation, and distributional shape. Earths Future 8, e2020EF001667. doi: 10.1029/2020ef001667
Potemra, J. T., Lukas, R., and Mitchum, G. T. (1997). Large-scale estimation of transport from the Pacific to the Indian Ocean. J. Geophys. Res. Oceans 102, 27795–27812. doi: 10.1029/97jc01719
Quinn, T. M., Crowley, T. J., Taylor, F. W., Henin, C., Joannot, P., and Join, Y. (1998). A multicentury stable isotope record from a New Caledonia coral: interannual and decadal sea surface temperature variability in the southwest Pacific since 1657 AD. Paleoceanography 13, 412–426. doi: 10.1029/98pa00401
Ren, L., Linsley, B. K., Wellington, G. M., Schrag, D. P., and Hoegh-Guldberg, O. (2003). Deconvolving the δ18O seawater component from subseasonal coral δ18O and Sr/Ca at Rarotonga in the southwestern subtropical Pacific for the period 1726 to 1997. Geochim. Cosmochim. Acta 67, 1609–1621. doi: 10.1016/s0016-7037(02)00917-1
Sprintall, J., Gordon, A. L., Koch-Larrouy, A., Lee, T., Potemra, J. T., Pujiana, K., et al. (2014). The Indonesian seas and their role in the coupled ocean-climate system. Nat. Geosci. 7, 487–492. doi: 10.1038/ngeo2188
Sprintall, J., and Révelard, A. (2014). The Indonesian Throughflow response to Indo-Pacific climate variability. J. Geophys. Res. Oceans 119, 1161–1175. doi: 10.1002/2013jc009533
Stephans, C. L., Quinn, T. M., Taylor, F. W., and Correge, T. (2004). Assessing the reproducibility of coral-based climate records. Geophys. Res. Lett. 31, L18210. doi: 10.1029/2004gl020343
Susanto, R. D., Gordon, A. L., and Sprintall, J. (2007). Observations and proxies of the surface layer throughflow in Lombok Strait. J. Geophys. Res. Oceans 112:C03S92. doi: 10.1029/2006jc003790
Susanto, R. D., Gordon, A. L., and Zheng, O. N. (2001). Upwelling along the coasts of Java and Sumatra sand its relation to ENSO. Geophys. Res. Lett. 18, 1599–1602. doi: 10.1029/2000gl011844
Suzuki, A., Yukino, I., and Kawahata, H. (1999). Temperature-skeletal δ18O relationship of Porites australiensis from Ishigaki Island, the Ryukyus, Japan. Geochem. J. 33, 419–428. doi: 10.2343/geochemj.33.419
Tanzil, J. T. I., Lee, J. N., Brown, B. E., Quax, R., Kaandorp, J. A., Lough, J. M., et al. (2016). Luminescence and density banding patterns in massive Porites corals around the Thai-Malay Peninsula, Southeast Asia. Limnol. Oceanogr. 61, 2003–2016. doi: 10.1002/lno.10350
Varela, R., Santos, F., Gomez-Gesteira, M., Alvarez, I., Costoya, X., and Dias, J. M. (2016). Influence of coastal upwelling on SST trends along the south coast of Java. PLoS ONE 11:e0162122. doi: 10.1371/journal.pone.0162122
Wang, B., Clemens, S. C., and Liu, P. (2003). Contrasting the Indian and East Asian monsoons: implications on geologic timescales. Mar. Geol. 201, 5–21. doi: 10.1016/s0025-3227(03)00196-8
Wang, B., Yim, S. Y., Lee, J. Y., Liu, J., and Ha, K. J. (2014). Future change of Asian-Australian monsoon under RCP 4.5 anthropogenic warming scenario. Clim. Dyn. 42, 83–100. doi: 10.1007/s00382-013-1769-x
Keywords: coral, geochemical tracers, Sr/Ca, δ18O, sea surface temperature, salinity, Lombok Strait
Citation: Genda A, Ikehara M, Suzuki A, Arman A and Inoue M (2022) Sea Surface Temperature and Salinity in Lombok Strait Reconstructed From Coral Sr/Ca and δ18O, 1962–2012. Front. Clim. 4:918273. doi: 10.3389/fclim.2022.918273
Received: 12 April 2022; Accepted: 20 May 2022;
Published: 18 July 2022.
Edited by:
Yu-Lin Eda Chang, Japan Agency for Marine-Earth Science and Technology, JapanReviewed by:
Takanori Horii, Japan Agency for Marine-Earth Science and Technology (JAMSTEC), JapanHorng-Sheng Mii, National Taiwan Normal University, Taiwan
Copyright © 2022 Genda, Ikehara, Suzuki, Arman and Inoue. This is an open-access article distributed under the terms of the Creative Commons Attribution License (CC BY). The use, distribution or reproduction in other forums is permitted, provided the original author(s) and the copyright owner(s) are credited and that the original publication in this journal is cited, in accordance with accepted academic practice. No use, distribution or reproduction is permitted which does not comply with these terms.
*Correspondence: Ai Genda, cHd2OTYwN3NAcy5va2F5YW1hLXUuYWMuanA=
 Ai Genda
 Minoru Ikehara
 Atsushi Suzuki
 Ali Arman4,5
 Mayuri Inoue