 Takeshi Doi
 Swadhin Behera
- Application Laboratory (APL), Research Institute for Value-Added-Information Generation (VAiG), Japan Agency for Marine-Earth Science and Technology (JAMSTEC), Yokohama, Japan
In this study, we explored impacts of interannual variations of chlorophyll on seasonal predictions of the tropical Pacific by the SINTEX-F2 dynamical climate prediction system, which is highly skillful at predicting El Niño/Southern Oscillation (ENSO) and other tropical climate phenomena. We conducted twin re-forecast experiments; one system used the observed climatology of chlorophyll to compute the shortwave absorption in the upper ocean, while the other used the observed chlorophyll with year-to-year variations. Although the chlorophyll impacts on predictions of the Niño 3.4 index were limited, improvements are noticed in the predictions of sea surface temperature over the eastern edge of the Western Pacific Warm Pool. This region corresponds to the separation between warm, low-salinity waters of the warm Pool and cold, high-salinity upwelled waters of the Pacific cold tongue in the central-eastern equatorial Pacific. The improvement was very striking in the 2015 case, when a super El Nino occurred.
Introduction
Phytoplankton and chlorophyll (Chla) can affect the absorption of shortwave radiation and thus the vertical distribution of heat in the upper ocean (Lewis et al., 1983). Some previous works already showed that seasonal cycle of Chla is important for modifying and reducing the bias of annual mean and seasonal cycle of shortwave absorption and, especially in the tropics, where the thermocline depth is shallow, the Chla concentration is large, and the shortwave radiation is strong (Nakamoto et al., 2001; Sweeney et al., 2005; Löptien et al., 2009).
Some climate models, including the SINTEX-F2 CGCM (Masson et al., 2012), use the satellite-observed climatology of chlorophyll to compute the shortwave absorption in the upper ocean. However, interannual variations in Chla are important as some previous works demonstrated that interannual variations of Chla could dampen El Niño/Southern Oscillation (ENSO) variability by 10–40% in CGCM experiments and hybrid coupled physics-biogeochemistry models (Timmermann and Jin, 2002; Jochum et al., 2010; Kang et al., 2017; Tian et al., 2021). Those studies also presented possible processes; during El Niño, equatorial upwelling and therefore phytoplankton nutrient supply is reduced and the mixed layer depth is increased, which can reduce Chla concentrations and associated biological heating (Figure 1). Reduced Chla also could deepen the mixed layer depth via reduced surface warming and subsurface cooling. Tian et al. (2021) also showed that interannual Chla anomalies could modulate vertical redistribution of penetrative shortwave radiation between the mixed layer and subsurface layers and affect ocean stratification and vertical mixing, which weaken the thermocline and Ekman feedback related to ENSO. Park et al. (2018) showed that the Chla-induced thermodynamic response is quicker compared to the wind-induced dynamical response, and thus can work as a precursor of ENSO using a long-term global Earth system model simulation incorporating marine biogeochemical processes. A further study of such physical-biogeochemical feedbacks via Chla may newly find room for improvement in processes and predictions associated with ENSO (Lee et al., 2014; Zhang et al., 2018; Tian et al., 2020).
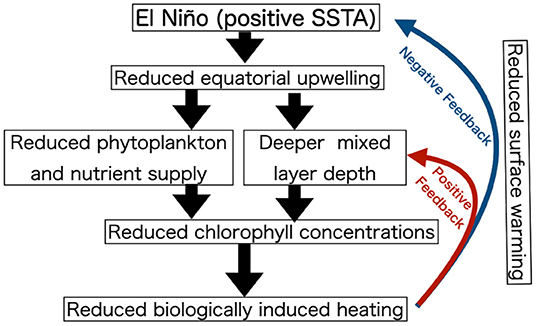
Figure 1. Schematic image of a possible impact of interannual variation of chlorophyll on ENSO.
To the best of our knowledge, an exploration of possible impacts of the interannual variations of Chla on seasonal predictions by a dynamical prediction system has not yet been presented, thus it is the focus of this study. We evaluated such a response by using the SINTEX-F2 prediction system, which has demonstrated its outstanding performance of predicting ENSO, Indian Ocean Dipole, and other tropical climate phenomena (see Section Methods).
Methods
Twin Re-forecast Experiments With the SINTEX-F2 Model
The dynamical seasonal prediction system is based on a fully coupled global ocean–atmosphere circulation model (CGCM) called the Scale Interaction Experiment-Frontier ver. 2 (SINTEX-F2) developed under the EU–Japan collaborative framework (Masson et al., 2012; Sasaki et al., 2013), which has a higher-resolution relative to the previous version of the SINTEX-F prediction system (Luo et al., 2003, 2005; Masson et al., 2005). The SINTEX-F2 also has a dynamical sea-ice model, while the previous version did not have it and simply restored the sea-ice concentration to the observed climatology. This system adopts a relatively simple initialization scheme based only on the nudging of the sea surface temperature (SST) data (Doi et al., 2016) and a three-dimensional variational ocean data assimilation (3DVAR) method by taking three-dimensional observed ocean temperature and salinity data into account (Doi et al., 2017). In this study, we used 12-members ensemble system in consideration of the uncertainties of both initial conditions and model physics (Doi et al., 2019a). The SINTEX-F2 has shown excellent predictive skills for predictions of ENSO, Indian Ocean Dipole, and other tropical climate phenomena (Doi et al., 2016, 2017, 2019a,b, 2020a,b; Lu et al., 2021; Pradhan et al., 2021; Xue et al., 2021). Based on the system, we conducted the twin re-forecast runs with a 12 (6)-month lead-time from the first day of each month from January (July) during 2000-2020; one system (F2) used the observed climatology of chlorophyll to compute the shortwave absorption in the upper ocean (Lengaigne et al., 2007), while the other (F2chT) used the observed chlorophyll including the interannual variations from MODIS-Terra (http://oceancolor.gsfc.nasa.gov/cgi/l3). The differences in the outputs between the twin experiments were studies as impacts of interannual variations of chlorophyll on ENSO predictions.
The prediction anomalies were determined by removing the model mean climatology at each lead-time using the re-forecast outputs over the period 2000–2020. To evaluate the prediction results, we used the NOAA OISSTv2 (Reynolds et al., 2002) for SST. The monthly climatologies were also calculated by averaging the monthly data from 2000 to 2020, and then the anomalies were derived through deviations from those climatologies.
For the mixed layer heat budget analysis, we used the daily outputs of on-line computation of the terms of the heat budget at the time-stepping by the ocean component of the SINTEX-F2 (NEMO); total rate of change, contributions due to the sum of latent, shortwave, longwave and sensible heat fluxes, the zonal, meridional, and vertical advection, the lateral and vertical diffusion, and the tendency of temperature due to Asselin time filtering (e.g. Jouanno et al., 2011; Madec and the NEMO Team, 2016). The discretized form of the heat budget equations used in the model imposes to compute the entrainment term as the residual of those heat budget terms (Vialard and Delecluse, 1998).
Results
We begin by exploring historical time series of the Niño3.4 Index, which is defined as SST anomalies averaged over the central-western tropical Pacific (170°W−120°W, 5°S−5°N). At a first glance, the original F2 system seems to be skillful in predicting most of significant events at least one season ahead, though the onset stage and the amplitude of the events are not well predicted (Figure 2A). Contrary to our expectation, we could not find any significant differences between the F2 and the F2chT. This may be due to the fact that ENSO is not a dominant factor for the interannual variations of Chla in the Nino3.4 region. The Nino3.4 region is one of major high-nutrient/low-chlorophyll (HNLC) regions in the world (Coale et al., 1996), where the abundance of phytoplankton is low owing to the unavailability of iron (Behrenfeld et al., 2006). In contrast, a relatively high concentration of iron is observed in the western equatorial Pacific (Ryan et al., 2006). Therefore, the regressed spatial patterns of interannual Chla anomalies on the Nino3.4 index in observations showed that the maximum of the negative Chla anomalies associated with El Niño is found mainly over the eastern edge of the Western Pacific Warm Pool, which corresponds to the separation between warm, low-salinity waters of the warm Pool and cold, high-salinity upwelled waters of the Pacific cold tongue in the central-eastern equatorial Pacific (Zhang et al., 2018). Actually, based on a horizontal map of the differences in the prediction skills of SST in June–August between the twin experiments (Figure 3), we found the statistically significant skill improvement in the eastern edge of the Western Pacific Warm Pool (140°E−160°E, equator −10°N) above the 95% confidence levels on a paired t-test. In addition, we can find the skill degradation in the northern central tropical Pacific region. The SINTEX-F2 model has an underestimation bias of ENSO amplitude (Figure 2A). The bias may be enhanced via the damping effect of interannual variations of Chla. Although we should be careful of this skill degradation, the drop in skill is not so large relative to the skill improvements in other regions. Therefore, we have not discussed much about this minor skill degradation and focused more on the skill improvement part in this study.

Figure 2. (A) Monthly time series of the Niño3.4 Index (°C) from the observational data (black) and the predictions (12-ensemble mean) issued on January 1st and July 1st by F2 (blue) and F2chT (red). (B) Same as (A), but for the eastern edge of the Western Pacific Warm Pool (140°E−160°E, equator −10°N).
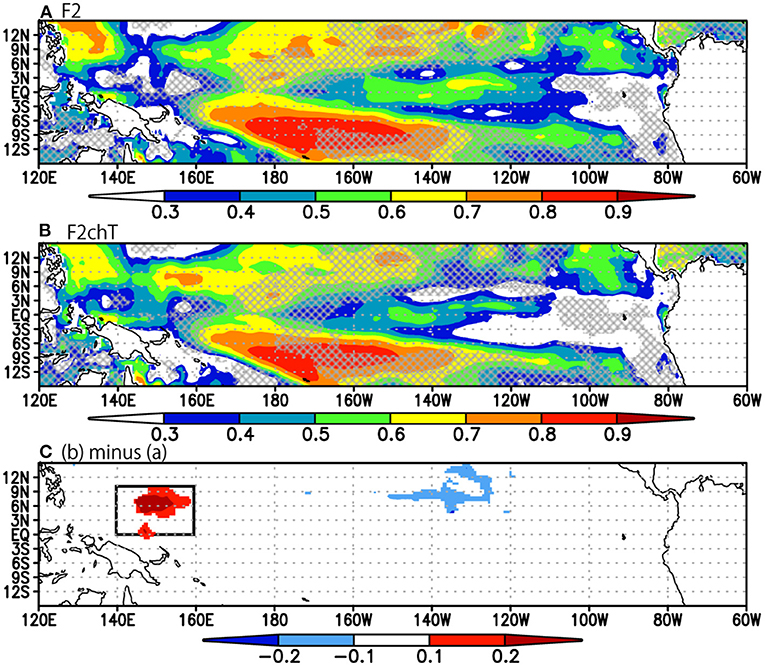
Figure 3. (A) Correlation skills for prediction of SST anomalies in June–August average issued on January 1st by the 2000–2020 re-forecast experiments by the F2 system. Values lower than the persistence (lag auto-correlation of observation) are shown by hatching. (B) Same as (A), but for the F2chT system. (C) (B) minus (A). The values which are statistically significant beyond the 95% confidence levels on the paired t-test are shown in color shades. The target region (140°E−160°E, equator −10°N) is shown by a black box.
Comparing the observed and predicted time series of the SST averaged in the target region, we found that the difference between the F2 and F2chT was striking in June 2015, which was statistically significant above the 90% confidence levels on a paired t-test (Figures 2B, 4A,B). The observation shows development of negative SST anomaly in June 2015, which was associated with occurrence of a super El Niño (Chen et al., 2017). Different from the observed anomalies, the ensemble mean prediction by the F2 system shows development of positive SST anomaly from January 1st, 2015, which reached the maximum in June 2015. That unrealistic development of the positive SST anomaly was toned down by the F2chT system.
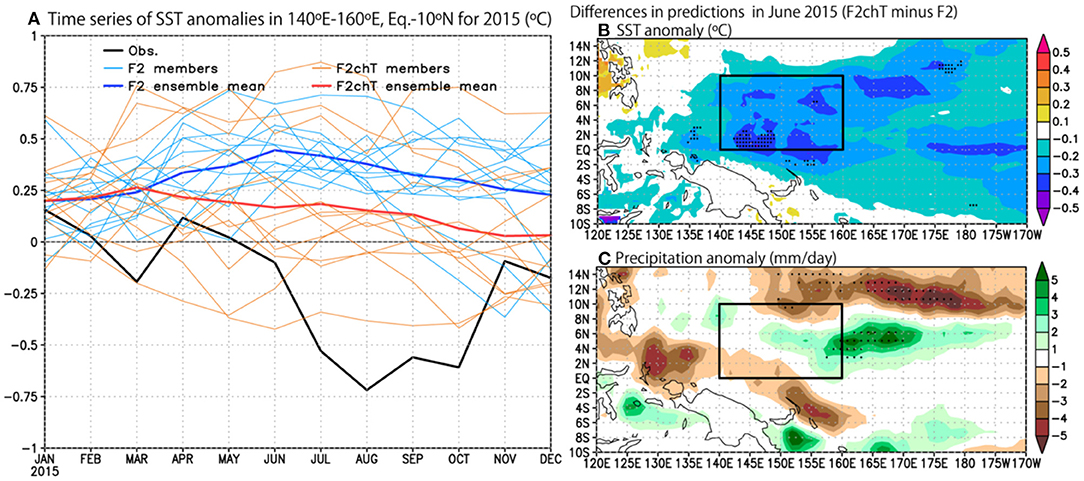
Figure 4. (A) Monthly time series of the SST in 140°E−160°E, equator −10°N (°C) from the observational data (black) and the predictions issued on January 1st, 2015 by F2 (12-ensemble mean: blue, individual members: right blue) and F2chT (12-ensemble mean: red, individual members: orange). (B) A horizontal map of differences in the ensemble mean predictions of SST anomalies (°C) in June 2015 (F2chT minus F2). Black dots indicate the statistically significant difference in the ensemble means between F2 and F2chT beyond the 90% confidence levels on paired t-test. (C) Same as (B), but for precipitation (mm/day−1).
The F2chT still could not capture well the development of the negative SST anomaly as seen in the observation. The observed cooling process in the target region is mainly due to the air-sea coupling dynamical development processes of the 2015 super El Niño (Chen et al., 2017; Ineson et al., 2018). However, the positive SST anomaly in the Nino3.4 region, an important aspect of the occurrence of the 2015 super El Niño, was not predicted well (Figure 2A). The deficiency might be due to the so-called spring prediction barrier of ENSO events (Latif et al., 1998; Ren et al., 2016; Behera et al., 2021). Actually, the SINTEX-F2 model captured the occurrence of the 2015 super El Niño after May 2015, although the amplitude was underestimated in the ensemble mean (Doi et al., 2019a). A strong westerly wind burst activity in 2015 may be important for successful prediction of the 2015 tropical Pacific condition (Ineson et al., 2018). However, the SINTEX-F2 as well as many climate models in the world have significant biases in their representation of the westerly wind burst activity (Tan et al., 2020). We need further efforts to improve the intraseasonal variability in the model (Baba, 2021), which is beyond the scope of this study.
The differences between the two re-forecast experiments disappeared when the model was initialized on July 1st, 2015 (Figure 3B). The SINTETX-F2 ensemble mean has an amplitude underestimation bias of the ENSO development for both experiments (Figure 3). We need further analysis from a viewpoint of probabilistic prediction as well as deterministic prediction for the rare and extreme case dynamics by conducting large ensemble members' re-forecast experiments (Doi et al., 2019a).
We could also see slight improvement in the target region for the latter half of 2009, which is related to an El Niño event. However, for other ENSO events (El Niño; 2002/03, 2006/07, La Niña; 1999/2000, 2007/08, 2010/11 2020/2021), we could not find any significant differences. The improvement of the skill over the target region shown in Figure 3C is mostly due to the 2015 super El Niño event.
The time series of the mixed-layer heat budget analysis shows that the contribution from the surface heat flux was dominant to the difference between the F2chT and the F2 during March 15, 2015–April 30, 2015 (Figure 5C), when the balance between the warming by the meridional advection and the entrainment and the cooling by the vertical diffusion played an important role on the heat budget in the target region by the F2 and F2chT (Figures 5A,B). Then, the cooling by the meridional advection and the vertical diffusion was dominant in May 2015 for the difference between the F2chT and the F2. Although the interpretation of the mixed-layer heat budget was too difficult to exactly specify the reason for the differences in the simulations, we focused on the early stage during March 15, 2015–April 30, 2015. A horizontal distribution of the mixed-layer heat budget averaged in March 15, 2015–April 30, 2015 shows contributions of several key processes; the zonal and meridional advections, vertical diffusion, as well as surface heat flux (Figure 6). For the surface heat flux contribution in April 2015 over the target region, the latent heat loss associated with the enhanced trade wind was dominant (Figures 7A–D). The enhanced trade wind seems to be related to the colder SST in the east of the target region (Figure 7E), where the mixed layer depth was also increased (Figure 7F). The deeper mixed layer depth at that region could also be due to the reduced Chla (Figure 7G) via reduced surface warming and subsurface cooling. This is partly consistent with the damping process of El Niño via Chla discussed by the previous work (Jochum et al., 2010). The deeper mixed layer depth may propagate westward and extend to the target region as Rossby waves. Moreover, the difference in the SST prediction between the F2 and the F2chT could contribute to a difference in the rainfall prediction (Figure 4C). Therefore, considering the interannual variation of Chla is important for predicting not only the oceanic conditions but also atmospheric conditions via air-sea coupling in the tropical Pacific.

Figure 5. (A) The mixed-layer heat budget analysis (°C/day) averaged in 140°E–160°E, equator −10°N of the ensemble mean predictions by F2 after 30-days running mean of the daily outputs. Total rate of change, contributions from the surface heat flux, zonal advection, meridional advection, vertical advection, vertical diffusion, lateral diffusion, entrainment, and Asselin time filtering are shown by black, red, green, blue, light blue, purple, magenta, orange, and gray lines, respectively. (B) Same as (A), but for F2chT. (C) (B) minus (A).

Figure 6. Differences in the mixed-layer heat budget analysis (°C/30days) averaged in March 15, 2015–April 30, 2015 of the ensemble mean predictions (F2chT minus F2) (A) Total rate of change. Black dots indicate the statistically significant difference in the ensemble means between F2 and F2chT beyond the 90% confidence levels on paired t-test. (B–H) Contributions from the surface heat flux, zonal advection, meridional advection, vertical advection, entrainment, vertical diffusion, and lateral diffusion, respectively.
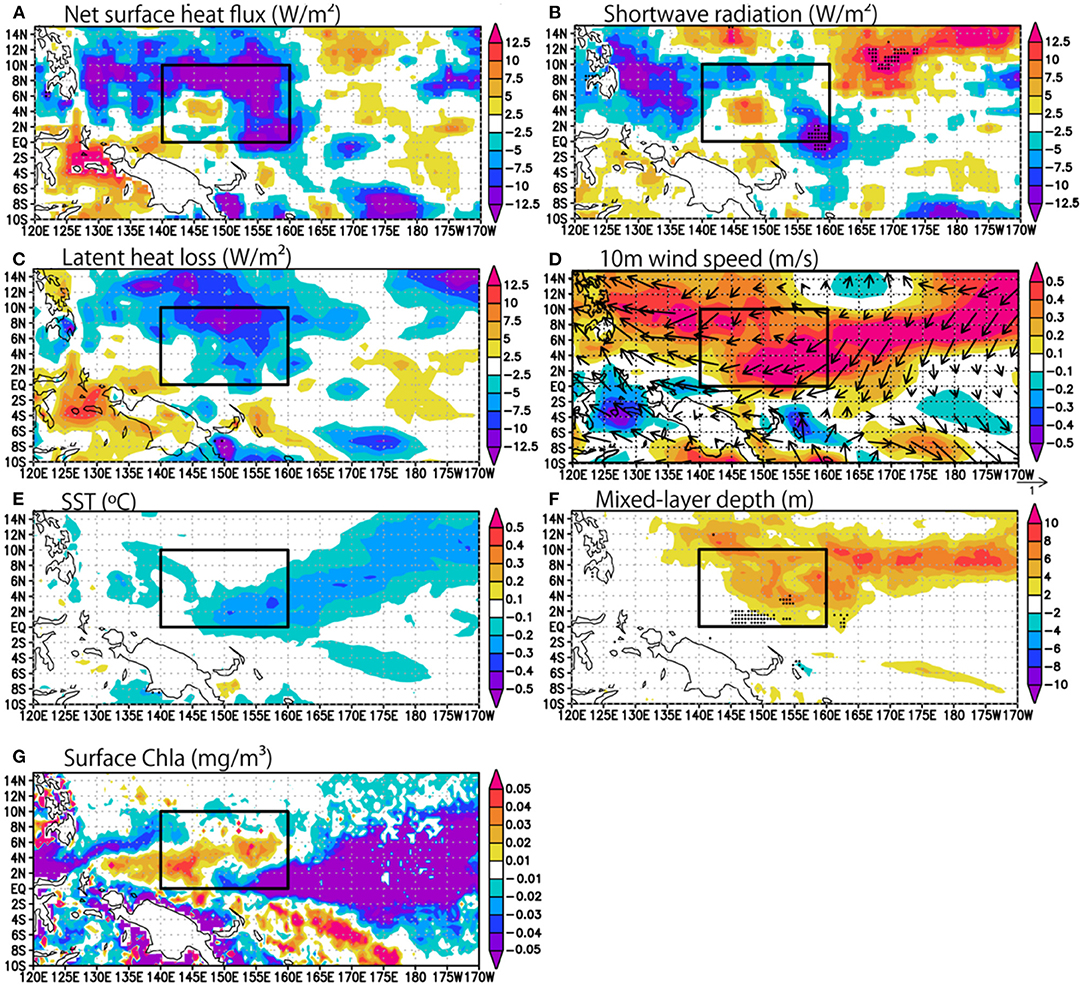
Figure 7. (A) Differences in the net surface heat flux anomalies (W/m2) averaged in April 2015 of the ensemble mean predictions (F2chT minus F2). Black dots indicate the statistically significant difference in the ensemble means between F2 and F2chT beyond the 90% confidence levels on paired t-test. (B) Same as (A), but for the shortwave radiation (W/m2). (C) Same as (A), but for the latent heat loss (W/m2). (D) Same as (A), but for the 10m wind (m/s, vector) and speed (m/s, shade). (E) Same as (A), but for the SST (°C). (F) Same as (A), the mixed-layer depth (m). (G) Differences in the Chla (mg/m3) in F2chT minus F2.
The F2chT predictions show larger ensemble spread relative to the F2 prediction (Figure 4A). Interestingly, 9 out of 12 members of the F2chT show cooling tendency, while 3 ensemble members show warming tendency. It might be interesting to compare the difference between the warmest 3 ensemble means of the F2chT and the F2 ensemble mean with that of the other 9 ensemble means of the F2chT and the F2 ensemble mean (Figure 8). Although the other 9 ensemble means are similar to the F2chT ensemble mean, the warmest 3 ensemble means are almost a mirror image of the F2chT ensemble mean; the time series of the mixed-layer heat budget analysis shows that the contribution from the surface heat flux was dominant to the difference between the warmest 3 ensemble means and the other 9 ensemble means during February 1, 2015–March 31, 2015 (Figures 8C,D). The latent heat loss, associated with the weaker trade winds, was the dominant contributor to the net surface heat loss during February–March 2015 over the target region (Figures 8E,G,I). The mixed layer depth was also decreased (Figure 8K). Those larger uncertainties among the ensemble members of the F2chT may be due to the shallower mixed-layer depth during January–February 2015 (Figure 9A), which could be due to the increased Chla (Figure 9B) via enhanced surface warming and subsurface cooling.

Figure 8. (A) Same as Figure 4B, but for the 3 warmest members mean of F2chT minus F2 ensemble mean. (C) Same as Figure 5C, but for the 3 warmest members mean of F2chT minus F2 ensemble mean. (E,G,K,J) Same as Figures 7A,C,D,F, but for the 3 warmest members mean of F2chT minus F2 ensemble mean averaged in Feburuary–March 2015. (B,D,F,H,J,L) Same as (A,C,E,G,I,K), but for the other 9 members mean of F2chT minus F2 ensemble mean.
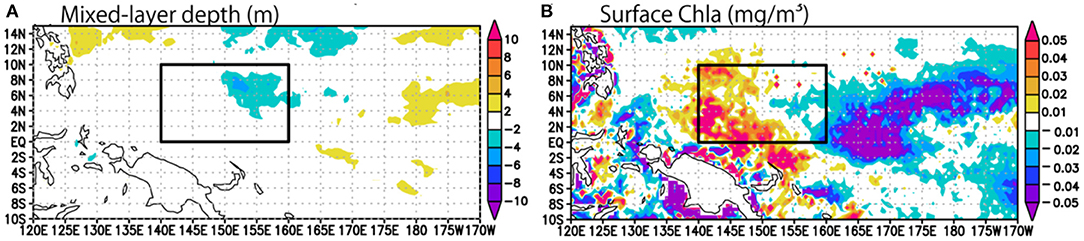
Figure 9. (A,B) Same as Figures 7F,G, but for January–February 2015.
Conclusions
In order to present a skill assessment from a view point of impacts of interannual variations of Chla on seasonal predictions, we conducted twin re-forecast experiments with the SINTEX-F2 dynamical seasonal prediction system: one system used the observed climatology of Chla to compute the shortwave absorption in the upper ocean, while the other used the observed Chla with year-to-year (interannual) variations. Although the interannual Chla impacts on predictions of SST in the central-eastern equatorial Pacific were limited, improvements in predictions of SST were found over the eastern edge of the Western Pacific Warm Pool, in particular for the 2015 super El Niño year. The results showed that considering the interannual variation of Chla in a dynamical seasonal prediction system is potentially important for improvement of seasonal climate predictions.
Several mixed-layer processes are found to play a role in the improvements in the SST predictions. Those seem partly related to the damping process of El Niño via Chla. However, the exact contributions of those processes are complicated to be fully understood at this stage.
Several factors could affect the results. For example, although this study used the satellite-observational data of surface Chla concentration, the maximum Chla concentration is actually observed at the subsurface ocean in the tropical Pacific (Le Borgne et al., 2002; Lee et al., 2014; Yasunaka et al., 2021). Developing a sustainable ocean observing system with Biogeochemical (BGC) Argo (Bittig et al., 2019) will shed light on 3-dimentional variations of Chla, which could not be observed only by the satellites. Along with the development of the observational system, a new scheme to compute the shortwave absorption in the upper ocean based on the vertical profile of Chla should be developed. For example, Manizza (2005) uses the entire vertical profile of Chla to compute the induced biological heating at each vertical level. Such a parameterization might enhance the impact of Chla in the tropical Pacific (Park et al., 2014). In addition, a seasonal prediction system based on a global Earth system model to resolve physical-biogeochemical feedbacks via Chla may open a new door to discovery of predictability of variations in the marine system associated with the ENSO, including ocean warming, acidification, deoxygenation, biological production, and biodiversity (e.g. Park et al., 2019). On the other hand, we should be careful of possible skill degradation by those approaches. For example, Lim et al. (2018) demonstrated that an overestimation bias of mean Chla state in the tropics in their earth system model enhanced cold SST bias in the tropical Pacific. Further studies in such research streams are necessary. The tropical Pacific may serve as an optimal test-bed for those studies, because the interannual dynamical variations associated with the ENSO are already predictable with high accuracy relative to other basins.
Data Availability Statement
The raw data supporting the conclusions of this article will be made available by the authors, without undue reservation.
Author Contributions
TD performed the seasonal prediction experiments, analyzed the observation data, and model prediction outputs. Both authors contributed to designing the research, interpreting results, and writing the manuscript.
Funding
This research was supported by JSPS KAKENHI Grant 20K04074.
Conflict of Interest
The authors declare that the research was conducted in the absence of any commercial or financial relationships that could be construed as a potential conflict of interest.
Publisher's Note
All claims expressed in this article are solely those of the authors and do not necessarily represent those of their affiliated organizations, or those of the publisher, the editors and the reviewers. Any product that may be evaluated in this article, or claim that may be made by its manufacturer, is not guaranteed or endorsed by the publisher.
Acknowledgments
We are sincerely grateful to Drs. Wataru Sasaki, Jing-Jia Luo, Sebastian Masson, Andrea Storto, Antonio Navarra, Silvio Gualdi and our European colleagues of INGV/CMCC, L'OCEAN, and MPI for their contributions in developing the prototype prediction system. We would also like to thank three reviewers for their constructive comment and Drs. Toshio Yamagata and Hyung-Gyu Lim for their helpful comments and suggestions. The GrADS software was used for creating the figures and the maps.
References
Baba, Y. (2021). Improved intraseasonal variability in the initialization of SINTEX-F2 using a spectral cumulus parameterization. Int. J. Climatol. 41, 6690–6712. doi: 10.1002/joc.7220
Behera, S. K., Doi, T., and Luo, J.-J. (2021). Air–sea interaction in tropical Pacific: the dynamics of El Niño/Southern Oscillation. In: Tropical and Extratropical Air-Sea Interactions (Elsevier). p. 61–92. doi: 10.1016/B978-0-12-818156-0.00005-8
Behrenfeld, M. J., Worthington, K., Sherrell, R. M., Chavez, F. P., Strutton, P., McPhaden, M., et al. (2006). Controls on tropical Pacific Ocean productivity revealed through nutrient stress diagnostics. Nature. 442, 1025–1028. doi: 10.1038/nature05083
Bittig, H. C., Maurer, T. L., Plant, J. N., Schmechtig, C., Wong, A. P. S., Claustre, H., et al. (2019). A BGC-argo guide: planning, deployment, data handling and usage. Front. Mar. Sci. vol. 6. doi: 10.3389/fmars.2019.00502
Chen, L., Li, T., Wang, B., and Wang, L. (2017). Formation mechanism for 2015/16 super El Niño. Sci. Rep. 7, 2975. doi: 10.1038/s41598-017-02926-3
Coale, K. H., Johnson, K. S., Fitzwater, S. E., Gordon, R. M., Tanner, S., Chavez, F. P., et al. (1996). A massive phytoplankton bloom induced by an ecosystem-scale iron fertilization experiment in the equatorial Pacific Ocean. Nature. 383, 495–501. doi: 10.1038/383495a0
Doi, T., Behera, S. K., and Yamagata, T. (2016). Improved seasonal prediction using the SINTEX-F2 coupled model. J. Adv. Model. Earth Syst. 8, 1847–1867. doi: 10.1002/2016MS000744
Doi, T., Behera, S. K., and Yamagata, T. (2019a). Merits of a 108-member ensemble system in ENSO and IOD predictions. J. Clim. 32, 957–972. doi: 10.1175/JCLI-D-18-0193.1
Doi, T., Behera, S. K., and Yamagata, T. (2020a). Predictability of the super IOD event in 2019 and its link with El Niño Modoki. Geophys. Res. Lett. 47, e2019GL086713. doi: 10.1029/2019GL086713
Doi, T., Behera, S. K., and Yamagata, T. (2020b). Wintertime impacts of the 2019 super IOD on East Asia. Geophys. Res. Lett. 47, e2020GL089456. doi: 10.1029/2020GL089456
Doi, T., Storto, A., Behera, S. K., Navarra, A., and Yamagata, T. (2017). Improved prediction of the Indian Ocean dipole mode by use of subsurface ocean observations. J. Clim. 30, 7953–7970. doi: 10.1175/JCLI-D-16-0915.1
Doi, T., Storto, A., Fukuoka, T., Suganuma, H., and Sato, K. (2019b). Impacts of temperature measurements from sea turtles on seasonal prediction around the arafura sea. Front. Mar. Sci. 6. doi: 10.3389/fmars.2019.00719
Ineson, S., Balmaseda, M. A., Davey, M. K., Decremer, D., Dunstone, N. J., Gordon, M., et al. (2018). Predicting El Niño in 2014 and 2015. Sci. Rep. 8, 10733. doi: 10.1038/s41598-018-29130-1
Jochum, M., Yeager, S., Lindsay, K., Moore, K., and Murtugudde, R. (2010). Quantification of the feedback between phytoplankton and ENSO in the community climate system model. J. Clim. 23, 2916–2925. doi: 10.1175/2010JCLI3254.1
Jouanno, J., Marin, F., du Penhoat, Y., Sheinbaum, J., and Molines, J.-M. (2011). Seasonal heat balance in the upper 100 m of the equatorial Atlantic Ocean. J. Geophys. Res. 116, C09003. doi: 10.1029/2010JC006912
Kang, X., Zhang, R. H., Gao, C., and Zhu, J. (2017). An improved ENSO simulation by representing chlorophyll-induced climate feedback in the NCAR community earth system model. Sci. Rep. 7, 1–9. doi: 10.1038/s41598-017-17390-2
Latif, M., Anderson, D., Barnett, T., Cane, M., Kleeman, R., Leetmaa, A., et al. (1998). A review of the predictability and prediction of ENSO. J. Geophys. Res. 103, 14375. doi: 10.1029/97JC03413
Le Borgne, R., Barber, R. T., Delcroix, T., Inoue, H. Y., Mackey, D. J., and Rodier, M. (2002). Pacific warm pool and divergence: temporal and zonal variations on the equator and their effects on the biological pump. Deep Sea Res. Part II Top. Stud. Oceanogr. 49, 2471–2512. doi: 10.1016/S0967-0645(02)00045-0
Lee, K.-W., Yeh, S.-W., Kug, J.-S., and Park, J.-Y. (2014). Ocean chlorophyll response to two types of El Niño events in an ocean-biogeochemical coupled model. J. Geophys. Res. Ocean. 119, 933–952. doi: 10.1002/2013JC009050
Lengaigne, M., Menkes, C., Aumont, O., Gorgues, T., Bopp, L., André, J.-M., et al. (2007). Influence of the oceanic biology on the tropical Pacific climate in a coupled general circulation model. Clim. Dyn. 28, 503–516. doi: 10.1007/s00382-006-0200-2
Lewis, M. R., Cullen, J. J., and Platt, T. (1983). Phytoplankton and thermal structure in the upper ocean: Consequences of nonuniformity in chlorophyll profile. J. Geophys. Res. 88, 2565. doi: 10.1029/JC088iC04p02565
Lim, H.-G., Park, J.-Y., and Kug, J.-S. (2018). Impact of chlorophyll bias on the tropical Pacific mean climate in an earth system model. Clim. Dyn. 51, 2681–2694. doi: 10.1007/s00382-017-4036-8
Löptien, U., Eden, C., Timmermann, A., and Dietze, H. (2009). Effects of biologically induced differential heating in an eddy-permitting coupled ocean-ecosystem model. J. Geophys. Res. Ocean. 114, 1–17. doi: 10.1029/2008JC004936
Lu, X., Yuan, C., Yang, M., Doi, T., Wahiduzzaman, M., and Luo, J. (2021). Prediction of summer extreme hot days in China using the SINTEX-F2. Int. J. Climatol. 41, 4966–4976. doi: 10.1002/joc.7110
Luo, J. J., Masson, S., Behera, S., Delecluse, P., Gualdi, S., Navarra, A., et al. (2003). South Pacific origin of the decadal ENSO-like variation as simulated by a coupled GCM. Geophys. Res. Lett. 30, 4–7. doi: 10.1029/2003GL018649
Luo, J. J., Masson, S., Behera, S., Shingu, S., and Yamagata, T. (2005). Seasonal climate predictability in a coupled OAGCM using a different approach for ensemble forecasts. J. Clim. 18, 4474–4497. doi: 10.1175/JCLI3526.1
Manizza, M. (2005). Bio-optical feedbacks among phytoplankton, upper ocean physics and sea-ice in a global model. Geophys. Res. Lett. 32, L05603. doi: 10.1029/2004GL020778
Masson, S., Luo, J. J., Madec, G., Vialard, J., Durand, F., Gualdi, S., et al. (2005). Impact of barrier layer on winter-spring variability of the southeastern Arabian Sea. Geophys. Res. Lett. 32, 1–4. doi: 10.1029/2004GL021980
Masson, S., Terray, P., Madec, G., Luo, J. J., Yamagata, T., and Takahashi, K. (2012). Impact of intra-daily SST variability on ENSO characteristics in a coupled model. Clim. Dyn. 39, 681–707. doi: 10.1007/s00382-011-1247-2
Nakamoto, S., Kumar, S. P., Oberhuber, J. M., Ishizaka, J., Muneyama, K., and Frouin, R. (2001). Response of the equatorial Pacific to chlorophyll pigment in a mixed layer isopycnal ocean general circulation model. Geophys. Res. Lett. 28, 2021–2024. doi: 10.1029/2000GL012494
Park, J.-Y., Kug, J.-S., and Park, Y.-G. (2014). An exploratory modeling study on bio-physical processes associated with ENSO. Prog. Oceanogr. 124, 28–41. doi: 10.1016/j.pocean.2014.03.013
Park, J.-Y., Stock, C. A., Dunne, J. P., Yang, X., and Rosati, A. (2019). Seasonal to multiannual marine ecosystem prediction with a global Earth system model. Science. 365, 284–288. doi: 10.1126/science.aav6634
Park, J. Y., Dunne, J. P., and Stock, C. A. (2018). Ocean chlorophyll as a precursor of ENSO: an earth system modeling study. Geophys. Res. Lett. 45, 1939–1947. doi: 10.1002/2017GL076077
Pradhan, M., Rao, S. A., Doi, T., Pillai, P. A., Srivastava, A., and Behera, S. (2021). Comparison of MMCFS and SINTEX-F2 for seasonal prediction of Indian summer monsoon rainfall. Int. J. Climatol. 41, 6084–6108. doi: 10.1002/joc.7169
Ren, H. L., Jin, F. F., Tian, B., and Scaife, A. A. (2016). Distinct persistence barriers in two types of ENSO. Geophys. Res. Lett. 43, 10–979. doi: 10.1002/2016GL071015
Reynolds, R. W., Rayner, N. A., Smith, T. M., Stokes, D. C., and Wang, W. (2002). An improved in situ and satellite SST analysis for climate. J. Clim. 15, 1609–1625. doi: 10.1175/1520-0442(2002)015<1609:AIISAS>2.0.CO;2
Ryan, J. P., Ueki, I., Chao, Y., Zhang, H., Polito, P. S., and Chavez, F. P. (2006). Western Pacific modulation of large phytoplankton blooms in the central and eastern equatorial Pacific. J. Geophys. Res. Biogeosci. 111. doi: 10.1029/2005JG000084
Sasaki, W., Richards, K. J., and Luo, J. J. (2013). Impact of vertical mixing induced by small vertical scale structures above and within the equatorial thermocline on the tropical Pacific in a CGCM. Clim. Dyn. 41, 443–453. doi: 10.1007/s00382-012-1593-8
Sweeney, C., Gnanadesikan, A., Griffies, S. M., Harrison, M. J., Rosati, A. J., and Samuels, B. L. (2005). Impacts of shortwave penetration depth on large-scale ocean circulation and heat transport. J. Phys. Oceanogr. 35, 1103–1119. doi: 10.1175/JPO2740.1
Tan, X., Tang, Y., Lian, T., Zhang, S., Liu, T., and Chen, D. (2020). Effects of semistochastic westerly wind bursts on ENSO predictability. Geophys. Res. Lett. 47. doi: 10.1029/2019GL086828
Tian, F., Zhang, R., and Wang, X. (2020). Effects on ocean biology induced by El Niño-accompanied positive freshwater flux anomalies in the tropical pacific. J. Geophys. Res. Ocean. 125. doi: 10.1029/2019JC015790
Tian, F., Zhang, R., Wang, X., and Zhi, H. (2021). Rectified effects of interannual chlorophyll variability on the tropical pacific climate revealed by a hybrid coupled physics-biology model. J. Geophys. Res. Ocean. 126. doi: 10.1029/2021JC017263
Timmermann, A., and Jin, F. F. (2002). Phytoplankton influences on tropical climate. Geophys. Res. Lett. 29, 1–4. doi: 10.1029/2002GL015434
Vialard, J., and Delecluse, P. (1998). An OGCM Study for the TOGA Decade. Part I: Role of Salinity in the Physics of the Western Pacific Fresh Pool. J. Phys. Oceanogr. 28, 1071–1088. doi: 10.1175/1520-0485(1998)028<1071:AOSFTT>2.0.CO;2
Xue, J., Doi, T., Luo, J., Yuan, C., and Yamagata, T. (2021). Predictability of the Chile Niño/Niña. Geophys. Res. Lett. 48. doi: 10.1029/2021GL095309
Yasunaka, S., Ono, T., Sasaoka, K., and Sato, K. (2021). Global distribution and variability of subsurface chlorophyll a concentration. Ocean Sci. Discuss. 18, 255–68. doi: 10.5194/os-2021-88
Keywords: chlorophyll, seasonal prediction, ENSO prediction, tropical Pacific, climate model
Citation: Doi T and Behera S (2022) Impacts of Interannual Variations of Chlorophyll on Seasonal Predictions of the Tropical Pacific. Front. Clim. 4:868594. doi: 10.3389/fclim.2022.868594
Received: 02 February 2022; Accepted: 24 March 2022;
Published: 14 April 2022.
Edited by:
Karumuri Ashok, University of Hyderabad, IndiaReviewed by:
Siva Reddy Sanikommu, King Abdullah University of Science and Technology, Saudi ArabiaF. Feba, University of Hyderabad, India
P. A. Francis, Indian National Centre for Ocean Information Services, India
Copyright © 2022 Doi and Behera. This is an open-access article distributed under the terms of the Creative Commons Attribution License (CC BY). The use, distribution or reproduction in other forums is permitted, provided the original author(s) and the copyright owner(s) are credited and that the original publication in this journal is cited, in accordance with accepted academic practice. No use, distribution or reproduction is permitted which does not comply with these terms.
*Correspondence: Takeshi Doi, dGFrZXNoaS5kb2lAamFtc3RlYy5nby5qcA==; orchid.org/0000-0002-7342-9145