
95% of researchers rate our articles as excellent or good
Learn more about the work of our research integrity team to safeguard the quality of each article we publish.
Find out more
METHODS article
Front. Clim. , 13 April 2022
Sec. Predictions and Projections
Volume 4 - 2022 | https://doi.org/10.3389/fclim.2022.866563
This article is part of the Research Topic Generating Actionable Climate Information in Support of Climate Adaptation and Mitigation View all 12 articles
 Irene Brox Nilsen1*
 Inger Hanssen-Bauer2
 Anita Verpe Dyrrdal3
 Hege Hisdal1
 Deborah Lawrence1
 Ingjerd Haddeland1Wai Kwok Wong
The Norwegian Centre for Climate Services (NCCS) has developed a production chain for climate information with the aim of delivering a knowledge base for climate change adaptation suitable for use by planners at various administrative levels in Norway. This process consists of two main steps: First, climate and hydrological projections are produced at a local scale (1 × 1 km resolution) using available results from global and regional climate models (GCMs and RCMs). In a second step, climate factsheets with abridged information relevant for individual counties in Norway have been co-produced with users and county authorities. Projections were produced by using a climate–hydrological modeling chain driven by downscaled simulations from 10 GCM–RCM combinations and two climate scenarios in which temperature and precipitation were first downscaled and bias-adjusted to a 1 × 1 km resolution. Bias-adjustment was necessary, partly due to biases in the RCMs. These results were published in the Norwegian climate assessment report “Climate in Norway 2100.” The results have then been disseminated through various formats, such as reports, dataportals, visualizations and factsheets (available at https://klimaservicesenter.no/). NCCS has issued climate factsheets for 17 counties in Norway and Svalbard. The county-wise climate factsheets have become the most extensive product issued by NCCS. A challenge when developing information about climate change for use in adaptation is the issue of uncertainty, and the trade-off between robustness vs. precision in the numerical values given should guide the dissemination of climate information. Based on our experiences, we also recommend that climate information is developed in collaboration with users because this ensures that it will be understood by a wider audience. Most climate-related challenges for infrastructure are related to extreme events. For technical applications in Norway, climate change allowances are now available for heavy precipitation, floods, and storm surges as a tool for design analyses of buildings and infrastructure. This paper describes the production chain for the presently available climate projections following the release of IPCC AR5 (CMIP5), our experiences of the dissemination process, as well as our plans for further development of the next national climate assessment report based on IPCC AR6 (CMIP6).
The Norwegian Centre for Climate Services (NCCS) is a collaboration between the Norwegian Meteorological Institute, the Norwegian Water Resources and Energy Directorate (the national hydrological services), the Norwegian Research Centre (NORCE) and Bjerknes Centre for Climate Research. The main goal of NCCS is to provide a knowledge base for climate change adaptation to decision makers and planners at various administrative levels in Norway. Since counties and municipalities are largely responsible for climate adaptation in Norway, delivering useful information at these scales is an important part of NCCS' mandate. The three main goals of NCCS are 1) to provide climate and hydrological data for the past and future in Norway, 2) to be the preferred supplier of knowledge about climate change and hydrology and the effects of climate change on natural hazards, and 3) to be one of Europe's leading national centers for knowledge on climate and hydrology for climate adaptation and impact research. The center is funded by the Norwegian Environment Agency, the Ministry of Climate and Environment and the collaborative partners.
Norway has a complex geography with large gradients in topography and climate, and challenges vary between regions and even within municipalities. The western parts of southern Norway receive the largest amounts of precipitation, up to 5,000 mm/year in coastal regions. In the rain shadow, approximately 100 km further inland, precipitation amounts are less than a tenth of this. Winter precipitation is commonly stored as snow, which melts in spring (in the lowlands) and early summer (at higher elevations). The country has approximately 5,400,000 inhabitants (Statistics Norway, 2021), distributed across the whole country. This decentralization policy results in a sparse population distributed over many small municipalities.
Although challenges resulting from climate change differ across the country, the most common natural hazards are related to water: an increase in heavy rainfall, rainfall-generated floods and rainfall-induced landslides, and for coastal regions: an increase in storm surges. It should be noted, however, that because land masses are still rising after the last ice age, the relative sea level rise is largest in the southwestern regions of Norway. The above-mentioned hazards impact different sectors and communities in various ways. In 2018, a national climate adaptation conference summarized central topics into four conference sessions: i) water and more water; ii) nature, land-use and cultural heritage; iii) civil protection in a changed climate; iv) holistic management. These topics are regarded as relevant climate adaptation challenges across Norway (Neby, 2019).
The White Paper on Climate Change Adaptation in Norway (Norwegian Government, 2012) states that all sectors have a responsibility for climate adaptation in their respective sectors, and further that municipalities carry the main responsibility for adaptation, for example through local land use planning. The Norwegian Planning and Building Act (Norwegian Government, 2013), requires that municipalities perform a risk and vulnerability assessment (RVA) for development plans. National authorities facilitate and guide the climate adaptation work undertaken by the municipalities. In 2018, the Norwegian government adopted new guidelines on climate change adaptation (Norwegian Government, 2018). These new guidelines impose heavier responsibilities on municipalities than before, for example through explicit requirements to take climate change into account in planning and to consult and take into use existing knowledge on climate change. Climate factsheets (Hisdal et al., 2021) issued by NCCS have been a core reference for climate adaptation in these governmental guidelines. They are discussed more thoroughly in section “Step 2.” A survey by Klemetsen and Dahl (2020) found that 91% of municipalities in Norway have started work on climate change adaptation. The awareness of climate-related hazards is high; among the respondents, 97% expected the occurrence of an extreme weather event in their area. They further found that 76% of municipalities that have developed risk and vulnerability assesments (RVA) used a knowledge base on climate change. Of those, 61% responded that they used climate factsheets from NCCS (Klemetsen and Dahl, 2020). More details on how climate adaptation is coordinated in Norway can be found in e.g., Hanssen et al. (2013), Wejs et al. (2014), and Hauge et al. (2020).
As recommended in the White Paper on Climate Change Adaptation for Norway (Norwegian Government, 2012), a high emission scenario should be considered when assessing consequences of climate change, in line with the precautionary principle. Risk levels for riverine flooding, storm surges, landslides and avalanches are defined in the Norwegian Planning and Building Act and the associated technical regulations (Norwegian Government, 2017). Buildings in safety class 2 (e.g., a residential area) must be sited, designed or protected against the 200-year flood and the 200-year storm surge height. For the highest safety class, the 1,000-year return interval applies. Four principles for climate change adaptation have been formulated in Hamarsland (2015, our translation):
i) Buildings and infrastructure with a short lifespan (10–20 years) are designed on the basis of the current climate.
ii) Buildings and infrastructure with a long lifespan are either built to withstand projected climate change or designed based on the current climate, but which are also suitable for reinforcement at a later date.
iii) Measures should be climate-resilient, that is, they should function as intended even if the climate develops differently from what is projected.
iv) Climate adaptations contributing to achieving several goals are considered win-win adaptations and should be given a high priority.”
Extreme events pose challenges for infrastructure and the built environment in Norway. To cope with the expected changes, climate change adaptation can be set into practice by making allowances for climate change in risk assessments and planning. Such climate change allowances have therefore been developed from climate projections for heavy precipitation, floods and storm surges for use in the design of buildings and infrastructure with a long lifespan, and in hazard mapping. These climate change allowances, requested by users and developed in collaboration between researchers and public management, recommend a buffer to account for increases in heavy rainfall, floods and storm surges. The Norwegian Water Resources and Energy Directorate issued the first generation of climate change allowances for floods in Lawrence and Hisdal (2011), and have refined the recommendations since then. NCCS have formulated these recommendations in general as follows: “To increase resilience to climate change, it is recommended to make allowances for climate change in risk assessments of heavy rainfall, floods and storm surges when planning long-term infrastructure and residential areas. A climate change allowance states how much the current design value (that is, an extreme value such as the 200-year value) should be increased to account for future climate change, specifically: at the end of this century, under the high emission scenario.” The allowances are also used as a basis for the design of protection measures related to existing infrastructure and buildings, although additional cost-benefit considerations need to be made before making a decision. Specific formulations for heavy rainfall, floods and storm surges, respectively, are given under the relevant sections below, and in the climate factsheets.
Climate change adaptation needs to be integrated into all relevant policy fields and planning, according to the White Paper on Climate Change Adaptation (Norwegian Government, 2012), which broadens the potential user group of NCCS from scientists, via the private and public sector to the general public. NCCS has defined the prioritized user groups as listed in Table 1. Users are engaged through meetings and workshops initiated by both NCCS and other organizations. NCCS has been invited by intermediaries, such as the Norwegian Environment Agency and the Norwegian Association of Local and Regional Authorities (KS), to present information at courses and webinars, most of them aimed at municipal officers and consultants who implement climate change adaptation into municipal plans. In total, researchers affiliated to NCCS gave 340 presentations from 2015 to 2021. Web site statistics and participant lists at seminars NCCS have attended indicate that NCCS have also reached users ranging from international climate researchers, educational institutions, the energy sector, municipal engineers, consultants, municipal planners, and the general public. Spatial planning plays a critical role in climate adaptation and municipalities are therefore one of the main target groups. Municipalities best know their local situation and needs, and therefore, the White Paper on Climate Change Adaptation points them out as being the most appropriate authority level to develop adaptation policies (Hanssen et al., 2013). Land use plans represent an important part of climate change adaptation through their ability to shift new developments away from vulnerable, hazard-prone regions. Robust and climate-adapted spatial plans thus require information about future climate and further effects on e.g., natural disasters. In addition, several impacts of climate change depend on responses in e.g., ecological systems, or factors affecting human health. Providing useful climate datasets for scientists studying such impacts is therefore an important task for NCCS, in addition to providing municipalities with refined end products. During the past 10–15 years, the government has developed learning networks related to climate change. Two such networks, “Framtidens byer” (“Cities of the future”) and iFront (“aHead”) have been established between the largest cities. The mandate of iFront has been to facilitate the “tricle down” of knowledge from national networks to the networks that participating cities were encouraged to form with their neighboring municipalities, and in turn, that participating regional municipalities were encouraged to form with their neighboring municipalities and so on. The Norwegian Environment Agency and the Norwegian Association of Local and Regional Authorities initiated the first climate network in 2015 and now organizes the 4th generation climate network (Wang and Grann, 2019). A series of novel problem-oriented collaborative workshops, Klimathon (Kolstad et al., 2019; Neby, 2019; Kvamsås et al., w2021), can also be considered to be a type of learning network. These hackathon-inspired seminars gather planners from the municipal and county levels, intermediaries and knowledge providers with the aim of co-producing knowledge for use in climate change adaptation. Through dialogue, different practitioners create a common understanding of a case. Although the questions discussed are not real-life problems, the participants build on experience from local, regional and national adaptation work (Neby, 2019).
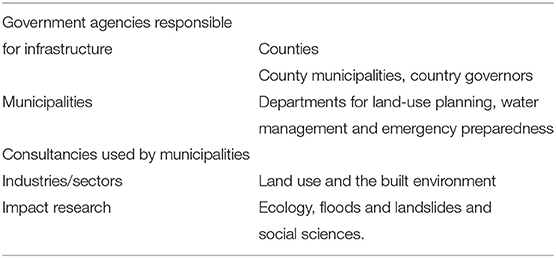
Table 1. Prioritized user groups.
The climate assessment report “Klima i Norge 2100” (Hanssen-Bauer et al., 2015; hereafter abbreviated KiN), and the shorter English version “Climate in Norway 2100” (Hanssen-Bauer et al., 2017a), present historical climate change and climate projections toward the end of this century. The Arctic islands of Svalbard were not included in the national Norwegian report, as they lie outside the EURO-CORDEX domain (Jacob et al., 2014). Therefore, a special assessment report “Climate in Svalbard 2100” (Hanssen-Bauer et al., 2019; hereafter abbreviated CiS) was published in 2019. Here, we describe the climate–hydrological modeling chain used in the 2015 version of KiN. An update of the report “Climate in Norway 2100,” planned to be issued in 2024, is briefly described under “Future work.”
The climate assessment reports KiN and CiS were based on coupled atmosphere–ocean general circulation models (GCMs) from phase 5 of the Coupled Model Intercomparison Project (CMIP5). Atmospheric variables were downscaled to Norway from the output of the World Climate Research Programme (WCRP) Coordinated Downscaling Experiment-European Domain (CORDEX), see Figure 1. Projected temperature and precipitation were computed from regional climate models (RCMs) directly, i.e., without further downscaling or bias-adjustment, at a spatial resolution of 12 × 12 km (2071–2100 relative to the reference period (1971–2000). These data were used to estimate projected changes for counties (Figure 2) and as spatially distributed, gridded maps. All projections were produced from ten GCM–RCM combinations from CMIP5 (Table 2), downscaled for EURO-CORDEX, i.e., CORDEX models for the European domain. At the time the selection of EURO-CORDEX models were done, these ten GCM–RCM combinations consisted of all EURO-CORDEX at a 0.11 ° resolution, EUR-11, that were available at the time for two emission scenarios (RCP4.5 and RCP8.5), see Table 2. These simulations were later re-gridded and bias-adjusted into 1 × 1 km resolution. In addition, empirical-statistical downscaling was used to produce temperature projections for the full multi-model ensemble of GCMs from CMIP5.
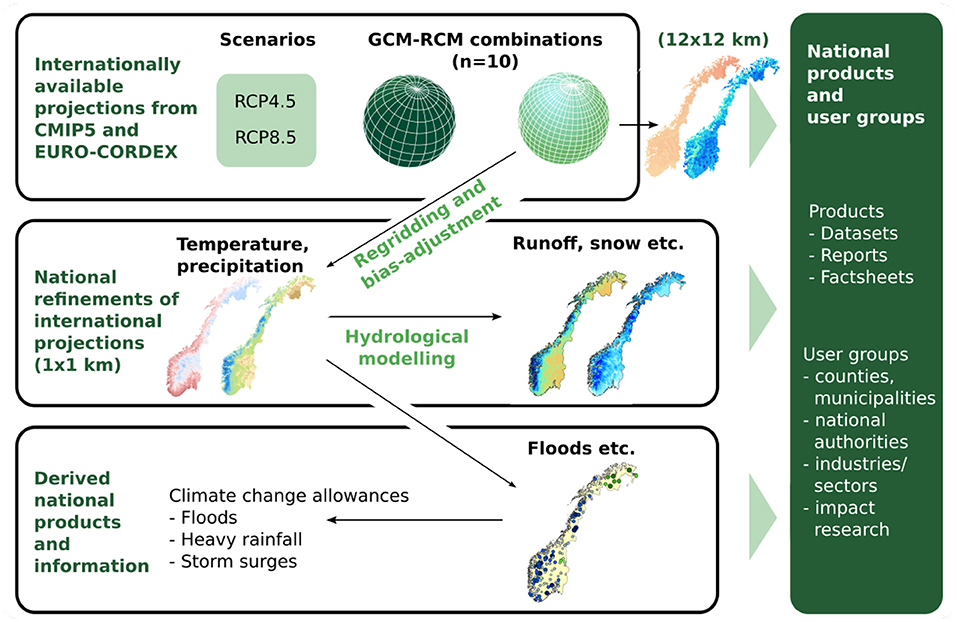
Figure 1. Modeling chain from climate model output to climate information.
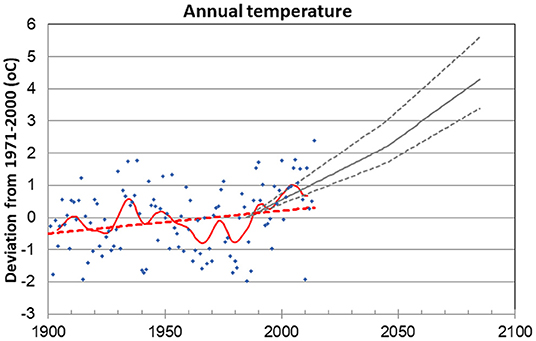
Figure 2. Historical and projected annual mean temperature for one county, Hedmark. The historical development is shown as single years (blue dots), smoothed 10-year variations (full red line), trends (dotted red line). The future development is shown for the high emission scenario, RCP8.5, as the median of the model ensemble (full gray line) and low and high model simulations (dotted gray lines), for the middle of this century (the period 2031–2060 is plotted at 2045) and the end of this century (the period 2071–2100 is plotted at 2085).
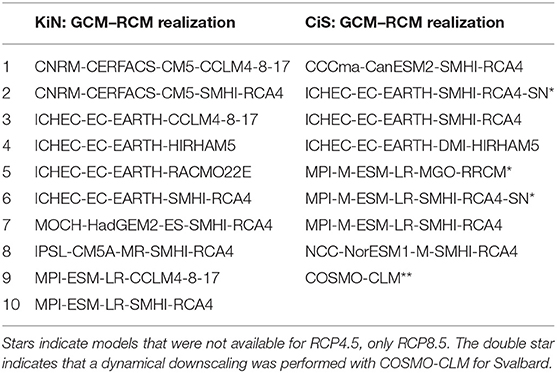
Table 2. GCM–RCM combinations used in KiN from the EURO-CORDEX ensemble and CiS for the Arctic-CORDEX ensemble (see page 144 in KiN and page 192 in CiS for references and details).
In addition to climate model simulations for historical and future projections, observation-based datasets were used to present the development of the climate in the historical period, as well as for bias-adjustment and for calibrating and validating the hydrological models. The main historical meteorological dataset used was a gridded dataset from the web portal http://senorge.no/ (hereafter senorge v.1.1; Tveito et al., 2005; Mohr, 2008), with a daily temporal resolution, and a spatial resolution of 1 × 1 km. Senorge v.1.1 interpolates temperature and precipitation from observation stations, using various geographical information (e.g., longitude, latitude, altitude, distance from coast; see Mohr, 2008 for details).
Projections of hydrological variables (runoff, snow, groundwater, evapotranspiration and soil moisture deficit) were simulated with hydrological models, taking temperature and precipitation as input. Simulations were driven by bias-adjusted temperature and precipitation from the 10 EURO-CORDEX simulations. This approach consisting of using downscaled, bias-adjusted climate data to simulate hydrological variables is often referred to as the climate–hydrological modeling chain.
Ideally, climate model output should be used directly in hydrological models. However, the spatial resolution of regional climate model ensembles, such as the EURO-CORDEX simulations, is still too coarse for local assessments, especially in a country with rugged topography, such as Norway. In addition, global and regional climate models can produce somewhat biased output (e.g., Frei et al., 2003), which unfortunately prevents their direct use in impact studies. As a result, bias-adjustment of climate model output variables has become a fairly standard procedure in climate change impact studies (e.g., Hempel et al., 2013; Dankers and Kundzewicz, 2020), despite its limitations and the additional challenges it can introduce (see for example the discussion in Ehret et al., 2012). For this work, the main challenges were related to the volume of data (10 models × 320 000 grid cells × 130 years), which favored a computationally efficient method. Temperature and precipitation were regridded from approximately 12 × 12 km to 1 × 1 km and thereafter bias-adjusted for each grid cell separately, using senorge v.1.1 as the reference dataset, see Wong et al., 2016) for details. Wong et al. (2016) also presents some reasons for bias-adjustment, e.g., cold biases for Norway in the historical period leading to an unrealistic prolonged snow season if bias-adjustment was not implemented. For a more detailed discussion of the trade-offs please see Section Discussion.
For the hydrological simulations, the HBV hydrological model (Bergström, 1995; Sælthun, 1996; Beldring et al., 2003) was selected. This model has been widely used for hydrological simulations in the Nordic region (Bergström, 2006), and is used both operationally and for research (e.g., Lawrence and Haddeland, 2011; Wong et al., 2011; Huang et al., 2019). The HBV model is a conceptual hydrological model that computes the water balance in response to hydro-meteorological forcing, including storages and depletion in snow, soil moisture and groundwater, and simulates the associated runoff. Two versions of the HBV model were used: a) a catchment-based version with height zones for snow modeling (Sælthun, 1996); and b) the gridded HBV model developed by Beldring et al. (2003). Both versions employ temperature-index methods for snow accumulation and melting and for evapotranspiration. Thus, the model can be run with temperature and precipitation time series as the only driving variables. The hydrological model includes different land cover types, e.g., lake, forest, bedrock, and urban, which specifies the percentage of the given land cover type within the gridcell.
The catchment-based HBV model was calibrated and validated for 115 unregulated catchments for use in generating hydrological projections suitable for flood analyses in these catchments (Lawrence et al., 2009; Lawrence, 2016). Multiple parameter sets were calibrated for each catchment to quantify the uncertainty in HBV model parameterization (Lawrence and Haddeland, 2011; Lawrence, 2020). Bias-adjusted precipitation and temperature time series were created for each catchment for each of the 10 EURO-CORDEX RCMs by applying two bias-adjustment methods. The bias-adjusted time series were used as forcing data to run multiple hydrological simulations for each catchment, and this was also done for each of the 25 parameter sets for each catchment. The annual maximum flood series was extracted from each simulation for 30-year time slices for estimating changes in the average annual flood, the 200- and 1,000-year floods and the predominant flood season. Due to the relatively short time periods for analyses (annual maximum series consisting of 30 years for the reference and future periods), a two-parameter Gumbel distribution was used for estimating flood return levels. Percentage future change in flood discharge was calculated by comparing estimates for the flood quantiles for the reference and future periods.
A gridded version of the HBV model was implemented with a daily time step and 1 × 1 km spatial resolution for mainland Norway (Beldring et al., 2003) to study changes in hydrological variables. The model was calibrated using precipitation and temperature from senorge v1.1 as forcing data. The results from this historical run represents the reference data for the hydrological variables at 1 × 1 km. The model was thereafter run using downscaled and bias-adjusted climate model data from the ten EURO-CORDEX models, resulting in daily gridded hydrological time series spanning the period 1971–2100. Svalbard was not included in the national Norwegian report KiN, as it is outside the EURO-CORDEX domain. A special assessment report “Climate in Svalbard 2100” (CiS) was published in 2019, based on downscaled and bias-adjusted models from the Arctic-CORDEX ensemble treated in a similar way as described for KiN. Eight models were available for RCP8.5, five for RCP4.5, all with a 50 km resolution. Because of the coarse spatial resolution in Arctic-CORDEX, an additional regional downscaling to 2.5 km resolution was performed using one model, COSMO-CLM.
In the KiN and CiS reports, results are computed for two emission scenarios, for the mid-century period (2031–2060) and the end-century period (2071–2100) relative to the reference period (1971–2000). To satisfy the precautionary principle, the high emission scenario at the end-century period is most often used as a basis for climate adaptation in Norway. The summary of results below are valid for mainland Norway for the end-century period compared to the reference period, under the high emission scenario RCP8.5, unless otherwise stated. Model spread in the KiN report is presented as the 10 percentile, median and 90 percentile of the model ensemble. In this paper as well as in the climate factsheets, the ensemble median is presented, in some cases with the 10 percentile and 90 percentile in parentheses.
The mean temperature for mainland Norway has increased by approximately 1°C in the period 1900–2014. The projections toward the end-century for high emissions show a 4.5°C warming for mainland Norway (3.4–6.0°C). Figure 2 shows how this information is conveyed graphically through a climate factsheet. For the intermediate emission scenario, RCP4.5, the temperature increase is estimated to be 2.7°C (1.6–3.7°C). As expected from Arctic amplification, the projected warming is larger for the northernmost counties (Finnmark: 5.5°C), and especially for Svalbard: 9.8°C, according to the report CiS. The projected warming in winter exceeds that of the other seasons.
Historically, the mean annual precipitation has increased by approximately 18% in the period 1900–2014. Annual precipitation is in general projected to increase at high latitudes. By the end of this century, annual precipitation is estimated to increase by 18% (7–23%) for the high emission scenario and by 8% (3–14%) for the intermediate emission scenario. Precipitation intensities during short-term heavy showers increase more than daily values because air has the capacity to hold more precipitable water when it is warmer. Heavy rainfall may lead to widespread stormwater runoff with traffic disruptions and material damage. Climate change allowances have therefore been developed to mitigate damages from increases in precipitation intensity during heavy rainfall. A climate change allowance for heavy rainfall states by which factor or percentage the current design rainfall (taken from an IDF curve NCCS, 2022b) should be increased to account for future climate change. The resulting climate-adjusted value is used to design infrastructure on a local, urban scale. These climate change allowances are not themselves climate projections, but are derived from climate projections of precipitation. The climate change allowance for heavy rainfall was defined on the basis of projected precipitation amounts for the end of this century (2071–2100) relative to the reference under the assumption of a high emission scenario. Initially, the allowance was formulated as “at least 40% increase,” independent of storm duration or return period. In the current version of the climate factsheets (Hisdal et al., 2021), this is expanded: “If a more refined approach is desired for different durations and return values, the climate change allowance as shown in the table below (Table 3) may be used.”
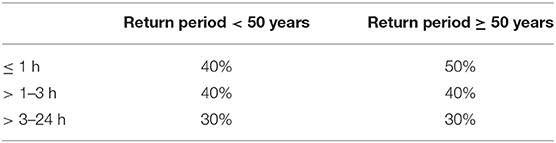
Table 3. Recommended climate change allowance for heavy rainfall (modified from Dyrrdal and Førland, 2019).
At Svalbard, the relative increase in annual precipitation is projected to be larger than that for mainland Norway, i.e., approximately a 65% increase; however, the absolute values of precipitation are low (approximately 400 mm/year at Ny Ålesund) (CiS).
Changes in temperature and precipitation influence snow coverage. Higher temperatures in autumn and spring lead to a shorter snow season. A shorter snow season does not necessarily mean less snow, however. For regions with sufficiently low temperatures in a future climate (at elevations exceeding 1000 m a.s.l.; Skaugen et al., 2012), snow amounts are expected to increase due to an increase in precipitation, at least toward the middle of this century. The cryosphere is an important part of nature at Svalbard, with almost 60% of the land area of Svalbard covered by glaciers. The snow season is expected to become shorter, and the loss of glacier mass will change the landscape (CiS).
Changes in precipitation and snow regimes will alter runoff in different ways for the different seasons. In winter, runoff is projected to increase (substantially for relative values but only modestly for absolute values) due to a smaller fraction of the precipitation being stored as snow. The timing of snowmelt is shifted to earlier in the year. In spring, this shift toward earlier snowmelt leads to a diverse picture, with an increase in runoff at high altitudes, where snowmelt continues into summer months (June–July) in the present climate. In the same season, a decrease in runoff is projected in the lowlands, where snowmelt ends during April–May in the present climate. In summer, runoff in general is projected to decrease. This expected decrease is mainly due to an increase in evapotranspiration outweighing the increase in rainfall. In autumn, runoff is projected to increase at most locations due to an increase in rainfall. An exception are the lowlands of South Norway where higher evapotranspiration may even reduce autumn runoff.
For Svalbard as a whole, runoff is expected to increase in summer as a response to glacier melt, and in the other seasons as a response of more precipitation falling as rain rather than snow.
Although rainfall is projected to increase, flood risk depends on several factors in addition to rainfall (see Hodgkins et al., 2017; Sharma et al., 2018). In Norway, rainfall floods are projected to increase, but snowmelt floods are not (Vormoor et al., 2015, 2016; Lawrence, 2016, 2020). This difference depends on the characteristics of the river catchment, particularly related to the potential for snow accumulation. Figure 3 shows changes in the 200-year flood by the end of the century under high emissions. The green dots correspond to catchments that are dominated by a snowmelt flood in today's climate, where the flood magnitude is projected to be unchanged or reduced. Blue dots correspond to catchments that are dominated by a rainfall flood or a combination of rainfall and snowmelt floods in today's climate, where the flood magnitude is projected to increase. The daily (24 h) time step does not allow resolving the flood peak in catchments that respond quickly to rainfall; however, more recent studies with 3-h input have shown that the flood magnitude in these catchments have larger increases (Lawrence, 2018). The largest increases in flood magnitude are expected in small, steep catchments and in other catchments in which excess rainfall accumulates and is transferred rapidly through the catchment. In larger catchments, snowmelt and evapotranspiration occurring over longer timescales (i.e., days rather than hours) have a greater effect in mitigating the impact of increases in short-term precipitation intensities as compared with smaller catchments (Sharma et al., 2018).
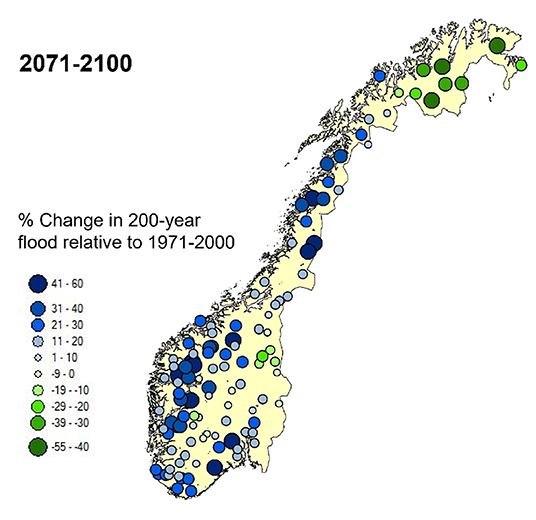
Figure 3. Percentage change in the 200-year flood between the reference period 1971–2000 and projection period 2071–2100 for RCP8.5. The estimates are based on the ensemble median of 500 simulations for each of the two emission scenarios (RCP 4.5 og 8.5). For each of 115 catchments, 10 climate models (see Table 2) have been downscaled and bias-adjusted using two methods. In addition, the 25 best parameter sets calibrated for each catchment were used in successive runs of the hydrological model for that catchment (From Lawrence, 2016).
Recommendations for a climate change allowance for floods were developed based on the median projections illustrated in Figure 3 for the projected change in 200-year flood values by the end of this century (2071–2100) under the assumption of a high emission scenario. For this purpose, three classes are distinguished: 1) no change or an expected decrease in flood hazard (0%); 2) an expected moderate increase in flood hazard (20%); and 3) an expected large increase in flood hazard (40%). Individual catchments are placed in one of these classes based on catchment characteristics, particularly related to location, potential for snow accumulation and the dominant flood season in the current climate. Due to the high degree of uncertainty in projected flood magnitudes and the large spread in the ensemble projections for each catchment, these three classes are used (rather than more precise values) to ensure robustness in the recommendations. At present, a hydrological assessment is performed for each catchment where a climate change allowance is required. However, a national map illustrating the recommended climate change allowance for all river reaches in Norway will be published in 2022. This allowance is particularly used in design flood analyses and in flood hazard mapping throughout Norway, i.e., they are targeted for the more advanced users of climate change information. Mapping of flood hazard is performed by the Norwegian Water Resources and Energy Directorate for some exposed river reaches, and these mapped river reaches are listed in the climate factsheets, together with the recommended climate change allowance for the reaches. At Svalbard, flood magnitudes are expected to increase, both as a response to increasing rainfall amounts and snowmelt and glacier melt (CiS).
Landslides and snow avalanches cover many types of mass movements, see chapter 7.3 in CiS for an overview of types. Weather triggers certain types of slides and avalanches, and climate change may thus affect their future frequency. For mainland Norway, it is expected that in steep terrain, climate change may lead to an increase in the frequency of landslides, debris flows and slush avalanches associated with heavy rainfall (Hisdal et al., 2021). Increased erosion could trigger more quick-clay slides. The risk of dry snow avalanches is expected to decrease, while the risk of slush slides is expected to increase, and may occur in areas where they have not occurred previously. The climate factsheets describe how different types of landslides are expected to change based on changes in climate. In particular, earth slides, floodslides and slushflows are sensitive to climate change because of increased precipitation (Hisdal et al., 2021). The climate factsheets list existing hazard maps and highlight the importance of further hazard mapping because of the expected increased frequency of landslides and avalanches. Climate change allowances are, however, not used in hazard mapping and other assessment related to landslides and snow avalanches.
Landslides and avalanches can be classified according to the water content. Floodslides and earth slides are rapid mass movements in steep slopes, but the former has a higher water content than the latter. Both types of landslides are expected to become more frequent because they are triggered by rainfall. We differentiate snow avalanches into slushflows, wet snow avalanches, dry snow avalanches. A slushflow is a “mudflow-like avalanche composed of slush–very saturated snow” (European Avalanche Warning Services, 2022). Slushflows are, similar to earthslides and floodslides, triggered by precipitation, and the hazard is therefore expected to increase. The hazard of wet snow avalanches, an “avalanche of wet snow masses,” is expected to increase in hazard-prone areas because the snowline will shift to higher altitudes and rain will fall on snow-covered ground more frequently. For the same reason, the occurrence of dry snow avalanches can be expected to be reduced. A quick-clay slide is a “very rapid to extremely rapid flow of liquefied sensitive clay” (Hungr et al., 2014). Quick-clay slides are often triggered by construction work, but increased erosion due to larger flood magnitudes may trigger quick-clay slides more frequently in the future. Rockfall is defined as “Detachment, fall, rolling, and bouncing of rock […] fragments" (Hungr et al., 2014). Frost action influences rockfalls, which are often triggered by increased pore pressure during heavy rainfall. More frequent heavy rainfall events may increase the frequency of rockfall. Hungr et al. (2014) defines a rock slide (rock avalanche) as an “Extremely rapid, massive, flow-like motion of fragmented rock from a large rock slide or rock fall." This type of landslide is mainly caused by long-term, geological processes and are less influenced by weather events. Permafrost thawing may contribute to triggering rockslides; however, there is no scientific evidence that indicates that climate change will increase the frequency or magnitude of large rockslides. In addition to the above-mentioned processes, Svalbard will also experience changes related to thawing of near-surface permafrost in coastal and low altitude areas, and and increase in erosion and sediment transport. This is thoroughly described in the report CiS.
The global mean sea level is rising as a response to thermal expansion and loss of land ice (Simpson et al., 2015). The relative sea level, that is, the sea level relative to land, will increase less for Norway than the global mean sea level rise. The reason for this is the vertical uplift of the land after the last ice age. Because the ice sheet was thickest around the Bay of Bothnia, this region experiences the strongest uplift. In coastal regions farthest from the Bay of Bothnia, i.e., the southwestern regions of Norway, the crust rebounds at a slower rate. Therefore, the relative sea level rise is largest in these regions. Storm surges are extremely high sea levels resulting from very low pressure and high winds. Simpson et al. (2015) provide projected sea level changes and estimates of projected storm surges for municipalities. They project more frequent storm surges and more frequent inundations. In planning long-term infrastructure, allowances for storm surges should be considered. The climate change allowance for storm surges is defined on the basis of the projected sea level change from 1986–2005 to 2081–2100, for RCP8.5, and the 95th percentile of the ensemble spread (see Table A.2.3 in Simpson et al., 2015). In Svalbard, the relative sea level is projected to fall because of continued loss of local ice masses. Storm surges are not expected to become worse because of sea level rise. However, thawing of permafrost makes coastal erosion more of a challenge.
National climate reports such as KiN are useful for documentation of knowledge status and for providing a comprehensive and consistent picture of climate developments in an area. For many users of climate information, however, the report has little practical usefulness, and NCCS has therefore developed several products aimed directly at different user groups (see examples in the bottom panel in Figure 1). Some climate projection products are published online through http://klimaservicesenter.no/, for visualization as well as for download. For less advanced users, summaries of the most important findings for each county have been compiled into climate factsheets, and maps of projected changes are presented on the web (30-year mean values). For more advanced users, the climate and hydrological projections at 1 × 1 km are made available as daily time series in netCDF format.
Because scientific reports are generally not read by decision-makers and municipal planners and because key information from the reports has to be combined with legal regulations and guidelines on climate change adaptation, NCCS has issued climate factsheets for each county (Hisdal et al., 2021). They describe current conditions as well as the most important changes from the reference period to the end-century, under the high emission scenario following the precautionary principle (ref. Section Discussion). Physical climate hazards summarized in the climate factsheet include heavy rainfall and stormwater runoff; floods, droughts, landslides, avalanches and storm surges. In the summary table, relevant natural hazards are assigned to one of four categories: “Increased probability” (red), “Possible increased probability” (orange), “No change or less probability” (green) and “uncertain” (blue) (Figure 4). In addition to presenting projections and climate change allowances, the climate factsheets list climate adaptation regulations, outline natural climate risks for the county and give links to hazard maps for floods and landslides produced by the Norwegian Water Resources and Energy Directorate. The climate factsheets were updated in February 2021 and are now available both online and as printable PDF documents.
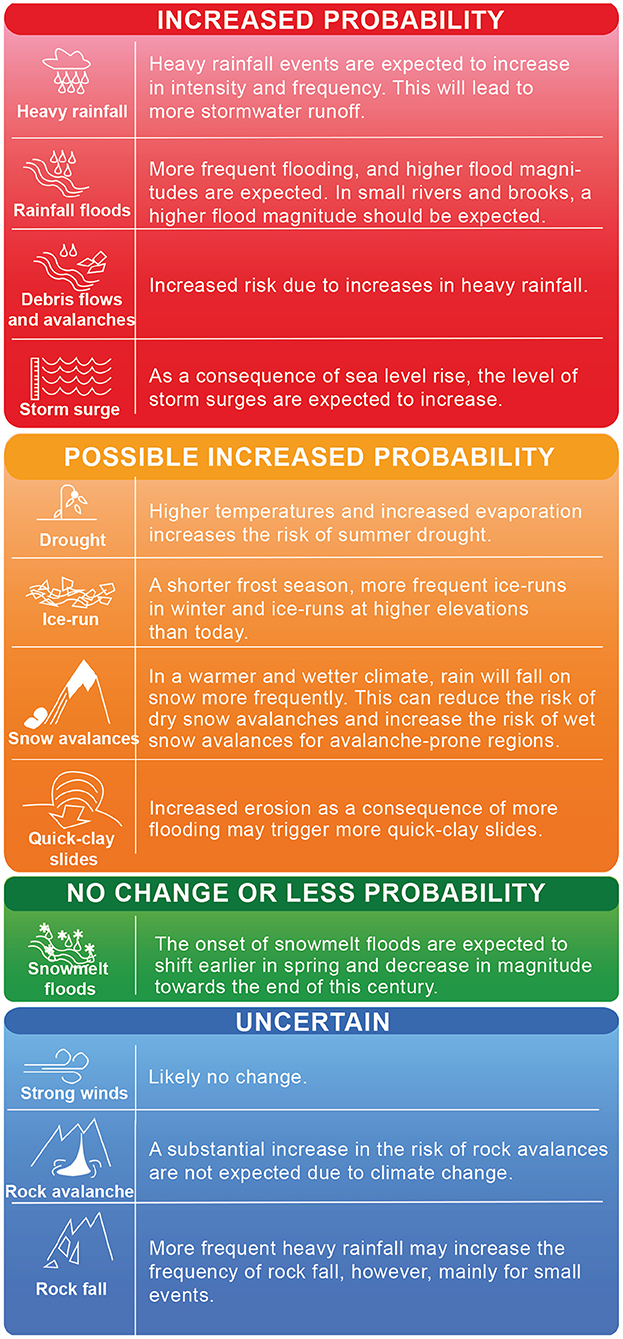
Figure 4. Example factsheet for one county. The factsheet shows a summary of projected changes in hydrological conditions and natural hazards relevant to the county for the period from 1971–2000 to 2071–2100.
The idea of a climate factsheet was conceived during a multi-level governance network project, “Climate project Troms” (Hanssen et al., 2015), where the goal was to integrate climate change adaptation into municipal planning according to the Planning and Building Act and the associated technical regulations. The project involved participation from multiple governance levels, from the local level to the national. The county of Troms led the project, which also involved selected municipalities, the county authority, the Norwegian Directorate for Civil Protection (DSB) and NCCS. The county authorities and municipalities requested a short summary of climate change information relevant for various planning processes in the municipalities. A prototype 8-page, condensed climate factsheet for Troms county was developed and issued in January 2015, and was intended to be used alongside a report describing how to integrate climate change adaptation into municipal plans (Norwegian Directorate for Civil Protection, 2015).
After this pilot project, climate factsheets have been published for all counties in mainland Norway as well as Longyearbyen, Svalbard on request from local authorities. This co-production, where practitioners were heavily involved in developing the climate factsheet Troms, continued during work with the other counties. The content was inspired by the factsheet for Troms, but was adjusted in dialogue with county authorities. Local representatives were given the opportunity to comment and make suggestions to early drafts of the factsheet. For example, a coastal municipality in Nordland requested information about wave action, which was included in later factsheets for coastal counties. Further, the county authorities in Sogn og Fjordane, who had built up competence on climate change adaptation, asked for uncertainty ranges, whereas other county representatives did not prefer that such information be included. Prior to publication, NCCS asked county authorities to promote the climate factsheet at political meetings at the county level in order to obtain political anchoring among local politicians. Decisions on e.g., which scenario to use for climate change allowances and planning is a political question. The municipal practitioners in the pilot project stressed that political anchoring was necessary to get political support for the adaptation measures they suggested. Through dissemination on websites and in seminars and later via the implementation of governmental regulations, the public gradually became familiar with the factsheets, both their availability and their use. In addition, government organizations and county administrations have distributed the factsheets locally.
Climate factsheets are a core reference in the government guidelines on climate change adaptation (Norwegian Government, 2018) and are widely used in RVAs by municipalities (Klemetsen and Dahl, 2020). Some municipalities have developed a climate adaptation strategy (Handberg and Pedersen, 2018), where background information on local climate change was based on the factsheet for the given county, among other sources. A few municipalities have in addition developed climate vulnerability analyses. County municipalities, such as Vestland, used climate factsheets as a knowledge base when developing their adaptation planning strategy. The Norwegian Agency for Local governments has developed a portal for local climate risk in each municipality which presents Table 1 from the factsheets. An example can be seen for e.g. Lillestrøm (The Norwegian Agency for Local Governments, 2022).
According to a survey by KS (Wang, 2018), climate factsheets are the most frequently applied service provided by NCCS. Comments on climate factsheets in such surveys point to too general information (Rusdal and Aall, 2019; Hauge et al., 2020), a need to translate knowledge on climate change into climate change adaptation (Rusdal and Aall, 2019) and a lack of capacity to use the information (Wang and Grann, 2019). Published surveys of climate change adaptation are discussed more thoroughly in Section Discussion.
NCCS has evaluated the use of climate factsheets and other products through a survey and workshops described in the following paragraphs. This section illustrates how NCCS use the results of the evaluation to define new user needs and inform future development of our services.
During two workshops in November 2019, NCCS gathered comments on climate factsheets. The first workshop was co-arranged with a research project, and aimed at collecting user suggestions for future climate factsheets (unpublished internal notes). Here, specific indices for the land use sector were suggested. The second workshop was co-arranged with the Norwegian Association of Local and Regional Authorities (KS) and was aimed at collecting user comments on the climate factsheets (unpublished internal notes). The comments about the climate factsheets can be summarized as follows:
- The factsheets raise awareness about climate change adaptation.
- The factsheets are too general to be used for local decisions, such as detailed land use planning. Translation of technical knowledge to the downstream user is required, in particular from recommended climate change allowances to design in practice. Examples are requested.
- Municipal officers use other data formats than researchers. They requested data as maps.
- Which status do the recommendations have? Are they legally binding?
Some of the municipalities had not used climate factsheets in their planning strategies, and they explained that their planning strategy is changed every 4th year such that the climate factsheet was not published in time to incorporate it into the planning strategy. One participant had not heard about the climate factsheets before the workshop.
In one survey of the NCCS website, it was requested that NCCS make projections available through existing web portals such as http://senorge.no/ (unpublished, internal notes). A user from the hydropower sector requested projections aggregated for catchments, similar to the Swedish Meteorological and Hydrological Institute's portal Hypeweb (SMHI Hypeweb, 2022).
The climate factsheets from NCCS were a topic for discussions at a so-called Klimathon events targeting a variety of practitioners, aiming in particular at municipal planners (Neby, 2019; Kvamsås et al., 2021). Discussions were prepared as group posters and presented in a common poster session, in addition to reflective notes and evaluations. One group working on “Nature, land-use and cultural heritage” devoted their time to addressing how the climate factsheets could be used in conjunction with other knowledge bases, and listed the following possible solutions: check lists, local knowledge in map formats, political anchoring in land use plans and a database of example measures (Neby, 2019). The authors point out that challenges and barriers were addressed rather than solutions. Although most participants knew about the climate factsheets and/or used them regularly, some participants did not know where to find local climate information (Neby, 2019). The numbers given by Klemetsen and Dahl (2020) in the introduction to this paper can therefore be interpreted as follows: 24% of the municipalities that have developed RVA analyses have not used a knowledge base about climate change. The potential for disseminating climate factsheets to a wider audience is therefore present.
Maps of 30-year means are presented on the NCCS web portal https://klimaservicesenter.no/climateprojections. Web portals allow for displaying additional information (e.g., more maps) than that which is presented as figures in the KiN report. This web portal displays projected changes for the mid-century period (2031–2060) and end-century period (2071–2100) relative to the reference period (1971–2000) for two emission scenarios (RCP4.5 and RCP8.5) as well as the reference period average. It also contains a few variables that have been computed after the report was issued: projected changes in days with snow depth exceeding 30 cm, and zero-degree crossings. The latter was calculated from bias-adjusted maximum and minimum temperatures (Nilsen et al., 2021). On the web, only the ensemble median is shown, whereas in the KiN report, model spread is shown using the 10 percentile, median and 90 percentile.
The bias-adjusted climate variables and hydrological simulation results (mean temperature, maximum temperature, minimum temperature, precipitaton, runoff, snow, groundwater, evapotranspiration and soil moisture deficit) for 101 GCM–RCM combinations are available as daily values for the period 1971–2100 at the 1 × 1 km spatial resolution. They can be downloaded from the NCCS website (nedlasting.nve.no/klimadata/kss), for two emission scenarios (RCP4.5 and RCP8.5). These data are freely available for research and other purposes in accordance with the Norwegian Licence for Open Government Data (NLOD). The whole or parts of the dataset has been downloaded by e.g., students, scientists, consulting companies and energy companies. The dataset has been applied in research projects to estimate impacts of climate change for agriculture (e.g., Haugen et al., 2019) and for societal risks (e.g., the project Klima 2050 Klima 2050, 2022).
Based on requests from users, NCCS recently created maps of projected changes that can be accessed from the web portal through an application programming interface (API). More specifically, these maps are available as figure files, through the Web Map Service (WMS) standard. This standardized technical solution has the advantage of providing the most updated version of a map automatically, without having to actively search for updates. Users such as the Norwegian Environment Agency and the Norwegian Directorate for Civil Protection can display these WMS maps on their websites. Metadata will be searchable through Geonorge, Norway's national website for map data and location information (Geonorge, 2022).
On the web portal for climate scenarios, maps of 30-year means are not presented as zoomable, interactive maps. Instead of developing yet another web portal that contributes to the abundance of information, maps will be presented on an existing web portal, http://senorge.no/, that contains state-of-the-art functionality for map presentations and data download. The senorge web portal displays gridded maps of weather and water conditions at a daily resolution and lower. This open portal is widely used by the general public and media. The web portal has been user-tested for user groups ranging from ski tourists, hydropower companies and emergency preparedness institutions as well as students and the media (unpublished internal notes). Recent developments in senorge include webpages adapted for use on mobile phones, and the availability of a subset of 30-year means (temperature, precipitation, runoff and snow). All maps are accessed from the API described above.
NCCS have recently disseminated climate projections for each municipality in Norway through a collaboration with the Norwegian Broadcasting Corporation (Norwegian Broadcasting Corporation, 2020). The feature article has reached 900 000 page views and has been used as reference for reader's letters to local newspapers confronting local politicians (personal communication with the journalist, Mads Støstad, 4. November 2021). There are several examples of Norwegian climate projection being used in outreach through the media. The TV meteorologists from Norwegian Meteorological Institute have successfully communicated climate information on national television, in association with the weather forecast, where climate projections are one source of information (European Meteorological Society, 2022).
Here we discuss what NCCS can improve to assist in overcoming some common barriers for implementing climate change adaptation measures. We first explain how uncertainty is considered, and second, how the trade-off between robustness and precision guides the dissemination. This second point is relevant when providing more local products on a gridded or averaged scale, when allowing users to zoom in to the actual numbers in the 1 x 1 grid cell, and when giving more detailed climate change allowances. This discussion is structured around a few core requests from Norwegian climate data users and barriers that are documented as hindrances to climate change adaptation (e.g., Hauge et al., 2020; Klemetsen and Dahl, 2020). Through presentations at meetings and workshops, climate factsheets have been promoted to widely different sectors, ranging from land use planning, sewage/stormwater management, and emergency preparedness to agriculture. Whereas, advanced users often request direct access to data in formats that comply with the existing workflow of the user (e.g., time series and map formats made available through API), the non-technical audience tends to prefer simple visualizations, zoomable maps and guidance (Hanssen-Bauer et al., 2017b). When issuing data to a wider audience, NCCS has considered the trade-off between robustness and precision: a robust estimate takes uncertainties into account, e.g., by including an uncertainty range or by rounding, whereas a seemingly precise estimate under-communicates the underlying uncertainties. Advanced users request uncertainty estimates to a larger degree than less advanced users and it remains a challenge to present these uncertainties in a clear manner that can be understood by the various user groups. Uncertainties in the climate projections can be separated into i) uncertainty related to natural variability, ii) uncertainties related to future emission scenarios, i.e., which is most likely, and iii) model uncertainty related to global and regional climate models and hydrological models.
In most climate factsheets, point i) is explicitly addressed, by presenting changes between two 30-year means and smoothing decadal variations in plots. Further, climate factsheets present time series and numbers aggregated for counties. On the web portal https://klimaservicesenter.no/climateprojections, point ii) are shown by presenting the intermediate, RCP4.5, as well as the high, RCP8.5, emission scenario, while point iii) is illustrated by showing not only the ensemble median, but also the 10 and 90 percentiles. The report KiN describes these uncertainties and states that we partly cope with the uncertainties by presenting median values, for different emission scenarios, as well as intervals including 10 to 90 percentile model spread for various climate variables. In KiN, point iii) was addressed further by downscaling temperature from all available CMIP5 models by empirical statistical methods (ESD; Benestad, 2021). The median of the annual temperature projections were rather similar, and the 10 to 90 percentile spread for the most only slightly higher in the large ensemble ESD projections than in the EURO-CORDEX-based projections. This adds credit to the temperature projections. Regretfully, the ESD models for precipitation were not very skillful at the time. The KiN report states that the illustration of the uncertainty maps only parts of the total uncertainty, and that the results therefore need to be considered in relation to their application. The climate factsheets also discuss uncertainty, and recommend the use of the median model result as this is the most robust estimate given the available ensemble. Only the factsheet for Sogn og Fjordane states the model spread (point iii). On that portal, gridded precipitation and temperature is shown at a 12 × 12 km resolution.
Ideally, the climate–hydrological modeling chain should include multiple bias adjustment methods and multiple hydrological models, in addition to a large GCM–RCM ensemble. Previous studies have shown that the bias adjustment has an impact on the climate change signal (e.g., Hagemann et al., 2011), as does the choice of climate model and hydrological model (e.g., Schewe et al., 2014). The results by Schewe et al. (2014) and Hagemann et al. (2013) indicate that the choice of hydrological model impacts the results the most in water-scarce areas. This knowledge is behind the motivation of including an additional bias-adjustment method and two evapotranspiration parameterizations in the distributed hydrological model in ongoing research projects (see Section 6). However, difficult decisions have to be made regarding feasibility when it comes to the number of model setups and simulations.
Reaching out to practitioners in the target groups in a comprehensible, but non-technical manner is crucial for an effective climate adaptation because these practitioners are responsible for implementing climate adaptation measures in practice. Handling uncertainties becomes even more important when presenting results for less advanced users. Feedback from these users reveals a wish for even more tailored information, either directed toward a specific sector or with a higher spatial resolution. Surveys of climate change adaptation have found that respondents request more local and specific information than what is given in e.g., the climate factsheets (Hauge et al., 2017; Rusdal and Aall, 2019; Kvamsås et al., 2021). At a meeting with NCCS, a representative for the county governor Agder requested information for the town hall entrance, which illustrates what Neby (2019) call a seemingly “insatiable need for local information.” Maps of gridded climate projections at a 1 × 1 km grid (Wong et al., 2016) are usually sufficiently detailed for research purposes, but not necessarily for local planning. In its current form, the uncertainty inherent in the climate and hydrological projections, make them unsuitable for literal interpretation when zooming to the nearest 1 × 1 km. This issue has become relevant because gridded maps will be published at http://senorge.no, which allows zooming to very fine detail. On senorge.no, precipitation and temperature is shown at a 1 × 1 km resolution. Currently, users are prevented from zooming too much, but in the future, NCCS will strive to prepare local information that will be sufficiently robust to be presented at fine resolutions.
Many tools and web portals present Europe-wide climate information, e.g., Copernicus Climate Change Service (C3S) Copernicus Climate Change Service, 2022), IMPACT2C (IMPACT2C, 2022), and Climate-ADAPT (Climate-ADAPT, 2022). Although they provide very comprehensive information, they are likely not being used by local practitioners in Norway, who prefer information in Norwegian (Copernicus Climate Change Service, 2017; Hanssen-Bauer et al., 2017b). Further, regional climate projections are too coarse-scaled to be used for local climate adaptation, which makes downscaling necessary. The complex topography of Norway makes this point very relevant. For example, the highest mountain of Norway is 2469 m a.s.l. At a 1 × 1 km grid resolution, this mountain is represented with a grid cell of elevation 2260 m a.s.l. At 12 × 12 km resolution, however, the highest grid cell in the CORDEX EC-SMHI model is 1646 m a.s.l. Temperature, precipitation and thus climate variables derived from these variables are sensitive to altitude. Even though relative changes may not be sensitive to altitude, relative changes are influenced by thresholds such as the 0°C threshold. We therefore stress the need for bias-adjustment, in addition to downscaling, before hydrological modeling (Wong et al., 2016) and when analyzing absolute values (e.g., Nilsen et al., 2021). Limitations of bias-adjustment methods are being discussed in the scientific community (e.g., Ehret et al., 2012; Maraun and Widmann, 2018). Since the bias-adjustment procedure is applied to each 1 × 1 km2 grid cell (over 320 000 in total) and to ten precipitation and temperature projections, each containing over 130 years of data, the chosen method must be computationally efficient. Empirical quantile mapping method (Gudmundsson et al., 2012) was selected because this is a method that does not assume a theoretical distribution and that corrects each variable individually. However, this type of univariate bias-adjustment method cannot correct potential biases in precipitation-temperature dependency in climate model data. In addition, the bias-adjusted datasets basically reproduce the spatial correlation structure of the climate model, and this can differ significantly from the observed one. Similar concerns can also be raised about the temporal biases that exist in the climate model outputs, such as the length of wet and dry spells.
Bias-adjustment was performed e.g., for the Swiss climate assessments (National Centre for Climate Services, 2018). Not all national climate assessments contain bias-adjusted output, however. NCCS' advice to practitioners who want to download climate projections in order to do their own calculations, depends on their application. If absolute temperature and precipitation is essential, our advice is to use our post-processed datasets; if not, our advice is to use the projections without bias-adjustment. For the interested reader, the British climate assessment provides guidance on bias-adjustment (Fung, 2018).
Norwegian counties are diverse, most counties span from coastal to high-elevation regions, which introduces a need to specify local data. Information on a municipal level has been requested and generated as average values. This local dataset provides data tailored toward a smaller area, for example, municipalities inland will not be presented with information on sea level rise. However, municipalities are also diverse; therefore, a municipal average does not necessarily solve the problem of too general information. After NCCS provided climate projections aggregated to municipalities for the feature article written by the Norwegian Broadcasting Corporation, representatives from two municipalities on the west coast of Norway commented that the information given for the historical climate did not align with their experience. The west coast of Norway is characterized by steep topographical gradients from the coast to the mountains, with most of the population located in the lowlands. An average value of all grid cells within the municipality therefore corresponds to an average altitude, and is not representative for the altitude where people reside. No inhabitant or decision-maker feels the average of a grid cell or a municipal average. One municipality having a relatively dry local microclimate objected that they were presented as being among the third wettest municipalities in Norway. When including higher altitudes into the averaging, however, this municipality does not come out as a particularly dry one. The higher altitudes within the municipality in fact include glacierized areas. When these higher altitudes are weighted in the municipal average without further comment, the result seems counterintuitive. In retrospect, an explanation of the discrepancies between what is experienced locally and simulations aggregated for a larger area would have been helpful. For the next generation of climate projections, NCCS considers aggregating results based on e.g., catchments or altitude zones. Aggregation of climate information within representative altitude zones (e.g., 0–400 m a.s.l., 400–800 m a.s.l., and above 800 m a.s.l.) is a possible way of post-processing data to provide robust estimates, not necessarily precise estimates. In addition to local information, users request more specific and detailed information (Hauge et al., 2020), e.g., tailored products and indices such as indices for heatwaves, frost in the growing season and drought. Klemetsen and Dahl (2020), however, found this barrier to be ranked as the least important among 10 barriers to climate change adaptation. Municipalities that have more experience with climate change adaptation, and thus know what to look for, ranked it higher than those with little experience. More specific information can be provided through guidance on translating climate information into action. Still, many questions from practitioners remain unanswered, for example: “What does a 4 degree warming within this century mean for ecology? How does it influence construction standards (e.g., choice of material, air conditioning) or agriculture (e.g., harvesting time, crop yield)”? Assessing the impact of a warmer, wetter climate is an active field of research, and NCCS strives to provide relevant datasets for impact research (e.g., Haugen et al., 2019 and the project Klima 2050).
One of the most commonly cited barriers for climate change adaptation in Norway is a lack of capacity and resources (e.g., Rusdal and Aall, 2019; Selseng et al., 2019; Wang and Grann, 2019; Hauge et al., 2020; Klemetsen and Dahl, 2020). This is particularly true for small and medium-sized municipalities, that is, municipalities with fewer than 50 000 inhabitants (Rusdal and Aall, 2019; Klemetsen and Dahl, 2020). Since many municipalities are small, there are limited possibilities to form robust professional environments outside of the networks described above. It is commonly stated that municipal planners do not have the time or capacity to read reports, nor even to search for such literature. Providers of climate information can alleviate these challenges in capacity by providing data in a format that can be readily used in e.g., Geographic Information Systems or other planning systems, ranging from text-based to map-based and numerical services. Until now, NCCS has provided maps as .png figures on web platforms and as WMS, but plan to extend this service for the next round of KiN through co-production with users. The aim is to design a map service based on user needs and requirements.
The use of three classes for a climate change allowance for flooding (i.e., 0, 20 and 40%) rather than more precise estimates represents a strategy for simplifying recommendations for climate change adaptation. At present, guidance for the use of the classes is available on a regional basis and requires an assessment by a practitioner as to which class is most suitable for a given catchment. Amongst practitioners, there is a clear wish for a more detailed approach. NCCS are aware that more guidance is needed, and this is being addressed in other projects involving the NCCS consortium. In addition, the current recommendations do not distinguish return periods although recent work has shown this to be relevant (Lawrence, 2020), and further work is also in progress on this issue.
Much guidance material for climate change adaptation is available nationally and internationally. Whereas, national climate services tend to concentrate on a few climate variables (Samaniego et al., 2019), NCCS combines climate and hydrological projections, including snow, runoff and floods, with information on e.g., landslides and avalanches. Other services are more comprehensive. C3S presents an impressive web portal, visualization tool and guidance. The abundance of information can make it hard to navigate through the various alternative sources of information. In a study of guidance material for climate change adaptation in Norway, Hauge et al. (2017) evaluated 84 guidance reports and web portals. They concluded that information in the form of reports, websites and tools is abundant, but not used to a large degree is not used by practitioners. Having an abundance of information seems to be an advantage, but can also become a barrier when users do not know where to begin reading.
This problem can be alleviated by making the information available in formats and workflows already used by the practitioners (e.g., in APIs and Geographic Information Systems). Municipalities access public maps from the map catalog geonorge.no. WMS maps from NCCS will therefore be searchable on Geonorge when they become available. Another way of reaching the practitioner in their workflows is to continue disseminating information through popular web portals, such as http://temakart.nve.no/ and http://senorge.no/. Finally, the Norwegian Directorate for Civil Protection has developed a one-stop shop for public data on risk and vulnerability for natural hazards (https://kunnskapsbanken.dsb.no/). Ephemeral services are not of much use for long-term municipal planning. For climate services developed through short-term research projects, it would be particularly relevant to collaborate on transferring the ownership to a national database when the research project is completed. There are a few examples that short-term projects have been given a longer life time and granted long-term support and continuity by being transferred to governmental agencies (e.g., www.ovase.no). Overlapping information from different sources can result in contradictory results. Different authorities such as the public road authorities and Oslo municipality issue their own recommendations for a climate change allowance (The Norwegian Public Roads Administration, 2018). In some cases, the assumptions underlying the information and the areas for their use differ between sources, but if this is not clearly specified it can be a source of both confusion and frustration amongst practitioners. In other cases, multiple sources for information on projected climate change impacts can mislead practitioners to take into use erroneous results. For example, when studies of future changes in flood hazard are undertaken in large-scale projects (e.g., European-wide or larger), the resulting projections often indicate a future reduction in flooding throughout the country. This can result from a variety of factors, but is generally related to the simulation of snow accumulation, melting and their consequences for flood generation. This can be due to, for example, scale issues, the need for bias correction or simply the performance of the chosen hydrological model. For example, EDgE, a prototype project related to C3S, simulated too much snow under the current climate in many catchments in Norway, with the consequence that simulated flood magnitudes decrease in the future in those catchments (Samaniego et al., 2019). This resulted from a “cold” bias in the model ensemble and confirms a need for local analyses (Vormoor et al., 2015, 2016; Lawrence, 2016, 2020) and local verification, also in larger-scale projects. The web portal Climate information (Swedish Meteorological and Hydrological Institute, 2020) also disseminates information regarding projected changes in flood hazard in Norway that do not agree with local analyses. For example, if one enters the coordinates for a point located in a catchment in the northernmost region of Norway (Karasjok in Finnmark “69.47 / 25.51”) the portal states an increase in the 50-year return value of annual maximum discharge. This point is an area with a significant seasonal snow cover, for which ensemble projections developed by the Norwegian Water Resources and Energy Directorate (Lawrence, 2016, 2020) clearly indicate a decreased flood hazard by the end of the century. The differences again can be due to a range of differences in the modeling and analysis setups. Nevertheless, such obvious contradictions in projections can both lead to confusion and undermine the credibility of information generated by climate services.
We therefore stress the need for national and international collaboration to avoid creating conflicting results and/or guidance as to which results are most trustworthy and reliable for different regions or sectors. We have no clear vision of this collaboration, but a few ideas are put forward here. When developing guidance material, there is much to learn from best practices and standards (e.g., ISO-14091, 2021). Different user needs range from the large-scale to local. International climate service providers (C3S) fulfill a Europe-wide need, but to fulfill a local need, these providers could benefit from a collaboration with national climate services. Norwegian users have the advantage that the Norwegian Environment Agency systematically collects and disseminates sector-specific information on their web pages (NEA, 2022). In particular, national and international climate service providers can benefit from a closer collaboration, both regarding data products and translation into local languages.
An update of the report “Climate in Norway 2100” has been ordered by the Norwegian Environment Agency to ensure that the national knowledge base on climate adaptation is updated based on the most recent global and regional climate projections. Even though climate projections from the new CMIP6 ensemble are available on the global scale, NCCS requires a sufficient number of downscaled simulations from EURO-CORDEX (Gutowski et al., 2016; Jacob et al., 2020) to be available before CMIP6-based simulations can be used for new analyses. The updated report will therefore be issued in 2024. The climate community has delivered many new developments during the years since KiN was issued in 2015. In CMIP6, new Shared Socio-Economic Pathways (SSPs) replace RCPs as emission scenarios driving the GCMs. Several novel datasets will be used to describe the historical development of atmospheric variables, including a gridded dataset for wind, and an homogenized gridded dataset developed for trend studies. In addition to RCMs at the 12 × 12 km scale, simulations from a convective-permitting model will be run at finer spatial and temporal scales. These simulations are expected to increase our knowledge of climate change effects on heavy rainfall, stormwater runoff and rapid flooding in small catchments. The complexity of the modeling chain has increased since the production of the previous generation of hydrological simulations. Previously, gridded hydrological variables were simulated using temperature index methods for calculating evapotranspiration.The new generation of hydrological projections will be simulated using an updated version of the gridded HBV model, which allows for two alternate evapotranspiration schemes: the traditional temperature index method and the Penman-Monteith method (Huang et al., 2019). Hence, more climate variables need to be bias-adjusted. The bias-adjustment method is also improved, both by introducing a second bias-adjustment method, and by introducing a post-processing technique (Mehrotra and Sharma, 2019). Catchment-based simulations will apply both the HBV model used for previous work and the DDD model (Skaugen and Onof, 2014). The DDD model uses simplified energy balance methods for evapotranspiration (Skaugen et al., 2020) and snow modeling (Skaugen et al., 2018). In addition, it will be used for simulations with a 3-h timestep, with the aim of improving our estimates for climate change effects in catchments that respond quickly to rainfall (e.g., Lawrence, 2021).
New climate projections may differ from previous projections, which can pose challenges when communicating updated results. For example, the reference period has changed from 1971–2000 in KiN to 1991–2020 in the updated report, whereas the end period is 2071–2100 in both cases. The absolute value of changes can seem smaller than in KiN, because an 80-year period is used instead of a 100-year period, and the standard normal period 1971–2020 is warmer and wetter than the reference period 1971–2000 (NCCS, 2022a). Further, different emission scenarios in CMIP5 and CMIP6 are not necessarily comparable. The model ensemble in KiN had a cold and wet bias (Wong et al., 2016), and the ensembles are based on relatively few global models (both in the new and previous projections). Thus, there are reasons to believe that new climate projections may differ from the previous projections.
A separate report for sea level rise will be updated based on Simpson et al. (2015). The report is planned to be issued in 2023, and will focus on sea level, wave action, and storm surges. No new simulations are planned for Svalbard because Arctic-CORDEX simulations are not available for CMIP6 yet, and this would require a parallel production line for a different domain. Instead, a summary of CiS and a literature review of recent research will be included.
This paper describes the production of climate factsheets in two steps, step 1: the production of background information through a climate–hydrological modeling chain used in the reports Climate in Norway 2100 (KiN) and Climate in Svalbard (CiS) and step 2: co-production of knowledge leading to the continual development of climate factsheets and dissemination of climate data from NCCS.
- NCCS' experiences in developing and disseminating climate and hydrological projections are valid for Norway, however, many experiences may be relevant for climate service providers in other countries. We propose the following recommendations:
- The trade-off between robustness and precision should guide the dissemination of climate information. Both the climate information and recommendations for their use should be understandable by a wide audience, preferably available in the local language.
- We recommend collaborating with users on developing the climate service. The first climate factsheets were developed through a multi-level governance network, and all subsequent climate factsheets have been reviewed by local representatives and later discussed in fora such as a Klimathon. If possible, coordination of the long-term operation of a service should be done in partnership with national authorities.
- Downscaling of regional climate model data for use in local climate change adaptation, as well as bias-adjustment of the climate output variables is often necessary. We recommend a strategy that involves both providing as local information as possible, but at the same time ensuring the quality of the information relative to the downscaled model simulations it is derived from. This involves considering the trade-off between robustness and precision, such as given by the example of a climate change allowance that differentiates between a small number of distinct classes, rather than detailed values which individually are highly uncertain.
- An abundance of climate information is available, which can make the climate change adaptation landscape hard to navigate between alternatives to find the most relevant and reliable sources. To guide users to the appropriate information, it is helpful to provide data in established web portals and APIs in formats that comply with the existing workflow of the user, preferably in the user's mother tongue. We stress the need for national and international collaboration to avoid creating conflicting results and to provide guidance as to which results are most trustworthy and reliable for different regions or sectors.
Climate change adaptation measures should be implemented for buildings and infrastructure with a long lifespan. This is formulated into the following climate change principles: For buildings and infrastructure with a short lifespan, the design can be assessed on the basis of the current climate. Buildings and infrastructure that have a long lifespan are either built to withstand projected climate change or designed based on the current climate, but prepared for reinforcements later.
The datasets generated and analyzed for the report KiN can be downloaded from NCCS' download portal: https://nedlasting.nve.no/klimadata/kss. Results can be viewed at https://klimaservicesenter.no/climateprojections. Data for Svalbard can be provided on request.
HH, IN, and IH-B have authored the climate factsheets. IH-B was the main editor for both reports KiN and CiS. AD produced climate change allowances for heavy rainfall and is leading the work on updating the report KiN. WW downscaled and bias-adjusted the climate variables. IH produced gridded hydrological simulations. DL produced flood simulations and climate change allowances for floods. IN wrote the manuscript. All authors have contributed substantially to the manuscript.
This article was funded by NCCS, and thus supported by the Norwegian Environment Agency and the Ministry of Climate and Environment in addition to in-kind contributions from NVE and MET.
The authors declare that the research was conducted in the absence of any commercial or financial relationships that could be construed as a potential conflict of interest.
All claims expressed in this article are solely those of the authors and do not necessarily represent those of their affiliated organizations, or those of the publisher, the editors and the reviewers. Any product that may be evaluated in this article, or claim that may be made by its manufacturer, is not guaranteed or endorsed by the publisher.
We thank two reviewers for their valuable comments, and all authors contributing to the Norwegian climate assessment report Klima i Norge 2100. Eirik Førland and Dagrun Vikhamar-Schuler are acknowledged for authoring the climate factsheets together with IBN, HHI, and IHB.
Beldring, S., Engeland, K., Roald, L. A., Sælthun, N. R., and Voksø, A. (2003). Estimation of parameters in a distributed precipitation-runoff model for Norway. Hydrol. Earth Syst. Sci. 7, 304–316. doi: 10.5194/hess-7-304-2003
Benestad, R. E. (2021). A norwegian approach to downscaling. Geosci. Model Dev. Discuss. 2021, 1–23. doi: 10.5194/gmd-2021-176
Bergström, S. (1995). “The HBV model,” in Computer Models of Watershed Hydrology, Chapter 13, eds V. P. Singh (Highlands Ranch, CO: Water Resources Publications), 443–476.
Bergström, S. (2006). Experience From Applications of the HBV Hydrological Model From the Perspective of Prediction in Ungauged Basins. Wallingford: IAHS Publication.
Climate-ADAPT (2022). The Adaptation Support Tool. Available online at: https://climate-adapt.eea.europa.eu/knowledge/tools/adaptation-support-tool (accessed January 11, 2022).
Copernicus Climate Change Service (2017). End-to-end Demonstrator for improved decision making in the water sector in Europe (EDgE). EDgE Deliverable Report Deliverable 1.2.1, Copernicus Climate Change Service. Contract number 2015-C3S 441-LOT1 NERC SC2.
Copernicus Climate Change Service (2022). Climate Change. Available online at: https://climate.copernicus.eu/ (accessed January 11, 2022).
Dankers, R., and Kundzewicz, Z. W. (2020). Grappling with uncertainties in physical climate impact projections of water resources. Clim. Change 163, 1379–1397. doi: 10.1007/s10584-020-02858-4
Dyrrdal, A., and Førland, E. (2019). Klimapåslag for korttidsnedbør (“Climate change allowance for short-term precipitation”). NCCS Report 5/2019, Norwegian Centre for Climate Services, Oslo, Norway. (In Norwegian.).
Ehret, U., Zehe, E., Wulfmeyer, V., Warrach-Sagi, K., and Liebert, J. (2012). HESS Opinions "Should we apply bias correction to global and regional climate model data?". Hydrol. Earth Syst. Sci. 16, 3391–3404. doi: 10.5194/hess-16-3391-2012
European Avalanche Warning Services (2022). Glossary. Available online at: https://www.avalanches.org/glossary/ (accessed January 18, 2022).
European Meteorological Society (2022). Outreach Award for Norwegian TV Meteorologists Communicating Climate Change. Available online at: https://www.emetsoc.org/outreach-award-for-norwegian-tv-meteorologists-communicating-climate-change/ (accessed January 30, 2022).
Frei, C., Christensen, J. H., Déqué, M., Jacob, D., Jones, R. G., and Vidale, P. L. (2003). Daily precipitation statistics in regional climate models: evaluation and intercomparison for the European Alps. J. Geophys. Res. 108, 2287. doi: 10.1029/2002JD002287
Geonorge (2022). What is Geonorge? Available online at: https://www.geonorge.no/en/about/what-is-geonorge/. (accessed January 03, 2022).
Gudmundsson, L., Bremnes, J. B., Haugen, J. E., and Engen-Skaugen, T. (2012). Technical Note: downscaling RCM precipitation to the station scale using statistical transformations-a comparison of methods. Hydrol. Earth Syst. Sci. 16, 3383–3390. doi: 10.5194/hess-16-3383-2012
Gutowski, W. J., Giorgi, F., Timbal, B., Frigon, A., Jacob, D., Kang, H.-S., et al. (2016). WCRP coordinated regional downscaling EXperiment (CORDEX): a diagnostic MIP for CMIP6. Geosci. Model Dev. 9, 4087–4095. doi: 10.5194/gmd-9-4087-2016
Hagemann, S., Chen, C., Clark, D. B., Folwell, S., Gosling, S. N., Haddeland, I., et al. (2013). Climate change impact on available water resources obtained using multiple global climate and hydrology models. Earth Syst. Dyn. 4, 129–144. doi: 10.5194/esd-4-129-2013
Hagemann, S., Chen, C., Haerter, J. O., Heinke, J., Gerten, D., and Piani, C. (2011). Impact of a statistical bias correction on the projected hydrological changes obtained from three GCMs and two hydrology models. J. Hydrometeorol. 12, 556–578. doi: 10.1175/2011JHM1336.1
Hamarsland, A. (2015). NVEs klimatilpasningsstrategi 2015-2019. (“NVE's Climate adaptation strategy 2015–2019”). NVE Report No. 80/2015, Norwegian Water Resources and Energy Directorate, Oslo, Norway. (In Norwegian.).
Handberg, O., and Pedersen, S. (2018). Lokal klimatilpasning - Erfaringer fra arbeid med klimatilpasningsstrategier i Oslo, Sandefjord og Kristiansand. (“Local climate adaptation- Experiences from climate adaptation strategies in Oslo, Sandefjord og Kristiansand”). MENON publication 99/2018 M-1165|2018, MENON, Oslo, Norway. (In Norwegian.).
Hanssen, G. S., Hofstad, H., and Hisdal, H. (2015). Manglende lokal tilpasning til klimaendringer: Kan flernivånettverk øke tilpasningskapasiteten? (“missing local adaptation to climate change: can multilevel networks increase the adaptive capacity?”). Kart og Plan 108, 64–78. Available online at: http://www.kartogplan.no/Hefter/KP1-2015/KP-1_2015.htm
Hanssen, G. S., Mydske, P. K., and Dahle, E. (2013). Multi-level coordination of climate change adaptation: by national hierarchical steering or by regional network governance? Local Environ. 18, 869–887. doi: 10.1080/13549839.2012.738657
Hanssen-Bauer, I., Førland, E., Hisdal, H., Mayer, S., Sandø, A., and Sorteberg, A. (2019). Climate in Svalbard 2100–a knowledge base for climate adaptation. NCCS Report 1/2019. Technical report, Norwegian Centre for Climate Services, Oslo, Norway. (In Norwegian.). pp. 206.
Hanssen-Bauer, I., Førland, E. J., Haddeland, I., Hisdal, H., Mayer, S., Nesje, A., et al. (2015). Klima i Norge 2100. Kunnskapsgrunnlag for klimatilpasning. NCCS Report 2/2015. Technical report, Norwegian Centre for Climate Services, Oslo, Norway. (In Norwegian.), pp. 204.
Hanssen-Bauer, I., Førland, E. J., Haddeland, I., Hisdal, H., Mayer, S., Nesje, A., et al. (2017a). Climate in Norway 2100—a knowledge base for climate adaptation. NCCS Report 1/2017, Norwegian Centre for Climate Services, Oslo, Norway. (In Norwegian.). pp. 43.
Hanssen-Bauer, I., Hygen, H., Heiberg, H., Førland, E. J., and Nordskog, B. (2017b). User needs for post processed climate data - A survey of the needs for output from the research project PostClim. NCCS Report 2/2017, Norwegian Centre for Climate Services, Oslo, Norway.
Hauge, Å. L., Almås, A.-J., Flyen, C., Stoknes, P. E., and Lohne, J. (2017). User guides for the climate adaptation of buildings and infrastructure in Norway - Characteristics and impact. Clim. Serv. 6, 23–33. doi: 10.1016/j.cliser.2017.06.009
Hauge, Å. L., Time, B., Flyen, C., Sivertsen, E., Venås, C., and Thomassen, M. (2020). Climate adaptation - how to make it happen? The meaning of learning in networks. Kart og Plan 113, 145–167. doi: 10.18261/issn.2535-6003-2020-03-02
Haugen, I., Hanssen-Bauer, I., Skaland, R., Engh, M., and Svardal, S. (2019). Kornproduksjon i møte med klimaendringer. (“Grain production in the face of climate change.”). TF Report 491/2019, Telemarksforsking, Telemark, Norway. (In Norwegian.).
Hempel, S., Frieler, K., Warszawski, L., Schewe, J., and Piontek, F. (2013). A trend-preserving bias correction –the isi-mip approach. Earth Syst. Dyn. 4, 219–236. doi: 10.5194/esd-4-219-2013
Hisdal, H., Vikhamar-Schuler, D., Førland, E., and Nilsen, I. (2021). Klimaprofiler for fylker. (“Climate factsheets for counties”). NCCS Report 2/2021, Norwegian Centre for Climate Services, Oslo, Norway. (In Norwegian.).
Hodgkins, G. A., Whitfield, P. H., Burn, D. H., Hannaford, J., Renard, B., Stahl, K., et al. (2017). Climate-driven variability in the occurrence of major floods across North America and Europe. J. Hydrol. 552, 704–717. doi: 10.1016/j.jhydrol.2017.07.027
Huang, S., Eisner, S., Magnusson, J. O., Lussana, C., Yang, X., and Beldring, S. (2019). Improvements of the spatially distributed hydrological modelling using the HBV model at 1 km resolution for Norway. J. Hydrol. 577, 123585. doi: 10.1016/j.jhydrol.2019.03.051
Hungr, O., Leroueil, S., and Picarelli, L. (2014). The Varnes classification of landslide types, an update. Landslides 11, 167–194. doi: 10.1007/s10346-013-0436-y
IMPACT2C (2022). Discover the IMPACT2C web-Atlas. Available online at: https://www.atlas.impact2c.eu/en/ (accessed January 11, 2022).
ISO-14091 (2021). ISO 14091:2021 Adaptation to Climate Change. Available online at: https://www.iso.org/standard/68508.html (accessed March 9, 2022).
Jacob, D., Petersen, J., Eggert, B., Alias, A., Christensen, O., Bouwer, L., et al. (2014). EURO-CORDEX: New high-resolution climate change projections for European impact research. Reg. Environ. Change 14, 563–578. doi: 10.1007/s10113-013-0499-2
Jacob, D., Teichmann, C., Sobolowski, S., Katragkou, E., Anders, I., Belda, M., et al. (2020). Regional climate downscaling over europe: perspectives from the euro-cordex community. Reg. Environ. Change 20, 51. doi: 10.1007/s10113-020-01606-9
Klemetsen, M., and Dahl, M. S. (2020). Hvor godt er norske kommuner rustet til å håndtere følgende av klimaendringer? Spørreundersøkelse om klimatilpasning utført våren 2019. (“How well are Norwegian municipalities prepared to handle climate change? Survey on climate adaptation spring 2019”). CICERO Report 2020, 05, CICERO, Oslo, Norway. (In Norwegian.).
Klima 2050 (2022). Klima 2050. Available online at: https://www.klima2050.no/ (accessed January 18, 2022).
Kolstad, E. W., Sofienlund, O. N., Kvamsås, H., Stiller-Reeve, M. A., Neby, S., Øyvind Paasche, P, ontoppidan, M., et al. (2019). Trials, errors, and improvements in coproduction of climate services. Bull. Am. Meteorol. Soc. 100, 1419–1428. doi: 10.1175/BAMS-D-18-0201.1
Kvamsås, H., Neby, S., Haarstad, H., Stiller-Reeve, M., and Schrage, J. (2021). Using collaborative hackathons to coproduce knowledge on local climate adaptation governance. Curr. Res. Environ. Sustain. 3, 100023. doi: 10.1016/j.crsust.2020.100023
Lawrence, D. (2016). Klimaendringer og fremtidige flommer. (“Climate change and future floods”). NVE Report No. 81/2016, Norwegian Water Resources and Energy Directorate, Oslo, Norway. (In Norwegian.).
Lawrence, D. (2018). “Modelling the effects of projected changes in sub-daily precipitation intensities on flooding in small catchments,” in Climatic Changes in Short Duration Extreme Precipitation and Rapid Onset Flooding - Implications for Design Values. (Oslo: Norwegian Centre for Climate Services), 109–120. Available online at: https://klimaservicesenter.no/kss/rapporter/rapporter-og-publikasjoner_2
Lawrence, D. (2020). Uncertainty introduced by flood frequency analysis in projections for changes in flood magnitudes under a future climate in norway. J. Hydrol. Reg. Stud. 28, 100675. doi: 10.1016/j.ejrh.2020.100675
Lawrence, D. (2021). “Modelling the effects of projected changes in sub-daily precipitation intensities on flooding in small catchments,” in Climatic Changes in Short Duration Extreme Precipitation and Rapid Onset Flooding - Implications for Design Values., Number 2/2021 in NCCS Report, Chapter 4.3, eds A. Sorteberg, D. Lawrence, A. Dyrrdal, S. Mayer, and K. Engeland (Oslo: Norwegian Centre for Climate Services), 109–120.
Lawrence, D., and Haddeland, I. (2011). Uncertainty in hydrological modelling of climate change impacts in four Norwegian catchments. Hydrol. Res. 42, 457–471. doi: 10.2166/nh.2011.010
Lawrence, D., Haddeland, I., and Langsholt, E. (2009). Calibration of HBV hydrological models using PEST parameter estimation. NVE Report No. 1/2009, Norwegian Water Resources and Energy Directorate, Oslo, Norway.
Lawrence, D., and Hisdal, H. (2011). Hydrological projections for floods in Norway under a future climate. NVE Report No. 5/2011, Norwegian Water Resources and Energy Directorate, Oslo, Norway.
Maraun, D., and Widmann, M. (2018). Statistical Downscaling and Bias Correction for Climate Research. WMO Technical note. Cambridge University Press.
Mehrotra, R., and Sharma, A. (2019). A resampling approach for correcting systematic spatiotemporal biases for multiple variables in a changing climate. Water Resour. Res. 55, 754–770. doi: 10.1029/2018WR023270
Mohr, M. (2008). New Routines for Gridding of Temperature and Precipitation Observations for “seNorge.no.” Report 8/2008, Norwegian Meteorological Institute, Oslo, Norway.
National Centre for Climate Services (2018). CH2018 - Climate Scenarios for Switzerland. Technical report, National Centre for Climate Services, Zürich, Switzerland. (In Norwegian.).
NCCS (2022a). Klimanormaler (“Climate normals”). Available online at: https://klimaservicesenter.no/kss/vrdata/normaler (accessed March 9, 2022).
NCCS (2022b). Precipitation Intensity (IDF Values). Available online at: https://klimaservicesenter.no/ivf?locale=en (accessed March 9, 2022).
NEA (2022). Klimatilpasning i sektorer (“Climate Change Adaptation in Sectors”). Available online at: https://www.miljodirektoratet.no/ansvarsomrader/klima/for-myndigheter/klimatilpasning/klimatilpasning-i-sektorer/ (accessed March 9, 2022).
Neby, S. (2019). Klimathon II 2019. Om samproduksjonsmetodikk, utfordringer og løsninger for lokal klimatilpasning (“On co-production methods, challenges and solutions for local climate adaptation”). Technical report, NORCE Norwegian Research Centre, Bergen, Norway. (In Norwegian.).
Nilsen, I., Hanssen-Bauer, I., Tveito, O., and Wong, W. K. (2021). Projected changes in days with zero-crossings for Norway. Int. J. Climatol. 41, 2173–2188. doi: 10.1002/joc.6913
Norwegian Broadcasting C.orporation (2020). Hvordan blir klimaet i din kommune? (“how will the climate change in your municipality?”). Available online at: https://nrk.no/klima/kommune (accessed December 22, 2021).
Norwegian Directorate for Civil Protection (2015). Klimahjelperen En veileder i hvordan ivareta samfunnssikkerhet og klimatilpasning i planlegging etter plan- og bygningsloven. (“Climate helper”). Dsb tema, Norwegian Directorate for Civil Protection, Oslo, Norway. (In Norwegian.).
Norwegian G.overnment (2017). Regulations on Technical Requirements for Construction Works. Regulations Associated With the Norwegian Planning- and Building Act. Available online at: https://dibk.no/globalassets/byggeregler/regulation-on-technical-requirements-for-construction-works-technical-regulations.pdf (accessed January 03, 2022).
Norwegian Government (2012). Climate Change Adaptation in Norway—meld. st. 33 (2012–2013) Report to the Storting (White Paper). Available online at: https://www.regjeringen.no/en/dokumenter/meld.-st.-33-20122013/id725930/ (accessed December 17, 2021).
Norwegian Government (2013). The Norwegian Planning- and Building Act. Available online at: https://dibk.no/regelverk/Building-Regulations-in-English/ (accessed December 17, 2021).
Norwegian Government (2018). Statlige Planretningslinjer for klima- og energiplanlegging og klimatilpasning. (“government guidelines on climate and energy planning”). Available online at: https://lovdata.no/dokument/SF/forskrift/2018-09-28-1469 (accessed December 17, 2021).
Rusdal, T., and Aall, C. (2019). Kartlegging av erfaringer fra arbeidet med klimatilpasning i små og mellomstore kommuner. ("Mapping experiences from climate adaptation in small and medium-sized municipalities."). VF Report 4/2019, Vestlandsforsking, Sogndal, Norway. (In Norwegian.).
Sælthun, N. R. (1996). The ‘Nordic’ HBV model. Description and documentation of the model version developed for the project Climate Change and Energy Production. Technical Report NVE Publication 7-1996, Norwegian Water Resources and Energy Directorate, Oslo, Norway.
Samaniego, L., Thober, S., Wanders, N., Pan, M., Rakovec, O., Sheffield, J., et al. (2019). Hydrological forecasts and projections for improved decision-making in the water sector in europe. Bull. Am. Meteorol. Soc. 100, 2451–2472. doi: 10.1175/BAMS-D-17-0274.1
Schewe, J., Heinke, J., Gerten, D., Haddeland, I., Arnell, N. W., Clark, D. B., et al. (2014). Multimodel assessment of water scarcity under climate change. Proc. Natl. Acad. Sci. U.S.A. 111, 3245–3250. doi: 10.1073/pnas.1222460110
Selseng, T., Hønsi, T., and Aall, C. (2019). Kartlegging av barrierar og kunnskapsbehov om klimatilpassing i offentleg forvalting. (“Mapping barriers and knowledge needs for climate adaptation in public management.”). VF Note 2/2019, Vestlandsforsking, Sogndal, Norway. (In Norwegian.).
Sharma, A., Wasko, C., and Lettenmaier, D. P. (2018). If precipitation extremes are increasing, why aren't floods? Water Resour. Res. 54, 8545–8551. doi: 10.1029/2018WR023749
Simpson, M., Nilsen, J., Ravndal, O., Breili, K., Sande, H., Kierulf, H., et al. (2015). Sea Level Change for Norway. NCCS Report 1/2015, Norwegian Centre for Climate Services, Oslo, Norway.
Skaugen, T., Lawrence, D., and Ortega, R. Z. (2020). A parameter parsimonious approach for catchment scale urban hydrology - which processes are important? J. Hydrol. X 8, 100060. doi: 10.1016/j.hydroa.2020.100060
Skaugen, T., Luijting, H., Saloranta, T., Vikhamar-Schuler, D., and Müller, K. (2018). In search of operational snow model structures for the future-comparing four snow models for 17 catchments in Norway. Hydrol. Res. 49, 1929–1945. doi: 10.2166/nh.2018.198
Skaugen, T., and Onof, C. (2014). A rainfall-runoff model parameterized from GIS and runoff data. Hydrol. Process. 28, 4529–4542. doi: 10.1002/hyp.9968
Skaugen, T., Stranden, H., and Saloranta, T. (2012). Trends in snow water equivalent in Norway (1931–2009). Hydrol. Res. 43, 489–499. doi: 10.2166/nh,.2012.109
SMHI Hypeweb (2022). Climate Change Data. Available online at: https://hypeweb.smhi.se/explore-water/climate-change-data/ (accessed January 11, 2022).
Statistics Norway (2021). Official Statistics Since 1876. Available online at: https://www.ssb.no/en (accessed December 17, 2021).
Swedish Meteorological Hydrological Institute (2020). Climate Information. Available online at: https://climateinformation.org/ (accessed January 11, 2022).
The Norwegian Agency for Local Governments (2022). Sustainability/Local climate risk/Lillestrøm. Available online at: https://klimarisiko.kbn.com/en/regions/viken/lillestrom/ (accessed January 11, 2022).
The Norwegian Public Roads Administration (2018). Vegbygging. Normal. (“Road construction. Regulations.”). Handbook series N200, The Norwegian Public Roads Administration, Oslo, Norway. (In Norwegian.).
Tveito, O., Skjelvåg, A., and Aune, B. (2005). A GIS-based agro-ecological decision system based on gridded climatology. Meteorol. Appl. 12, 57–68. doi: 10.1017/S1350482705001490
Vormoor, K., Lawrence, D., Heistermann, M., and Bronstert, A. (2015). Climate change impacts on the seasonality and generation processes of floods –projections and uncertainties for catchments with mixed snowmelt/rainfall regimes. Hydrol. Earth Syst. Sci. 19, 913–931. doi: 10.5194/hess-19-913-2015
Vormoor, K., Lawrence, D., Schlichting, L., Wilson, D., and Wong, W. K. (2016). Evidence for changes in the magnitude and frequency of observed rainfall vs. snowmelt driven floods in Norway. J. Hydrol. 538, 33–48. doi: 10.1016/j.jhydrol.2016.03.066
Wang, L. (2018). Klimatilpasning i Kommunene - Nasjonal Spørreundersøkelse for KS Høsten 2017. (“Climate adaptation in the municipalities. National survey for KS fall 2017”). insam report, insam, Drammen, Norway. (In Norwegian.).
Wang, L., and Grann, O. (2019). KS' arbeid med klimatilpasning i kommunesektoren 2008-2018 - grunnlag for å drøfte veien videre. (“Norwegian Association of Local and Regional Authorities' work on climate adaptation. Way forward.”). insam report 20.03.2019, insam, Drammen, Norway. (In Norwegian.).
Wejs, A., Harvold, K., Larsen, S. V., and Saglie, I.-L. (2014). Legitimacy building in weak institutional settings: climate change adaptation at local level in Denmark and Norway. Env. Polit. 23, 490–508. doi: 10.1080/09644016.2013.854967
Wong, W., Haddeland, I., Lawrence, D., and Beldring, S. (2016). Gridded 1x1 km climate and hydrological projections for Norway. NVE Report No. 59, Norwegian Water Resources and Energy Directorate, Oslo, Norway.
Keywords: climate projections, hydrological projections, climate change allowances, climate change adaptation, co-production of climate information, Norway, Svalbard
Citation: Nilsen IB, Hanssen-Bauer I, Dyrrdal AV, Hisdal H, Lawrence D, Haddeland I and Wong WK (2022) From Climate Model Output to Actionable Climate Information in Norway. Front. Clim. 4:866563. doi: 10.3389/fclim.2022.866563
Received: 31 January 2022; Accepted: 21 March 2022;
Published: 13 April 2022.
Edited by:
Andreas Marc Fischer, Federal Office of Meteorology and Climatology, SwitzerlandReviewed by:
Gaby Sophie Langendijk, Climate Service Center Germany (GERICS), GermanyCopyright © 2022 Nilsen, Hanssen-Bauer, Dyrrdal, Hisdal, Lawrence, Haddeland and Wong. This is an open-access article distributed under the terms of the Creative Commons Attribution License (CC BY). The use, distribution or reproduction in other forums is permitted, provided the original author(s) and the copyright owner(s) are credited and that the original publication in this journal is cited, in accordance with accepted academic practice. No use, distribution or reproduction is permitted which does not comply with these terms.
*Correspondence: Irene Brox Nilsen, aWJuaUBudmUubm8=
Disclaimer: All claims expressed in this article are solely those of the authors and do not necessarily represent those of their affiliated organizations, or those of the publisher, the editors and the reviewers. Any product that may be evaluated in this article or claim that may be made by its manufacturer is not guaranteed or endorsed by the publisher.
Research integrity at Frontiers
Learn more about the work of our research integrity team to safeguard the quality of each article we publish.