
94% of researchers rate our articles as excellent or good
Learn more about the work of our research integrity team to safeguard the quality of each article we publish.
Find out more
PERSPECTIVE article
Front. Clim., 01 April 2022
Sec. Predictions and Projections
Volume 4 - 2022 | https://doi.org/10.3389/fclim.2022.859728
This article is part of the Research TopicGenerating Actionable Climate Information in Support of Climate Adaptation and MitigationView all 12 articles
 Sophie van der Horst1*
 Hasse Goosen1
 Merlijn van Selm1
 Irene Koomen2
 Emmanuel Ochola Matsaba3
 John Wesonga4
 Jessica Koge5Marjel klein Holkenborg1
Climate change is already impacting the horticulture sector in Kenya. Even though the effects of climate change will be severe, adaptation to climate change still has little priority at the local and county level. This paper discusses the development of the agricultural climate atlas for Kajiado and Kiambu counties in Kenya as a climate information service to support the horticulture sector. This climate service for smallholder farmers aims to bridge the gap between climate research and data provision and the uptake by farmers and farmer organizations on the ground. Rather than developing a generic service for the whole of the country, we followed a local, bottom-up approach. Working at the county level, we tried to capture local needs. The result is a co-created atlas for two counties, for specific crops. The approach can be scaled up to other counties and other crops. We elaborate on our approach, and discuss lessons learned, challenges, and future work opportunities. The development of the climate atlas shows the importance of co-creation and user engagement. In addition, flexibility in the output and process was crucial. The main challenge remains to keep engagement high after completion of the project.
Climate change presents one of the most significant challenges to Kenya's horticulture sector due to extreme events such as droughts, floods, and temperature increases (Patrick et al., 2020). The effects of climate change are already felt, with weather fluctuations impacting productivity (Omoyo et al., 2015; Chepkoech et al., 2018). Even though the effects of climate change will be severe, adaptation to climate change still has little priority at the local and county level. Integrated Development Plans hardly mention long-term climate change (Vincent et al., 2017; Patrick et al., 2020), and climate-smart technologies are promoted in a general way, but they lack a proper underpinning of what would indeed be “climate smart” at a specific location with its specific projected climate impacts (Matsaba et al., 2020). One important reason for this inaction could be the large gap between technical climate research and the usability for end-users (Findlater et al., 2021), the so-called “valley of death” (Markham, 2002). Even though information and data are available, farmers and extension workers agents are often not well informed about the effects of climate change and how to adapt because the information is not usable and understandable for them (Findlater et al., 2021). Therefore, it is necessary to actively involve and educate farmers and their advisors to reach the “last mile” (Celliers et al., 2021).
Extensive research has been published on the development of climate services that focus on short-term weather or seasonal forecasts in Africa (Tall et al., 2014; Vaughan et al., 2019). Nevertheless, less literature is available on the development of climate services that focus on the long-term effects of climate change. We discuss the development of the agricultural climate atlas (climate-atlas.ke) for Kajiado and Kiambu counties in Kenya as a climate information service to support the horticulture sector, encompassing the production of fresh fruit and vegetables which is an important income generating sector in Kenya (Matui et al., 2016). This climate service for smallholder farmers, those in Kenya having an average landholding of 0.5 ha (Koomen et al., 2018), aims to bridge the gap between technical climate research and the usability by farmers and farmer organizations on the ground (see Matsaba et al., 2020 for a technical description). In this perspective paper, we provide insights on our methodology, lessons learned, challenges, and future work opportunities.
There is no one-size-fits-all when it comes to climate services. For services to be usable and to be used, they need to match the local context, inter alia in terms of planning phase, currently used knowledge, stakeholders, and capacity for using information. User knowledge and needs drive the specification of climate service requirements to enable information uptake and service utilization. However, other factors also steer the development and delivery of services. For instance, constraints emerging from available science, existing tools and available resources must be accounted for to ensure services are usable in practice. Moreover, it is often the case that stakeholders will not have well-defined information requirements and plans for service use at the outset. In a co-creation process the end-users can learn-by-doing and develop requirements in collaboration with service providers and other stakeholders (Lemos et al., 2012). This implies that identification of user needs is not a single activity but requires an iterative process in which demand and supply co-evolve through a learning process (Ziervogel et al., 2021). As such we used a bottom-up approach, which is described in the following sections, to improve the knowledge and skills of local partners and practitioners.
Previous work in Africa has also shown that user engagement is crucial to developing a successful climate service (Tall et al., 2014). Therefore, we started the project with an extensive user needs assessment. The purpose of the assessment was to find out if farmers take climate change into account, what climate information is needed by farmers, and the easiest way for them to access this information. During a 3 week field visit in September 2019, 13 smallholder farmers from Kajiado and Kiambu were visited and interviewed to get acquainted with their day-to-day work and vulnerabilities. In addition, interviews with agricultural extension officers and experts from different fields relevant to horticulture were conducted. All interviews were qualitative, with the aim to draft a general insight in the status of climate change adaptation in smallholder horticulture. Interviews during initial farm visits were informal and conversational, focused on their current agricultural practices and their perception of climate change. According to Gall et al. (2003), these interviews build “…entirely on the spontaneous generation of questions in a natural interaction, typically one that occurs as part of ongoing participant observation fieldwork” (p. 293). Later, in-depth interviews were conducted with a selected group of farmers. These interviews were focused on climate change adaptation potential and willingness to adapt. All respondents were asked exactly the same questions, but they were free to provide as much information to those questions as they personally preferred (Gall et al., 2003). Optional follow-up questions were asked if the respondent touched upon relevant issues that needed further explanation. All farmers were selected by the local extension officers. This might have influenced the representation of the farmer community in both counties. However, it was assumed that farmers represent “average” farmers from their county. The farmer interviews, which were recorded, can be found in the Supplementary Material.
Most farmers pointed out a growing water scarcity in critical moments in the season as major environmental struggle. The timing of rains is crucial in rainfed agriculture, but continues to become harder to predict. Besides, the overall amount of rainfall seems to have decreased. Higher temperatures were perceived by more than half of the farmers. Together with decreasing amounts of rainfall and rainfall being increasingly erratic, it has created farmer awareness of the need to adapt to climatological circumstances. Nevertheless, they focus on the coming growing season and not so much on the climate that gradually changes over decades. Most farmers have not consciously adapted to long-term changes in climate. However, some farmers did find ways to deal with current variability. For example, farmers use irrigation to prolong growing seasons. Doing so, they respond to fluctuations in market demand to get higher returns on their products.
Furthermore, results indicated that smallholder farmers are looking for crop-specific and localized information (especially in the county Kiambu, climatic conditions vary greatly over relatively small areas of land). In addition, they stressed the need for seasonal information on the start and end dates of the rainy seasons. However, it became clear that accessing this information is a challenge due to the absence of mobile devices and internet connectivity. Here, we found that the extension workers are the most important climate and weather information providers of smallholder farmers. In contrast to smallholder farmers, extension workers do have access to computers and internet connectivity. As long-term climate information has a steering function toward decision-making, rather than directly influencing decisions as is the case with short-term information (Singh et al., 2018), it would be sufficient if farmers are informed through the extension workers. As a result, the extension worker became an important target audience for the climate atlas.
During the needs assessment, we found that it was challenging to define the main target audience. Farmers need to implement actual measures in the field, but they are not focused on changes taking place on a timescale of decades. They are more concerned about the outcome of the current or upcoming season. Extension workers would be able to guide farmers, but we also identified county officials as having an important role here. This is a barrier for effective adaptation: a complicated landscape of interests and responsibilities amongst the involved stakeholders, not fit for addressing a cross-cutting issue such as climate change.
Therefore, we developed a diagram showing the relationship between the involved stakeholders (Figure 1). For each stakeholder, we formulated a user story. User stories are a method, mainly used in agile software development, for representing requirements from users using a simple template such as “As a < Role>, I want < Goal>, so that < benefit>” (Lucassen et al., 2016). The role defines who will directly benefit from the climate services, the goal specifies which features the climate services should exhibit, and the benefit is the value for the user that will be obtained by implementing the user story.

Figure 1. Diagram of the stakeholders and their respective user story. The dashed lines represent feedback loops.
As active collaboration is important for successful co-creation (Vincent et al., 2018), users were involved during the development process where users were challenged to propose new ideas and think “outside-the-box.” The basic climate data tool, the climate atlas, shows the number of days per year above/below a maximum/minimum temperature threshold for future periods (Figure 2). The user can manually insert the desired temperature threshold and the months of interest. Thus, users can examine the risk of temperature increases for specific crops during specific periods. We presented the first version to extension workers after which their feedback was incorporated and multiple new versions were discussed with the users. Earlier, only coarse and generic climate data was available with little information about the effects on horticulture. Including growing seasons and identifying critical parameters with our user group allowed us to make a first step and interpret the data. In order to do so, crop-specific indicators, such as temperature thresholds above which yields drop were used. These thresholds were defined by experts and the user groups. This process ultimately resulted in a climate data tool with bias-corrected ERA5 and CMIP5 temperature data from the Climate Data Store (CDS) of the Copernicus Climate Change Service (C3S) (see Matsaba et al., 2020).
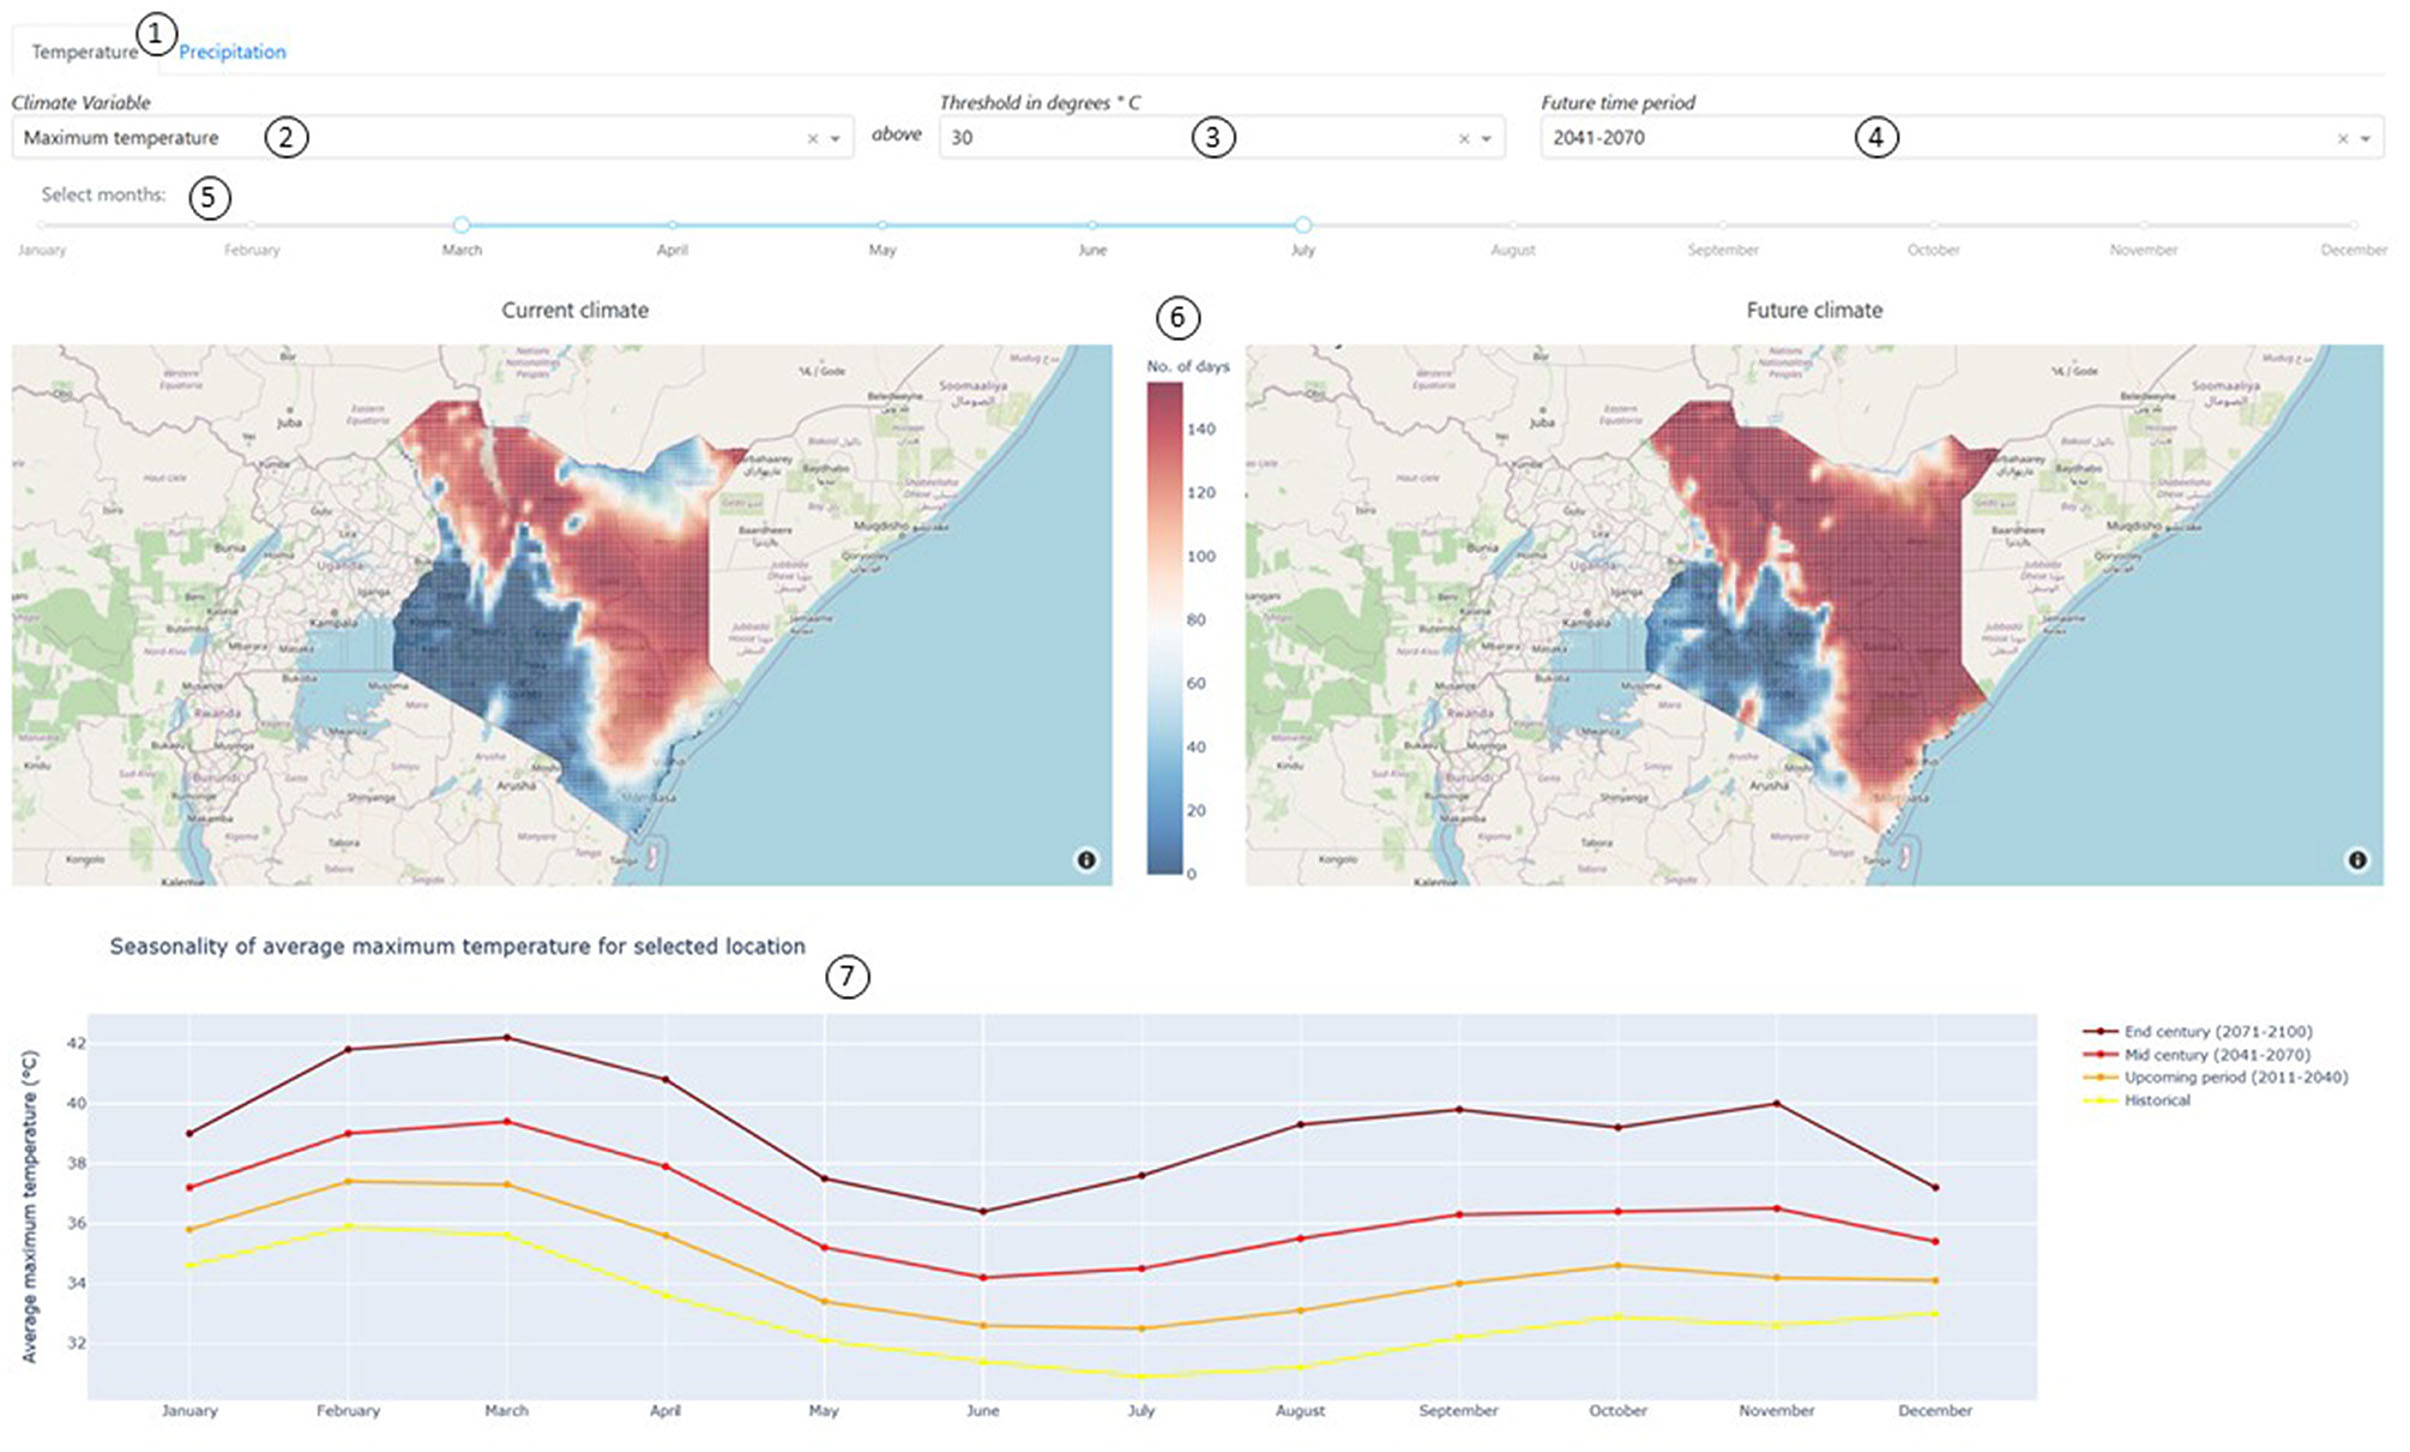
Figure 2. Climate data tool with numbers explaining its function: 1. Select temperature or precipitation, 2. Select the climate variable, 3. Select the crop-specific temperature threshold, 4. Select the future period, 5. Select the growing months of the crop, 6. Clickable maps showing the number of days above the temperature threshold in the growing season, 7. Figure showing the monthly temperature variation of the selected location in the map for different periods.
Additionally, during the user needs assessment, it became apparent that the timing of the onset of the rainy season is crucial for farmers. Therefore, the tool includes projections on the range of the start/end day of the rainy seasons. A key finding was that only looking at an “average year” provides limited information. Information on the variation between years is, therefore, a valuable and unique addition. For example, although the average onset of the long rains might be 15 March at some location, planting crops every year using that date will likely result in poor harvests. It would be better to prepare for different situations in terms of knowledge and skill (e.g., know how to handle a dry or wet year and which crops to plant). This could provide relevant climate information for strategic management of water resources.
During our feedback sessions, we found that real-life examples would help to engage the user with the data. Therefore, based on the expert tool, we constructed two example narratives, or storylines, together with farmers. These storylines serve as an illustration for other users. For these case studies, the relevant agro-climatic indicators for two reference crops, tomato and maize, were extracted from the literature supplemented by information supplied by seed companies. Changes in climatic suitability were studied for Kiambu and Kajiado Counties, and the data was visualized to allow user-friendly exploration of the specific temperature and precipitation indicators. Finally, different adaptation options were provided. In the example storyline of tomato in Kajiado, the shift of growing tomatoes in the cooler months is explored, as maximum temperatures will exceed the harmful threshold on a regular basis during the current growing season. However, water is scarce in the cool season, thus, enhanced water retention would be required for this shift.
Results have been generated for two specific counties (see www.climate-atlas.ke), and the aim is to expand and scale up the atlas to other counties as well, To increase the outreach and impact of the climate atlas, additional storylines can be developed for additional crops as well as other counties. To create this capacity in Kenya, we organized two capacity building workshops: one for technical staff at JKUAT University and one for the Kenya Meteorological Department (KMD) and local extension workers. The capacity building workshops were aimed at using the climate atlas to create storylines for new crops and for new areas. Staff from the district offices of the Kenya Meteorological Department (KMD) and local extension workers participated in these workshops. The representatives from the local meteorological offices in Kiambu, Kajiado, and Muranga provided feedback on the atlas and discussed which climate- and weather information is already available and how this relates to the climate atlas. The meteorological offices publish numerous reports and forecasts already and ideally these communication channels would be used to issue seasonal forecasts and communicate climate information to the relevant audience as well. The atlas was well-received, in particular the fact that it contains crop specific and regionalized narratives. At the same time, the tool allows users to define specific threshold values for specific periods of the year and for specific climate scenarios. The workshop also concluded that more training and capacity building activities were needed. To meet this demand, an online training module was developed (through the NUFFIC tailor made training program). This tailor-made training provides guidance on how to build and further expand the climate atlas to other crops and regions in Kenya. Participants learned more about the basics of climate change and were guided in the design of their own atlas and crop-specific story lines. They were encouraged to think critically about which information would be relevant in their case.
The development of the climate atlas shows the importance of co-creating a service together with the end users. We chose to work bottom-up and tried to capture local characteristics and needs. As a result the atlas is very specific for representative crops in two counties. At the start, a needs assessment has proven crucial to identify the extension workers as our main target user through which we could reach the smallholder farmers. However, they were not our only target group and the roadmap (Figure 1) shows that the climate atlas is not a simple tool that passes ready-made information to the end-users, but rather plays an important role in bringing the issue of climate impacts on horticulture to light in an iterative process. As a result, the atlas contains different information levels: stories to engage policy makers and other non-experts, and a deeper dive with more technical information for experts/practitioners.
Not only was the user involvement at the start important, throughout the process, users remained involved and the outputs were tested and evaluated on their usability. These moments of feedback were extremely valuable as users learned more about climate change and realized they needed other services than initially expected. Even though this meant that work needed to be redone, this process resulted in a climate service that was understandable and relatable to users. Field visits and workshops in real-life enabled us to better understand and to reach out to stakeholders. This was important to understand the local context in which the service would operate. This knowledge helped us to create user stories, which is a novel approach in the development of climate services, and to guide us through the development process. In addition, with the input from many smallholder farmers, we could integrate the climate data into storylines that served as practical examples.
The development of the climate atlas showed that flexibility in the process and outputs is important. Often the concept of climate indicators is new to the users and it is difficult for them to formulate their needs at the start. In this project, at first, the demand seemed to be for maps of temperature and precipitation-related changes on a yearly basis. At second glance, however, it turned out that users had difficulty relating these annual averages to the agricultural practices in their region. For example, if the average temperature is 2°C higher in 2050, is that good or bad, and should agricultural practices be adapted or not? At this point it became clear that, in order to reach the last mile, the indicators should be entirely crop-specific, taking into account the cropping calendar and particular critical thresholds.
The importance of flexibility has been highlighted in previous literature. For example, Vincent et al. (2018) stress that flexibility is required on the part of all institutions and individuals participating in the co-creation process. In our case, we were only able to carry out this co-creation work because our commissioning party was flexible in the outcomes, as often the outcomes are more predefined at the start of a project. Besides flexibility in the process, flexibility in the design of the climate service is important (Swart et al., 2017). The climate service needs to co-evolve with the dynamic development of information supply and demand. Therefore, we designed a climate atlas that is easily expandable when more information becomes available.
The ultimate goal of the project was to transfer the outputs to institutions in Kenya so that they can manage the climate service themselves. Even though we did transfer the content of the service, active management is still limited and it is difficult to assure that the service is still used after the completion of the project. We recognize that causes earlier reported by Venäläinen et al. (2016) also apply here: limitations of resources including funding, capacity, and expertise. As many other issues have a higher prioritization, work on climate change is often neglected. Research in Burkina Faso and Ethiopia also addresses this challenge, even after considerable effort is often made to build community engagement with the services (Harvey et al., 2019). As a result, low- and middle income countries often rely on ongoing international support in order to maintain programmatic interventions. Finding a solution to this challenge is not easy. Vincent et al. (2020) developed a conceptual framework in which they include enabling factors that they found to be crucial for actually achieving practical use in climate-resilient planning in Sub-Saharan Africa. They state that a climate service will not be used unless there are supportive institutions, appropriate policy frameworks, capacity of individuals, and agency to make decisions.
The development of the climate atlas has proven the importance of co-creation and user engagement to develop locally relevant and crop-specific user-defined indicators. Translating these specific indicators in “story lines” supported by maps created a powerful communication platform. The storylines were derived from the perspective of personas, or user stories. This helps to connect to the needs and understanding of the users on the ground. The numerous field trips and workshops showed that farmers need localized and crop-specific information, which resulted in the development of a climate data tool. This tool enables users to work with crop-specific temperature thresholds and growing seasons. Besides the value of co-creation and user engagement, flexibility during the process and output of the commissioning party and service provider was of key importance. The main challenge remains to ensure usage of the climate atlas after the project. Therefore, to increase its impact, we aim to expand the atlas and implement it into educational programs.
Publicly available datasets were analyzed in this study. This data can be found here: www.climate-atlas.ke.
SvH made a first draft of the article with HG, MvS, IK, EM, JW, and JK had major contributions to the project. The draft was send to them and they reviewed the manuscript. In addition, they added text, improved the content, and changed the structure of the manuscript. All authors contributed to the manuscript and approved the submitted version.
SvH, HG, MvS, and MkH were employed by Climate Adaptation Services.
The remaining authors declare that the research was conducted in the absence of any commercial or financial relationships that could be construed as a potential conflict of interest.
All claims expressed in this article are solely those of the authors and do not necessarily represent those of their affiliated organizations, or those of the publisher, the editors and the reviewers. Any product that may be evaluated in this article, or claim that may be made by its manufacturer, is not guaranteed or endorsed by the publisher.
For this Copernicus Climate Change Service (C3S Grant: C3S_4200_CAS) demonstrator project CAS partnered with SMHI, Wageningen University & Research (WUR) and Jomo Kenyatta University of Agriculture and Technology (JKUAT), Kenya. We thank the 3R project (Grant: 28056) for supporting the development of the atlas and for using their channels to reach out to many stakeholders in the field. The Tailor-made training was made possible through the Nuffic program (OKP-TMT.20/00120).
The Supplementary Material for this article can be found online at: https://www.frontiersin.org/articles/10.3389/fclim.2022.859728/full#supplementary-material
Celliers, L., Costa, M. M., Williams, D. S., and Rosendo, S. (2021). The ‘last mile' for climate data supporting local adaptation. Glob. Sustain. 4, 1–17. doi: 10.1017/sus.2021.12
Chepkoech, W., Mungai, N. W., Stöber, S., Bett, H. K., and Lotze-Campen, H. (2018). Farmers' perspectives: impact of climate change on African indigenous vegetable production in Kenya. Int. J. Clim. Change. Str. 10, 551–579. doi: 10.1108/IJCCSM-07-2017-0160
Findlater, K., Webber, S., Kandlikar, M., and Donner, S. (2021). Climate services promise better decisions but mainly focus on better data. Nat. Clim. Change 11, 731–737. doi: 10.1038/s41558-021-01125-3
Gall, M. D., Gall, J. P., and Borg, W. R. (2003). Educational Research: an Introduction. 7th Edn. Boston: Allyn & Bacon.
Harvey, B., Jones, L., Cochrane, L., and Singh, R. (2019). The evolving landscape of climate services in sub-Saharan Africa: What roles have NGOs played? Clim. Change 157, 81–98. doi: 10.1007/s10584-019-02410-z
Koomen, I., van der Lee, J., Obwanga, B., and Coninx, I. (2018). 3R Kenya Issue Brief 001: Targeting Medium-Sized Commercial Family Farms: A Pathway for Development. Wageningen: Wageningen University & Research. Available online at: https://edepot.wur.nl/473519 (accessed March 21, 2022).
Lemos, M. C., Kirchhoff, C. J., and Ramprasad, V. (2012). Narrowing the climate information usability gap. Nat. Clim. Change 2, 789–794. doi: 10.1038/nclimate1614
Lucassen, G., Dalpiaz, F., van der Werf, J. M. E., and Brinkkemper, S. (2016). “The use and effectiveness of user stories in practice,” in International Working Conference on Requirements Engineering: Foundation for Software Quality, eds P. Sawyer, B. Peach, and P. Heymans (Cham: Springer), 205–222.
Markham, S. K.. (2002). Moving technologies from lab to market. Res. Technol. Manage. 45, 31–42. doi: 10.1080/08956308.2002.11671531
Matsaba, E. O., van Selm, M., Wesonga, J. M., Goosen, H., Coninx, I., and Koomen, I. (2020). “Agricultural climate atlas for Kajiado and Kiambu Counties, Kenya,” in Handbook of Climate Change Management: Research, Leadership, Transformation, ed. W. Leal Filho, J. Luetz, and D. Ayal (Transformation Springer), 1–21.
Matui, M. S., Saavedra Gonzalez, Y., Gema, J., and Koomen, I. (2016). From Aid to Sustainable Trade: Driving Competitive Horticulture sector development; A Quick Scan of the Horticulture Sector. Wageningen Centre for Development Innovation, Wageningen University & Research. Report 3RKenya- 16-03/CDI-16-045. Available online at: https://edepot.wur.nl/473425 (accessed March 21, 2022).
Omoyo, N. N., Wakhungu, J., and Oteng'i, S. (2015). Effects of climate variability on maize yield in the arid and semi arid lands of lower eastern Kenya. Agric. Food Secur. 4, 1–13. doi: 10.1186/s40066-015-0028-2
Patrick, E. M., Koge, J., Zwarts, E., Wesonga, J. M., Atela, J. O., Tonui, C., et al. (2020). Climate-Resilient Horticulture for Sustainable County Development in Kenya (No. WCDI-20-107). Wageningen Centre for Development Innovation.
Singh, C., Daron, J., Bazaz, A., Ziervogel, G., Spear, D., Krishnaswamy, J., et al. (2018). The utility of weather and climate information for adaptation decision-making: current uses and future prospects in Africa and India. Clim. Dev. 10, 389–405. doi: 10.1080/17565529.2017.1318744
Swart, R. J., de Bruin, K., Dhenain, S., Dubois, G., Groot, A., and von der Forst, E. (2017). Developing climate information portals with users: Promises and pitfalls. Clim. Serv. 6, 12–22. doi: 10.1016/j.cliser.2017.06.008
Tall, A., Hansen, J., Jay, A., Campbell, B. M., Kinyangi, J., Aggarwal, P. K., et al. (2014). Scaling Up Climate Services for Farmers: Mission Possible. Learning From Good Practice in Africa and South Asia. CCAFS Report No. 13. Copenhagen, Denmark: CGIAR Research Program on Climate Change, Agriculture and Food Security (CCAFS).
Vaughan, C., Hansen, J., Roudier, P., Watkiss, P., and Carr, E. (2019). Evaluating agricultural weather and climate services in Africa: Evidence, methods, and a learning agenda. Wires Clim. Change 10, e586. doi: 10.1002/wcc.586
Venäläinen, A., Pilli-Sihvola, K., Tuomenvirta, H., Ruuhela, R., Kululanga, E., Mtilatila, L., et al. (2016). Analysis of the meteorological capacity for early warnings in Malawi and Zambia. Clim. Dev. 8, 190–196. doi: 10.1080/17565529.2015.1034229
Vincent, K., Conway, D., Dougill, A. J., Pardoe, J., Archer, E., Gajanan Bhave, A., et al. (2020). Re-balancing climate services to inform climate-resilient planning - A conceptual framework and illustrations from sub-Saharan Africa. Clim. Risk Manag. 29, 100242. doi: 10.1016/j.crm.2020.100242
Vincent, K., Daly, M., Scannell, C., and Leathes, B. (2018). What can climate services learn from theory and practice of co-production?. Clim. Serv. 12, 48–58. doi: 10.1016/j.cliser.2018.11.001
Vincent, K., Dougill, A. J., Dixon, J. L., Stringer, L. C., and Cull, T. (2017). Identifying climate services needs for national planning: insights from Malawi. Clim. Policy 17, 189–202. doi: 10.1080/14693062.2015.1075374
Keywords: Kenya, climate services, horticulture, adaptation, smallholder farmers, climate change, climate atlas
Citation: van der Horst S, Goosen H, van Selm M, Koomen I, Matsaba EO, Wesonga J, Koge J and klein Holkenborg M (2022) Co-creation of a Scalable Climate Service for Kenyan Smallholder Farmers. Front. Clim. 4:859728. doi: 10.3389/fclim.2022.859728
Received: 21 January 2022; Accepted: 11 March 2022;
Published: 01 April 2022.
Edited by:
Hans Olav Hygen, Norwegian Meteorological Institute, NorwayReviewed by:
Annamaria Lammel, Université Paris 8, FranceCopyright © 2022 van der Horst, Goosen, van Selm, Koomen, Matsaba, Wesonga, Koge and klein Holkenborg. This is an open-access article distributed under the terms of the Creative Commons Attribution License (CC BY). The use, distribution or reproduction in other forums is permitted, provided the original author(s) and the copyright owner(s) are credited and that the original publication in this journal is cited, in accordance with accepted academic practice. No use, distribution or reproduction is permitted which does not comply with these terms.
*Correspondence: Sophie van der Horst, c29waGllQGNsaW1hdGU=YWRhcHRhdGlvbnNlcnZpY2VzLmNvbQ==
Disclaimer: All claims expressed in this article are solely those of the authors and do not necessarily represent those of their affiliated organizations, or those of the publisher, the editors and the reviewers. Any product that may be evaluated in this article or claim that may be made by its manufacturer is not guaranteed or endorsed by the publisher.
Research integrity at Frontiers
Learn more about the work of our research integrity team to safeguard the quality of each article we publish.