- Department of Economics, Aoyama Gakuin University, Tokyo, Japan
Households use various energy sources for many purposes. Past studies have not investigated how much CO2 emissions change when households with similar socioeconomic characteristics choose different energy source combinations. In this study, we estimate the difference household energy source selection makes in winter CO2 emissions through a microdata analysis of 29,887 households randomly selected from whole Japan. Since socioeconomic characteristics of households affect both energy source selection and energy consumption, the impact of energy source selection on CO2 emissions cannot be assessed by simply comparing CO2 emissions among households using different energy sources. Therefore, we employ a selection bias correction model characterized by two stages, energy source selection and energy consumption. Our empirical results reveal that households using various energy source combinations increase CO2 emissions at different speeds with decreases in temperature. Households primarily using electricity and kerosene increase CO2 emissions faster than households simultaneously using gases. This result casts doubt on the promotion of fully electrified houses and at the same time encourages gas use in winter.
Introduction
The reduction of CO2 emissions from the residential sector is now an important policy agenda for any country, and various energy conservation measures have been implemented for that purpose. Such energy conservation measures can be broadly classified into three stages: (1) energy source choice, (2) appliance choice, and (3) appliance use (Matsumoto et al., 2021). Since household decisions at each stage influence final energy consumption and CO2 emissions, they have been extensively analyzed in previous studies.
More than one-third of the world's population has limited access to modern energy services, and lack of access to modern energy systems stands as a major obstacle to economic development (Kowsari and Zerriffi, 2011). Therefore, the choice of household energy sources has been intensively studied in development economics. By enabling access to modern energy sources, a policymaker can allocate time supplying energy to other production activities (International Energy Agency, 2002) while lowering the risk of diseases caused by air pollution (World Health Organization, 2021). However, even if modern energy becomes available, not all households will start using it in the same way. Previous studies have shown that family structure, household income, housing location, and housing structure influence energy source choices (Couture et al., 2012; Ozcan et al., 2013; Damette et al., 2018).
Households must use appliances to obtain energy services. By inducing households to choose energy-efficient appliances, a policymaker can expect a reduction in energy consumption by the residential sector. Therefore, countries have supported research and development to improve the energy efficiency of appliances, launched campaigns to promote energy-efficient appliances, and provided subsidies for their purchase. The effectiveness of such programs has been intensively analyzed in the academic literature1. In addition, previous studies have identified household characteristics associated with energy efficiency choice (Mills and Schleich, 2010, 2012; Matsumoto and Onuma, 2020). Because new appliances generally have higher energy efficiencies than older appliances, appliances replacement will save energy. Some studies have identified early adopters of new energy-efficient appliances (van Rijnsoever et al., 2009; Campbell et al., 2012), whereas other studies have provided an appliance-replacement model (Fernandez, 2000, 2001; Wang and Matsumoto, 2021). These empirical studies have revealed that the energy efficiency choice is associated with household characteristics.
Previous studies have also analyzed appliance use. Early literature treated appliance ownership as a predetermined condition and then compared energy consumption among households with different characteristics. These so-called conditional demand analyses were conducted in many countries and confirmed that household characteristics influence energy consumption in a systemic way (Parti and Parti, 1980; LaFrance and Perron, 1994; Newsham and Donnelly, 2013; Matsumoto, 2016). Although knowing how much energy a household uses for a given appliance is typically not possible, the amount of electric power used for each appliance can be determined by installing smart meters. However, due to its high installation cost, the metering approach has rarely been conducted at a larger scale. Studies such as REMODECE (2008) are exceptions. Instead, of indirectly estimating appliance use from energy consumption data, some researchers have asked households about the intensity of their appliance use directly. For example, households have been asked about TV viewing time and air conditioner temperature settings. Although indirect estimation of appliance use is greatly influenced by the level of investment in energy efficiency, researchers can better focus on the energy-saving behavior of households by directly analyzing the intensity of appliance use. However, it is difficult to obtain accurate information in those types of surveys because households record the intensity of appliance use based on memory.
The abovementioned decisions at the three stages are related. The relationship between second- and third-stage decisions has been widely studied in terms of the Jevons paradox and the rebound effect. Many researchers have observed that people increase the intensity of appliance use after investing in energy efficiency. Early literature used cross-sectional data to simply compare the intensity of appliance use between households with energy-efficient appliances and those with energy-inefficient appliances. More recent literature uses panel data to control household-specific characteristics, examining whether the intensity of appliance use changes after appliance-replacement (Mizobuchi and Takeuchi, 2016; Morita et al., 2021).
The second-stage decision depends on the first-stage decision since the types of appliances that can be installed are determined according to the chosen energy source. However, whether households that choose different energy sources invest in energy efficiency at similar intensities is less known. For example, whether households that choose full electrification invest in energy efficiency more intensively than other households has not been investigated.
As the above literature survey indicates, much research has been done on household energy use. However, most of that research selects a specific energy source such as electricity and then investigates only the use of that energy source. In other words, the relationship between first- and third-stage decisions has not been examined in previous studies. Given that many households use multiple energy sources, household-level energy efficiency should be discussed at the aggregate rather than single-energy-source level2. The object of this study is to examine how much households' total carbon emissions change according to the choice of energy source combination3. To the best of our knowledge, only few studies conducted a multinominal of household level data (Matsumoto, 2022) and no study has analyzed the relationship between energy source selection and energy consumption. Such an analysis must be useful under conditions in which countries strengthen their carbon pricing policies to tackle the problem of global warming.
Because households consume much more energy in winter than in the other three seasons (Statistical Bureau of Japan, 2020), we focus on winter energy consumption, which is primarily used for space heating and supplying hot water. Households initially choose their energy source combination from electricity, city gas, LP gas, and kerosene and subsequently determine their consumption for each energy source. To allow household characteristics to influence both the choice of energy source combination and energy consumption, we employ the selection bias correction model for the empirical analysis (Lee, 1983; Dubin and McFadden, 1984; Bourguignon et al., 2007). We then demonstrate how households' socioeconomic characteristics and weather conditions affect the choice of energy source combination and energy consumption. We further examine whether the choice of combined energy sources influences ultimate carbon emission.
The structure of the remainder of this paper is as follows. We use microdata of Japanese households in this study (Ministry of the Environment of Japan, 2014, 2017 and 2018). In the next section, we offer background knowledge about energy consumption by Japanese households and provide a data summary. We specify an empirical model in section empirical model and show the estimation results in section empirical results. Our empirical results reveal that households using different energy source combinations increase CO2 emissions at different magnitudes as the temperature drops. Households that primarily use electricity and kerosene increase CO2 emissions more intensively than those that use gases simultaneously. We conclude the paper in section conclusion and policy implications.
Energy Consumption by Japanese Households
Energy Source Choices of Japanese Households
Most Japanese households use a combination of four types of energy inside the home: electricity, city gas, LP gas, and kerosene4. In practice, however, because virtually all households use electricity, a household chooses among energy from city gas, LP gas, and kerosene. City and LP gases cannot be used simultaneously because they have different calorific values and require different equipment. Therefore, at the installation stage, households must decide what type of gas to use. Although LP gas is available in all areas, city gas is available only in urban areas connected to the city gas grid. Therefore, households in urban grid areas have six options for energy source combinations, whereas those in rural non-grid areas have only four options. To examine the availability of city gas in municipalities, we first determined whether there was a household using city gas in each municipality based on data from the Ministry of the Environment's Household CO2 Survey. We classified the municipalities with households using city gas into urban grid areas, whereas the remaining municipalities were classified as rural non-grid areas.
Table 1 shows the number and percentage of households that selected a specific combination of energy sources. The nationwide percentage of fully electrified households is 13.8%, with more than two energy sources used by the remaining households. The table further shows that a fully electrified household is more popular in rural non-grid than in urban grid areas. Although households often install a solar panel when fully electrifying their houses, solar panels are more difficult to install in urban than in rural areas.
The most common combination in urban grid areas is Combination 2, electricity and city gas, with 34.4% of households choosing that combination. In addition, more than 39% of households use kerosene. In contrast, the most common combination in rural non-grid areas is Combination 6—electricity, LP gas, and kerosene—with 39.2% of households choosing that combination. In rural non-grid areas, 54.2% of households use kerosene. These statistical results suggest that it is not appropriate to discuss household energy consumption in winter without considering kerosene use.
Winter CO2 Emissions
Households use energy for various purposes, and several factors affect household energy consumption. In this study, we focus on CO2 emissions generated by winter energy consumption (November to February) for items such as space heating and hot water. Specifically, we calculate the difference in CO2 emissions between June, when CO2 emissions are minimized for the year, and the winter months and then define that difference as winter CO2 emissions. By investigating the change in CO2 emissions between seasons for the same households, it becomes possible to more accurately evaluate the impact of weather changes on household CO2 emissions.
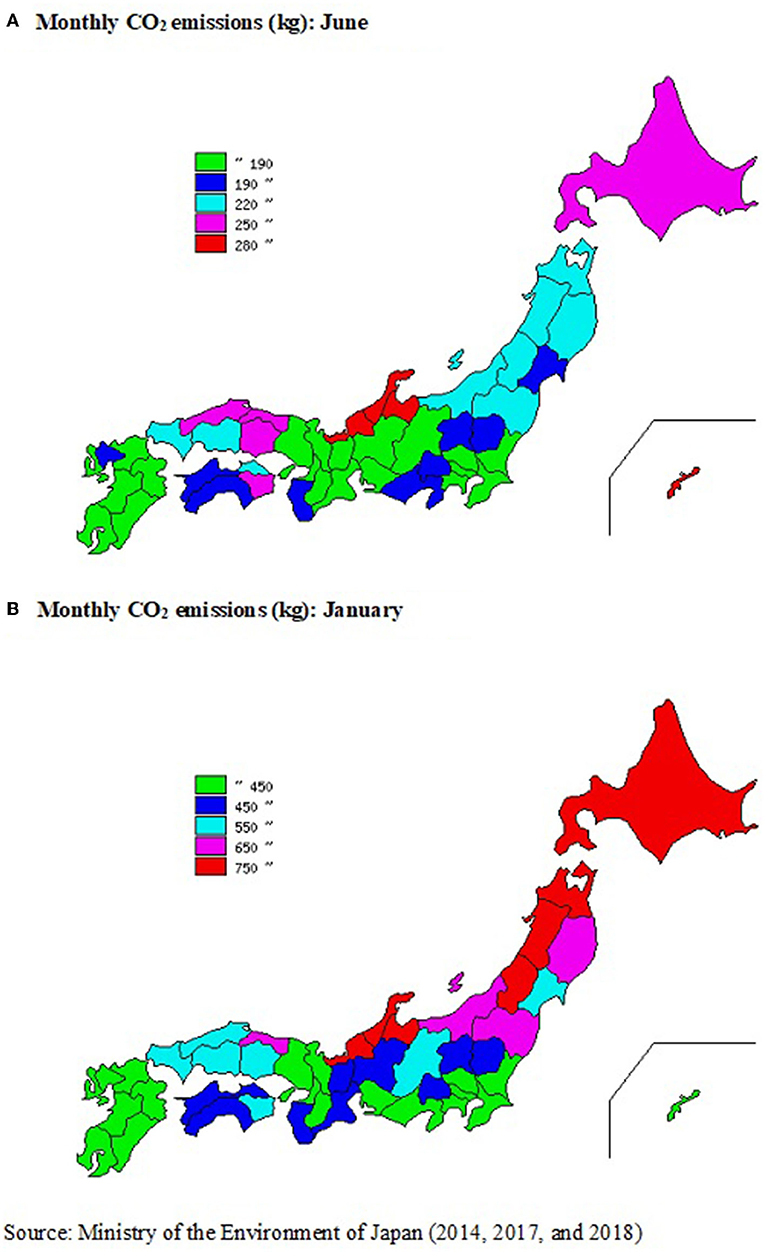
Figures 1A,B shows the CO2 emissions of the average household in each prefecture during June and January, respectively. The figures show a geographical variation in CO2 emissions, namely, that CO2 emissions in northern regions are higher than in southern regions. The figures further show that CO2 emissions are substantially greater in January than in June. Indeed, CO2 emissions triple in some prefectures during that time.
Weather Conditions
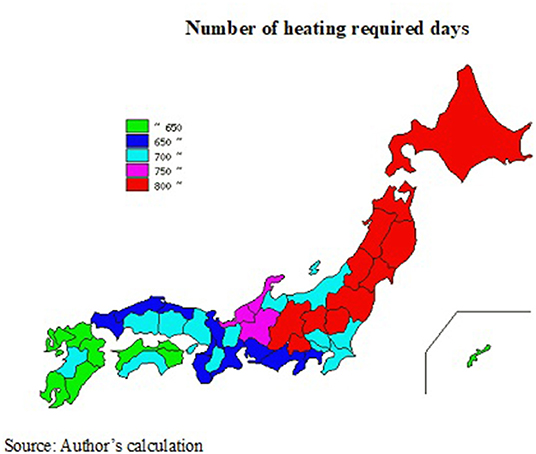
Weather conditions are expected to affect both energy source choices and energy consumption decisions. Households choose their energy choice combinations by referring to previous weather conditions. We obtained temperature data between 4/1/2009 and 3/31/2013 from the website of the Japan Meteorological Agency (2021)5. We then identified the nearest weather station for each household and counted the total number of heating required days (HRDs)6. It was assumed that heating was required if the average temperature of the corresponding day was below 14°C. Figure 2 presents the total number of HRDs at the prefecture level. The figure clearly shows that prefectures in the north require more heating. In later analysis, we examine whether the total number of HRDs determines households' energy source choices.
The weather conditions in the sampling year ultimately determine the intensity of use of space heating and water-heating appliances. We will now examine whether households using different combinations of energy sources increase CO2 emissions at different speeds as the temperature drops.
Empirical Model
To examine whether the choice of the energy source combination influences CO2 emissions, we estimate a selection bias correction model. We define household i's CO2 emissions due to winter energy use as the difference in CO2 emissions between winter month m and the base month of June. We then assume that the increase in CO2 emissions becomes ΔCi,m,k when household i chooses the kth energy source combination.
We next calculate the difference in the average temperature between the base month and month m in the area where household i lives and indicate this temperature change by ΔTi,m > 0. To understand how households increase their CO2 emissions with decreases in temperature, we consider the following empirical model:
where HiΔTi,m is the interaction term of household characteristics Hi and temperature change ΔTi,m. Because households with different characteristics are likely to increase their energy consumption at differing intensities in response to reductions in temperature, we include the interaction terms in the estimation model. Specifically, we include annual household income, number of persons, floor area of the house, and housing ownership in Hi.
We assume that household i receives utility of when it chooses the kth energy source combination. We further assume that this utility is characterized by the following specification:
In addition to annual household income, floor area of the house, and housing ownership, we include the number of HRDs and the age of the house in Zi. These two attributes influence the choice of energy source combination but do not determine energy consumption behavior directly. It is assumed that the probability that household i chooses the kth energy source combination can be given by the multinominal logit model:
The estimated coefficients of Equation (1) (CO2 emissions equation) may be biased because the disturbance term ui,m,k can be correlated with νi,k. To avoid this potential bias, we employ the approach proposed by Dubin and McFadden (1984)7.
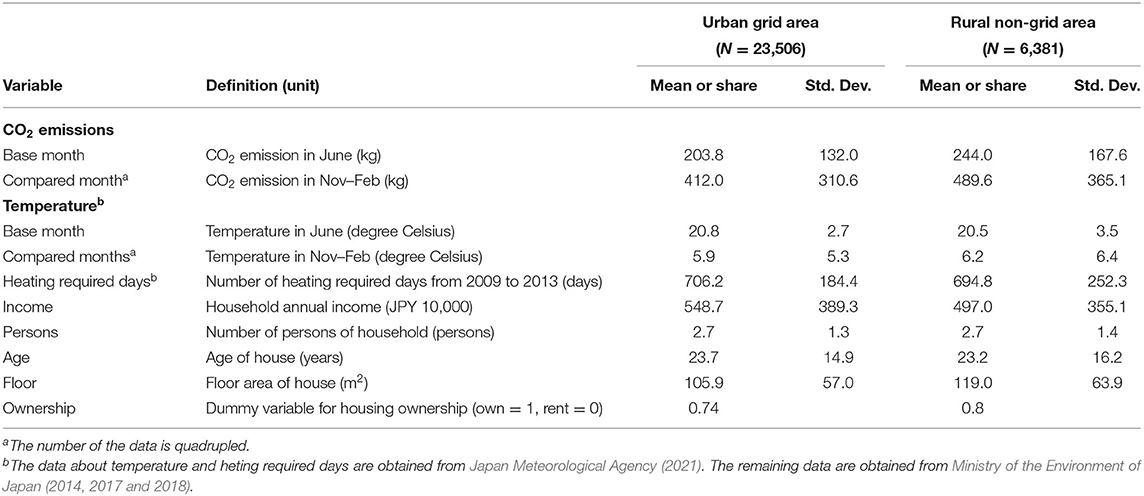
Table 2 presents the descriptive statistics of the variables used in the empirical analyses below. After removing the households lacking information about socioeconomic or housing characteristics, the number of households in the urban grid area decreased from 24,453 to 23,506, and the number of households in the rural non-grid area decreased from 6,690 to 6,381. Since the data are divided into urban grid and rural non-grid areas for analysis, we present the descriptive statistics separately for urban grid and rural non-grid areas. The number of sampling households is 23,506 for urban grid areas and 6,381 for rural non-grid areas. In the survey, households were asked to choose their annual income class from preprepared options, but we use the median income of the option in this study8. Similarly, households were asked to choose the age of the house from preprepared options, but we use the median year of the option in this study9. We obtained CO2 emissions and temperature data from the four winter months: November, December, January, and February. Therefore, the number of these two types of data is quadrupled. The table shows that CO2 emissions doubled, while the temperature decreased by 14 degree Celsius from June to the aforementioned winter months.
Empirical Results
Choice of Energy Source Combination
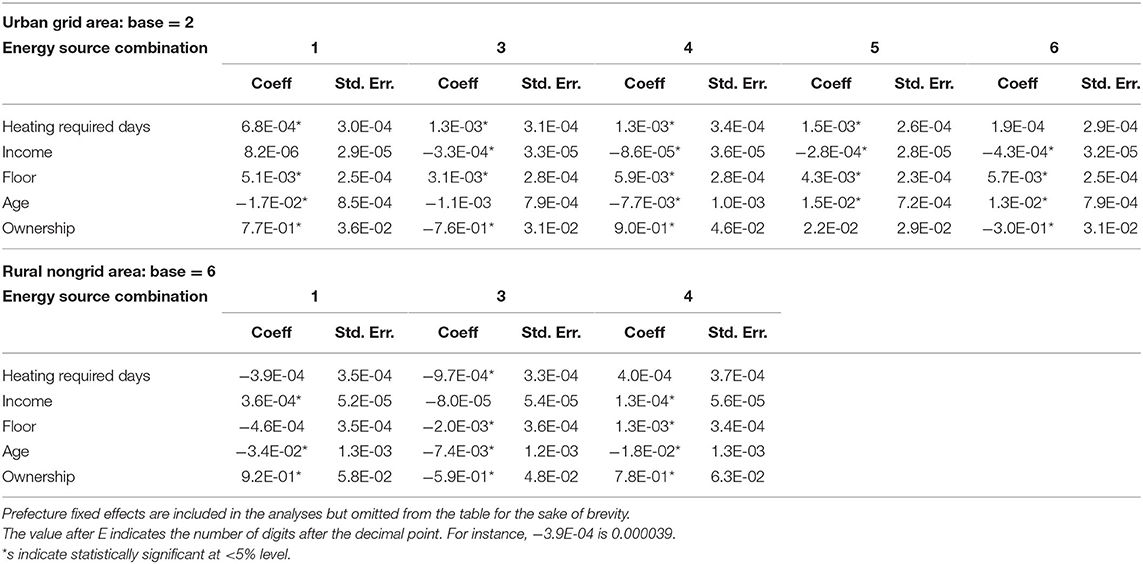
The main objectives of the empirical analysis are to examine (1) whether households choosing different energy source combinations increase CO2 emissions at different speeds as the temperature drops and (2) what types of household characteristics influence winter energy consumption. Before reporting the results of the CO2 emissions analysis, we summarize the estimation results for the energy source combination. See the results in Table 3.
In urban grid areas, Combination 2 of electricity and city gas is chosen as the base combination. On the other hand, in rural non-grid areas, Combination 6 of electricity, LP gas, and kerosene is chosen as the base combination. The impacts of the covariates on the likelihood to be chosen are compared between the base and alternative combinations. The positive (negative) coefficient means that the likelihood of an alternative combination increases (decreases) as the size of the covariate increases.
HRDs became positive in all combinations in urban grid areas and became statistically significant in four combinations at less than the 5% level. This result implies that the base combination of electricity and city gas is less likely to be chosen in cold areas. The comparison of the size of the estimated coefficients suggests that Combination 1 of full electrification is less popular in cold areas. In ural non-grid areas, HRDs became negative in Combinations 1 and 3 but positive in Combination 4 at less than the 5% level. This result implies that households in cold regions are more likely to use kerosene in winter.
In urban grid areas, household income became negative and statistically significant at less than a 5% level in Combinations 3–6. The results show that wealthy households tend to choose urban gas rather than LP gas and tend not to choose kerosene. In rural non-grid areas, household income became positive and statistically significant at less than the 5% level in Combinations 1 and 4. This result implies that full electrification is the choice of wealthy households, but LP gas is the choice for less wealthy households.
The floor area and age of the house are also associated with energy source choices. The positive coefficient for floor area in urban grid areas suggests that households living in small houses are more likely to choose Combination 2 of electricity and city gas. On the other hand, floor area became negative in Combination 3 but positive in Combination 4, indicating that households living in large homes do not choose LP gas. Age of house became negative in Combination 1 of full electrification; this result means that full electrified houses are those that have recently been built. Age of house became negative in all three combinations in rural non-grid areas, while it became positive in Combinations 5 and 6. This result suggests that households that recently constructed a house are using a more limited number of energy sources than households that constructed a house at an earlier date.
Determinants of Winter CO2 Emissions
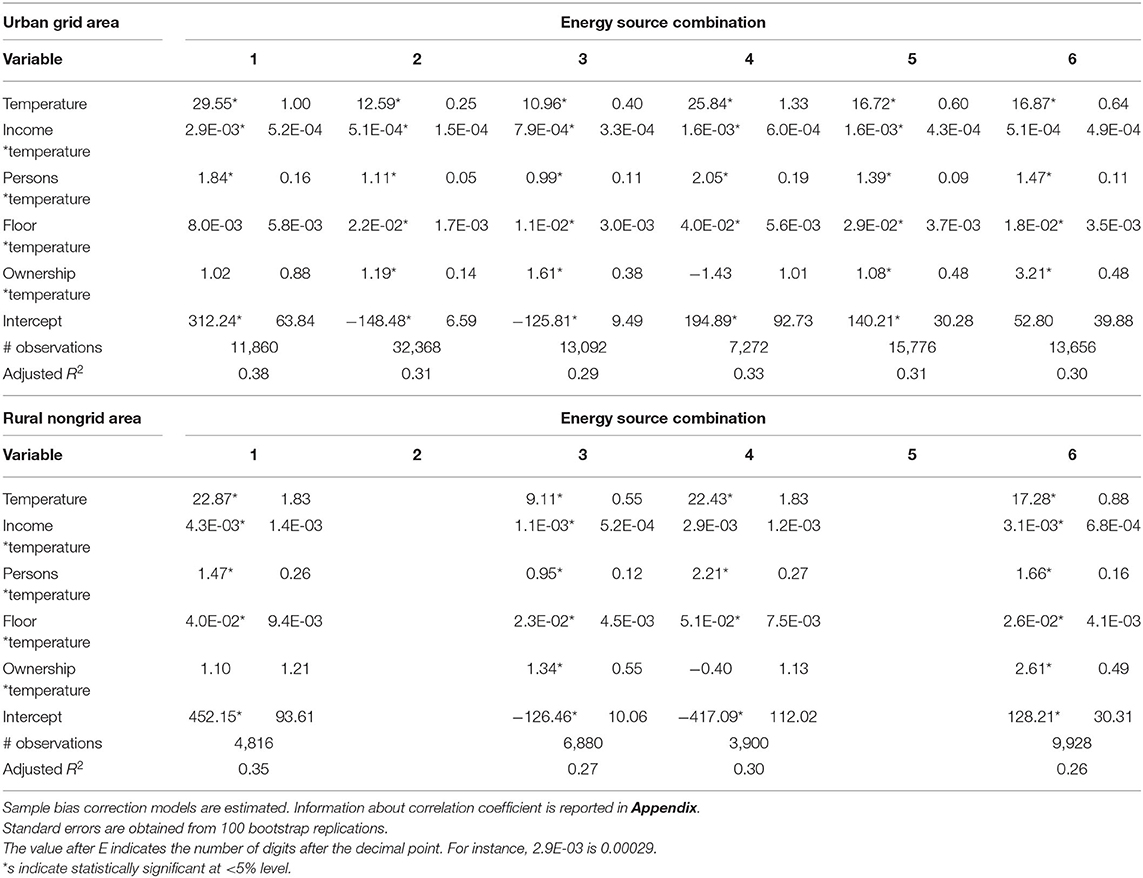
Table 4 is our main estimation result and shows increases in CO2 emissions with reductions in temperature. We report the estimation results obtained from the model proposed by Dubin and McFadden (1984) here10.
The temperature variable became positive and statistically significant at less than the 5% level in all cases, which implies that households increase their CO2 emissions with decreases in temperature. Although the reported coefficients of temperature show that CO2 emissions increase (kg) for every one-degree Celsius decrease in temperature, comparison of the coefficients suggests that households using different energy source combinations increase CO2 emissions at different speeds. The results show that fully electrified households increase CO2 emissions at the fastest speeds. In contrast, households using gas increase CO2 emissions at slower speeds. Although households living in fully electrified houses increases CO2 emissions per month by 29.55 kg for every one-degree Celsius decrease, those combining electricity and city gas increases it only by 12.59 kg. These results suggest that the choice of energy source combination substantially influences CO2 emissions.
The abovementioned tendencies are observed in both urban grid and rural non-grid areas. However, the size of the temperature coefficient for rural non-grid areas is smaller than for urban grid areas except for Combination 6. This means that households in urban areas increase CO2 emissions at faster speeds than those in rural areas.
We obtained expected results for the interaction variables. The positive signs for the Income*temperature variable show that wealthy households increase CO2 emissions at a faster speed. However, considering the unit of income (JPY 10,000) and the size of the estimated coefficients, we can state that household income does not make much difference in winter CO2 emissions. In other words, both wealthy and less wealthy households increase CO2 emissions at similar speeds corresponding to decreases in temperature. This leads to a similar conclusion about the housing size effect because the unit of the floor area of the house is m2.
The interaction variable of Persons*temperature became positive, and therefore, CO2 emissions increase faster among larger households. The family size effect is much larger than the income effect. However, the results show that household CO2 emissions during winter increase by <10% even if the number of family members increases by one. This result suggests that household members can share a substantial part of winter energy services; namely, scale economy is important for winter energy use.
Finally, we find a positive sign for the interaction variable of Ownership*temperature. This result suggests that households living in their own houses increase CO2 emissions faster with temperature decreases. It seems that this result is opposite to the prediction by previous studies such as those of Levinson and Scott (2004) and Ramos et al. (2016); energy consumption becomes greater among households living in rented houses since landlords do not sufficiently invest in energy efficiency. Perhaps the difference in the housing ownership effect between our study and previous studies arises from differences in the model structure. In previous studies, energy consumption between housing owners and renters was compared directly. In this study, we took two-step procedures; we initially evaluated the effect of housing ownership on the choice of the energy source combination and subsequently evaluated the effect of housing ownership on energy consumption. To fully grasp the effect of housing ownership, we need to consider the effect of housing ownership on the choice of the combination of energy sources.
Conclusion and Policy Implications
Households use multiple energy sources to obtain energy services. This study has analyzed microlevel energy consumption data for Japanese households to examine the difference that household energy source selection makes on winter CO2 emissions. The empirical results demonstrate that winter CO2 emissions are greatly affected by energy source selection. Specifically, households choosing full electrification increase CO2 emissions at the fastest speeds relative to decreases in temperature. In contrast, households using gas increase CO2 emissions at much slower speeds.
In addition, the speed of CO2 emissions increase has been compared between households with different characteristics. Although household characteristics affect CO2 emissions in expected ways, the impacts of household characteristics are not large compared with the impact of household energy source selection.
Given these empirical findings, we would like to propose two policy recommendations for the reduction of CO2 emissions from the Japanese household sector.
Suspend the Promotion of Fully Electrified Houses
The study reveals that households living in fully electrified houses emit more CO2 in winter. The result arises from two conditions. The first is that the emissions factor for electricity is high11. Japan still relies heavily on thermal power generation. The second condition is that much electricity is required to obtain adequate heat during the winter months. This is one reason that kerosene is popular among households in cold regions. Although full electrification of houses has been promoted in the past few decades, it seems necessary to reconsider such a policy from the perspective of global warming countermeasures.
According to the estimate by the Fuji Keizai Group (2016), the number of fully electrified houses will reach 9.39 million in 2025 in Japan, accounting for 17.9% of all homes. However, only 5.24 million houses will be equipped with power generation facilities such as solar panels. It is expected that more households will abandon LP gas use and will move to full electrification in order to lower energy cost. Such energy transition will increse CO2 emissions unless the power source composition is changed and solar panels are widely adopted.
Encourage Gas Use in Winter
The study reveals that households using gas emit less CO2 in winter. Households using gas seem to go through the winter with less energy than households not using it. Perhaps such households warm rooms and supply hot water more efficiently. Given this fact, policies that encourage gas use would be desirable.
The carbon tax rate currently introduced in Japan is kept low at 289 yen per ton. Under such a low carbon tax, households compare exclusively the price of energy itself. The current low carbon tax encourages households to use kerosene and hesitates to use gas. For global warming countermeasures, it will be necessary to reflect the CO2 emission factor in the energy sales price.
Although we have chosen Japan as a case study country, the general message from this study is valid for other countries as well. The efficiency of household energy consumption must be assessed together with household energy source selection. Otherwise, we could make an incorrect policy recommendation.
Data Availability Statement
Publicly available datasets were analyzed in this study. This data can be found here: Ministry of the Environment of Japan.
Author Contributions
The author confirms being the sole contributor of this work and has approved it for publication.
Funding
This research was supported by KAKENHI (18K01578 and 18H00837) of the Japan Society for the Promotion of Science.
Conflict of Interest
The author declares that the research was conducted in the absence of any commercial or financial relationships that could be construed as a potential conflict of interest.
Publisher's Note
All claims expressed in this article are solely those of the authors and do not necessarily represent those of their affiliated organizations, or those of the publisher, the editors and the reviewers. Any product that may be evaluated in this article, or claim that may be made by its manufacturer, is not guaranteed or endorsed by the publisher.
Acknowledgments
I appreciate the research support received from Prof. Toshi H. Arimura and Shohei Morimura.
Footnotes
1. ^See Arimura and Matsumoto (2020) for the review.
2. ^Baker et al. (1989) analyzed microlevel data on electricity and gas consumption of UK households. Although they found that electricity consumption increases with gas prices, they found that gas consumption decreases with increases in the electricity price.
3. ^The CO2 emitted from using fossil fuels in the power-generation stage is counted as household emissions in this study. The emission factors for city gas, LP gas, and kerosene are 2.1 kg /m3, 6.5 kg /m3, and 2.5 kg/liter, respectively. The emission factor of electricity varies depending on the power company and the sampling year but is about 0.39 kg/kWh. More detail is available from the Ministry of the Environment of Japan (2021).
4. ^We do not consider firewood use in this study because so few households use it.
5. ^Two sorts of weather data are used in this study. We assume that the weather condition before the survey period affects the energy source selection. Therefore, weather data from 4/1/2009 and 3/31/2013 is used for the energy source selection analysis. On the other hand, we assume that the weather condition in the sampling year determines household energy use. Therefore, we use the temperature data in the sampling year in winter CO2 emission analysis. This approach enables us to separate energy source selection decision from energy consumption decision.
6. ^We assumed that heating was required on that day if the temperature fell below 25°C.
7. ^Therefore, we estimate the correlation coefficient between u and v simultaneously during estimation.
8. ^Household income is classified into 7 groups in the survey. We use the median income of each group: Group 1 = JPY 1,250,000, Group 2 = 3,750,000, Group 3 = 6,750,000, Group 4 = 8,750,000, Group 5 = 12,500,000, Group 6 and 7 = 17,500,000.
9. ^The age of houses is classified into 9 levels in the survey. For example, in the 2014 survey, the categories are before 1970, 1971-80, 1981-85, 1986-90, 1991-95, 1996-2000, 2001-05, 2006-10, and after 2011. The difference between the median value of each category and the survey year was used as the age of the houses.
10. ^Although we also estimated the models proposed by Bourguignon et al. (2007) for the robustness check, we obtained results very similar to those presented in Table 4. Bourguignon et al. (2007) argue that their proposed estimation is not affected so seriously by the IIA assumption imposed on the multinominal logit model.
11. ^The electricity factors are 0.506, 0.453, 0.233, and 0.379 (kg CO2 per kWh) in Japan, US, UK, and Germany, respectively (Carbon footprint, 2021).
References
Arimura, T. H., and Matsumoto, S. (2020). Carbon Pricing in Japan. Springer. Available online at: https://link.springer.com/book/10.1007/978-981-15-6964-7 (accessed: December 8, 2021).
Baker, P., Blundell, R., and Micklewright, J. (1989). Modeling household energy expenditures using micro-data. Econ. J. 99, 720–738. doi: 10.2307/2233767
Bourguignon, F., Fournier, M., and Gurgand, M. (2007). Selection bias corrections based on the multinomial logit model: Monte Carlo comparisons. J. Econ. Surv. 21, 174–205. doi: 10.1111/j.1467-6419.2007.00503.x
Campbell, A. R., Ryley, T., and Thring, R. (2012). Identifying the early adopters of alternative fuel vehicles: a case study of Birmingham, United Kingdom. Transpor. Res. Part A 46, 1318–1327. doi: 10.1016/j.tra.2012.05.004
Carbon footprint (2021). International Electricity Factors. Available online at: https://www.carbonfootprint.com/international_electricity_factors.html (accessed: March 11, 2022).
Couture, S., Garcia, S., and Reynaud, A. (2012). Household energy choices and fuelwood consumption: an econometric approach using French data. Energy Econ. 34, 1972–1981. doi: 10.1016/j.eneco.2012.08.022
Damette, O., Delacote, P., and Del Lo, G. (2018). Households energy consumption and transition toward cleaner energy sources. Energy Policy. 113, 751–764. doi: 10.1016/j.enpol.2017.10.060
Dubin, J. A., and McFadden, D. L. (1984). An econometric analysis of residential electric appliance holdings and consumption. Econometrica 52, 345–362. doi: 10.2307/1911493
Fernandez, V. P. (2000). Decisions to replace consumer durables goods: an econometric application of winter and renewal processes. Rev. Econ. Stat. 82, 452–461. doi: 10.1162/003465300558948
Fernandez, V. P. (2001). Observable and unobservable determinants of replacement of home appliances. Energy Econ. 23, 305–323. doi: 10.1016/S0140-9883(00)00066-9
Fuji Keizai Group (2016). Trends in Fully-Electrified Houses and Energy-Creating Houses. Availabe online at: https://www.fuji-keizai.co.jp/market/detail.html?cid=16042 (accessed: March 11, 2022).
International Energy Agency. (2002). World Energy Outlook. Available online at: https://iea.blob.core.windows.net/assets/11bc7b29-db2a-46fb-a515-1f5e7d2c7dfd/WorldEnergyOutlook2002.pdf (accessed: March 10, 2022).
Japan Meteorological Agency (2021). Past Weather Data. Availabe online at: https://www.data.jma.go.jp/obd/stats/etrn/ (accessed: May 10, 2021).
Kowsari, R., and Zerriffi, H. (2011). Three dimensional energy profile: a conceptual framework for assessing household energy use. Energy Policy. 39, 7505–7517. doi: 10.1016/j.enpol.2011.06.030
LaFrance, G., and Perron, D. (1994). Evolution of residential electricity demand by end-use in Quebec 1979–1989: a conditional demand analysis. Energy Stud. Rev. 6, 164–173. doi: 10.15173/esr.v6i2.334
Lee, L. F. (1983). Generalized econometric models with selectivity. Econometrica 51, 507–512. doi: 10.2307/1912003
Levinson, A., and Scott, N. (2004). Energy use by apartment tenants when landlords pay for utilities. Resour. Energy Econ. 26, 51–75. doi: 10.1016/S0928-7655(03)00047-2
Matsumoto, S. (2016). How do household characteristics affect appliance usage? Application of conditional demand analysis to Japanese household data. Energy Policy. 94, 214–223. doi: 10.1016/j.enpol.2016.03.048
Matsumoto, S. (2022). How will a carbon tax affect household energy source combination? Energy Strategy Rev. 40:100823. doi: 10.1016/j.esr.2022.100823
Matsumoto, S., Mizobuchi, K., and Managi, S. (2021). Household energy consumption. Environ. Econ. Policy Stud. 24, 1–5. doi: 10.1007/s10018-021-00331-9
Matsumoto, S., and Onuma, H. (2020). Measuring household ability to adopt new technology: The case of light-emitting diodes (LEDs). J. Clean. Prod. 277. doi: 10.1016/j.jclepro.2020.123323
Mills, B., and Schleich, J. (2010). Why don't households see the light? Explaining the diffusion of compact fluorescent lamps. Resour. Energy Econ. 32, 363–378. doi: 10.1016/j.reseneeco.2009.10.002
Mills, B., and Schleich, J. (2012). Residential energy-efficient technology adoption, energy conservation, knowledge, and attitudes: an analysis of European countries. Energy Policy 49, 616–628. doi: 10.1016/j.enpol.2012.07.008
Ministry of the Environment of Japan (2021). Calculation Method/Emission Factor List. Availabe online at: https://ghg-santeikohyo.env.go.jp/calc (accessed: November 10, 2021).
Ministry of the Environment of Japan (2014, 2017 and 2018) Household CO2 Survey. Available online at: http://www.env.go.jp/earth/ondanka/ghg/kateiCO2tokei.html (accessed: August 16, 2021)..
Mizobuchi, K., and Takeuchi, K. (2016). Replacement or additional purchase: the impact of energy-efficient appliances on household electricity saving under public pressures. Energy Policy. 93, 137–148. doi: 10.1016/j.enpol.2016.03.001
Morita, M., Iwata, K., and Arimura, T. H. (2021). The rebound effect in air conditioner usage: an empirical analysis of Japanese individuals' behaviors. Environ. Econ. Policy Stud. 24, 99–117. doi: 10.1007/s10018-021-00316-8
Newsham, G. R., and Donnelly, C. L. (2013). A model of residential energy end-use in Canada: using conditional demand analysis to suggest policy options for community energy planners. Energy Policy 59, 133–142. doi: 10.1016/j.enpol.2013.02.030
Ozcan, K. M., Gulay, E., and Ucdogruk, S. (2013). Economic and demographic determinants of household energy use in Turkey. Energy Policy. 60, 550–557. doi: 10.1016/j.enpol.2013.05.046
Parti, M., and Parti, C. (1980). The total and appliance-specific conditional demand for electricity in the household sector. Bell J. Econ. 11, 309–321. doi: 10.2307/3003415
Ramos, A., Labandeira, X., and Löschel, A. (2016). Pro-environmental households and energy efficiency in Spain. Environ. Resour. Econ. 63, 367–393. doi: 10.1007/s10640-015-9899-8
REMODECE (2008). Residential Monitoring to Decrease Energy Use and Carbon Emissions in Europe (2008). Availabe online at: https://remodece.isr.uc.pt (accessed: December 11, 2021).
Statistical Bureau of Japan. (2020). Family Expenditure Survey. Available online: https://www.stat.go.jp/english/data/kakei/index.html (accessed: March 20, 2022).
van Rijnsoever, F. J., Rogier, A., and Donders, T. (2009). The effect of innovativeness on different levels of technology adoption. J. Am. Soc. Inf. Sci. Technol. 60, 984–996. doi: 10.1002/asi.21029
Wang, J., and Matsumoto, S. (2021). An economic model of home appliance replacement: Application to refrigerator replacement among Japanese households. Environ. Econ. Policy. Stud. 24, 29–48. doi: 10.1007/s10018-020-00295-2
World Health Organization (2021). Household Air Pollution and Health. Availabe online at: https://www.who.int/news-room/fact-sheets/detail/household-air-pollution-and-health (accessed: December 8, 2021).
Appendix: Information About Correlation Coefficients
Following Dubin and McFadden (1984), we imposed the linearity assumption and estimated the following equation:
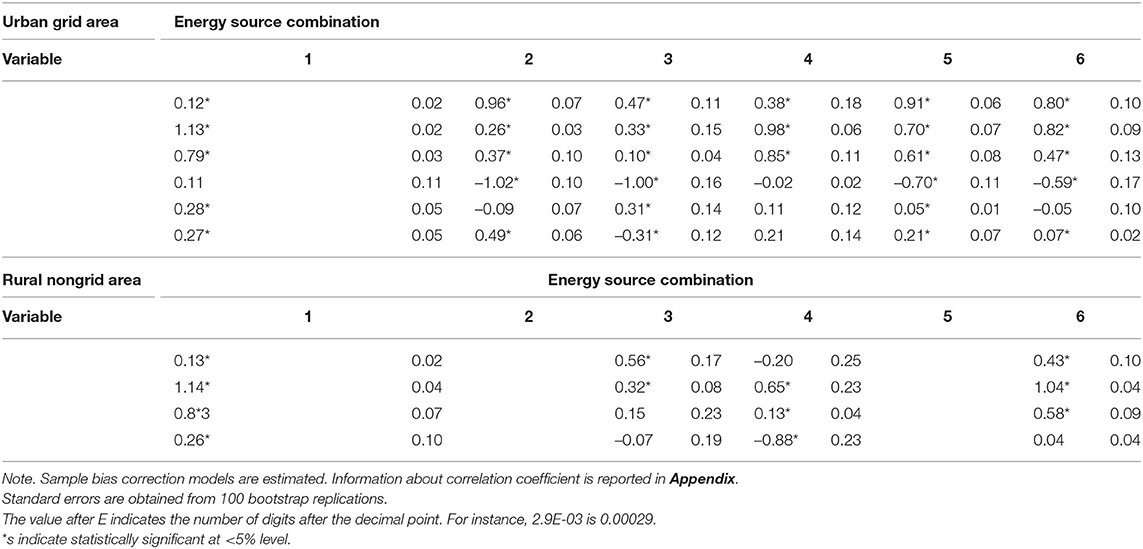
Here, rk is a correlation coefficient between uk and vk. Table A presents the correlation matrix of rs obtained through 100 bootstrap relplications.
Keywords: CO2 emissions, energy source selection, households, microdata analysis, winter
Citation: Matsumoto S (2022) How Much Difference Does Household Energy Source Selection Make in Winter CO2 Emissions? Front. Clim. 4:847851. doi: 10.3389/fclim.2022.847851
Received: 03 January 2022; Accepted: 25 March 2022;
Published: 06 May 2022.
Edited by:
Gal Hochman, Rutgers, The State University of New Jersey, United StatesReviewed by:
Sukanya Das, TERI School of Advanced Studies (TERI SAS), IndiaJeetendra Prakash Aryal, International Maize and Wheat Improvement Center, Mexico
Copyright © 2022 Matsumoto. This is an open-access article distributed under the terms of the Creative Commons Attribution License (CC BY). The use, distribution or reproduction in other forums is permitted, provided the original author(s) and the copyright owner(s) are credited and that the original publication in this journal is cited, in accordance with accepted academic practice. No use, distribution or reproduction is permitted which does not comply with these terms.
*Correspondence: Shigeru Matsumoto, c2htYXRzdW1vdG9AYW95YW1hZ2FrdWluLmpw
 Shigeru Matsumoto
