
94% of researchers rate our articles as excellent or good
Learn more about the work of our research integrity team to safeguard the quality of each article we publish.
Find out more
ORIGINAL RESEARCH article
Front. Clim., 22 February 2022
Sec. Climate Law and Policy
Volume 4 - 2022 | https://doi.org/10.3389/fclim.2022.813406
This article is part of the Research TopicCarbon Pricing and TradingView all 6 articles
 Izzet Ari1*
 Mine Isik2
Emission mitigation actions are being undertaken at the global level to combat climate change and address potential climate risks. The Green Climate Fund (GCF) is a major source of finance to catalyze the transformation toward a low emission future in developing countries. While the importance of the GCF is widely acknowledged, quantitative evaluation of its utilization is limited. Using data envelopment analysis (DEA), the aim of this study was to perform an empirical analysis of the differences in the relative efficiency of countries regarding the implementation of the GCF on emission mitigation projects. In line with the structure of green climate funding, three performance indicators were identified as input parameters, monetary leverage effect of GCF, political environment and Research and Development (R&D) spending. Data were collected for 30 countries that received GCF. Those countries were clustered as the least developed countries (LDC), small island developing states (SIDS) and other developing countries. The findings of this study indicated that Mauritius, Lao, and Congo fully utilized the funding they received and showed satisfactory performance within the LDC and SIDS countries. Vietnam, Pakistan, Nigeria and Ecuador were also found to be the efficient frontiers among other developing countries. These results presented that decision making tools and processes should be considered to increase the efficiency level of utilization of the GCF for emissions reduction in developing countries.
International climate change negotiations and progress in the implementation of multilateral climate agreements, namely the United Nations Framework Convention on Climate Change (UNFCCC) and the Paris Agreement, have been covering all perspectives of climate policies such as mitigation, adaptation, finance, and technology transfer. Among these perspectives, climate finance is highly important to reach the ultimate objective of the UNFCCC, i.e., the stabilization of greenhouse gas (GHG) concentrations at a certain level (UNFCCC, 1992). In line with this objective, the Paris Agreement aims to limit the temperature increase to 1.5°C above pre-industrial levels by directing climate finance flow toward the low GHG emissions (UNFCCC, 2015). All these mean that emission mitigation and finance issues are closely related to each other.
The recurred fact emphasizes that the stabilization of GHG concentration requires efforts by all countries on emission mitigation (Bodansky et al., 2004; den Elzen et al., 2006; UNFCCC, 2008; Parker et al., 2012). Both developed and developing countries continue to emit GHG emissions. Due to the higher population and economic growth in developing countries, their emissions share (more than 70%) has exceeded that of the developed countries (WRI, 2020). Besides, much larger emission mitigation potential remains in developing countries (Cui et al., 2020). However, there is a highly contested discussion between developed and developing countries about mitigation and climate finance issues. While developed countries require emission reductions efforts from developing countries, the latter point out to the lack of climate finance flows as a factor that hinders the limitation of their GHG emissions.
First and foremost, Annex-II countries in the UNFCCC that are developed countries have additional responsibilities such as providing financial resources to developing countries according to Article 4.3 and 4.5 of the UNFCCC (UNFCCC, 1992). To make a tangible and measurable financial flow from developed countries, an innovative climate finance architecture was designed during the post-2012 climate negotiations (Winkler, 2008). In the Copenhagen Climate Conference, it was proposed that developed countries make a commitment to jointly mobilize USD 100 billion climate finance per year by 2020 (UNFCCC, 2010). However, the Conference failed to result in an agreed outcome, namely the Copenhagen Accord, while new and additional climate financial flows, i.e., the Green Climate Fund, were introduced in the climate negotiations (UNFCCC, 2010). Nevertheless, the Conference of Parties (COP) decision of the Copenhagen Climate Conference initiated the establishment of the GCF in 2009. One year after the Conference, the Cancun Agreements established the GCF as a designated operating entity of the financial mechanism of the UNFCCC (UNFCCC, 2011). The GCF is accountable to the COP of the UNFCCC and has been established with consensus under the COP decisions (Chen, 2018). Over the following years of the Cancun Agreements, the developed countries' financial commitment for the GCF started to be monitored by the UNFCCC (Stilwell, 2011; UNFCCC, 2011, 2012, 2013; GCF, 2013).
The GCF is intended to provide financial support to the developing countries' emission mitigation efforts through the promotion of the paradigm shift toward low-emission and climate-resilient development pathways in developing countries, and particularly, the least developed countries (LDC), small island developing states (SIDS) and the most vulnerable countries. During the climate finance negotiations, sources of funding were described, as appropriate, as public and private, bilateral and multilateral, including alternative sources of finance such as development bank-type instruments, carbon market finance (UN, 2010). It is expected that the mobilization of both public and private sources will produce additional, adequate and effective sources of finance. Besides, the GCF also seeks to establish a balance between mitigation and adaptation projects and to promote sustainable development.
However, a full consensus is yet to be reached with regards to the establishment of the GCF, i.e., the expectations in terms of resource utilization of developed and developing countries are different from that of the GCF, and resource allocation might not be sufficient in the transformation toward low-carbon development (Gomez-Echeverri, 2013; Chen, 2018). Moreover, co-financing of the GCF projects as a catalyst for technological development in the early stages of the transition to low carbon development pathways cannot be mobilized due to lack of grant for the GCF. This arises from the fact that the language used in the GCF, including terms such as “mobilize,” does not guarantee additional and new financial flow from the developed countries to the developing countries (Stilwell, 2011). This concern is unfortunately confirmed with the enormous gap between the committed and available resources. For instance, countries promised to allocate resources to the GCF with the aim of mobilizing USD 100 billion per year by 2020. However, total resources including pledges and commitments remain below the targeted finance for the GCF. Therefore, their financial contributions and realization of set targets in the GCF are not sufficient to achieve the ultimate objective of the UNFCCC (Cui et al., 2020).
The Paris Agreement emphasizes the needs of climate finance for developing countries, particularly the LDC and SIDS, in Article 9. The Agreement also recognizes these countries' national climate change strategies, plans, and priorities in mitigation and adaptation actions. In addition to Article 9 of the Agreement, Article 4 creates a linkage among the ultimate objectives of multilateral climate agreements, mitigation, finance, and transition toward low carbon societies. In this regard, Article 4.6 and Article 9.9 of the Agreement provide privileges for the LDC and SIDS and encourages them to communicate their low GHG emissions development strategies. For this reason, analysis of the GCF performance of the LDC and SIDS is highly important to understand and encourage GHG emissions mitigation actions through supportive projects in these countries.
Although the GCF plays an important role in catalyzing emission mitigation and adoption actions globally, there are only a few studies on the performance assessment of the GCF in the developing countries (Gomez-Echeverri, 2013; Bodnar et al., 2018; Fonta et al., 2018; Chaudhury, 2020; Cui et al., 2020; Zamarioli et al., 2020). While a few of these studies address mobilization of domestic financial resources through the co-financing and leveraging ratio, another side of literature focuses on the effectiveness of the GCF project lines and the required country ownership capacities for the developing countries during the transformational change. Cui et al. (2020) analyzed the GCF project in terms of the lessons learned from the GEF, co-financing and leveraged ratio. They proposed four guiding principles, namely, the GEF approach, carbon reduction contribution, adaptation needs, and the combination of carbon reduction contribution and adaptation needs for effective resource allocation of the GCF to the developing countries. They concluded that emerging economies and climate mitigation projects, including those related to emissions reduction, utilized the GCF grant funds more efficiently and mobilized domestic climate funds more effectively.
Fonta et al. (2018) highlighted the institutional and procedural challenges in accessing the GCF in the developing countries, particularly in African countries. They emphasized that although African Countries have the potential to diversify their GCF project proposals from land-use to low carbon development strategies, the insufficiency in capacity building limits their access to the GCF. Similarly, Zamarioli et al. (2020) focused on the institutional arrangement between the GCF and the country-based National Designated Authorities (NDA), and the essential capacity requirement of the NDA to utilize the GCF. They also assessed the role of the GCF on countries' stakeholder engagement and their capacities for accessing the GCF. Chaudhury (2020) identified the role of intermediaries to be of a dominating nature in the GCF project cycle from the project idea to the implementation phase. Chaudhury (2020) also criticized the inconsistency between the programmed and realized GCF funding due to the lack of the required institutional capacity along with the dominance of intermediaries in the developing countries. Boodoo et al. (2018) emphasized the transformational change in the developing countries by using the GCF and Nationally Appropriate Mitigation Actions (NAMA), which were set under the Cancun Agreements for the utilization of non-Annex I countries to the UNFCCC. They also emphasized on the alignment of the climate policy with the climate finance channels. Winkler and Dubash (2016) examined the standing point of the GCF on transformational change through country ownership of low carbon development projects in the developing countries. They also eluted the role of the GCF from development aids and NAMA. When the transformational change involving the so-called low carbon development / economy or climate resilient development is concerned, climate finance is the complimentary element of the climate policy in the developing countries.
Although countries' national capabilities are success drivers of GCF projects, there is no study focusing on performance assessment of the developing countries on the GCF funding considering those capabilities. The contribution of this study is to create linkage between the respective capabilities and emissions mitigation amount per funding unit in projects in the LDC, SIDS and other developing countries.
The aim of this study is to assess the performance of GHG emissions mitigation-based GCF climate finance utilization of the developing countries. The study is confined to the GCF and mitigation projects in 30 developing countries which are eligible to access the GCF. Among these 30 countries, seven of them are LDC and three of them are SIDS.
Within the scope of this study, the question of which developing countries have better financial efficiency in mitigation projects under the GCF is answered. To assess the performance of the developing countries, the Data Envelopment Analysis (DEA) was employed as a decision-making tool to canalize the GCF funding for more efficient project locations. The LDC and SIDS countries are among the most vulnerable groups of countries. To pay special attention to this group, we divided the data set into two clusters and analyzed these clusters' performances separately. The study proceeds as follows: Section Data and Methodology introduces the materials and methods of the study. Section Results presents the results and discussion. Finally, conclusions recapitulate the main findings and policy recommendations.
Data envelopment analysis (DEA) based on linear optimization modeling was first proposed by Charnes et al. (1978). DEA has been applied to evaluate the relative performance of entities, which we refer to as decision-making units (DMU), engaged in various activities in a diversified range of contexts due to its advantages (Cooper et al., 2001). DEA is a widely preferred methodology in the literature due to some of its prominent merits over other traditional econometric frontier methods, including its ability to handle different units for input and output parameters. A great number of previous analyses have deployed the DEA across different academic fields including energy (Cong et al., 2021), logistics (Nguyen et al., 2021); healthcare (Otay et al., 2017; Darabi et al., 2021), tourism (Nurmatov et al., 2021), finance (Wasiaturrahma et al., 2020) to calculate the relative efficiency of DMUs. DEA analysis also does not require prior assumptions related to the data as in the standard regression analysis (Banker et al., 1984; Cooper et al., 2001). Moreover, no assumptions of a functional form relating to the inputs to outputs are required to build DEA models (Mustafa et al., 2020). DEA enables the modeler to calculate the efficiency scores of DMUs based on their performance on output generation or input utilization. These efficiency scores range from zero to one. The DMUs, which are efficient relative to the performances of other units in the sample set, get a score of one. DEA is a valuable benchmarking tool, due to its capability to identify the inefficiencies of the DMUs by comparing them with other DMUs that constitute efficient frontiers (Avkiran, 2001). DEA not only provides the comparative efficiency of different DMUs considering multi-input single or multi-output units, but also sets targets for inefficient DMUs and identifies slacks to provide solutions to help them increase their efficiency scores (Cook and Zhu, 2006).
While utilizing DEA, the purpose should be first determined as either optimizing the input or the output. If the purpose is to identify the factors over resource utilization, input-based DEA should be preferred. Whereas, output oriented model aims to maximize the outputs while input kept at constant level. In this study, our output is the level of CO2 mitigation. Since the objective is to increase the amount of CO2 mitigated, output oriented DEA is used.
Constant returns-to-scale (CRS) and variable returns-to-scale (VRS) surfaces are the two basic types of DEA in the literature. CRS assumes that if an activity (x, y) is feasible, then for every positive scalar k, (kx, ky) is also expected to be feasible, whereas this assumption cannot be made for VRS models. VRS efficiency was proposed by Banker–Charnes–Cooper (BCC) (Banker et al., 1984). Hence, these types of models are also referred to as DEA-BCC. In this model, due to the nature of the study, we assume that the impact of inputs on the output is a variable return to scale, so we applied a BCC DEA model with an output-oriented structure.
In the data envelopment analysis model, we assume there are n many DMUs (j = 1, 2, . . ., n), each using a different amount of m different inputs (i = 1, 2, . . ., m) to produce s varying amount of outputs r (r = 1, 2, . . ., s). DMUj consumes amount xijof input i and produces amount yrjof output r where ur is the weight for output r (r = 1, 2, . . ., s) and vi is the weight assigned to input i (i = 1, 2, . . ., m). Related mathematical formulation for output-oriented BCC can be stated as in Equation (1), whereas, dual of the DEA-BCC with output orientation is given in Equation (2). (For detailed discussion of model formulations, we refer to Luptácik (2010).
Subject to
Subject to
A variety of research studies have been published in which DEA was used to measure environmental efficiency at different levels including, sector (Lansink and Silva, 2003; Han et al., 2018), country, region level (Huan et al., 2013) and international level (Ouyang and Yang, 2020). Among those studies, some researchers only focused on the utilization of energy consumption without considering the CO2 emissions in the analysis (Honma and Hu, 2008; Makridou et al., 2015).
They rather preferred focusing on energy efficiency performance and then analyzing the link between energy and emissions, as in the study of Wang et al. (2014), who conducted Bootstrap DEA analysis for BRICS countries. Regarding international studies, Iftikhar et al. (2018) built a network-based DEA for 19 major economies, and found economic inefficiency to be the major source of CO2 emissions. For regional implications, Huan et al. (2013) applied the DEA model to measure the CO2 emissions and energy consumption efficiency for each region located in China. The application of the DEA is not limited to CO2 emissions. Some of the DEA studies that focus on environmental performance include other air emissions as undesirable outputs along with CO2 emissions. Moutinho et al. (2020) focused on the local air pollution performance of cities in Germany by utilizing DEA combined with stochastic frontier analysis for PM10 and NO2.
In order to ensure the reliability of efficiency scores in BCC models, it is essential to have a sufficient number of DMUs in the analysis. According to Golany and Roll (1989) and Dyson et al. (2001), the total number of units should be greater than twice the sum of the number of inputs and outputs. In this study, the DEA model we constructed had three inputs and one output. We examined 35 different Green Climate Fund projects on “mitigation” to ensure validity. We preferred establishing a single score for each country. Hence, project expenses and mitigation levels were aggregated for countries with more than one project that received GCF. After aggregations, we included 30 countries that received GCF, and we analyzed the data by using the “benchmarking” package of R studio 1.3.1093.
In this paper, each country represents a single DMU. The application of the DEA requires a set of inputs and outputs to define the efficiency scores. Indicators selected for each country are unit mitigation level per dollar received as green climate fund (UMT), the share of the green climate fund within the total project budget (RGT), the percentage share of Research and Development in the country's GDP (RND), and the political environment level of a country (POE) (Table 1).
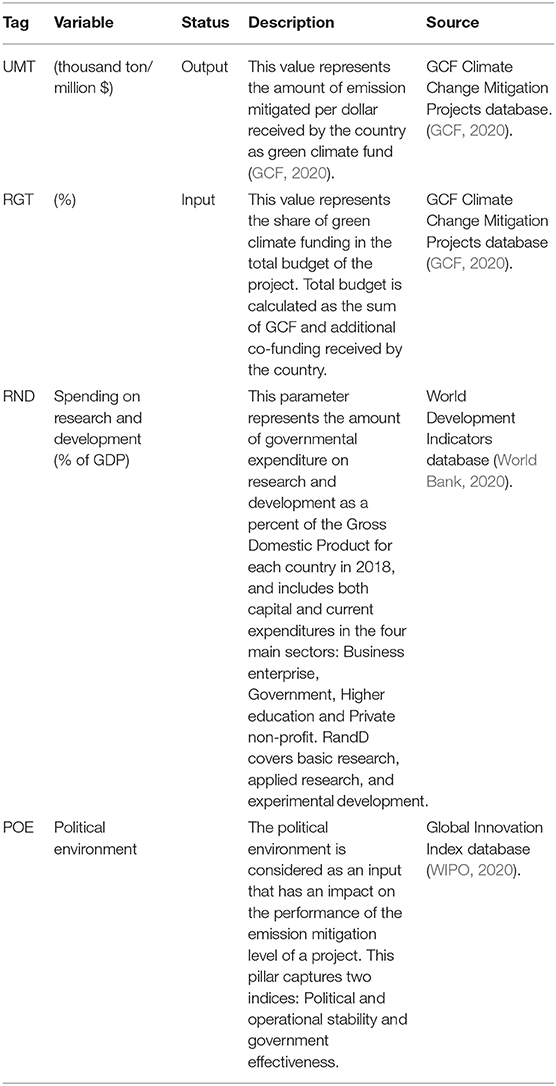
Table 1. Model variables for efficiency analysis.
The reduction of GHG emissions is one of the essential efforts to combat climate change. Mitigation of emissions with mobilized financial resources including domestic, bilateral and multilateral sources is also subject to efficiency and performance concerns. This concern gains more predominance when the financial flow in question is provided under multilaterally established and agreed resources. Therefore, UMT, as the selected output of this performance assessment tool, represents the ratio of emissions mitigated per dollar of grant funding received under GCF in a developing country. The model's inputs are selected according to enabling factors for achieving higher and better UMT values and constraints of the GCF funding mechanism. Thus, countries that are not eligible to receive resources for the GCF and not listed in the GCF project were not included in this analysis. In this context, RGT is the input showing the ratio of the grant received from the GCF to the total project budget. Because the amount of available financial resources under the GCF is far below the commitment of countries and the essential level of allocation for each well-designed project proposal, accessing and receiving GCF grant is highly competitive for developing countries. Under these conditions, minimum RGT input to obtain maximum UMT is the main objective of this performance assessment. Moreover, the GCF project is expected to be in line with the national circumstances of countries, including country-driven strategies, vulnerability to the impacts of climate change, and respective capability. Measuring the capability of countries is a highly challenging issue at the overall level. For a subject-specific issue such as the ability to use financial resources for emission mitigation actions, readiness at technological level and a scientific infrastructure is required. As an input, the ratio of Research and Development expenses and expenditure of public and private institutions in the GDP represents the other factor in maximizing the UMT level. The last input, political environment, is a part of institutional capability and the ability to better manage GCF funded projects. Accountability, transparency, and capability to measure, report, and verify GCF project realization are enabling factors in successfully achieving project objectives. Therefore, political environment is an overarching institutional capability factor in terms of the implementation of GCF projects in a developing country. Naturally, the level of political environment is a longitudinal issue improving in a country over time. Reinforcing the sense of urgency for climate change, particularly emissions mitigation and eligibility for accessing the GCF, especially in the developing countries, is considered to encompass the political environment as an enabling environment factor. Table 1 lists units, sources of these variables, and their brief description.
According to the GCF project lists for mitigation purposes, currently, there are only 30 countries using the GCF. Table 2 presents the used input and output variables in this study. Among these data, there are some obtrusive factual elements. For instance, Afghanistan, Congo, El Salvador, Lao, South Africa, Tonga and Zambia allocate a very low level of R&D expenditures and expenses in their GDP. Also, worth noting is that Brazil, Chile and Colombia have received grants as total project budgets. The last finding is about the output, UMT. It ranges from 1,387.08 to 10.06 thousand tons of emissions per million USD.

Table 2. Data for selected countries.
Thirty countries in this analysis are divided into two clusters. Countries in the first Cluster Are the Least Developed Countries (LDC) and Small Island Developing States (SIDS). The Remaining Countries Are in the second Cluster, Which Covers all the Remaining Countries That Received GCF. Figure 1 Shows the BCC Output-Oriented Efficiency Values of Cluster-1. Mauritius, Lao, and Congo Have the Highest Efficiency Level, Which Indicates That They Achieved the Highest Amount of Mitigation per $ Received as GCF Under Their National Circumstances.
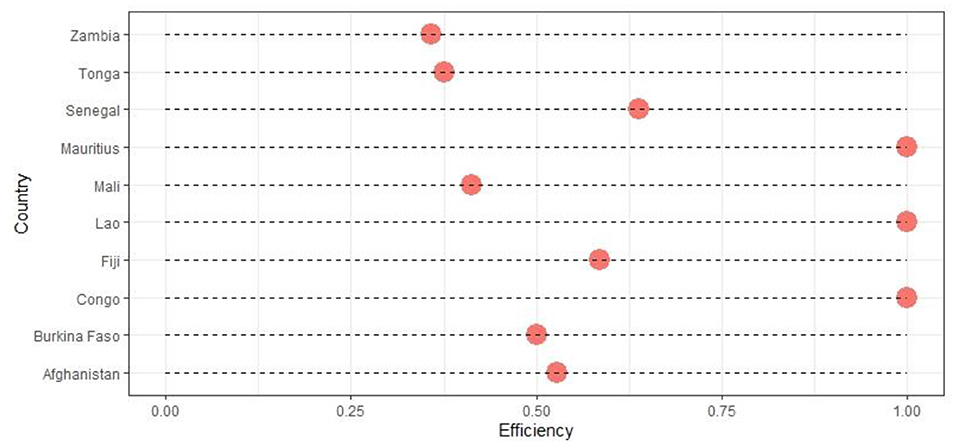
Figure 1. DEA-BCC efficiency scores for Cluster 1-countries (The each red dot represents the efficiency score of the respective country. On a scale 0–1.0, higher score refers to better emission mitigaton performance).
While looking at the countries that constitute the efficient frontier, we see that Mauritius and Lao also have the highest UMT level. The emission mitigation project in Congo does not provide the highest utilization of GCF compared to other countries. It results in 26.66 thousand tons of CO2 emission mitigation per million dollars received. However, according to DEA results, Congo reaches its highest potential in terms of emission mitigation considering its low political stability and the level of spending for R&D.
Table 3 provides the results of the DEA-BCC model. Efficiency scores represent the relative performance of the countries according to their peers. Having an efficiency score that equals to 1.00 indicates zero slack value. Countries that have an efficiency score of 1.00 constitute the efficient frontier. Those countries are used as peers to evaluate the performance of the remaining countries that have an efficiency score of ≤1.00. Each lambda value stands for an efficient country. As given in Table 3; Congo (3), Lao (4) and Mauritius (6) are used to calculate the desired output of other countries in the first cluster and they constitute the ‘facet reference set’. These countries are efficient units, and they bear great opportunities to reduce their emission values in the future.
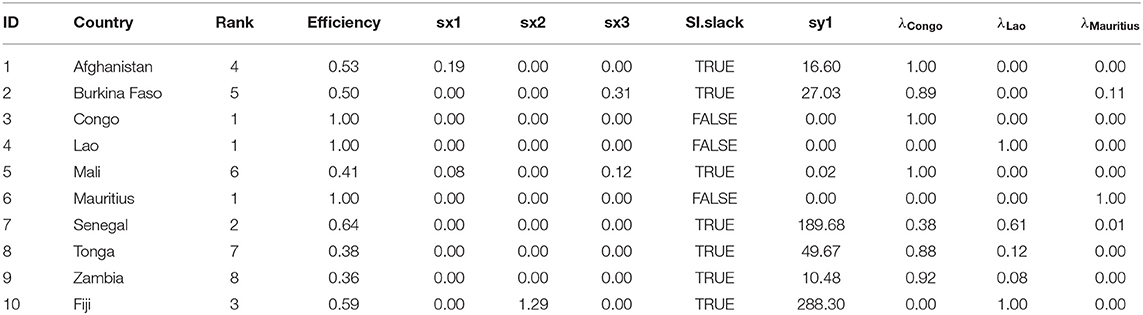
Table 3. Results of the BCC model for Cluster 1 (SIDS and LDC).
Column “sy1” represents the required level of increase in the UMT value to reach the maximum possible amount of output that may be achieved by the given set of inputs for each country, considering the other countries' performances.
For example, Afghanistan has 0.53 efficiency, and to increase its efficiency up to 1.0 as Congo, Afghanistan needs to increase its UMT by 16.6 thousand tons/million $ and Congo is the peer country. Although Afghanistan is better than Congo in terms of RGT and POE values, emissions mitigation performance per granted USD is less than Congo. It is not rational to expect Afghanistan to reduce RGT or POE values. However, these numbers provide an idea about which project locations or countries are more effective in implementing emissions reduction. For Congo and Afghanistan comparison, the GCF project in Congo is more efficient than Afghanistan.
Regarding Senegal, the peer set covers Congo, Lao and Mauritius. The required increase in the UMT value for Senegal equals to 189.68, which can be derived from the following equation.
In order for Senegal to be efficient, it should increase its UMT value by 189.68 and reach 201.49 thousand-tons CO2/million $ emission mitigation level.
Figure 2 shows the efficiency of Cluster-2 countries. There are four countries, namely, Vietnam, Pakistan, Nigeria and Ecuador having the highest efficiency scores. Furthermore, the GCF projects in El Salvador, Egypt and Côte d'Ivoire have very high efficiency.
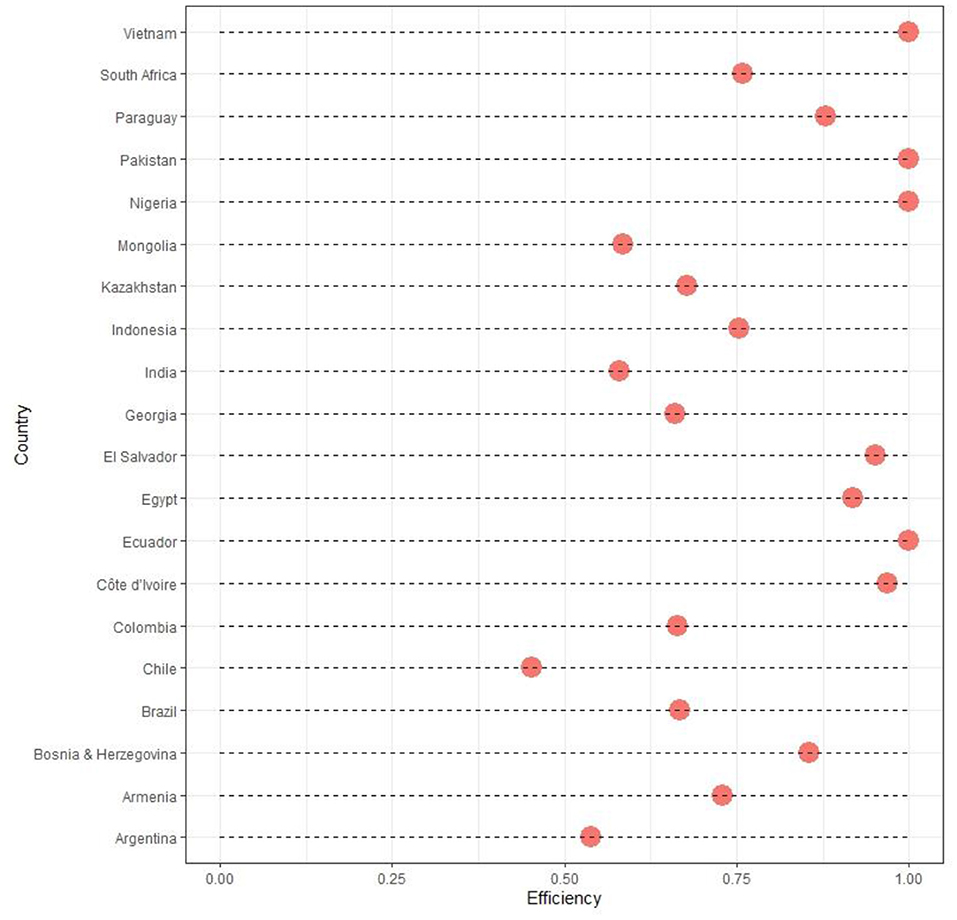
Figure 2. DEA-BCC efficiency scores for Cluster 2-countries (The each red dot represents the efficiency score of the respective country. On a scale 0–1.0, higher score refers to better emission mitigaton performance).
Similar to Cluster-1 countries, Cluster-2 countries have various efficiency scores. The average efficiency score is 0.782, which is higher than Cluster-1's average efficiency score (0.641). Efficiency values for Cluster-2 vary between 0.45 and 1.00. We observe that Chile, Mongolia, India and Argentina should have higher UMT values than they achieved. Hence, other countries appear to have shown a better performance in emission mitigation considering their national capabilities.
As mentioned earlier, sy1 represents the amount of increase required in the UMT level for each country to reach the efficient frontier. We observe that while considering the input parameters, Argentina, El-Salvador, India, Mongolia, and South Africa should have increased their mitigation value by 6.79, 154.71, 43.93, and 148.34, respectively. For each inefficient country, combination of peer countries' outputs is given as their respective λ score. Countries that have a zero slack for output value, have lower efficiency scores due to their excessive values in input parameters.
Taking one of the least efficient countries, Argentina, the higher amount of emission should be cut down considering its national capability. Nigeria is found to be the benchmark country. When Argentina is compared with Nigeria, there are two shortcomings. First, when RGT and RND ratios of Argentina are reduced by 12 and 29% respectively without changing the UMT, Argentina can achieve the same efficiency level as Nigeria. Second, considering these same inputs, as presented in Table 4, Argentina needs 6.79 thousand tons/ million $ increase in its UMT level to achieve the same efficiency level as Nigeria.
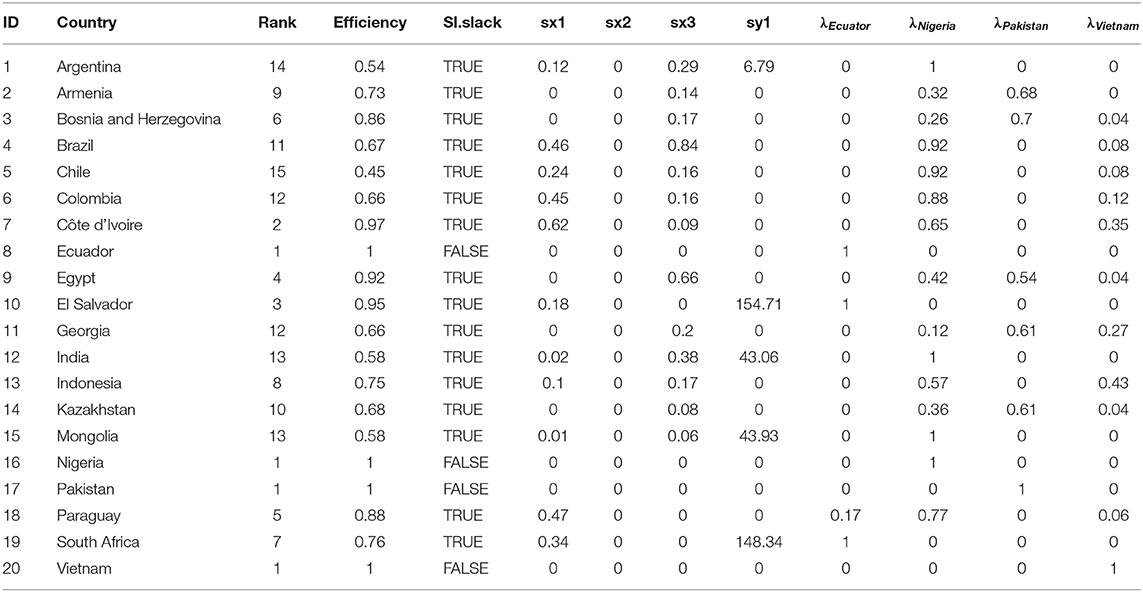
Table 4. Results of the BCC model for Cluster 2 (other developing countries).
In climate finance mobilization and utilization, two sides of the coin represents the positions and responsibilities of developed and developing countries. Developed countries and Annex-I parties of the UNFCCC are not eligible to benefit from the GCF. Therefore, the countries' commitments since the Copenhagen Climate Conference for the GCF entail additional and new financial resources for developing countries. Whereas, developing countries, including the LDC and SIDS, are the most vulnerable to climate change impacts, so their ability to access climate finance is essential for increasing their resilience. According to GCF (2020) reports, there are 143 projects, including adaptation, mitigation, and cross-cutting issues in the GCF. One hundred and six developing countries are benefiting from the GCF. The total amount of granted GCF is more than 6.2 billion USD and 40% of this allocation goes to mitigation projects. The total budget for all of these projects is 21.2 billion USD, and co-financing is 14.9 billion USD. With these numbers and needs of developing countries' for combatting climate change, there should be a balance between adaptation and mitigation project types. Moreover, the LDC and SIDS are the most vulnerable countries and country groups with privileges to access the GCF and its facilities. Particularly in the developing countries, the LDC and SIDS, emissions mitigation can be directly related to access to financing. However, less sufficient financial resources under the GCF and the small national capabilities of the developing countries are limiting factors that hinder these countries from effectively mitigating their GHG emissions. Hence, in line with the objective and scope of the GCF that are already fully coherent with the UNFCCC and the Paris Agreement, additional and new climate finance and grant funding are needed to reduce GHG emissions. Herewith the contested issue between sufficient financial resources and actions for mitigation in developing countries can be partially terminated by increasing availability and efficiency of the GCF.
The GCF also has enabling factors to transform developing countries toward low-carbon and climate resilient development. Particularly, low carbon development or low emissions development strategies focus on GHG emissions mitigation in developing countries. This transformative process with the GCF's financial support highly depends on the availability of financial resources and the effectiveness of the approved and implemented GCF projects. The former is related to the level of commitments of the developed countries and their donations. However, the latter is related to the management of the GCF resources, selection of submitted project proposals and the decision on the amount of the GCF grant to be allocated to a project. In a resource constraint environment, the efficiency of the implemented GCF projects gains further importance. Although several studies focus on the emerging economies' absorption capacity and mobilization of domestic financial resources through the GCF projects, there is no comprehensive and common understanding of what the GCF is for and how the efficiency of GCF funding is assessed. Even though the principle of the UNFCCC, namely, common but differentiated responsibilities and respective capabilities, provide a room for buying-in developing counties, these countries are not close to achieve low carbon development.
Mitigation of GHG emissions to combat global climate change is one of the most important and necessary measures. This study analyses how efficiently countries can use the grant portion of the GCF for mitigation actions under their national circumstances and provide information for decision makers by pointing out the best-performing countries. Accordingly, a performance evaluation is carried out using capability indicators that may apply to each country. Capability indicators are selected in such a way that each country examined in the study could be dealt with on a common ground. The approach of the study is to obtain the highest output or maximize output with the current input level.
We include all countries that received GCF in the study. These 30 countries are divided into two main clusters. The first cluster comprises countries listed as the LDC and SIDS, and the second cluster comprises other developing countries. Congo, Lao and Mauritius (Cluster-1) and Ecuador, Nigeria, Pakistan and Vietnam (Cluster-2) are the most efficient countries in terms of the utilization of GCF funding. Despite their limited financing opportunities and national capabilities, these countries have the highest emission reduction per unit of GCF funding. The DMUs with high efficiency scores should be protected and financed to reach an even higher rate of return on the GCF received. Within the LDC and SIDS countries, Congo, Lao and Mauritius showed satisfactory emission mitigation results considering their national circumstances. Regarding other developing countries, Ecuador, Nigeria, Pakistan and Vietnam achieved their maximum mitigation capacity with their low political stability and insufficient R&D expenditures.
With this study, conclusions have emerged in the field of policy development and implications. First and foremost, the decision-making processes needs to be considered as a whole. It has been seen that unit emission reduction per granted finance or national development level should not be the benchmark solely. It is also observed that increasing national capacities could reduce emissions more by using the same amount of funding. This concludes that countries with relatively low levels of efficiency compared to other countries can further reduce their emissions, thus, their expected GHG emissions mitigation potential should be revisited.
Future works can be related to the use of funding in areas of adaptation and capacity building actions for climate change. Furthermore, studies can be conducted on the efficiency of bilateral cooperation, in-kind contributions and the mobilization of other financial resources. Performance evaluation of sector-specific and field-specific studies can also be done in future studies.
Publicly available datasets were analyzed in this study. This data can be found here: https://www.greenclimate.fund/projects; https://databank.worldbank.org/source/world-development-indicators; https://www.wipo.int/global_innovation_index/en/.
IA: conceptualization, investigation, resources, and writing–original draft. MI: methodology, software, data curation, and writing–original draft. Both authors contributed to the article and approved the submitted version.
I requested a waiver for the APC and support for this manuscript.
The authors declare that the research was conducted in the absence of any commercial or financial relationships that could be construed as a potential conflict of interest.
All claims expressed in this article are solely those of the authors and do not necessarily represent those of their affiliated organizations, or those of the publisher, the editors and the reviewers. Any product that may be evaluated in this article, or claim that may be made by its manufacturer, is not guaranteed or endorsed by the publisher.
Avkiran, N. K. (2001). Investigating technical and scale efficiencies of Australian universities through data envelopment analysis. Socioecon. Plann. Sci. 35, 57–80. doi: 10.1016/S0038-0121(00)00010-0
Banker, R. D., Charnes, A., and Cooper, W. W. (1984). Some models for estimating technical and scale inefficiencies in data envelopment analysis. Manage. Sci. 30, 1078–1092. doi: 10.1287/mnsc.30.9.1078
Bodansky, D., Chou, S., and Jorge-tresolini, C. (2004). International Climate Efforrts Beyond 2012: A Survey of Approaches. Arlington, VA: Pew Center on Global Climate Change.
Bodnar, P., Ott, C., Edwards, R., Hoch, S., McGlynn, E. F., and Wagner, G. (2018). Underwriting 1.5°C: competitive approaches to financing accelerated climate change mitigation. Climate Policy 18, 368–382. doi: 10.1080/14693062.2017.1389687
Boodoo, Z., Mersmann, F., and Olsen, K. H. (2018). The implications of how climate funds conceptualize transformational change in developing countries. Climate Dev. 10, 673–686. doi: 10.1080/17565529.2018.1442788
Charnes, A., Cooper, W. W., and Rhodes, E. (1978). Measuring the efficiency of decision making units. Eur. J. Oper. Res. 2, 429–444. doi: 10.1016/0377-2217(78)90138-8
Chaudhury, A. (2020). Role of intermediaries in shaping climate finance in developing countries-lessons from the green climate fund. Sustainability 12, 5507. doi: 10.3390/su12145507
Chen, L. (2018). The challenges and opportunities for the green climate fund. Chin. J. Urban Environ. Stud. 06, 1875001. doi: 10.1142/S2345748118750015
Cong, D., Liang, L., Jing, S., Han, Y., Geng, Z., and Chu, C. (2021). Energy supply efficiency evaluation of integrated energy systems using novel SBM-DEA integrating Monte Carlo. Energy 231, 120834. doi: 10.1016/j.energy.2021.120834
Cook, W. D., and Zhu, J. (2006). Modeling Performance Measurement: Applications and Implementation Issues in DEA. Berlin; Heidelberg: Springer Science and Business Media.
Cooper, W. W., Seiford, L. M., and Tone, K. (2001). Data envelopment analysis: a comprehensive text with models, applications, references and DEA-solver software. J. Operat. Res. Soc. 52, 1408–1409. doi: 10.1057/palgrave.jors.2601257
Cui, L., Sun, Y., Song, M., and Zhu, L. (2020). Co-financing in the green climate fund: lessons from the global environment facility. Climate Policy. 20, 95–108. doi: 10.1080/14693062.2019.1690968
Darabi, N., Ebrahimvandi, A., Hosseinichimeh, N., and Triantis, K. (2021). A DEA evaluation of U.S. States' healthcare systems in terms of their birth outcomes. Expert Syst. Appl. 182, 115278. doi: 10.1016/j.eswa.2021.115278
den Elzen, M. G. J., Berk, M., Lucas, P., Criqui, P., and Kitous, A. (2006). Multi-stage: a rule-based evolution of future commitments under the climate change convention. Int. Environ. Agreements 6, 1–28. doi: 10.1007/s10784-004-5645-3
Dyson, R. G., Allen, R., Camanho, A. S., Podinovski, V. V., Sarrico, C. S., and Shale, E. A. (2001). Pitfalls and protocols in DEA. Eur. J. Oper. Res. 132, 245–259. doi: 10.1016/S0377-2217(00)00149-1
Fonta, W. M., Ayuk, E. T., and van Huysen, T. (2018). Africa and the Green Climate Fund: current challenges and future opportunities. Climate Policy 8, 1210–1225. doi: 10.1080/14693062.2018.1459447
GCF (2013). Green Climate Fund. Available online at: www.gcfund.net.
GCF. (2020). GCF At a Glance Project Portfolio as of 15 October 2020. Available online at: https://www.greenclimate.fund/document/gcf-glance (accessed October 15, 2020).
Golany, B., and Roll, Y. (1989). An application procedure for DEA. Omega 17, 237–250. doi: 10.1016/0305-0483(89)90029-7
Gomez-Echeverri, L. (2013). The changing geopolitics of climate change finance. Climate Policy 13, 632–648. doi: 10.1080/14693062.2013.822690
Han, Y., Long, C., Geng, Z., and Zhang, K. (2018). Carbon emission analysis and evaluation of industrial departments in China: an improved environmental DEA cross model based on information entropy. J. Environ. Manage. 205, 298–307. doi: 10.1016/j.jenvman.2017.09.062
Honma, S., and Hu, J. L. (2008). Total-factor energy efficiency of regions in Japan. Energy Policy 36, 821–833. doi: 10.1016/j.enpol.2007.10.026
Huan, J., Ren, J., and Xu, M. (2013). Study on performance evaluation of CO2 emission reduction in China based on three-stage DEA. J. Res. Sci 35, 1447–1454. doi: 10.1080/13467581.2020.1869019
Iftikhar, Y., Wang, Z., Zhang, B., and Wang, B. (2018). Energy and CO2 emissions efficiency of major economies: a network DEA approach. Energy 147, 197–207. doi: 10.1016/j.energy.2018.01.012
Lansink, A. O., and Silva, E. (2003). CO2 and energy efficiency of different heating technologies in the Dutch glasshouse industry. Environ. Resour. Econ. 24, 395–407. doi: 10.1023/A:1023684316366
Luptácik, M. (2010). Mathematical Optimization and Economic Analysis. New York, NY: Springer New York (Springer Optimization and Its Applications).
Makridou, G., Andriosopoulos, K., Doumpos, M., and Zopounidis, C. (2015). A two-stage approach for energy efficiency analysis in european union countries. Energy J. 36, 47–69. doi: 10.5547/01956574.36.2.3
Moutinho, V., Madaleno, M., and Macedo, P. (2020). The effect of urban air pollutants in Germany: eco-efficiency analysis through fractional regression models applied after DEA and SFA efficiency predictions. Sustain. Cities Soc. 59, 102204. doi: 10.1016/j.scs.2020.102204
Mustafa, F. S., Khan, R. U., and Mustafa, T. (2020). Technical efficiency comparison of container ports in Asian and Middle East region using DEA. Asian J. Shipping Logist. 37, 12–19. doi: 10.1016/j.ajsl.2020.04.004
Nguyen, T. L. H., Park, S. H., Kim, Y., and Yeo, G. T. (2021). An efficiency analysis of container terminals in Southern Vietnam using DEA dynamic efficiency evaluation. Asian J. Shipping Logist. 37, 329–336. doi: 10.1016/j.ajsl.2021.09.003
Nurmatov, R., Fernandez Lopez, X. L., and Coto Millan, P. P. (2021). Tourism, hospitality, and DEA: where do we come from and where do we go?. Int. J. Hosp. Manage. 95, 102883. doi: 10.1016/j.ijhm.2021.102883
Otay, I., Oztaysi, B., Onar, S. C., and Kahraman, C. (2017). Multi-expert performance evaluation of healthcare institutions using an integrated intuitionistic fuzzy AHPandDEA methodology. Knowl. Based Syst. 133, 90–106. doi: 10.1016/j.knosys.2017.06.028
Ouyang, W., and Yang, J. (2020). The network energy and environment efficiency analysis of 27 OECD countries: A multiplicative network DEA model. Energy. 197:117161. doi: 10.1016/j.energy.2020.117161
Parker, C. F., Karlsson, C., Hjerpe, M., and Linnér, B. O. (2012). Fragmented climate change leadership: making sense of the ambiguous outcome of COP-15. Environ. Polit. 21, 268–286. doi: 10.1080/09644016.2012.651903
UN (2010). Report of the Secretary-General's High-level Advisory Group on Climate Change. New York, NY: Financing.
UNFCCC (1992). UNFCCC. Available online at: http://unfccc.int/files/essential_background/background_publications_htmlpdf/application/pdf/conveng.pdf (accessed May 19, 2018).
UNFCCC (2015). Adoption of the Paris Agreement. Available online at: http://unfccc.int/resource/docs/2015/cop21/eng/l09r01.pdf (accessed December 14, 2015).
Wang, W., Liu, X., Zhang, M., and Song, X. (2014). Using a new generalized LMDI (logarithmic mean Divisia index) method to analyze China's energy consumption. Energy 67, 617–622. doi: 10.1016/j.energy.2013.12.064
Wasiaturrahma, Sukmana, R., Ajija, S. R., Salama, S. C. U., and Hudaifah, A. (2020). Financial performance of rural banks in Indonesia: a two-stage DEA approach. Heliyon 6, e04390. doi: 10.1016/j.heliyon.2020.e04390
Winkler, H. (2008). Measurable, reportable and verifiable: the keys to mitigation in the Copenhagen deal. Climate Policy 8, 534–547. doi: 10.3763/cpol.2008.0583
Winkler, H., and Dubash, N. K. (2016). Who determines transformational change in development and climate finance?. Climate Policy 16, 783–791. doi: 10.1080/14693062.2015.1033674
WIPO. (2020). Global Innovation Index (GII). Available online at: https://www.wipo.int/global_innovation_index/en/ (accessed October 20, 2020).
World Bank. (2020). World Development Indicators. Available online at: https://databank.worldbank.org/source/world-development-indicators (accessed October 20, 2020).
WRI (2020). World Greenhouse Gas Emissions: 2016 | World Resources Institute. Available online at: https://www.wri.org/resources/data-visualizations/world-greenhouse-gas-emissions-2016 (accessed September 14, 2020).
Keywords: DEA, developing countries, emissions mitigation, GCF, green finance
Citation: Ari I and Isik M (2022) Assessing the Performance of the Developing Countries for the Utilization of the Green Climate Fund. Front. Clim. 4:813406. doi: 10.3389/fclim.2022.813406
Received: 11 November 2021; Accepted: 27 January 2022;
Published: 22 February 2022.
Edited by:
Ramazan Sari, Technical University of Denmark, DenmarkReviewed by:
Alessandro Antimiani, European Commission Headquarters, BelgiumCopyright © 2022 Ari and Isik. This is an open-access article distributed under the terms of the Creative Commons Attribution License (CC BY). The use, distribution or reproduction in other forums is permitted, provided the original author(s) and the copyright owner(s) are credited and that the original publication in this journal is cited, in accordance with accepted academic practice. No use, distribution or reproduction is permitted which does not comply with these terms.
*Correspondence: Izzet Ari, aXp6ZXQuYXJpQGFzYnUuZWR1LnRy
Disclaimer: All claims expressed in this article are solely those of the authors and do not necessarily represent those of their affiliated organizations, or those of the publisher, the editors and the reviewers. Any product that may be evaluated in this article or claim that may be made by its manufacturer is not guaranteed or endorsed by the publisher.
Research integrity at Frontiers
Learn more about the work of our research integrity team to safeguard the quality of each article we publish.