 Vasubandhu Misra
 C. B. Jayasankar2,3
 Amit Bhardwaj
- 1Department of Earth, Ocean and Atmospheric Science, Florida State University, Tallahassee, FL, United States
- 2Center for Ocean-Atmospheric Prediction Studies, Florida State University, Tallahassee, FL, United States
- 3Florida Climate Institute, Florida State University, Tallahassee, FL, United States
- 4India Meteorological Department, Ministry of Earth Sciences, New Delhi, India
Florida has a distinct wet season, which serves the annual water needs of the State and beyond. Our earlier studies have indicated that in addition to the seasonal rainfall anomalies, the variations of the length of the season also contribute significantly to variability of the wet season over Florida. Furthermore, the variations of the onset date of the rainy season relate significantly to the seasonal anomalies of length of the season and rainfall. In this study, we have used the National Aeronautics and Space Administration's (NASA's) Integrated Multi-Satellite Retrievals for Global Precipitation Mission version 6 (IMERG) rainfall dataset to monitor the rainy season over the five Water Management Districts (WMDs) of Florida for 2021. This effort was complimented by analyzing and verifying the variations of the rainy season over the preceding 20 wet seasons from the IMERG datasets. IMERG produces rainfall datasets at various latencies, with the final product having a 3.5-month latency since the satellite measurements of radiance are made. However, in this study, we find that an intermediate 12-h latency product of rainfall analysis from IMERG is reasonable to use for near real-time monitoring of the wet season over Florida. The operational monitoring of the 2021 wet season using the 12-h latency dataset from IMERG was also supplemented with the extended weather 6- to 10-day and 8- to 14-day forecasts of precipitation probability issued by the NOAA's Climate Prediction Center. Our study suggests that the current methodology of monitoring the onset date variations of the rainy season provides a viable alternative to assess and anticipate the seasonal variations amidst the moderate to insignificant weather and climate prediction skill of the numerical forecast models of the wet season of Florida.
Introduction
Florida is a unique geographical region of continental US with its peninsular structure and its placement in the tropical latitudes. The shape and the width of Peninsular Florida (PF) offer convergence of sea breeze thunderstorms that develop initially along its Atlantic and Gulf coasts (Xian and Pielke, 1991). Misra et al. (2018a) identified a distinct rainy season over PF that overlaps to some extent with the boreal summer season. Misra et al. (2018a) showed that the evolution of the rainy season over PF coincides with the warming of the Gulf of Mexico and the weakening of the trade winds in the tropical Atlantic. Therefore, it is suggested that the rainy season over PF is a coupled ocean–atmosphere phenomenon, which evolves slowly and deliberately both in the oceanic and atmospheric components of the climate system.
A unique aspect of the definition of the rainy season as introduced in Misra et al. (2018a) is that the length of the season varies from year to year. Unlike traditionally fixing the length of the season to calendar dates, the meteorological definition of the rainy season in Misra et al. (2018a) allows for the onset date and the demise date of the season to vary. Therefore, in addition to variable rain rates, the length of the season variations also contributes to the seasonal anomalies of the rainy season over PF. Several studies have related the variability of the variations of the rainy season over PF across temporal scales to other climatic variations like El Niño and the Southern Oscillation (ENSO), Atlantic warm pool variations, and variations in the Loop Current (e.g., Misra and DiNapoli, 2012; Misra and Mishra, 2016; Misra et al., 2017a,b; Misra and Bhardwaj, 2020).
The onset of the rainy season over PF is rather dramatic (Misra et al., 2018a). Over a period of one day, the average daily rain rates across PF jump from approximately less than 3 mm/day to over 7 mm/day, which Misra et al. (2018a) mark as the onset date of the rainy season over PF. Likewise, the demise of the rainy season over PF also shows a significant drop in daily rain rate from over 10 mm/day to <5 mm/day.
There is, however, significant spatial heterogeneity of the rainy season over PF (Misra and Bhardwaj, 2020). For example, climatologically, the length of the rainy season is shorter in central Florida by 1 week compared to that in south Florida. Similarly, the length of the season between Tampa and Jacksonville (north Florida) is shorter by almost 3 weeks compared to that over south Florida (Misra and Bhardwaj, 2020). Similarly, Misra et al. (2018b) find that the urban and rural areas display shorter and longer rainy seasons over PF, respectively. However, the seasonal rainfall accumulation over the rainy season does not differ between urban and rural areas over PF, leading Misra et al. (2018b) to conclude that the average daily rain rate in the rainy season over the urban areas is higher than over the rural areas.
The robust seasonal cycle of the rainy season of PF and its year-to-year variations leads us to investigate the ability to monitor the evolution of the rainy season with some of the available rainfall analysis products. One of the obvious motivations is to assess and quantify the variations of the rainy season. However, an additional motivation is that several studies have shown that the onset date variations of the rainy season over PF has a bearing on the forthcoming evolution of the season (Misra et al., 2017b, 2018a). For example, an early or a delayed onset of the rainy season is likely to lead to a wetter or a drier season, respectively. Therefore, monitoring the onset of the rainy season over PF could also serve in providing an outlook for the season.
The El Niño and the Southern Oscillation has a strong influence on Florida's winter seasonal precipitation (ENSO; Ropelewski and Halpert, 1986) but has a minimal impact on the summer season rainfall (Misra and DiNapoli, 2012). Misra and DiNapoli (2012) found that ENSO affects the variability of the onset of the wet season of Florida. However, this teleconnection displays decadal variations with the Pacific Decadal Oscillation. In fact, the Atlantic Multi-decadal Oscillation (AMO) has a far larger impact on Florida's summer rainfall (Enfield et al., 2001) and far less impact on the winter precipitation (Moses et al., 2013), albeit at decadal time scales. The analysis of precipitation extremes in Florida reveals that South and Central Florida have more frequent episodes of extreme events during the warm phases than the cold phases of AMO (Enfield et al., 2001; Curtis, 2008; Teegavarapu, 2012). At interannual scales, Misra and DiNapoli (2012) find that the Atlantic Warm Pool (AWP) variations have a profound impact on the variations of the onset, demise, and therefore the length of the wet season over Florida. They find that in large or small AWP years, the associated weakening or the strengthening of the Bermuda High leads to lengthening or shortening of the wet season over Florida, respectively.
The objective of this work is to first assess the fidelity of two remotely sensed rainfall analysis products in monitoring the evolution of the rainy season over Florida, which is followed by real-time monitoring of the 2021 rainy season. These remotely sensed rainfall analyses are compared with rain gauge-based rainfall analysis. We aggregate the region based on the five Water Management Districts (WMDs) of Florida, viz., South Florida (SFWMD), Southwest Florida (SWFWMD), St. Johns River (SJRWMD), Suwannee River (SRWMD), and Northwest Florida (NWFWMD; Figure 1) for the results of this work to be more relatable to practical use. These five WMDs have the core mission of monitoring and assessing water supply, water quality, operating and managing flood protection and floodplain management, and evaluating and protecting natural systems by regulating freshwater flows. Therefore, the decisions made in these WMDs are most affected by the variations of the wet season. In the process of this study, we are expanding our earlier work over PF to also include the panhandle region of Florida. All of these five WMDs display a robust seasonal cycle with the peak rainy months being June, July, and August (Figure 2). These months also display significant variability and spread (Figure 2). Additionally, the annual mean climatology of rainfall is comparable across the WMDs (Figure 2). In the following section, we describe the datasets, followed by a discussion of the methodology to diagnose onset and demise of the rainy season in Section Methodology. The results are presented in Section Results that includes validation of the remotely sensed rainfall datasets and real-time monitoring of the 2021 rainy season. Concluding remarks are provided in Section Conclusions.
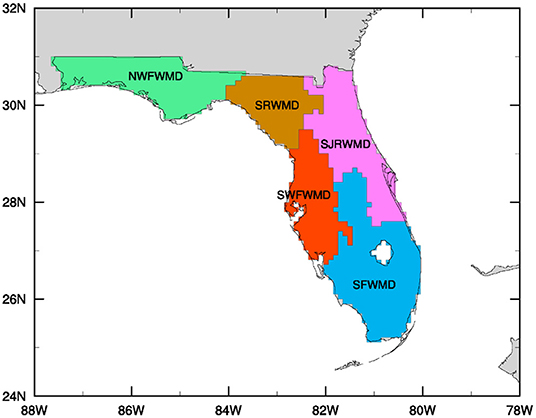
Figure 1. Mask of the Water Management Districts (SFWMD, South Florida; SWFWMD, Southwest Florida; SJRWMD, St. Johns River; SRWMD, Suwannee River; NWFWMD, Northwest Florida) for which the onset and demise of the wet season is diagnosed.
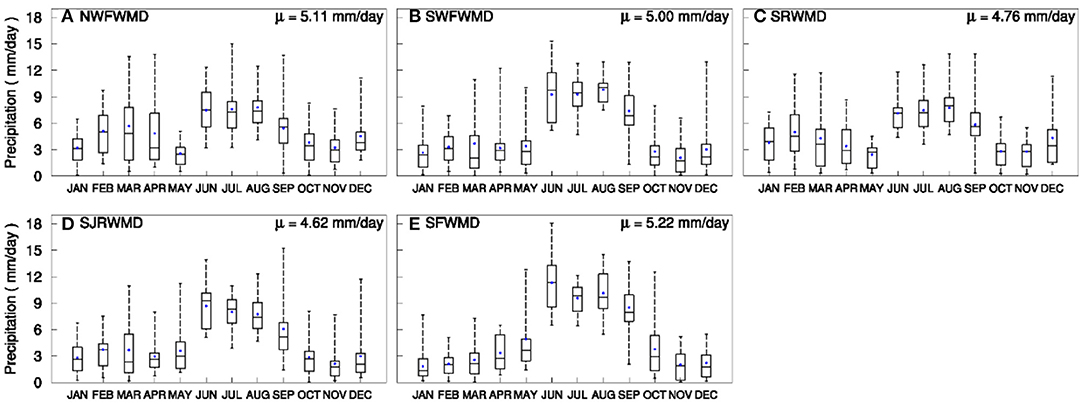
Figure 2. The box and whisker plot of the monthly mean precipitation (mm/day) over (A) NWFWMD, (B) SWFWMD, (C) SRWMD, (D) SJRWMD, and (E) SFWMD. The corresponding annual mean climatology is indicated in the top right corner.
Data Description
As noted earlier, one of the objectives of this work is to assess the fidelity of two remotely sensed rainfall analysis against another rainfall analysis based primarily on in situ measurements of rainfall from rain gauges. The three rainfall analyses are as follows: (1) The National Oceanic and Atmospheric Administration's (NOAA's) Climate Prediction Center (CPC) unified gauge-based analysis of global daily precipitation (Xie et al., 2007; Chen et al., 2008). The remaining two datasets are from the Integrated Multi-Satellite Retrievals for Global Precipitation Mission version 6 (IMERG; Huffman et al., 2019) available as (2) late run or with ~12-h latency, and (3) final run or with ~3.5-month latency.
The CPC Rainfall Dataset
It is a rain gauge-based analysis of daily precipitation using gauge reports from over 30,000 stations over the global land areas collected by the CPC and has been prepared from 1979 to the present (Xie et al., 2007; Chen et al., 2008). The data sources include daily summary files from the global teleconnection system, CPC unified daily gauge datasets over the contiguous United States, Mexico, and South America, and other international agencies. Quality control of the datasets is performed through comparisons with historical records and independent measurements at nearby stations, concurrent radar/satellite observations, and short-term numerical forecasts. The daily analysis of rainfall is created on a 0.125° lat/lon grid over the global domain using the optimal interpolation algorithm following Gandin (1965) and released on a 0.5° lat/lon grid so that the final product represents the area-averaged values of daily precipitation over the grid boxes. Chen et al. (2008) indicate that the quality of the rain gauge-based CPC rainfall analyses degrades as the density of station observations becomes sparser. We use this CPC rainfall dataset as a benchmark against which the remaining two IMERG rainfall products are validated.
The IMERG Dataset
The IMERG rainfall dataset comes from the Global Precipitation Measurement (GPM) mission launched in 2014 and developed jointly by the National Aeronautics and Space Administration (NASA) and the Japanese Aerospace Exploration Agency (JAXA). The GPM mission followed the successful Tropical Rainfall Measuring Mission (TRMM), which was launched in 1997. In comparison to TRMM, GPM has larger spatial coverage and higher temporal resolution, and can detect precipitation <0.5 mm/h. The GPM mission was built from an unprecedented international cooperation in sharing space assets and scientific collaboration to advance precipitation measurement from space for research and applications. The GPM mission concept revolves around deploying advanced combined active and passive sensor packages from a constellation of satellites provided by a consortium of international partners. The GPM core observatory carries a dual-frequency precipitation radar (Ku-band and Ka-band) and a conical-scanning multichannel GPM Microwave Imager (10–183 GHz).
The IMERG data are available at 0.1° grid spacing at hourly intervals from the year 2000 to the present. The IMERG dataset includes early, late, and final run products that have ~4-h, 12-h, and 3.5-month latency. The GPM low-orbit microwave satellites downlink their data once or twice an orbit (which is ~90 min long) to the operating agency. A Precipitation Processing System (PPS) then accesses the numerical forecasts from the Goddard Earth Observing System version 5 (GEOS-5) model (Molod et al., 2015), infrared, and microwave radiance data from the satellites by about 3 h after observation time and converts to precipitation estimates using a forward propagation morphing technique, producing a rainfall analysis by about 4 h after the observation time. The IMERG late run, which has a latency of 12 h, differs from the early run in using both forward and backward propagation morphing processing. This implies that PPS must wait for the following microwave overpass to occur before it can start processing and converting the microwave data to precipitation estimates (through backward propagation). The time to allow for the next microwave overpass to occur is ~11 h. This means that the whole process to produce the precipitation estimate is anywhere between 11 and 14 h, but the average time is about 12 h for the IMERG late run dataset. The IMERG final run rainfall product with 3.5-month latency additionally uses Modern-Era Retrospective Analysis for Research and Applications, version 2 (MERRA2; Gelaro et al., 2017), monthly rain gauge analysis dataset, and the revised precipitation retrievals that uses ERA-5 (Hersbach et al., 2019) and ERA-Interim (Dee et al., 2011) reanalysis.
There are several studies that have compared TRMM rainfall products with IMERG over various regions of the globe (Liu, 2016; Tang et al., 2016; Xu et al., 2019). Most of these studies claim that the IMERG 3.5-month latency dataset is superior to the TRMM datasets (e.g., Tang et al., 2016; Xu et al., 2019). On the other hand, there are far fewer studies comparing the early, late, and final runs of IMERG (Tang et al., 2020), although Tang et al. (2020) conclude from their study on rainfall characteristics over the Sichuan Basin of China that the final run product of IMERG is not necessarily superior to its early and the late run products in the detection of rainfall in all seasons. They further indicate that over the Sichuan Basin, the late run shows superior fidelity only in the summer and autumn seasons. It is imperative to assess the fidelity of the IMERG products over Florida given the objective of this work in evaluating the rainfall analysis for potential real-time application of monitoring the onset and the demise dates of the rainy season over all five WMDs of Florida. The early run of IMERG was deliberately ignored in our analysis because the application to monitor the seasonal evolution of the wet season over Florida allows for the tolerance for latency to be well beyond 12 h. Therefore, given the higher spatial resolution of the IMERG dataset relative to CPC, the former becomes more attractive to monitor the rainfall evolution, especially in relatively small regions like the Florida's WMDs.
Methodology
The objective definition of the onset and the demise of the wet season over the five WMDs of Florida following Misra et al. (2018a) is applied in this study. Essentially, the onset and the demise dates of the wet season are defined as the first and the last days of the year when the daily rain rate exceeds and falls below the climatological annual mean rainfall rate, respectively. The onset/demise dates over each of the five WMDs of Florida are therefore diagnosed as inflection points of the daily cumulative anomaly of rainfall given by:
where Rn(m) is the area average daily rainfall for day m of year n averaged over each of the five Water Management Districts, and R is the corresponding annual mean climatology of the rainfall. The inflection points are the minima for onset and maxima for demise dates in the cumulative anomaly curve. Figure 3 illustrates the onset and the demise date for each of the five WMDs using the IMERG 12-h latency dataset for the year 2001.
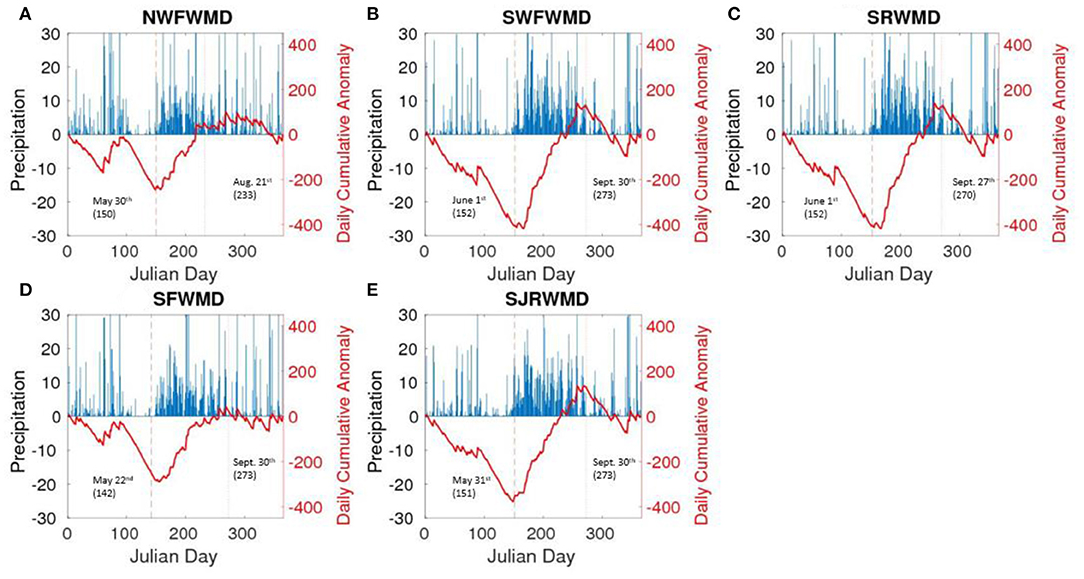
Figure 3. Daily climatological rain rate or precipitation (in blue; mm/day) over (A) Northwest Florida (NWFWMD), (B) Southwest Florida (SWFWMD), (C) Suwannee River (SRWMD), (D) South Florida (SFWMD), and (E) St. Johns River (SJRWMD) with their corresponding daily cumulative anomaly of rainfall (mm) in (red) with their diagnosed onset and demise dates of the wet season in Julian day denoted on the abscissa. This is for the 12-h latency IMERG rainfall dataset for the year 2001.
Once the onset date and the demise date are diagnosed, then the seasonal length is computed as the difference between the two dates. The daily rainfall is accumulated between these dates to account for the seasonal accumulation of rainfall for each of the five WMDs over the 20-year period. The procedure is repeated separately to diagnose the onset/demise dates, seasonal length, and seasonal rainfall anomalies from the CPC, IMERG 12-h, and 3.5-month latency datasets for each of the five WMDs.
Results
Validation of IMERG Datasets
South Florida Water Management District
In Figures 4A–D, we present the time series of the onset date, demise date, seasonal length, and seasonal accumulation of rainfall for the SFWMD from all three rainfall datasets. The root mean squared error (RMSE) and correlation values from these graphs for the IMERG 12-h and 3.5-month latency, computed with respect to the CPC rainfall dataset, are indicated in Table 1. Table 1 indicates that except in the case of the diagnosis of the onset date and length of the season, the 3.5-month latency of IMERG data improves upon the 12-h latency version with respect to both RMSE and correlation values. However, the correlation values are far more comparable between the two datasets and in both instances are statistically significant at 95% confidence interval (Table 1), suggesting that the 12-h latency dataset of IMERG may be appropriate to diagnose the variations of the rainy season over SFWMD, albeit with some systematic bias correction. However, it is interesting to note that the diagnosis of the onset date of the rainy season is far more reliable in the 12-h latency version of IMERG (Table 1). The onset date variations of the rainy season happen to be an important variable that is observed to be associated with the seasonal rainfall anomaly and therefore could be used to prepare a seasonal outlook of the wet season over PF at the start of the season (Misra et al., 2018a; Misra and Bhardwaj, 2020).
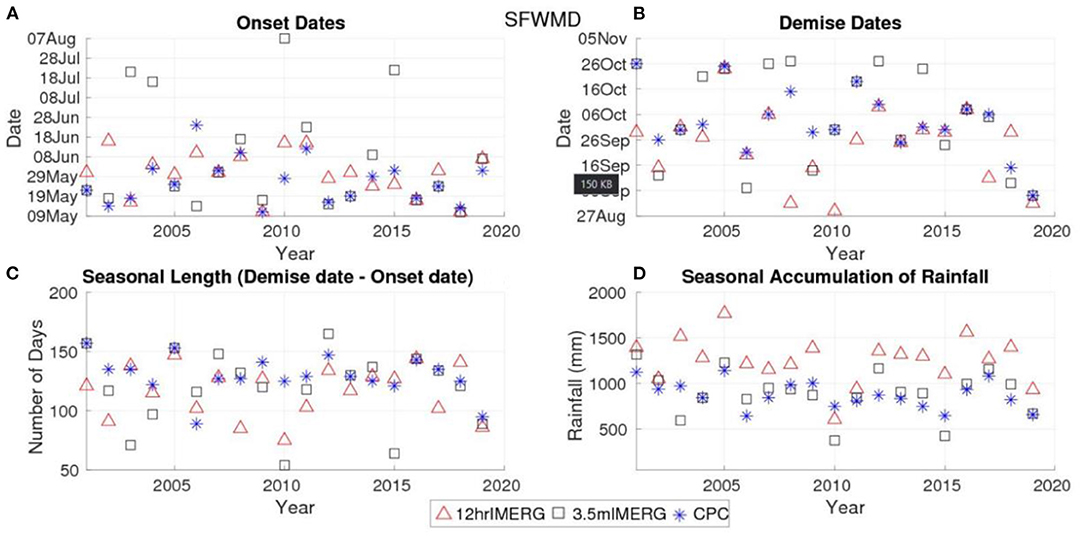
Figure 4. Time series of (A) onset date, (B) demise date, (C) seasonal length (number of days), and (D) seasonal accumulation of rainfall of the wet season for South Florida Water Management District (SFWMD). Blue dots are for CPC, black dots are for 3.5-month latency IMERG (3.5 m IMERG), and red dots are for the 12-h latency IMERG (12 h IMERG) rainfall datasets, respectively.
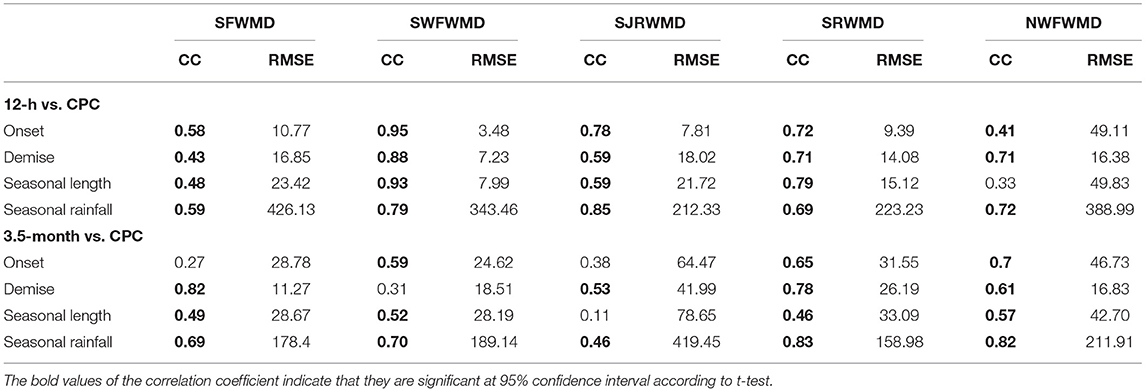
Table 1. The correlation coefficient (CC) and root mean squared error (RMSE) of the onset date, demise date, season length, and total seasonal rainfall anomalies for the five WMDs of Florida from the 12-h latency and 3.5 month latency datasets of IMERG, computed relative to the rain gauge based analysis of CPC data.
Southwest Florida Water Management District
Figures 5A–D show the time series of the variations of the wet season over the SWFWMD with the corresponding RMSE and correlations indicated in Table 1. The 12-h latency version of IMERG shows the highest fidelity in terms of the high correlation and low RMSE over SWFWMD for onset and demise dates, and seasonal length of the wet season (Table 1). The values in Table 1 clearly show that the 12-h latency is far more superior over SWFWMD in comparison to the 3.5-month latency for all parameters of the wet season except the seasonal rainfall. This again suggests that the 12-h latency version of IMERG is reasonable to use for monitoring the evolution of the wet season over SWFWMD.
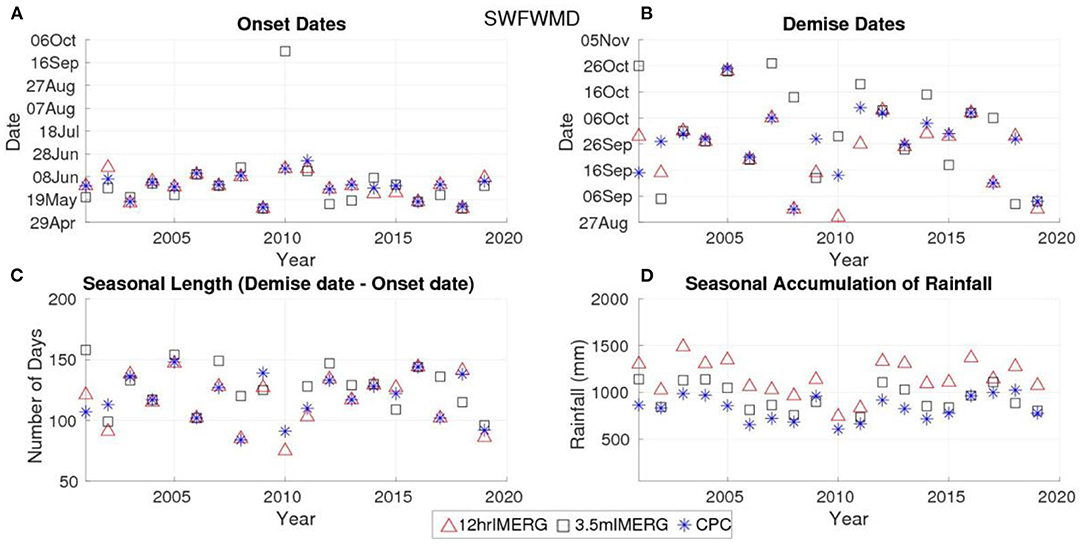
Figure 5. Time series of (A) onset date, (B) demise date, (C) seasonal length (number of days), and (D) seasonal accumulation of rainfall of the wet season for Southwest Florida Water Management District (SWFWMD). Blue dots are for CPC, black dots are for 3.5-month latency IMERG (3.5 m IMERG), and red dots are for the 12-h latency IMERG (12 h IMERG) rainfall datasets, respectively.
St. Johns River Water Management District
Similarly, Figures 6A–D show the variations of the parameters of the wet season over the SJRWMD with the corresponding correlations and RMSE in Table 1. Like SWFWMD, the 12-h latency version of the IMERG dataset for SJRWMD shows significant improvement over the 3.5-month latency version of IMERG with respect to both RMSE and correlation values for the parameters of the onset and the demise dates and seasonal length of the wet season. The correlation values are substantially higher (and statistically significant at 95% confidence interval) and the RMSE values are substantially lower in Table 1 to suggest that the 12-h latency version of IMERG may be appropriate to monitor the onset and the demise of the rainy season over SJRWMD. However, it may be noted that the RMSE of the seasonal rainfall is considerably less in the 3.5-month latency dataset compared to the 12-h latency (Table 1), which suggests that the latter dataset has a bias in diagnosing the rain rates over the wet season.
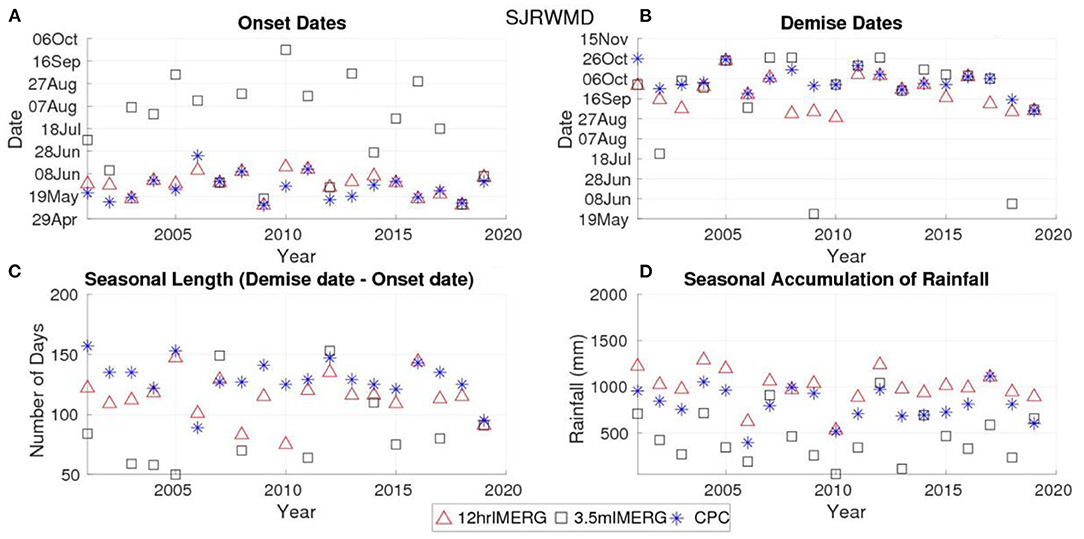
Figure 6. Time series of (A) onset date, (B) demise date, (C) seasonal length (number of days), and (D) seasonal accumulation of rainfall of the wet season for St. Johns River Water Management District (SJRWMD). Blue dots are for CPC, black dots are for 3.5-month latency IMERG (3.5 m IMERG), and red dots are for the 12-h latency IMERG (12 h IMERG) rainfall datasets, respectively.
Suwanee River Water Management District
The time series of the onset date, demise date, seasonal length, and seasonal rainfall of the wet season over the SRWMD from all three datasets are shown in Figures 7A–D. The corresponding RMSE and correlation values are shown in Table 1. In this case, although the 12-h latency version of IMERG shows considerable improvement over the 3.5-month latency of IMERG in terms of RMSE, the correlation values are far more comparable between the two datasets. Furthermore, the 12-h latency dataset shows a larger RMSE for seasonal rainfall than the 3.5-month latency dataset (Table 1). Again, we find that the correlation values are statistically significant in both datasets at 95% confidence interval for all 4 parameters of the wet season (Table 1) to suggest that the 12-h latency product of IMERG could be used to monitor the rainy season over the SRWMD, albeit, with some systematic bias correction.
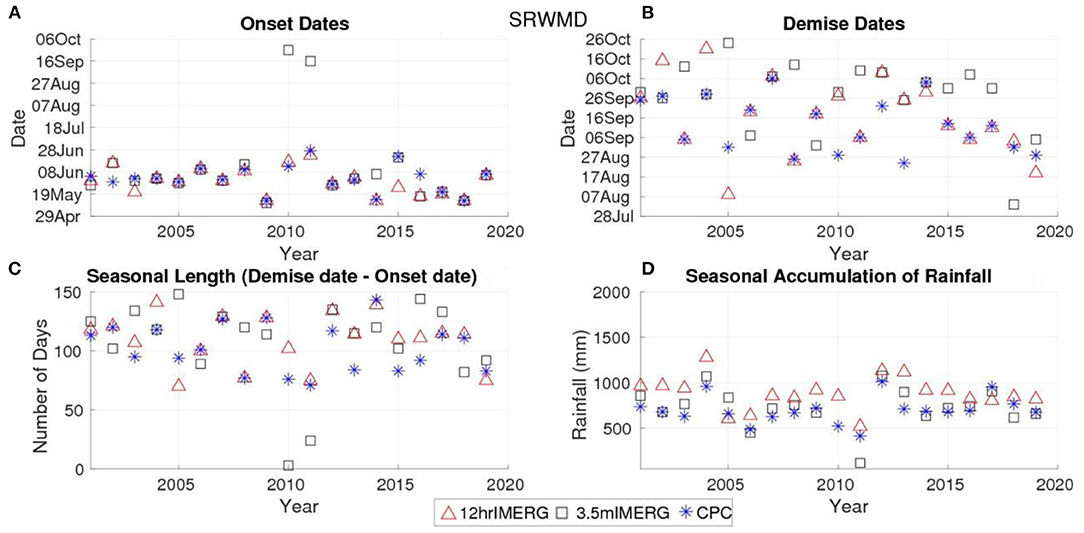
Figure 7. Time series of (A) onset date, (B) demise date, (C) seasonal length (number of days), and (D) seasonal accumulation of rainfall of the wet season for Suwannee River Water Management District (SRWMD). Blue dots are for CPC, black dots are for 3.5-month latency IMERG (3.5 m IMERG) and red dots are for the 12-h latency IMERG (12 h IMERG) rainfall datasets, respectively.
Northwest Florida Water Management District
The variations of the onset date, demise date, seasonal length, and seasonal rainfall of the wet season over the NWFWMD from the three rainfall datasets are indicated in Figures 8A–D. Their corresponding RMSE and correlation values are shown in Table 1. We find in this case that the correlations are slightly higher in the 3.5-month latency version of IMERG relative to the 12-h latency of IMERG for all parameters except the demise date (Table 1). However, in both cases, the correlation values are statistically significant at 95% confidence interval according to t-test except for seasonal length for the 12-h latency dataset. Similarly, we find that the RMSE is reduced in the 3.5-month latency version of IMERG relative to the 12-h latency for all four parameters (Table 1). However, given the relative statistical significance of the correlations of the 12-h latency in Table 1, it is suggested that the dataset could be used to monitor the variations of the wet season over NWFWMD.
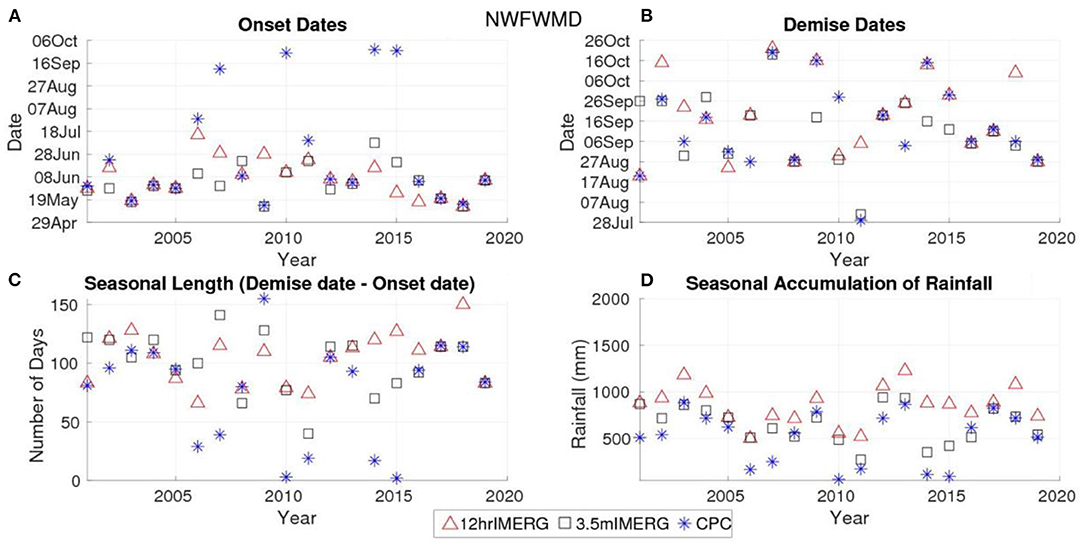
Figure 8. Time series of (A) onset date, (B) demise date, (C) seasonal length (number of days), and (D) seasonal accumulation of rainfall of the wet season for Northwest Florida Water Management District (NWFWMD). Blue dots are for CPC, black dots are for 3.5-month latency IMERG (3.5 m IMERG), and red dots are for the 12-h latency IMERG rainfall (12 h IMERG) datasets, respectively.
Real-Time Monitoring of the 2021 Rainy Season
We monitored the evolution of the rainy season of 2021 using the IMERG 12-h latency dataset, given that the diagnosis of the dates of the onset and demise dates of the rainy season over the WMDs from this dataset is slightly better or comparable to those from the CPC rainfall analysis. One of the highlights of monitoring the onset date of the rainy season is that it has a significant association with the seasonal anomalies of the length and rainfall (Misra et al., 2018a; Misra and Bhardwaj, 2020). In Table 2, we show the correlations of the onset/demise dates of the rainy season in each of the WMDs with the corresponding seasonal length and seasonal rainfall anomalies from the 12-h latency IMERG dataset. In SFWMD, these correlations are significant at −0.46 and −0.41 for seasonal length and rainfall anomalies, respectively. This suggests that early or later onset of the rainy season is more likely to be associated with longer or shorter and wetter or drier season, respectively. Similarly, over SWFWMD, the correlations are comparatively higher and suggest a similar linear relationship. Over SJRWMD and NWFWMD, these correlations are very similar to those for SFWMD, while in SRWMD, the onset date variations have a significant relationship with only seasonal length. The monitoring of the wet season over Florida acquires additional importance given that climate models display very poor seasonal prediction skills over Florida in the summer (Stefanova et al., 2012; Narotsky and Misra, 2021). For example, Narotsky and Misra (2021) find that there is no useful prediction skill at any lead time to predict the onset, demise, length, and seasonal rainfall anomalies of the wet season over Florida, from one of the North American Multi-Model Ensemble Models (Kirtman et al., 2014). Furthermore, the monitoring effort presented here is at the granularity of the WMDs of Florida, which has far greater applicability. In contrast, owing to the coarse resolution of climate models, Narotsky and Misra (2021) had to aggregate rainfall for all of Florida before diagnosing the evolution of the wet season.
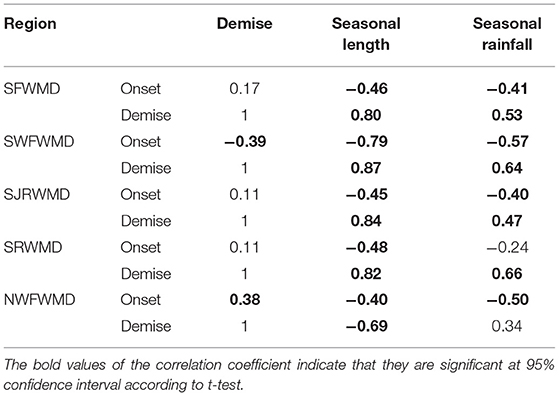
Table 2. The correlations of onset and demise dates of the rainy season with the seasonal length and seasonal rainfall anomalies over the five WMDs of Florida.
The demise date variations also have a similar robust relationship with the seasonal length and rainfall anomalies (Table 2). However, unlike the onset date variations that could be used for providing an outlook of the forthcoming rainy season, the demise date variations offer the choice to analyze the season posteriorly. So, over all WMDs, the correlations of the demise date variations with seasonal length and rainfall anomalies in Table 2 suggest that later or early demise of the season is likely to be associated with shorter or longer and drier or wetter season, respectively. It should be however noted that the correlations between onset date and demise date variations in all WMDs are mostly insignificant except in SWFWMD and NWFWMD (Table 2).
An example of the initial monitoring discussion and the accompanying graphic is shown in Figure 9 for SFWMD for the 2021 season. This discussion was issued on May 28, which was the 7th update since the first one was issued on May 1. This type of discussion was updated at intervals of approximately 4 days to closely monitor the date of the onset of the 2021 wet season. The interval of these discussions was changed to monthly once the onset was reached in all WMDs. The interval of discussion was restored to 4-day interval on September 1, 2021, to monitor the demise of the wet season. These discussions utilized the quantitative precipitation forecasts from NOAA's Weather Prediction Center (https://www.wpc.ncep.noaa.gov/qpf/qpf2.shtml) from 1 to 7 days lead time to anticipate the potential onset of the 2021 wet season over the five WMDs (Figure 9). Figure 9 illustrates the monitoring discussion for SFWMD, which was issued on May 28. Additionally, this discussion features the historic (previous 20 years) evolution of the rainy season in SFWMD overlaid with the cumulative anomaly curve of rainfall of the current season. The historic seasons are classified into terciles with the lower and the upper tercile seasons corresponding to early- and late-onset seasons, respectively. The monitoring discussion of May 28 in Figure 9 is based on comparing the evolution of the cumulative anomaly curve of rainfall of the current season to the 20 historic seasons classified as early/late/normal onset rainy season.
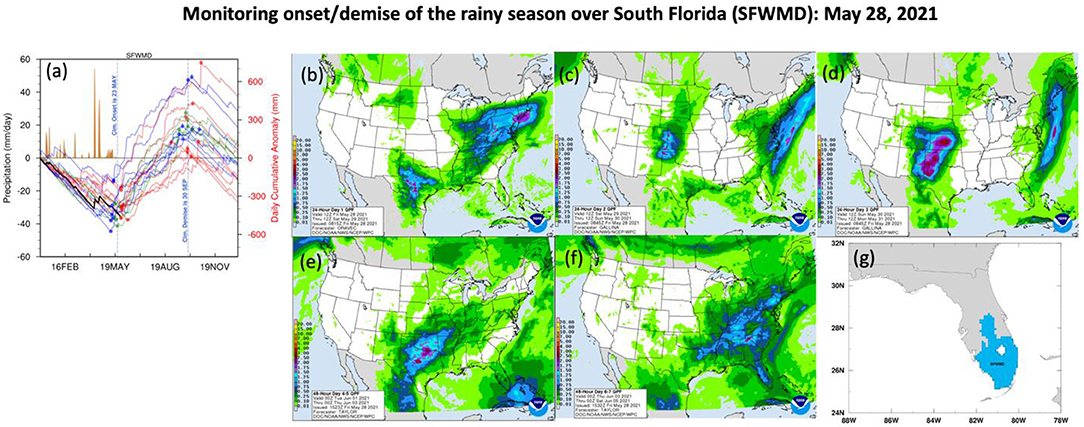
Figure 9. An illustration of the monitoring discussion for SFWMD issued on May 28, 2021. Similar monitoring discussion was issued for the remaining four WMDs of Florida. (a) The daily rainfall from IMERG-12 h latency dataset for 2021 is in brown. The daily cumulative rainfall anomaly curve is in blue, red and green for early, late and neutral onset seasons based on IMERG-12 h latency dataset over the time period of 2000–2020, respectively. The anomalous onset seasons are based on terciles. The corresponding dots and diamonds in the curve mark the onset and the demise of the rainy season, respectively. The daily cumulative anomaly curve for the current rainy season in 2021 is in bold red. (a–f) The quantitative short-term precipitation forecast from NOAA's Weather Prediction Center (https://www.wpc.ncep.noaa.gov/qpf/qpf2.shtml). (g) Mask of South Florida Water Management District (SFWMD). Discussion: (1) The range of onset dates from the historical 20 years shows that the earliest was on 11 May 2018 and the latest was on 11 June 2011. (2) The onset has not reached for this region as of 27 May 2021. (3) The onset of the rainy season is delayed relative to the climatology onset date (23 May). (4) Given the precipitation forecasts for the next few days, it is anticipated that the onset of the rainy season could occur in the next few days.
Another example of the figures used in the monitoring discussion issued after the onset date was observed in each of the five WMDs is presented in Figure 10. In 2021, NWFWMD and SWFWMD had normal onset dates (within the range of the thresholds of the middle tercile) while the rest of the WMDs exhibited late-onset seasons that put them in the upper tercile. Therefore, the discussion in Figure 10 alludes to near-normal rainy season over NWFWMD and SWFWMD, implying that the length of the season and seasonal rainfall anomaly is going to be normal. In SFWMD and SJRWMD, the likelihood of anomalously drier and shorter season than normal is likely, given that their onset date in 2021 occurred late. In SRWMD, the length of the season is likely to be shorter than normal owing to the late onset of the 2021 wet season. However, we cannot provide an outlook on the seasonal rainfall anomaly for SRWMD given the insignificant relationship with onset date variations (Table 2). It is seen that this discussion is qualitative and is not quantitative as it is providing an outlook based on analogy from a relatively small sample of past seasons. This discussion is followed by updates at 1 month interval until we begin to reach the end of the season toward the end of September.
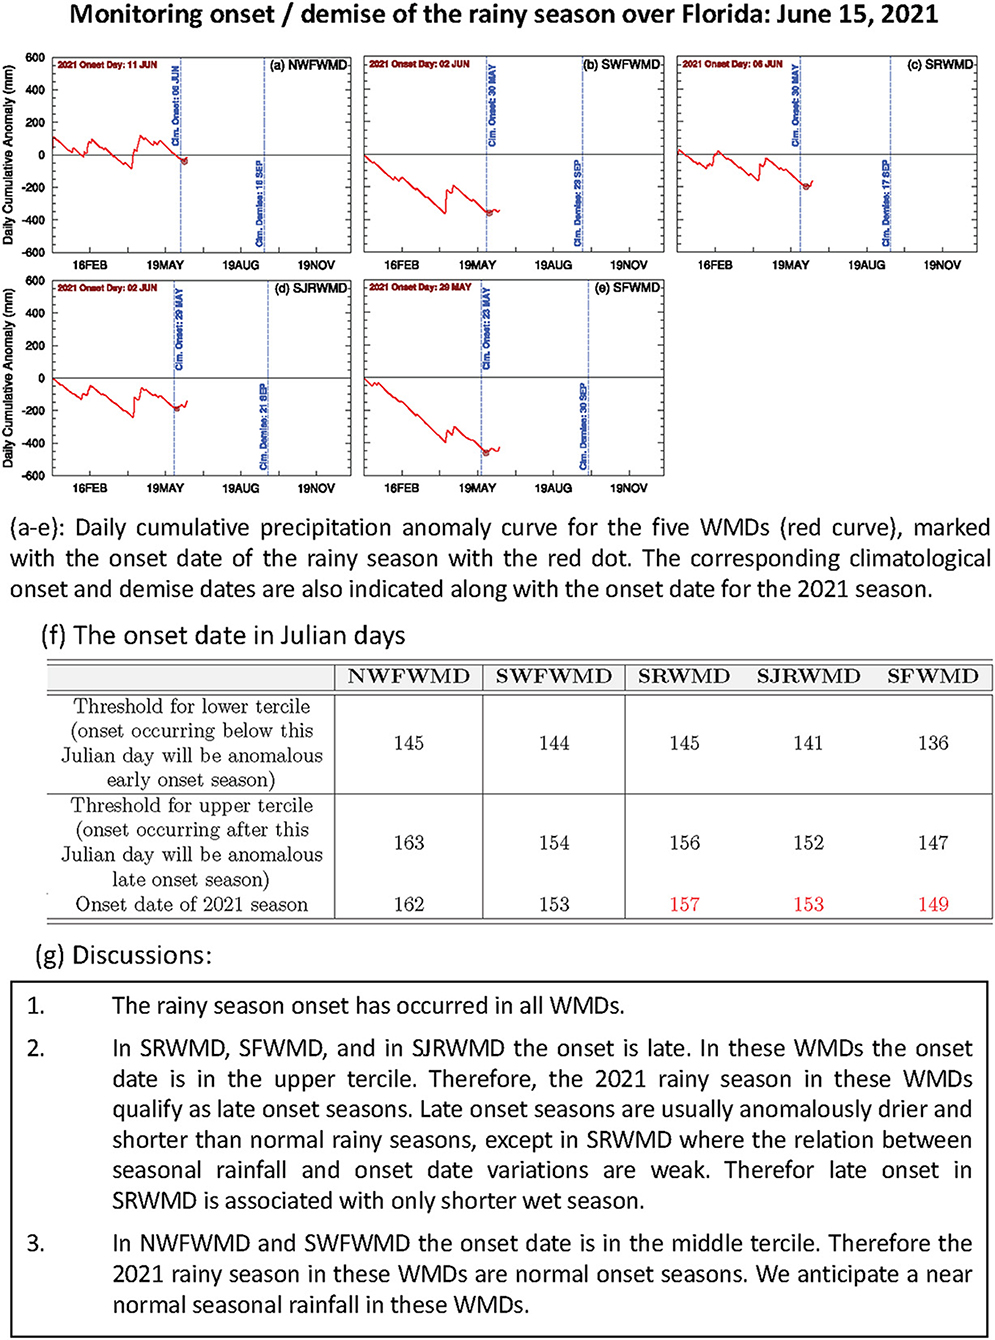
Figure 10. An outlook issued on June 15 for the rainy season of 2021 after the onset was observed in all five WMDs. (a–e) Daily cumulative precipitation anomaly curve for the five WMDs (red curve), marked with the onset date of the rainy season with the red dot. The corresponding climatological onset and demise dates are also indicated along with onset date for the 2021 season. (f) The onset date in Julian days. (g) Discussion.
The discussion of June 15 (Figure 10) was followed by monthly updates on July 16 and August 16. In addition to the plots of the daily cumulative anomalies of precipitation shown in Figure 10, we supplemented the discussion of July, August, and September by showing the daily cumulative rainfall for the 2021 season and contrasting it with the previous seasons (Figures 11F–J). These figures also help in tracking the daily evolution of the rainy season, which is a complimentary approach to the tracking of the daily cumulative anomaly curve of rainfall (Figure 10). In Figures 11F–J, the seasons have been classified based on terciles as early-, normal-, and late-onset seasons, which invariably track as wetter, normal, and drier than normal wet season, in all WMDs except SRWMD, respectively. In Figure 11J, for example, we find that the rainfall in the wet season of 2021 in SFWMD from the day of onset was tracking along the margins of the drier seasons, suggesting that 2021 could end up being a weak, drier than normal season. Similarly, over NWFWMD (Figure 11F), SWFWMD (Figure 11G), and SJRWMD (Figure 11I), the daily rainfall in the 2021 wet season is amidst the cluster of normal seasons.
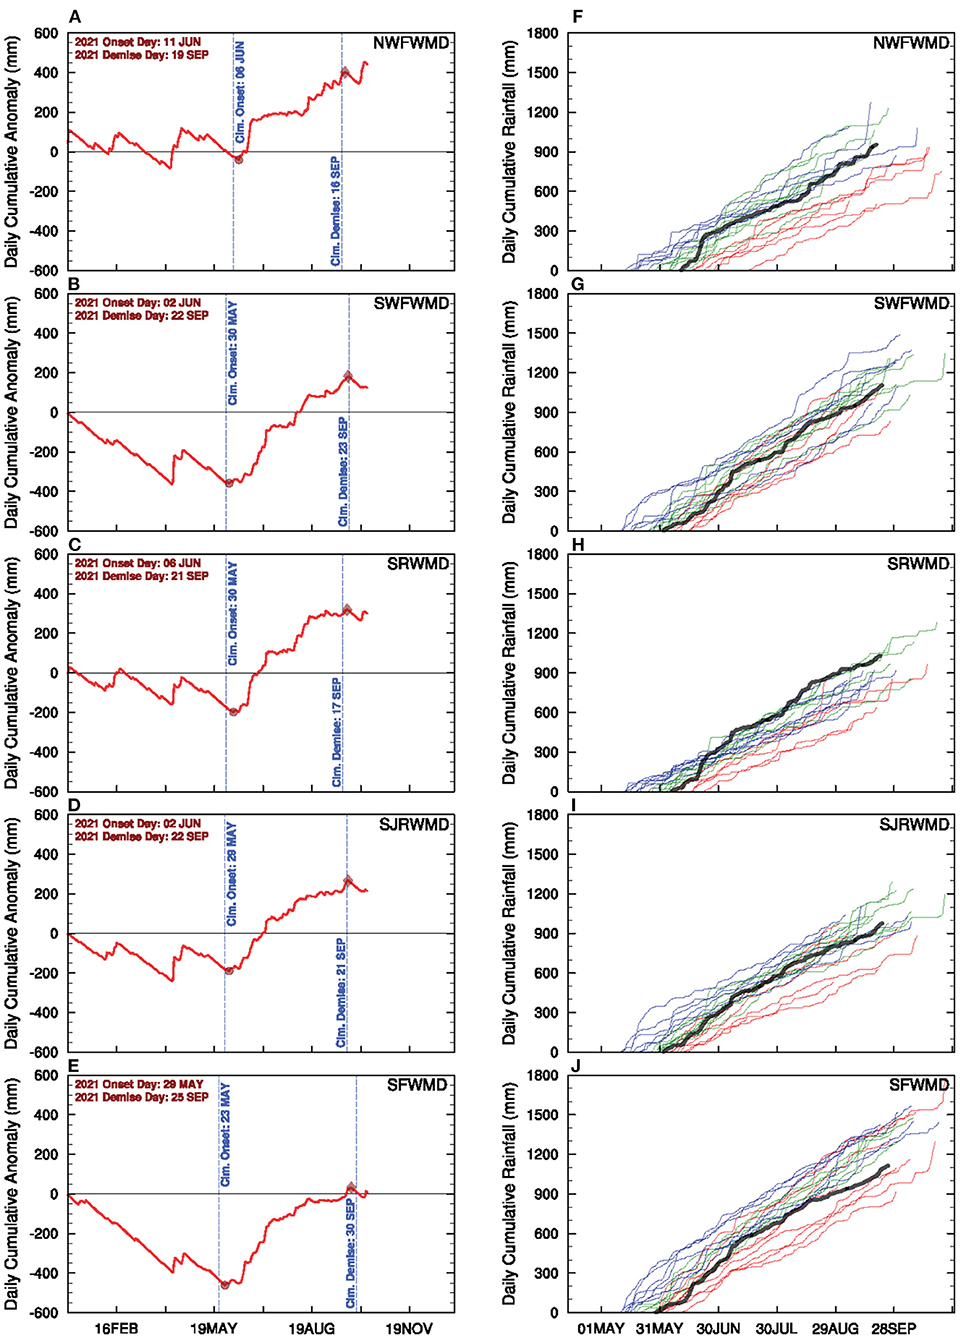
Figure 11. Graphics for the culminating discussion on the monitoring of the rainy season over Florida issued on September 29, 2021. The daily cumulative precipitation anomaly curve for the five WMDs ending on (A–E) September 29 and the cumulative daily rainfall from day of onset for early (blue), late (red), and normal (green) onset date seasons released with the monitoring discussion of (F–J) September 29.
The culminating monitoring discussion was issued on September 29, which indicated that in all five WMDs, the demise of the wet season was reached (Figures 11A–E). In these figures, the daily cumulative anomaly curve of rainfall shows that a peak was reached before it started to decline. The peak is diagnosed as the demise of the wet season. In all WMDs except for SRWMD (Figure 11C) and SFWMD (Figure 11E), the demise date in 2021 was reached within a couple of days of the corresponding climatological demise date. In SRWMD and SFWMD, the demise date was 4 days after and 5 days earlier than climatology, respectively. Yet, this offset over SRWMD was not sufficient for the 2021 wet season to be declared anomalous (Table 3). This suggests that the variability of the wet season is relatively large in SRWMD and therefore the 2021 season despite being 4 days longer still did not cross the thresholds of the middle (normal) tercile. The seasonal rainfall from onset to demise of the wet season in 2021 was within the range of the normal season in all WMDs except in SRWMD and SFWMD (Figures 11F–J; Table 3). The 2021 rainy season over SRWMD was wetter than normal. Over SFWMD, the season evolved to be near the margin of a weak drier than normal wet season. The wet season over SFWMD was also anomalously short (Table 3).
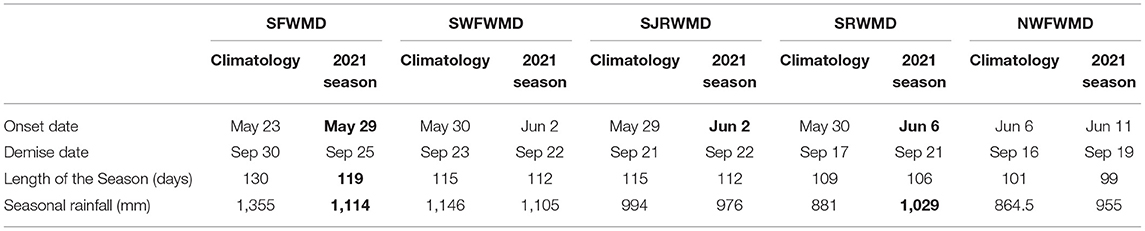
Table 3. Comparison of the 2021 wet season with corresponding climatology (bold values in 2021 season indicate that they are outside of the middle tercile, i.e., it is anomalous).
In summary, our outlook issued on June 15 for a normal rainy season in NWFWMD and SWFWMD was borne out (Table 3). In SFWMD, the season evolved into drier and shorter wet season than normal, consistent with our initial outlook. However, our initial outlooks for anomalously drier season in SJRWMD and shorter season in SRWMD were not verified (Table 3). In comparison, the seasonal outlook provided by NOAA's Climate Prediction Center on May 20, 2021, called for above-normal rainfall for the June–July–August season with a probability of 33–40% across Florida (Figure 12). Given the coarseness of the outlook from CPC (Figure 12), it is indistinguishable between the WMDs of Florida. Therefore, the monitoring work in this study would be highly complementary to the CPC seasonal outlook for Florida.
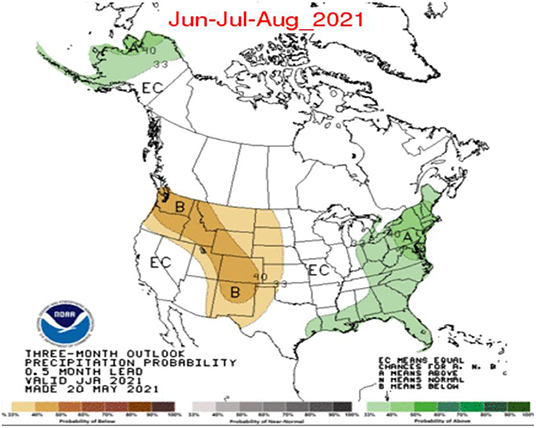
Figure 12. Seasonal outlook of precipitation for June–July–August 2021 issued by NOAA's CPC on May 20, 2021. The shaded values indicate the probability of occurrence of above (shades of green), below (shades of brown), and normal (shades of gray) seasonal rainfall anomalies.
Conclusions
This study was motivated to provide an alternative methodology to monitor the evolution of the wet season over Florida. This was largely to fill a gap left by the poor skills of our current climate models in predicting the evolution of the wet season. This study assessed the fidelity of gridded, remotely sensed rainfall analysis before reporting on the first attempt at using the rainfall data for real-time monitoring of the wet season over the five WMDs of Florida. All five WMDs have a significant fraction of the annual rainfall occurring in the wet season. Therefore, monitoring and anticipating its variations from year-to-year would be critical to manage water resources in the WMDs. The recent launch of the GPM mission and its remotely sensed rainfall products offer new opportunities to leverage for this monitoring effort.
In this study, we have evaluated two remotely sensed rainfall products from GPM relative to a rain gauge-based CPC analysis. The remotely sensed rainfall products are based on microwave sensors and precipitation radar in the GPM constellation of satellites that are merged with numerical forecasts and atmospheric reanalysis to produce gridded rainfall analysis available at 0.1° grid resolution at hourly intervals at a latency of 12 h and 3.5 months. The latter product ingests a larger volume of data for analysis and a more rigorous analysis technique, which would lead to the anticipation of a better rainfall analysis than the former 12-h latency product.
Our study finds that the comparison of the RMSE of the seasonal rainfall of the wet season over the WMDs of Florida reveal the benefit of the 3.5-month over the 12-h latency product of IMERG. However, in terms of other metrics such as the diagnosis of the onset and demise dates, and the seasonal length, the results are somewhat mixed. In some WMDs like SFWMD, SJRWMD, and SRWMD, the RMSE of the onset date, demise date, and the seasonal length of the 3.5-month latency dataset shows a deterioration relative to the 12-h latency product. However, in NWFWMD, the 3.5-month latency product is observed to be slightly better than the 12-h latency product. Similarly, the interannual variations of these three parameters of the wet season over SWFWMD and SJRWMD are shown to have better fidelity in the 12-h latency compared to the 3.5-month latency product of IMERG. An important finding, however, from this study is that the correlations between the 12-h latency dataset and the CPC dataset for all parameters of the wet season over all five WMDs are distinctly significant at 95% confidence interval according to t-test. Therefore, the 12-h latency product of IMERG provides a viable alternative to monitor the evolution of the wet season over all five WMDs of Florida despite its relatively larger RMSE than the 3.5-month latency dataset in some of the parameters of the wet season. The bias revealed in RMSE can, to some extent, be resolved by simple bias correction techniques.
The real-time monitoring effort of the wet season in Florida is motivated by the strong linear relationship of the variations of the onset of the season with the seasonal anomalies of the forthcoming season. The real-time monitoring of the wet season of 2021 has shown some early promise. Given that the onset date of 2021 was very close to the climatological onset date (within the middle tercile) over NWFWMD and SWFWMD, we anticipated a near-normal wet season in all the WMDs. The evolution of the 2021 wet season over these two WMDs verified this outlook. The wet season of 2021 over SFWMD ended being drier than normal, which was consistent with the initial outlook. Similarly, the later onset in SJRWMD was associated to a shorter, drier wet season while the later onset in SRWMD was linked to a shorter wet season in 2021. The 2021 wet season ended as normal in SRWMD. These results provide hope amidst unreliable numerical climate model forecasts for the wet season over Florida (Stefanova et al., 2012; Narotsky and Misra, 2021). The onset date of the 2021 wet season was not highly anomalous (or an extreme) in any of the WMDs. Therefore, the seasonal anomalies that followed from the moderate to weak anomalies of onset dates of the 2021 wet season were difficult predictors, especially given that we have only 20 years of hindcast data to draw analogies from. This monitoring approach is likely to provide a reliable outlook for some of those extreme seasons given the strong relations between the onset date of the wet season with the other seasonal anomalies. It may be stated that the IMERG rainfall dataset with a spatial resolution that is nearly five times higher than the CPC rainfall dataset provides additional impetus to pursue such real-time monitoring of the wet season over relatively small areas like the WMDs in Florida. We are, however, now exploring the use of artificial neural network to provide quantitative forecasts of the evolution of the wet season in terms of its onset date variations.
Data Availability Statement
Publicly available datasets were analyzed in this study. This data can be found here: https://gpm.nasa.gov/data-access/downloads/gpm.
Author Contributions
VM: drafted the paper. CJ: prepared Figures 8–10, Tables 2, 3 and helped in drafting the paper. PB: prepared Figures 1–7 and helped in drafting the paper. AB: prepared the datasets and computed Table 1 and helped in drafting the paper. All authors contributed to the article and approved the submitted version.
Funding
We acknowledge the support of NASA Grant 80NSSC19K1199.
Conflict of Interest
The authors declare that the research was conducted in the absence of any commercial or financial relationships that could be construed as a potential conflict of interest.
Publisher's Note
All claims expressed in this article are solely those of the authors and do not necessarily represent those of their affiliated organizations, or those of the publisher, the editors and the reviewers. Any product that may be evaluated in this article, or claim that may be made by its manufacturer, is not guaranteed or endorsed by the publisher.
References
Chen, M., Shi, W., Xie, P., Silva, V. B., Kousky, V. E., Wayne Higgins, R., et al. (2008). Assessing objective techniques for gauge-based analyses of global daily precipitation. J. Geophys. Res. 113, D04110. doi: 10.1029/2007JD009132
Curtis, S. (2008). The Atlantic multidecadal oscillation and extreme daily precipitation over the US and Mexico during the hurricane season. Clim. Dyn. 30, 343–351. doi: 10.1007/s00382-007-0295-0
Dee, D., Uppala, S., Simmons, A., Berrisford, P., Poli, P., and Kobayashi, S. (2011). The ERA-Interim reanalysis: configuration and performance of the data assimilation system. Quarterly Journal of the Royal Meteorological Society, 137, 553–597. doi: 10.1002/qj.828
Enfield, D. B., Mestas-Nuñez, A. M., and Trimble, P. J. (2001). The Atlantic multidecadal oscillation and its relation to rainfall and river flows in the continental US. Geophys. Res. Lett. 28, 2077–2080. doi: 10.1029/2000GL012745
Gandin, L. S. (1965). Objective Analysis of Meteorological Fields. Jerusalem: Israel Program for Scientific Translations.
Gelaro, R., McCarty, W., Suárez, M. J., Todling, R., Molod, A., Takacs, L., et al. (2017). The modern-era retrospective analysis for research and applications, version 2 (MERRA-2). J. Clim. 30, 5419–5454. doi: 10.1175/JCLI-D-16-0758.1
Hersbach, H., Bell, W., Berrisford, P., Horanyi, A., Sabater, J. M., and Nicolas, J. (2019). A reanalysis of the 1944-53 Atlantic hurricane seasons—the first decade of aircraft reconnaissance. J. Clim. 25, 4441–4460. doi: 10.1175/JCLI-D-11-00419.1
Huffman, G. J., Adler, R. F., Bolvin, D. T., Hsu, K., Kidd, C., Nelkin, E. J., et al. (2019). Algorithm Theoretical Basis Document (ATBD) for Global Precipitation Climatology Project Version 3.0. Precipitation Data. Greenbelt, MD: MEaSUREs project.
Kirtman, B. P., Min, D., Infanti, J. M., Kinter, J. L., Paolino, D. A., and Zhang, Q. (2014). The North American Multimodel Ensemble: phase-1 seasonal-to-interannual prediction; Phase-2 toward developing intraseasonal prediction. Bull. Am. Meteorol. Soc. 95, 585–601. doi: 10.1175/BAMS-D-12-00050.1
Liu, Z. (2016). Comparison of integrated multisatellite retrievals for GPM (IMERG) and TRMM multi-satellite precipitation analysis (TMPA) monthly precipitation products: initial results. J. Hydrometeorol. 17, 777–790. doi: 10.1175/JHM-D-15-0068.1
Misra, V., and Bhardwaj, A. (2020). Understanding the seasonal variations of Peninsular Florida. Clim. Dyn. 54, 1873–1885. doi: 10.1007/s00382-019-05091-7
Misra, V., Bhardwaj, A., and Mishra, A. (2017b). Characterizing the rainy season of Peninsular Florida Clim. Dyn. Available online at: http://coaps.fsu.edu/vmisra/SM1.mov; http://coaps.fsu.edu/vmisra/SM2.mov (accessed February 11, 2022).
Misra, V., Bhardwaj, A., and Mishra, A. (2018a). Characterizing the rainy season of Peninsular Florida. Clim. Dyn. 51, 2157–2167. doi: 10.1007/s00382-017-4005-2
Misra, V., and DiNapoli, S. M. (2012). Understanding the wet season variations over Florida. Clim. Dyn. 40, 1361–1372. doi: 10.1007/s00382-012-1382-4
Misra, V., and Mishra, A. (2016). The oceanic influence on the rainy season of Peninsular Florida. J. Geophys. Res. 121, 7691–7709. doi: 10.1002/2016JD024824
Misra, V., Mishra, A., Bhardwaj, A., Viswanathan, K., and Schmutz, D. (2018b). The potential role of land cover on secular changes of the hydroclimate of Peninsular Florida. NPJ Clim. Atmos. Sci. 1, 5. doi: 10.1038/s41612-018-0016-x
Misra, V., Selman, C., Waite, A. J., Bastola, S., and Mishra, A. (2017a). “Terrestrial and ocean climate of the 20th century,” in Florida's Climate: Changes, Variations, and Impacts, eds Chassignet, E. P., Jones, J. W., Misra, V. and Obeysekera, J. (Gainsesville, FL: Florida Climate Institute), 485–509.
Molod, A., Takacs, L., Suárez, M., and Bacmeister, J. (2015). Development of the GEOS-5 atmospheric general circulation model: evolution from MERRA to MERRA2. Geosci. Model Dev. 8, 1339–1356. doi: 10.5194/gmd-8-1339-2015
Moses, C. S., Anderson, W. T., Saunders, C., and Sklar, F. (2013). Regional climate gradients in precipitation and temperature in response to climate teleconnections in the Greater Everglades ecosystem of South Florida. J. Paleolimnol. 49, 5–14. doi: 10.1007/s10933-012-9635-0
Narotsky, C. D., and Misra, V. (2021). The seasonal predictability of the wet season over Peninsular Florida. Int. J. Climatol. doi: 10.1002/joc.7423. [Epub ahead of print].
Ropelewski, C. F., and Halpert, M. S. (1986). North American precipitation and temperature patterns associated with the El Nino/Southern Oscillation (ENSO). Mon. Wea. Rev. 114, 2352–2362. doi: 10.1175/1520-0493(1986)114<2352:NAPATP>2.0.CO;2
Stefanova, L., Misra, V., O'Brien, J. J., Chassignet, E. P., and Hameed, S. (2012). Hindcast skill and predictability for precipitation and two-meter air temperature anomalies in global circulation models over the Southeast United States. Clim. Dyn. 38, 161–173. doi: 10.1007/s00382-010-0988-7
Tang, G., Ma, Y., Long, D., Zhong, L., and Hong, Y. (2016). Evaluation of GPM Day-1 IMERG and TMPA Version-7 legacy products over Mainland China at multiple spatiotemporal scales. J. Hydrol. 533, 152–167. doi: 10.1016/j.jhydrol.2015.12.008
Tang, S., Li, R., He, J., Wang, H., Fan, X., and Yao, S. (2020). Comparative evaluation of the GPM IMERG Early, Late, and Final hourly precipitation products using the CMPA data over Sichuan Basin of China. Water 12, 554. doi: 10.3390/w12020554
Teegavarapu, R. S. (2012). Floods in a Changing Climate: Extreme Precipitation. Cambridge: Cambridge University Press. doi: 10.1017/CBO9781139088442
Xian, Z., and Pielke, R. A. (1991). The effects of width of landmasses on the development of sea breezes. J. Appl. Meteorol. 30, 1280–1304. doi: 10.1175/1520-0450(1991)030<1280:TEOWOL>2.0.CO;2
Xie, P., Yatagai, A., Chen, M., Hayasaka, T., Fukushima, Y., Liu, C., et al. (2007). A gauge-based analysis of daily precipitation over East Asia. J. Hydrometeorol. 8, 607–626. doi: 10.1175/JHM583.1
Keywords: seasonal climate, rainy season, Florida, Water Management Districts, interannual variability
Citation: Misra V, Jayasankar CB, Beasley P and Bhardwaj A (2022) Operational Monitoring of the Evolution of Rainy Season Over Florida. Front. Clim. 4:793959. doi: 10.3389/fclim.2022.793959
Received: 12 October 2021; Accepted: 18 January 2022;
Published: 24 February 2022.
Edited by:
Annalisa Cherchi, Institute of Atmospheric Sciences and Climate (CNR-ISAC), ItalyReviewed by:
Aneesh Goly, RADISE International, United StatesJian Li, Chinese Academy of Meteorological Sciences, China
Copyright © 2022 Misra, Jayasankar, Beasley and Bhardwaj. This is an open-access article distributed under the terms of the Creative Commons Attribution License (CC BY). The use, distribution or reproduction in other forums is permitted, provided the original author(s) and the copyright owner(s) are credited and that the original publication in this journal is cited, in accordance with accepted academic practice. No use, distribution or reproduction is permitted which does not comply with these terms.
*Correspondence: Vasubandhu Misra, dm1pc3JhQGZzdS5lZHU=