 Panagiotis Fragkos*
 Kostas Fragkiadakis
- E3 Modelling, Athens, Greece
The recent EU Green Deal puts forward ambition climate targets aiming to make the EU the first climate neutral continent by mid-century while ensuring a just transition. This requires a large-scale transformation of the EU and global energy and economic systems induced by both regulatory and market-based policies, in particular carbon pricing. Macro-economic models currently used for the analysis of climate policy impacts need improvements to consistently capture the transition dynamics and challenges. The study presents the methodological enhancements realized in general equilibrium model GEM-E3-FIT (including enhanced energy system representation, low-carbon innovation, clean energy markets, technology progress, policy instruments) to improve the simulation of the impacts of ambitious climate policies. The model-based analysis shows that high carbon pricing has limited negative impacts on the EU GDP and consumption, while leading to an economy transformation toward a capital-intensive structure triggered by increased investment in low-carbon technologies and energy efficient equipment. Global decarbonization to achieve the well-below 2°C goal of the Paris Agreement will modestly impact total employment, but its effects are pronounced on specific sectors which are impacted either negatively (e.g., supply of fossil fuels, energy intensive industries) or positively by creating additional jobs (e.g., low-carbon manufacturing, electricity sector).
Introduction
Climate change is high on the political agenda of major economies worldwide, as demonstrated by the implementation of climate policies aiming to reduce emissions, improve energy efficiency and expand renewable energy. In the 21st Conference of Parties (COP21) in Paris, governments agreed to limit the increase in global average temperature to levels “well-below 2°C” relative to the pre-industrial levels (United Nations Framework Convention on Climate Change, 2015) and to pursue efforts to limit it further to 1.5°C, combined with an ambition to peak emissions as soon as possible. In the run-up to COP21, a large majority of countries submitted national climate action plans known as Nationally Determined Contributions (NDCs), outlining their post-2020 climate actions (Fragkos et al., 2018).
The EU has adopted ambitious climate targets, aiming to reduce its GHG emissions by at least 40% in 2030 relative to 1990 levels. Recently, as part of the EU Green Deal and its 2030 Climate Target Plan, the EU has raised its emission reduction target to 55% in 2030 and aims to achieve climate neutrality by mid-century (European Commission, 2020). The EU has already made progress toward its goals, as its GHG emission levels in 2019 were 24% below 1990 levels. However, climate action must accelerate as progress in key sectors including transportation, buildings and agriculture is lagging behind. In addition, the EU has increased its share of renewables and improved energy efficiency, but current policies are not sufficient to reach the new 2030 EU targets as outlined in the Fit for 55 package (European Commission, 2021). These include at least a 55% reduction in GHG emissions from 1990, a 40% share of renewables in final energy consumption and a 36–39% improvement in energy efficiency. Implementing ambitious climate policies would have profound implications for economic growth, labor markets, financial requirements, workers' income, and industrial competitiveness. In response, the EU Green Deal suggests that Europe will be transformed toward a clean, sustainable, and circular economy based on the protection of industrial competitiveness in global markets (through implementation of Carbon Border Adjustment Mechanism-CBAM), the provision of low-cost finance and the Social Climate Fund, which will use ETS revenues to mitigate decarbonization impacts on vulnerable households and regions and support low-carbon investment (European Commission, 2021a).
The study aims to assess the socio-economic implications of ambitious EU and global climate policies. We use the global multi-sectoral Computable General Equilibrium (CGE) GEM-E3-FIT model, which can analyze energy-economy-environment interactions within a consistent unified framework built on verifiable assumptions. Using GEM-E3-FIT with innovative methodological improvements, the study provides novel insights into the activity, labor market and trade impacts of climate policies and explores the challenges and opportunities induced by decarbonization for specific sectors and countries.
The study is structured as follows: section Context presents an overview of the policy context and related literature on macro-economic effects of climate policies, while section Materials and Methods introduces the GEM-E3-FIT model and the methodological improvements. section Results presents the key economic, employment, industrial and environmental impacts of ambitious climate policies. section Discussion concludes.
Context
The transition to a low carbon economy is a complex and lengthy process that requires high uptake of low-carbon technologies, innovation, sufficient financial resources, and coordination of market players, including policy makers, industrial manufactures, R&D providers, the finance sector, infrastructure developers, and final consumers. Energy system decarbonization involves the substitution of fossil fuels (which are imported in most EU countries) by products and services related to low-carbon and energy-efficient technologies that are mainly domestically produced. This substitution is an investment-intensive and technology-intensive process that requires economic restructuring away from fossil fuels and toward a more capital-intensive structure. Depending on low-carbon technology costs, this process may be costly in the short-term, thus increasing the average price of energy services, but in the long-term the transformation may bring positive externalities driven by technology progress and industrial maturity dynamics as well as environmental benefits (e.g., reduced climate damages and air pollution). These elements can result in socio-economic benefits, at least for some sectors and countries, especially if the size of the clean energy market is sufficiently large (to achieve economies of scale and allow innovators to recover their high upfront costs) and there is adequate, low-cost availability of finance (Karkatsoulis et al., 2016), given that low-carbon investments are more capital intensive relative to fossil fuels (Polzin et al., 2021). As financing of new products and technologies is not available at uniform interest rates, the supply of finance depends on the risks of new technologies (i.e., limited financial resources for high risk capital).
The EU has introduced market-based policy instruments to reduce emissions; the EU-wide Emissions Trading System (ETS) was introduced in 2005 as the world's first cap-and-trade market, while EU countries have also introduced regulatory and tax-based measures to stimulate emissions reductions. The EU's early implementation of ETS market has provided useful examples for the creation of subsequent ETS in China, South Korea, Canada, Japan, New Zealand, and Switzerland. EU climate policies may raise competitiveness risks for businesses, especially if non-EU competitors do not adopt strong climate policies. In the existing policy context, free emission allowances are issued to domestic producers in energy-intensive sectors that are susceptible to competition from countries with lower environmental standards. As part of the Fit for 55 package, the CBAM is introduced to reduce carbon leakage and protect domestic industrial production from relocating to non-abating countries.
In recent years, several studies explored the socio-economic impacts of decarbonization. The projected effects vary depending on the modeling methodology and assumptions used, e.g., technology costs and availability, global fossil fuel prices, policy ambition, financing availability, etc. Most studies argue that decarbonization will deliver limited socio-economic impacts relative to the Business-as-usual scenario, while having clear environmental benefits. The consistent quantification of socio-economic impacts of mitigation is a challenge for current modeling tools as it requires addressing simultaneously a multitude of interconnected factors the dynamics of which are complex and difficult to capture, including technology progress, low-carbon innovation, sectoral transformation dynamics, interactions between energy and economic systems and the finance sector, etc.
Most mitigation studies using global modeling tools assume that a global target on temperature or cumulative emissions is imposed. However, there are multiple potential pathways to achieve these targets, which differ due to model choices on technology costs, temporal profile of emission reduction effort, the allocation of climate effort to specific sectors and countries, technology availability, socio-economic assumptions, etc. Despite those differences, Kriegler et al. (2015) and Rogelj et al. (2015) argue that mitigation pathways have the following features: (i) emissions should peak the latest by 2025 or 2030, (ii) energy supply should be fully decarbonized by mid-century, (iii) energy efficiency has a central role, especially in buildings and industries, (iv) large-scale electrification of energy services is required based on decarbonized electricity, and (v) negative emissions technologies are essential for meeting the 1.5°C target.
The literature exploring the socio-economic effects of decarbonization argues that its GDP impacts are limited, but there are large shifts in sectoral activity and employment as shown in Paroussos et al. (2020). For instance, Fragkos et al. (2018) based on a multi model inter-comparison find that economic growth is only marginally affected by climate action. Using multiple modeling results, the IPCC 5th Assessment Report estimated global consumption losses of 2–6% in 2050 to limit global warming to <2°C by 2100 (IPCC, 2014). Fragkos et al. (2017) show that the implementation of EU decarbonization goals incurs relatively limited GDP losses amounting to 0.6% by 2050 from Reference scenario, which is in line with several other model-based analyses, e.g., Riahi and Kriegler (2015) and Capros et al. (2014). Paroussos et al. (2019) showed that the socio-economic impacts of decarbonization depend on the assumed low-carbon technology progress and access to low-cost finance. (Kober and Summerton, 2016) showed that GDP effects of mitigation depend crucially on the modeling paradigm used, with CGE models reporting a limited reduction in GDP (~0.4%) whereas macro-econometric models report GDP gains (~0.2%) for ambitious emission reductions. In “Clean planet for all” strategy (European Commission, 2018), GDP losses of decarbonization are limited and depend on the modeling framework used, with CGE models showing more negative impacts than those based on the neo-Keynesian approach. These differences highlight the importance of the modeling approach and specific model assumptions on low-carbon innovation and technology uptake, labor, and financial markets.
The interlinkages between energy system decarbonization and macro-economic structural change are complex; they include risks and opportunities for economic activity (Antosiewicz et al., 2020; Probst et al., 2020), employment (Fragkos et al., 2018), industrial competitiveness (Karkatsoulis et al., 2016), trade patterns (Paroussos et al., 2015), embedded emissions (Meng et al., 2018), and low-carbon innovation (Mercure et al., 2019; Fragkiadakis et al., 2020). On the one hand, low carbon finance and technological innovation can lead to the emergence of new economic sectors, productivity growth and enhanced competitiveness as well as reduced energy imports. On the other hand, a rapid transformation implies substantial challenges, which are reflected in systemic financial risks (Polzin et al., 2021), higher costs of production, carbon leakage as well as risks of social dislocation created by structural change and negative distributional impacts to vulnerable households (Fragkos et al., 2021).
Our analysis improves the understanding of macro-economic and employment implications of climate policies using the enhanced version of GEM-E3. The model is built on the neo-classical school of economic thought, but it has been improved to overcome methodological inefficiencies (e.g., rigid representation of labor and capital markets); incorporate new cutting-edge methodological insights (e.g., low-carbon innovation and spillovers) and represent policy instruments with real-world realism. Further enhancing GEM-E3-FIT is crucial for strengthening the evidence base for policy making and gaining a consistent picture of economic impacts of climate targets. By focusing on recently announced targets (including EU Green Deal and new EU NDC target for 2030) ensures that the analysis is policy relevant, grounded in real world and can be used by policy makers to design low-carbon strategies.
Materials and Methods
The GEM-E3-FIT Modeling Framework
The GEM-E3-FIT model is a multi-sectoral, recursive dynamic CGE model, which simultaneously represents 46 regions (including all EU countries) and 51 sectors linked through bilateral trade (E3-Modelling, 2017). It is a comprehensive model of the global economy, covering interlinkages between productive sectors, consumption, price formation of commodities, labor and capital, trade, and investment dynamics. GEM-E3-FIT formulates the supply and demand behavior of economic agents with market derived prices to clear markets, allowing for a consistent evaluation of distributional effects of policies. The model is driven by accumulation of capital, equipment and knowledge, features equilibrium unemployment, energy efficiency standards and carbon pricing and can quantify the socio-economic impacts of policies ensuring that in all scenarios the economic system remains in general equilibrium.
Industries operate within a perfect competition market regime and maximize profits. Production functions consider the possibilities of substitution between capital, labor, energy, and materials in each sector and allow for price-driven derivation of intermediate consumption and the services from capital and labor. Households demand, savings and labor supply are derived from utility maximization using a linear expenditure system (LES) formulation. Households receive income from labor supply and from holding shares in companies. Investment by sector is dynamic depending on adaptive anticipation of capital return and sectoral activity growth. All regions and sectors are linked through endogenous bilateral trade flows. Total demand in each country and sector is optimally allocated between domestic and imported goods, under the hypothesis that they are imperfect substitutes (Armington, 1969): at the upper level, firms decide on the optimal mix between domestically produced and imported goods; at the next level, demand for imports is split by country of origin depending on transportation costs, prices and consumer preferences (captured by statistics on trade). GEM-E3 is calibrated using the GTAP dataset that provides a comprehensive and self-consistent accounting of firms' production structures, households' consumption, trade, gross fixed capital formation and sectoral value added (Figure 1). GEM-E3-FIT includes features that go beyond conventional CGE approach, described in detail below.
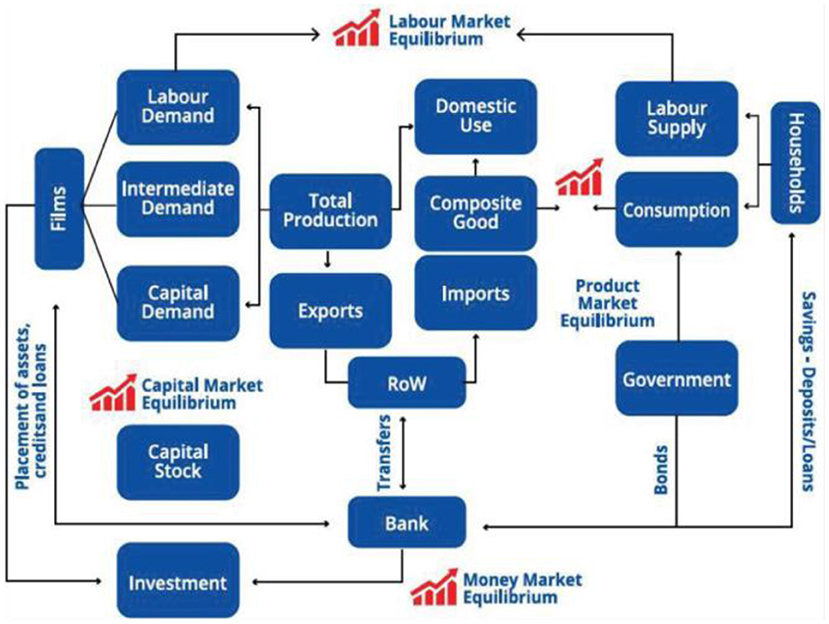
Figure 1. GEM-E3-FIT structure.
Modeling Enhancements
Conventional CGE models lack a detailed representation of the energy system and related technologies, as they commonly represent the energy sectors using aggregate production functions and they fail to capture crucial sector characteristics reducing the credibility of their simulations. To overcome this, top-down CGE models are often combined with bottom-up models which have a rich representation of energy technologies (Böhringer and Rutherford, 2008; Helgesen, 2013). Two methods are used: (i) a hard link approach where the CGE model is extended to include detailed representation of the energy system and (ii) a soft link approach where the two models are linked through specific variables and an iterative process to ensure models' convergence. GEM-E3-FIT includes a detailed representation of energy system and technologies, thus enhancing the credibility of CGE modeling for climate policy analysis as the substitution patterns in energy supply and demand are based on ‘true' technologies rather than restrictive functional forms.
Electricity Production
GEM-E3-FIT adopts a bottom-up approach for electricity sector with power producing technologies treated as separate production sectors. GEM-E3-Power module (Polzin et al., 2021) calculates the optimal investment and operation of electricity system in order to minimize total production costs, including capital costs (CAPEX),1 Operation & Maintenance (O&M) expenditures, carbon costs and costs to purchase fuels, while meeting constraints (e.g., technology potentials, resource availability, policy constraints, system reliability). Thirteen power technologies are included (coal, oil, gas and biomass-fired, nuclear, hydro, PV, wind onshore, wind offshore, geothermal, Carbon Capture and Storage- CCS- with coal, gas, and biomass) and compete based on their Levelized Cost of Electricity to meet electricity requirements in each time segment. The decision to invest in power technologies depends on their relative costs, barriers and potentials, while various policy instruments may influence the electricity system evolution, e.g., ETS prices, phase-out policies, renewable subsidies, etc.
GEM-E3-Power calculates investment in new power plants, which are influenced by sectoral electricity demand, load curves, decommissioning of old plants and policy measures. The modeling includes non-linear cost-supply curves for fossil fuels, renewables, and nuclear plants, which capture exhaustion of renewable energy potential, take-or-pay contracts for fuels, the promotion of domestically produced fuels, social acceptability of technologies, difficulties to develop CO2 storage areas, policies regarding nuclear site development, etc. (Polzin et al., 2021). The non-linear cost-supply curves are included in the optimization of capacity expansion and system operation of GEM-E3-Power.
Transport
GEM-E3-FIT includes a bottom-up representation of passenger and freight transport, simulating the choice of (public and private) transport modes and technologies and the way of using transport equipment. Mobility is split between using private transport means (e.g., cars) and purchasing transport services from transport suppliers (public transport). Private mobility is derived from consumption by purpose of households under the income constraint. The use of private transport involves purchasing of durable goods (vehicles) considering three car types with different capital and fuel consumption features; in particular conventional Internal Combustion Engine (ICE), plug-in hybrid vehicles and battery electric cars (EVs). Each car type uses a different mix of fuels, with ICE cars using diesel, gasoline, gas and biofuels, EVs using electricity, and plug-in hybrids using electricity, oil products and biofuels. The shares of the three car types (r) in new car registrations are calculated based on the Weibull discrete choice representation (Karkatsoulis et al., 2017), as below:
xshcarr, t represents the share of car types in new car registrations.
shcarr is the scale parameter used to calibrate technology shares.
pcarr, t is the price by car type (reflecting total cost).
swt is the elasticity of substitution between car types.
Mobility of private consumers is translated into demand for specific car types, which in turn is related to demand for specific goods via the consumption matrix that links consumption by purpose to demand for specific goods. The technology and fuel mix in transport changes endogenously because of carbon pricing and other policy instruments, while fuel shares in households' consumption matrix can be modified. Public transport is provided by land, air, and maritime transport. Each transport sector produces a homogenous service using inputs from capital, labor, materials and energy, based on endogenous choice of firms toward cost minimization. The demand of other production sectors for transport services derives from cost minimization of their production input mix. Substitutions are possible between transport modes and between transport and non-transport inputs depending on relative prices of goods and services.
Energy Use in Households
Energy demand for households is divided into Heating and cooking demand and Electric Appliances (Figure 2). Useful energy for heating depends on households' income and on the total cost of heating that includes the purchase and the operational costs for energy equipment. The purchase and use of energy services by households derives from their utility maximization (under income constraint). The use of durable goods (cars, heating systems and electric appliances) involves demand for non-durable goods, mainly fuels and electricity. The consumer's decision to purchase durable goods depends on the cost of buying and using the energy equipment (i.e., fuel costs).
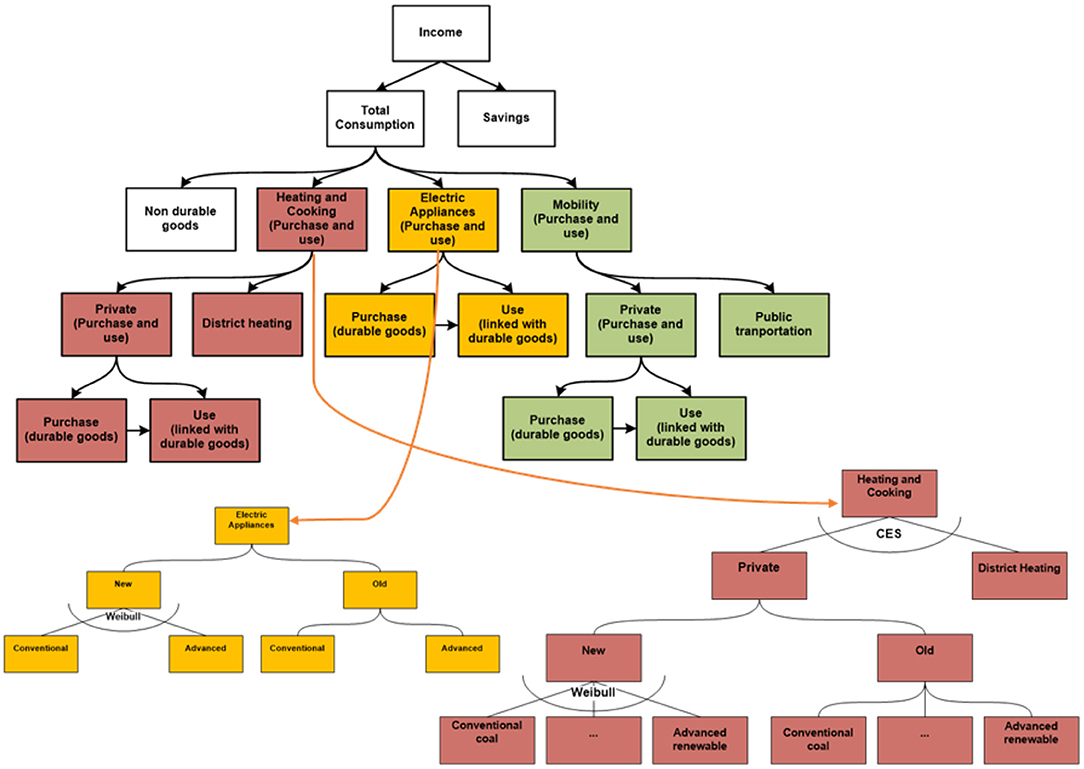
Figure 2. Decision tree of households, including energy and mobility services.
At the first level of the heating bundling, households decide between district heating and the use of private heating appliances through a CES function depending on the costs of competing options. At the second level, households decide on the operation of existing appliance stock and the purchase of new appliances. Finally, new appliances are split into options based on the fuel used (coal, oil, gas, biomass, electricity, solar thermal) and technologies (conventional and advanced) characterized by different cost structures in terms of purchase and operation costs. Their competition is modeled as a “Weibull” function (similar to cars), with fuel choice depending on their total costs. The purchase and use of electric appliances follow the same logic as heating and cooking appliances.
Representation of the Decarbonization Process
GEM-E3-FIT captures both energy- and process-related GHG emissions. The emission abatement potential depends on substitution possibilities among fuels and between energy and capital. In the model, the internalization of environmental externalities is achieved either through taxation or system constraints –global, regional, or sectoral-, the shadow cost of which (e.g., carbon price) affects the decisions of economic agents. Emission reductions in GEM-E3-FIT are enabled through:
1) End-of-pipe abatement technologies for non-CO2 emissions are formulated by bottom-up Marginal Abatement Cost Curves (MACCs) that differ among countries, sectors, and pollutants (Harmsen et al., 2019). Marginal costs of abatement are increasing functions of the degree of abatement.
2) Substitution of fuels toward low-emission energy carriers and technologies: The decision of firms to purchase inputs is influenced by carbon pricing, which increases the cost of fossil fuel inputs and causes a shift in firms' demand away from fossil fuels toward low-emission technologies. Therefore, an imposed cost on emissions (e.g., a carbon price) drives substitution toward less emission intensive inputs, e.g., from coal to gas or renewable energy.
3) Energy efficiency improvements, modeled through specific investment that enable the substitution of fuel consumption with capital and/or technology equipment (e.g., advanced home appliances, improved thermal insulation, energy management in industries, more efficient equipment). Thus, climate policies will drive a substitution away from energy to capital.
4) Decrease of production: The imposition of climate-related constraints causes an additional cost to production, linked to the costs of substitution or installation of abatement equipment. An increasing production cost would drive a reduction in demand, production and emissions for carbon-intensive products, combined with potential substitution toward activities with lower carbon intensity.
The environmental tax is paid by the polluting firm to the government and thus the tax affects the firms' decisions on the use of production factors. In GEM-E3-FIT, the installation of low-emission and energy efficient technologies is considered as an intermediate input and not as investment demand of the firms, as, e.g., the purchase of a more efficient air-condition will not increase the firm's capital stock but will create additional intermediate demand. Firms and households decide on the optimal level of abatement driven by the carbon tax,2 with emissions reduced up to the level that the cost to abate the last ton of emissions equals the carbon price. CO2 emissions can be mitigated through efficiency improvements, uptake of low-emission technologies and fuel substitution away from fossil fuels. In GEM-E3-FIT, a climate policy can be implemented either through the imposition of an exogenous carbon tax, or through an exogenous emission cap, with tax level endogenously estimated to achieve the emission target ensuring the clearing of demand and supply for emission permits.
Representation of Markets for Low-Carbon Technologies
Most Integrated Assessment models do not represent the “upstream” industrial implications of decarbonization and the potential domestic industry effects for global technology leaders (De Cian et al., 2013). The inclusion of multiple economic sectors (in particular those that manufacture low-carbon equipment) can drastically improve simulation properties of models with regard to industrial, trade and distributional impacts of climate policies (Karkatsoulis et al., 2016).
GEM-E3-FIT represents the manufacturing of low-carbon equipment as separate production sectors and can capture growth and competitiveness effects driven by low-carbon innovation and industrial activities induced by decarbonization. The model database has been extended to represent producers for PV, wind, Evs, Batteries, and biofuels. As GTAP database does not separate the manufacturing of low-carbon technologies, supplementary data sources are used to provide estimates for the size, structure and trade flows of these sectors. For the transport sector, the demand and manufacturing volumes of Evs for each country is derived from (IEA, 2020) and Transport Environment, 2017, respectively, while the manufacturing volumes of batteries by country are based on IEA (2019a) and base year prices for Evs and batteries on Fragkiadakis et al. (2020). Combining these costs with the manufacturing volumes, the production of Evs and batteries are estimated in economic terms. Then, we used (Fries, 2017) to determine the inputs required to produce Evs (equipment, metals, plastics, etc.), which have a different cost structure relative to ICEs. Finally, we force the production of Evs and conventional to sums up to the GTAP sector 43. “Manufacture of motor vehicles, trailers and semi-trailers”. A similar process was developed for PV and wind turbines, with data on manufacturing volumes from Navigant Research (2017) and Freiburg (2018), sales from IEA (2019b), production cost from Clean Energy Manufacturing Analysis Centre (2016) and cost structure inputs from Garrett-Peltier (2016), and IRENA (2020). The above data are consistently integrated in GEM-E3-FIT to produce balanced Input-Output tables that represent the low-carbon technologies as separate sectors.
Representation of Hydrogen
The new GEM-E3-FIT model version represents the production and demand of green hydrogen, which is triggered by ambitious climate policies (e.g., high carbon pricing). In line with recent literature (European Commission, 2018; van Soest et al., 2021), hydrogen is assumed to be produced mostly from renewable-based electricity. Green hydrogen is mostly used in sectors which are difficult to be fully electrified, e.g., in steel making (hydrogen-based Direct Reduced Iron-DRI), in chemicals and other industries, and in specific transport segments (including road freight transport, navigation, aviation). The production of hydrogen has been inserted as a separate production sector in GEM-E3-FIT, in the same way as the manufacturing of low-carbon equipment (see above). The inclusion of green hydrogen enables GEM-E3-FIT to reach very ambitious decarbonization targets, like those outlined in the Paris Agreement, as it offers a new, important mitigation option to decarbonize hard-to-abate and hard-to-electrify sectors like steel making and freight transport. The calibration of hydrogen production was based on the techno-economic assumptions from the EC, Reference scenario 20203.
Representation of R&D and Technology Progress in GEM-E3-FIT
Low-carbon innovation and economies of scale play a key role in reducing low-carbon technology costs (Verdolini et al., 2018). Therefore, technology progress is endogenously represented in GEM-E3-FIT depending on learning by doing, public and private R&D expenditure and spill-over effects. The learning by doing component corresponds to the productivity gained through cumulative production (i.e., learning from experience and economies of scale) for low-carbon technologies with learning rates from Paroussos et al. (2019). The R&D learning rate indicates the reduction in costs for each doubling of cumulative R&D expenditure, triggered by accelerated innovation dynamics.
In conventional CGE modeling, productivities are set exogenously in Baseline scenarios, while in the new GEM-E3-FIT version, total factor productivity (TFP) includes an endogenous and an exogenous part. The former represents innovation-induced endogenous growth and is composed of: (i) learning by doing, (ii) learning by research (public and private R&D), (iii) knowledge spillovers, and (iv) the human capital stock measure. Each firm decides to spend on R&D to maximize its profits whereas public R&D is set exogenously. R&D expenditures generate a stock of knowledge that is linked to productivity growth, through the following equations, where is the optimal demand of firms for R&D, is the value share of R&D expenditures in production costs, Qj represents total sales of the firm, PQj is selling price and PRD is the unit cost of R&D.
Learning by doing and learning by research increase TFP in the low-carbon producing industrial sectors (Equation 5), where Yj, t represents the production in the case of learning by doing and the R&D expenditures in the case of learning by research and bbtec is the corresponding learning by doing or learning by research rate of technology tec that is linked one-to-one with the firm j.
Each sector optimizes resource allocation in R&D simultaneously with decisions about acquiring capital, labor, energy, material, based on its production function and the share of R&D expenditures in intermediate demand. The R&D expenditures accumulate in a knowledge stock and improve the quality and reduce the costs of the produced goods and services. As resources are limited in the CGE framework, R&D expenditures may exert a crowding out effect on investment temporarily, but in the longer term, the innovation-induced productivity growth implies more efficient use of economic resources inducing long-term growth. GEM-E3-FIT differentiates between public and private R&D, as they have different nature with the former focusing on basic high-risk research and novel, immature technologies with uncertain market value (Wene, 2008). In contrast, private R&D is closer to industrial activities and is commonly directed to mature technologies with limited risk (Paroussos et al., 2019).
Literature indicates that knowledge is diffused to other regions and sectors with knowledge spillovers affected by geographical proximity, distance to technological frontier, absorptive capacity, human capital, property rights policy, etc. (Verdolini et al., 2018). Conventional CGE models capture spillovers only through the exchange of efficient products and trade. In addition to this, GEM-E3-FIT includes technology transfer matrices based on patent citation data, linked to absorptive capacity, with data from the EU and national Patent offices and R&D expenditure on low-carbon technologies (IEA, 2019b).
Knowledge spillovers are represented as positive externalities leading to higher productivity of R&D expenditure. Cross-sectoral and cross-country spillovers are proxied by applying the bilateral imports shares to R&D expenditures by country to approximate the knowledge absorption from the innovations produced in other countries. Productivity generated through R&D is diffused to other sectors and countries according to a patent citation4 matrix approach with spillovers calculated in Equation (6).
Public R&D increases the global stock of knowledge (perfect spillovers), while private R&D is diffused partially (through knowledge spillovers), reflecting Intellectual Property Protection, costly replication of patents, obstacles for knowledge diffusion and potential limitations in infrastructure, human capital, institutions, regulation, industrial and innovation base (Paroussos et al., 2019). Table 1 includes the learning by doing and R&D rates for clean energy technologies used in GEM-E3-FIT, as described in Fragkiadakis et al. (2020) based on a wide literature review.
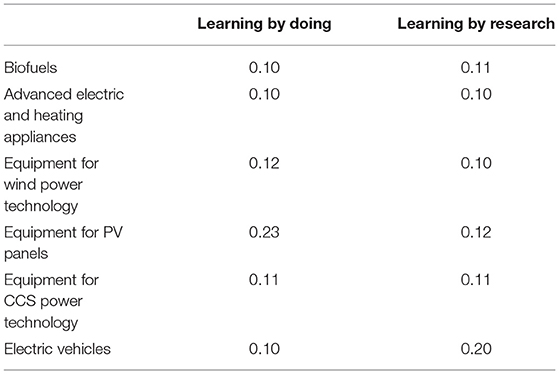
Table 1. Learning by doing and R&D rates used in GEM-E3-FIT.
The enhanced GEM-E3-FIT version includes an enhanced representation of the complex interactions and dynamics between low-carbon R&D, climate policies, and uptake of clean energy technologies. The 2DEG scenario results in additional capacity investment in low-carbon technologies (e.g., in solar PV) to replace the use of coal and gas in electricity production. This leads to additional demand for PV equipment, which should be manufactured by the specific sector, which is represented in GEM-E3-FIT. Depending on the local content of the PV manufacturing (which is based on data and is described above), the additional demand is directed to either domestic production or imported PV equipment, with endogenous bilateral trade flows depending on PV cost development by region and initial data. In each country, a production function links PV production with inputs from capital, labor, energy, materials (intermediate inputs), and R&D with R&D expenditure derived from IEA (2019b) statistics for all low-carbon technologies. The increased R&D expenditure leads to higher productivity (TFP) for the PV equipment sector through the learning by research rate, while the increased PV manufacturing also improves the sectoral TFP through the learning by doing rate.
Representation of Labor Markets
GEM-E3-FIT represents imperfect labor markets, simulated by an empirical labor supply equation that links wages and unemployment through a negative correlation. To adequately capture real-world conditions in labor markets, GEM-E3-FIT represents involuntary unemployment, moving beyond conventional CGE modeling assuming perfect labor markets. GEM-E3-FIT represents labor market imperfections and frictions, so that employees enjoy a premium on top of the wage rate that would correspond to equilibrium between potential labor supply and labor demand. The premium leads to a displacement to the left of the potential labor supply curve, which corresponds to effective labor supply, with equilibrium unemployment determined as the difference between potential and effective labor. In GEM-E3-FIT the efficiency wage approach (Shapiro and Stiglitz, 1984) is selected to represent involuntary unemployment because of its empirical validation and simplicity, assuming a negative correlation of unemployment levels with wages.
Climate policies have differentiated impacts across skills and can cause a mismatch between labor demand and supply for specific skills. Conventional CGE models do not differentiate between skills and assume that labor markets are fully flexible, so that workers can easily migrate to new jobs and industries and are therefore not well-suited to assess the skill impacts of policies. To capture these effects, GEM-E3-FIT has been expanded with a representation of five distinct labor skills combined with the endogenization of households' decision for education that influences the level of its future skills and wages. The five skill levels correspond to GTAP classification: unskilled workers, service and shop workers, technicians, clerks and managers.
GEM-E3-FIT represents labor productivity differentials across countries and labor skills through modeling the links between human capital, knowledge spillovers and absorptive capacity. These affect the growth potential of new high value-added activities requiring increased labor skills and tertiary education. The optimal schooling years are decided by the households depending on the interplay between higher skills (and wages) obtained from tertiary education and education costs, including the cost of schooling and the lost income during schooling years. Households decide on the optimal amount of education based on wage and unemployment rate differentials between different skill levels. The choice on education affects the number and skill distribution of the working age population that in the period t is added to the labor force. For each skill category the demand-supply mismatch results into a skill specific unemployment rate. The model assumes full labor mobility across sectors for each skill type. The supply of each labor skill is determined via an empirically determined wage curve linking wages with unemployment rate (with a wage elasticity of −0.1) consistent with the efficiency wages approach described above.
Representation of Policy Instruments
Various energy and climate policy instruments are represented in GEM-E3-FIT. Policies are analyzed as counterfactual scenarios and are compared against the Business-as-Usual scenario. Policies are evaluated through their impact on growth, employment, income distribution, competitiveness, and welfare. GEM-E3-FIT can assess the impacts of market-oriented instruments, such as carbon taxes and investigates market-driven structural changes, as well as the re-structuring of economic sectors, income and re-location of industrial activities induced by climate policies (Paroussos et al., 2015). The model can support the analysis of social and distributional effects of climate, energy and economic policies, both among countries and among income classes within each country (Fragkos et al., 2021). GEM-E3-FIT can assess the allocation of climate efforts over different countries and sectors with subsequent effects on growth, capital, and labor allocation as well as compensating measures to alleviate negative impacts on vulnerable regions and households.
Climate policies would drive the expansion of renewable energy, energy efficiency and electrification of energy services. GEM-E3-FIT includes several mitigation options, including a variety of renewable technologies, Evs, advanced biofuels, heat pumps, building retrofits, CCS, fuel substitution toward low-emission energy carriers and uptake of efficient equipment. The model endogenously decides on the optimal mix of mitigation options to achieve the climate target, choosing first the options with lower abatement costs. The uptake of specific technologies depends on the availability of other mitigation options, i.e., competition between biofuels and EVs to decarbonize transport. GEM-E3-FIT captures the complex interlinkages among sectors and mitigation options, e.g., the uptake of EVs depends on the provision of green and cheap electricity from the electricity sector.
GEM-E3-FIT can support analysis of structural features of growth related to low-carbon innovation and technology and evaluate the socio-economic implications. It puts particular emphasis on:
• Assessing climate-related market instruments, such as energy or carbon taxes, subsidies to low-carbon technologies, regulations, efficiency standards, etc.
• Exploring the distributional consequences of policies, including social equity and employment for vulnerable regions and low-income classes.
• Assessing policy instruments related to low-carbon innovation, labor market or industry and their interactions with decarbonization.
• Analyzing measures to mitigate negative competitiveness impacts of climate policies on trade-exposed industries, e.g., CBAM, changes in industrial tariffs, etc.
Scenario Descriptions
The study analyses two scenarios with different climate policy ambition.
The Reference scenario is a projection for the global economic and energy system evolution based on historical and current trends related to activity growth, technical progress, fossil resources, and climate policies. Socio-economic developments of the Reference scenario (population and GDP) replicate (IEA World Energy Outlook, 2019) assumptions and are consistent with the SSP2 scenario widely used by the IPCC and the climate modeling community. The GDP projections incorporate the short-term impacts of COVID-19 on activity and investment patterns, by changing GDP data for 2020 and short-term projections until 2023 based on Rochedo et al. (2021) and World Bank (2021).
The Reference scenario assumes that already adopted climate policies, including the Nationally Determined Contributions (NDCs) -as submitted by November 2020- are implemented by 2030 (Table 2). After 2030, no additional efforts to reduce emissions is assumed for non-EU countries. In modeling terms, this means that the carbon prices resulting from NDC policies in 2030 are kept constant until 2050 demonstrating lack of climate ambition, while most countries do not establish carbon pricing regimes (with the exception of EU ETS). Overall, the Reference scenario of GEM-E3-FIT is comparable to respective scenarios developed in model inter-comparison studies, like (McCollum et al., 2018) and (van Soest et al., 2021). The costs of power generation technologies are calibrated to IRENA (2020), while technology progress is included for low-carbon technologies.
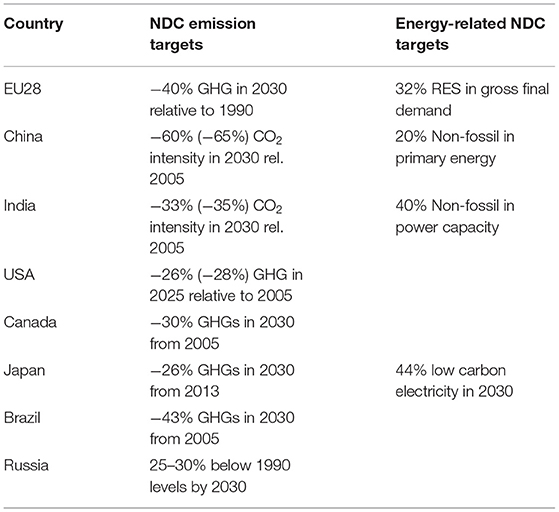
Table 2. NDC emission targets included in the Reference scenario (submitted until 2020).
The 2DEG scenario is also examined, which is a scenario consistent with the 2°C Paris Agreement goal. In line with (McCollum et al., 2018) and (IPCC, 2014), a global CO2 budget of 1,000 GtCO2 over 2010–2050 is used as proxy for the temperature target. A universal carbon price is implemented across regions and sectors from 2020 onwards to reach the cumulative CO2 budget by 2050, ensuring that the well-below 2°C Paris goal is met. The carbon price is increased up to the level where the global emission target is met. As the stringency of the mitigation effort increases constantly, the global carbon price grows from 80$/tnCO2 in 2030 to about 350$/tnCO2 in 2050, in line with (McCollum et al., 2018). The contribution of each country in global emission reductions is determined by equal marginal abatement costs and uniform carbon price across countries. Thus, 2DEG represents the solution that meets the global carbon budget constraint with the minimum costs through equalization of marginal abatement costs in regions and sectors. We assume that carbon revenues are recycled through the public budget. The 2DEG scenario requires a deep restructuring of the global energy and economic systems with massive uptake of low- and zero-carbon technologies and accelerated energy efficiency improvements. The transition is triggered by effective coordination of market players and actors (i.e., industries shifting to clean technologies, consumers changing behavior, policy makers implementing strong climate policies), the removal of non-market barriers, and technological innovation and uptake of variables renewables and storage facilitating electrification of end-uses.
Results
The section presents the energy system and socio-economic impacts of mitigation policies.
The Reference Scenario
Based on the global economic outlook implemented in GEM-E3-FIT Reference scenario, the global economy is projected to grow 2.7% annually until 2050, while the average annual growth for the EU is 1.5% in line with the official EU Aging report (European Commission, 2021b) as a result of aging population with the share of EU population above 65 years increasing from the current 20–50% in 2050. Among major economies, China and India will register high GDP growth rates of 4% and 6.1% annually over 2015–2050, with their share in global GDP increasing from 20% in 2020 to 30% in 2050 and China becoming the world's largest economy surpassing the EU and USA. The growth in developing economies is considerably higher relative to developed, with the share of the latter declining from 50% in 2020 to 37% in 2050 (Figure 3). Each country follows a different pattern of growth, with some based on the accumulation of capital and knowledge, others on enhanced competitiveness or on increasing labor supply. The outlook assumes that a sustainable growth path is adopted by countries where excessive surpluses or deficits are reduced. Population projections are derived from United Nations (2019), showing the global population will reach 9.7 billion by 2050, increasing on average by 1.1% annually over 2020–2050. The global unemployment rate is assumed to decline from 5.5% in 2015 to 4.6% in 2050 converging toward—but not reaching- the natural rate of unemployment.
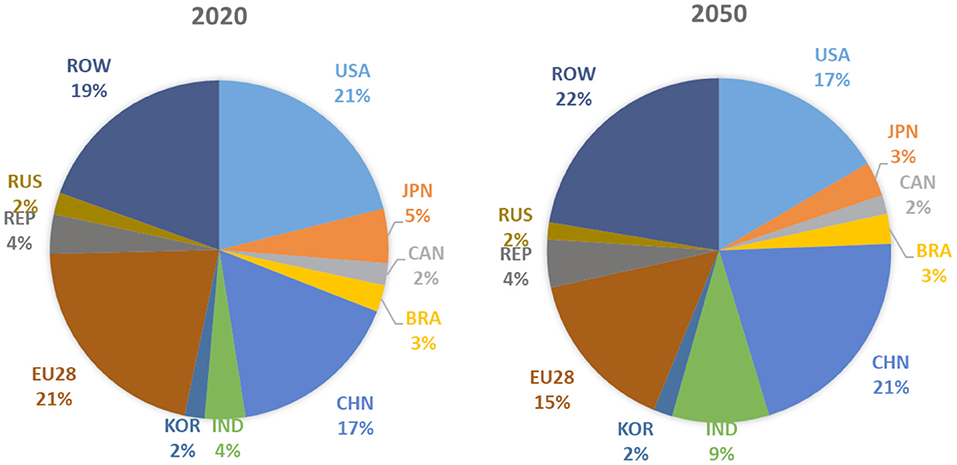
Figure 3. Share of major economies in global GDP in 2020 and in 2050.
We assume that the global economy will become increasingly interconnected over the coming decades through a steady increase in the ratio of trade-to-GDP, which is induced by the gradual tariff reduction, diminished transportation costs and digitalization of the economy. In terms of sectoral production, the world economy will become more services oriented and go through a process of dematerialization (less use of primary raw materials, increased resource and energy efficiency, lower share of energy-intensive manufacturing). Services will dominate global value added, whereas the primary sector share continues to decline following historical trends and increased standards of living in developing countries.
In the Reference scenario, economic activity and emissions are expected to gradually decouple (Figure 4), following historical trends and adopted climate policies and NDCs. The global emission intensity will decline, as GDP grows at a faster pace (2.7% annually by 2050) than emissions (0.7% annually) due to increasing deployment of renewable energy, improving energy efficiency, reduction in low-carbon technology costs and fuel switching. Full decoupling of GHG emissions and economic growth is evident in major developed economies (USA, Japan, and Canada) as a result of their climate policies and ambitious NDCs. The energy intensity of GDP is projected to decline by 1.3%/year on average implying that energy resources are used more efficiently, through dematerialization of the economy and uptake of energy efficient equipment, technologies and energy carriers. The emission intensity of primary energy also improves because of increasing deployment of low-carbon technologies.
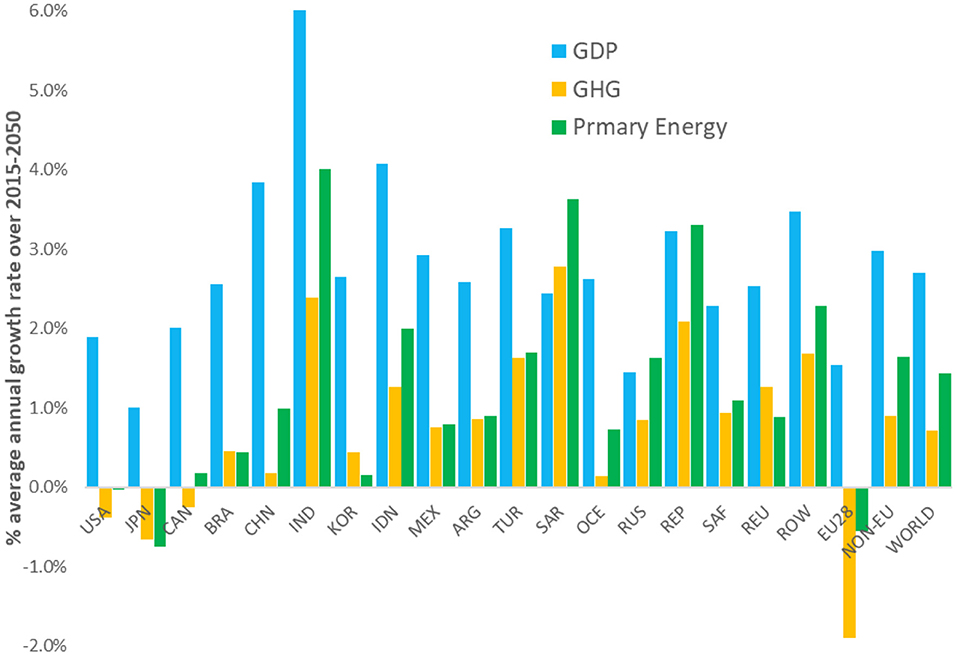
Figure 4. Evolution of GDP, emissions, and primary energy in the Reference scenario.
The main policy driver used in Reference scenario to meet the NDC targets is the carbon price, which is differentiated by region/country. The level of the carbon price demonstrates the policy effort required to meet the NDC targets, and thus it is higher for the EU, USA and Canada (increasing to more than €45 by 2030), while other countries (e.g., India, Saudi Arabia, Russia) have zero carbon price indicating that the NDC constraint is not binding5 and is achieved without the need for further policies.
Emission Impacts of Global Decarbonization
The Reference scenario would lead to modest increase of global GHG emissions from 46 Gt in 2015 to 59 Gt in 2050, driven by GDP and population growth, rising standards of living in developing economies and the lack of ambitious climate policies. These result in increased fossil fuel consumption in the energy, transport and industrial sectors which is not in line with Paris goals to limit global warming to well-below 2°C and pursue efforts toward 1.5°C (van Soest et al., 2021). In contrast, the 2DEG scenario assumes that the goal of staying well-below 2°C is met through a global carbon price to constrain global cumulative CO2 emissions over 2010–2050 to 1,000 GtCO2. The global carbon tax increases from 80$/tnCO2 in 2030 to about 350$/tnCO2 in 2050 reflecting the increasing mitigation effort and the limitations of low-cost abatement possibilities, mainly in sectors with limited mitigation options, like heavy industry and freight transport. High carbon prices would trigger large emission cuts in all regions and sectors, induced by increased uptake of low-carbon and energy efficient technologies and the gradual phase out of fossil fuels. The 2DEG scenario leads to a decline of global GHG emissions from Reference levels by 25% in 2030 and 72% in 2050, while the decline across economies ranges between 7–39% in 2030 and 35–79% in 2050. Highest reductions projected for developing economies with limited climate action in Reference scenario, including South Africa, Russia and India. Uniform carbon pricing leads to higher mitigation effort in developing economies, due to their higher carbon and energy intensities relative to developed countries and the lack of policy ambition in the Reference scenario. On the other hand, ambitious Reference climate policies, and low energy intensity of developed economies (EU, Japan) implies that the mitigation effort is relatively lower than the global average (Figure 5).
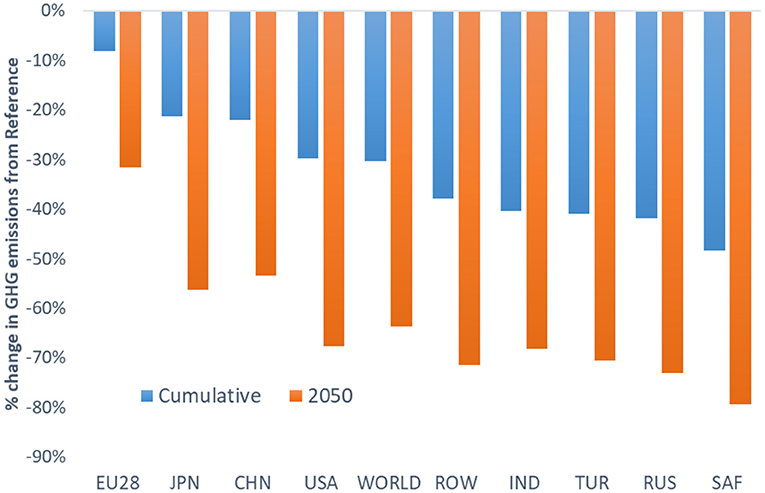
Figure 5. GHG emission reductions from Reference scenario across economies.
The distribution of the global GHG mitigation effort across gases and sectors is shown in Figure 6. More than 70% of the total mitigation effort is achieved through reducing CO2 emissions from energy combustion, while non-CO2 GHGs account for 23% of the effort and CO2 emissions from industrial processes represent about 5%. The electricity sector is the main contributor to emission reductions in most economies driven by the massive uptake of renewable energy (mostly PV and wind) that replace fossil fuel-fired power plants. The transport sector achieves large emission cuts largely driven by the expansion of Evs, efficiency improvements, modal shifts to less polluting modes and deployment of advanced biofuels in freight transport and aviation. Large emission reductions are also projected for buildings and industries, driven by fuel substitution, energy efficiency improvements, electrification of end-uses and the uptake of green hydrogen.

Figure 6. Distribution of the GHG mitigation effort in the 2DEG scenario by sector.
Energy efficiency improvements in end-use sectors (buildings, industries, transport) play a crucial role in achieving the Paris mitigation goal, as they contribute to about 55% of the cumulative emission reduction achieved by 2050, while carbon intensity reductions account for 45% of the total mitigation effort (triggered by the increased uptake of renewable energy sources). The 2DEG scenario shows a rapid decoupling of GHG emissions from economic growth, with large emission reductions in all countries combined with GDP growth (Figure 7) even in countries with high emission growth in the Reference scenario like India, Saudi Arabia, and Indonesia. The decoupling is driven by the large-scale expansion of renewable energy in the electricity sector and in energy end-uses, electrification of energy services, extensive energy efficiency improvements, the uptake of CCS and fuel switching to low-emission fuels, including advanced biofuels and hydrogen.
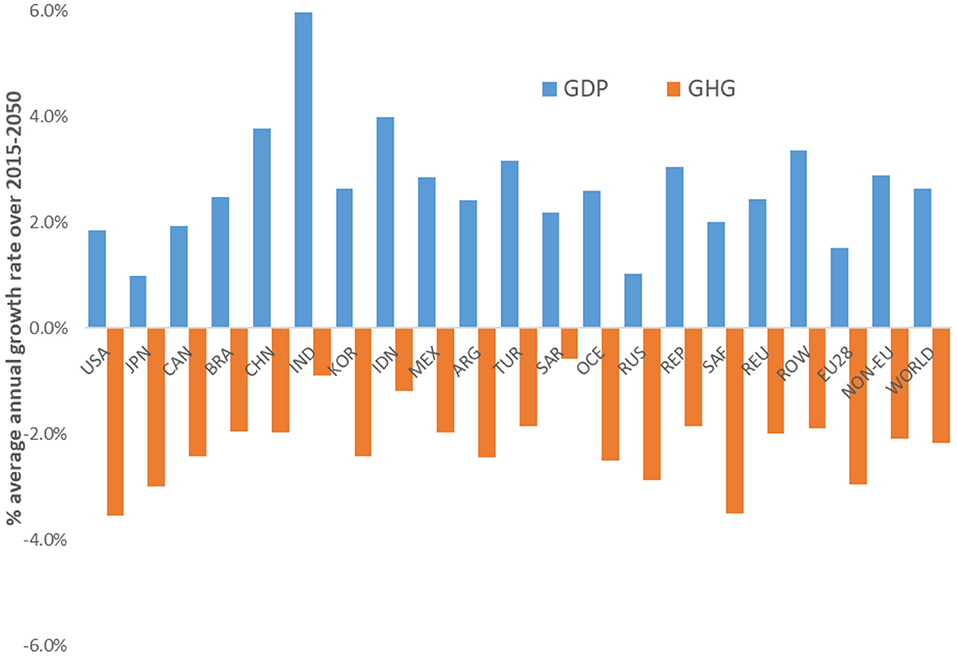
Figure 7. Evolution of GDP and GHG emissions in major economies in the 2DEG scenario.
Impacts on Energy System Restructuring
In the 2DEG scenario, low-carbon technologies are massively deployed to substitute fossil fuel use, while their costs improve because of accelerated learning-by-doing and economies of scale. The wide coverage of low-carbon options in GEM-E3-FIT (renewable technologies, Evs, advanced biofuels, energy efficiency, electrification, heat pumps, hydrogen, CCS) enables a rigorous assessment of interlinkages between the alternative options (e.g., electrification and RES-based electricity) and can assess the complex energy system dynamics, innovation and uptake of low-carbon technologies. There are four major pillars to achieve decarbonization.
Restructuring of power generation toward low-carbon technologies, especially renewable energy, but also nuclear and CCS. The imposition of high carbon prices would drive a massive decline in coal-fired generation with the share of coal in global electricity production rapidly reducing from 39% in 2015 to 20% in 2030 and 1% in 2050. Gas-fired power plants continue to operate in the medium term and provide flexibility and balancing to the power system to enable massive expansion of intermittent RES. However, the increasing carbon price after 2030 renders the continuation of gas-fired plants uneconomical in most regions, and thus the share of gas-fired generation declines from 26% in 2030 to 8% in 2050 (Figure 8). After 2040, the required balancing and flexibility services are increasingly provided by Combined Cycle gas-fired plants combined with CCS. Some countries expand their nuclear capacities (Japan, Korea, China, and Russia), but the massive uptake of renewable energy is the most important option to transform the electricity supply sector, with the share of PV and wind increasing from 5% in 2015 to 46% in 2050. Wind and PV benefit the most as a result of accelerated technological progress through learning-by-doing, and their increased cost competitiveness vis-à-vis conventional power plants, combined with limitations in hydroelectric potential and nuclear power in several major emitters. Bioenergy combined with CCS can produce net negative emissions, but its deployment is limited until 2050 mostly in countries targeting near-zero emissions to offset emissions from hard-to-abate sectors. The expansion of renewable energy differs across countries, with the RES share in primary energy demand projected to increase from the current global average of 14% to more than 50% in several economies, which have high market potential and concrete plans for expansion of renewable energy, ambitious climate policies, and limitations in other options, like nuclear, CCS and hydro power. The system transformation is even more pronounced in the EU, with a rapid coal phase-out by 2040, massive deployment of PV and wind (onshore and offshore) and a nearly emission-free electricity production before mid-century.
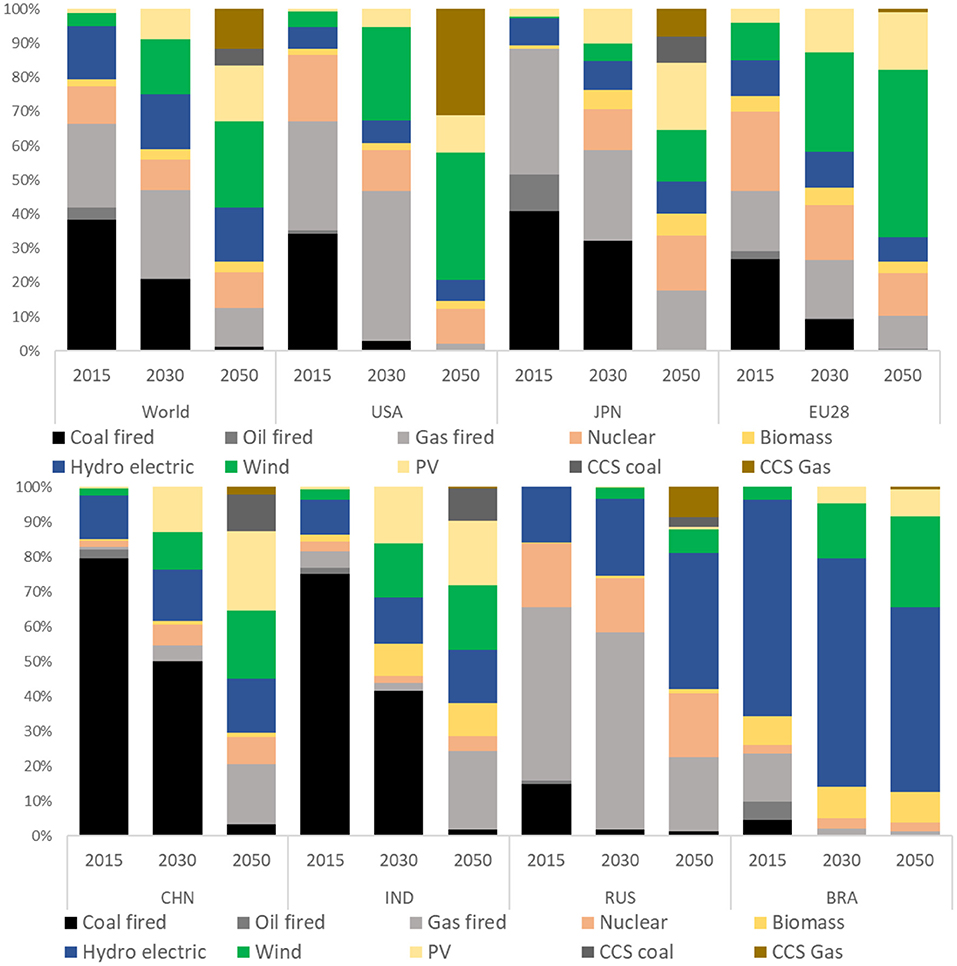
Figure 8. Power generation mix in major economies in the 2DEG scenario.
Electrification of energy services. As the power sector decarbonizes by 2050, the increased electricity use in mobility, heating, and industries becomes an increasingly important strategy to reduce emissions (Figure 9). Electrification of energy uses in buildings and industries has been a long-standing trend, as appliances, lighting, refrigeration, air conditioning, industrial uses and other services are already provided primarily by electricity. This trend is projected to accelerate in 2DEG scenario driven by high carbon pricing that penalizes the direct use of fossil fuels; the share of electricity in global final energy consumption is projected to increase from 20% in 2015 to 36% in 2050 (22–54% across countries). Electricity increasingly penetrates in buildings and in industrial processes, such as raising steam and direct process heat, while the uptake of Evs offers a key option to decarbonize road transport driven by technological progress in batteries and high carbon pricing. Electrification combined with a low-emission power mix is a prominent strategy in most G20 economies, as it provides a low-cost strategy to decarbonize end-use sectors, including industries, buildings and transport.
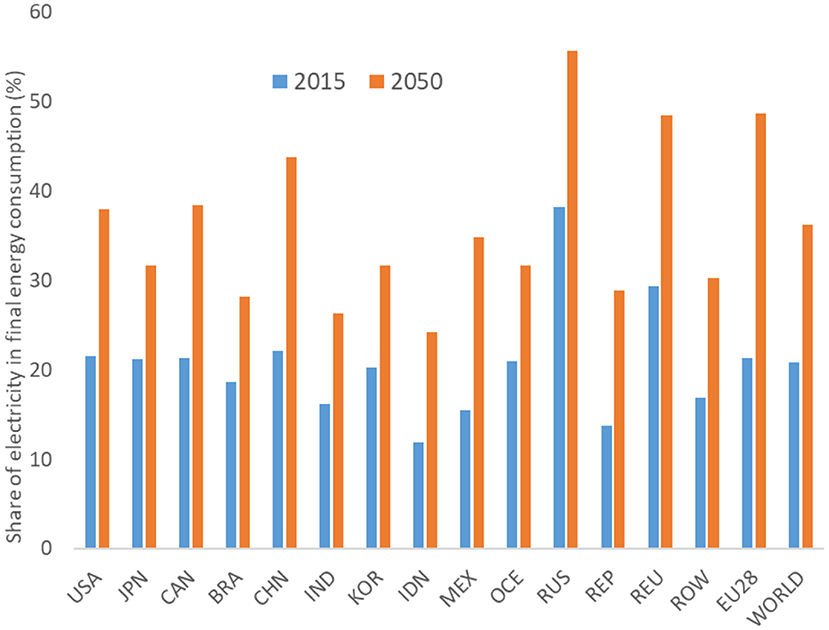
Figure 9. Share of electricity in final energy consumption in the 2DEG scenario.
Energy efficiency provides a means to deliver the required energy services, while reducing energy needs and associated CO2 emissions. In the 2DEG scenario, the global energy intensity per unit of GDP would decline by about 54% over 2015–2050 (Figure 10). The reduction in major economies ranges between 33% (in large hydrocarbon producers like Russia) and 73% in fast-growing economies like China and India, driven by the fast turnover of their capital stock and their currently high energy intensity. Globally, energy intensity is projected to decline by 2.2%/year on average over 2015–2050, showing a clear acceleration of historical trends of about 0.8% annual reduction. This is driven by: (i) substitution toward more efficient energy carriers (i.e., electricity instead of oil products), (ii) stock turnover encompassing uptake of energy-efficient equipment and appliances, (iii) investment in thermal insulation of buildings especially in colder countries, (iv) high carbon pricing that increases the cost of energy services, and (v) lifestyle changes, e.g., transport modal shifts toward less-polluting modes. Reduced energy consumption implies lower requirements for energy supply investment (e.g., power plants, oil refineries), thus saving emissions. Developing economies have a high potential for energy savings, due to: (a) their current high energy intensity as they largely depend on the inefficient use of coal, (b) their high activity growth enabling fast turnover of equipment stock, and (c) the projected changes in their economic structure away from energy-intensive manufacturing.
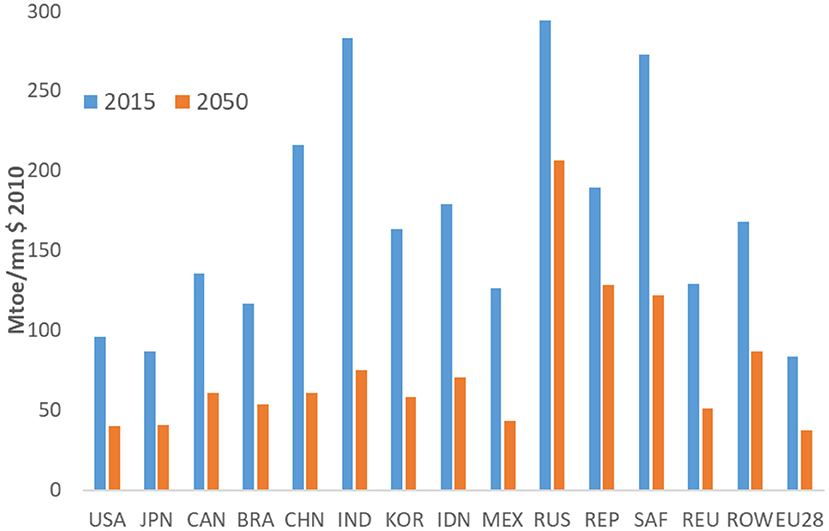
Figure 10. Development of energy intensity of GDP in major economies in the 2DEG scenario.
Reduced carbon intensity of energy fuels. The combination of renewable energy, energy efficiency and electrification can drive a substantial reduction of carbon emissions. However, as not all energy end-uses can be cost-efficiently electrified (e.g., high-temperature industrial applications, aviation, freight transport), low-carbon fuels should be deployed to decarbonize these sectors. Advanced biofuels can play a critical role in reducing emissions in transport modes, like aviation and navigation, while green hydrogen and synthetic fuels derived from RES-based electricity can be used in transport segments that cannot be easily electrified (i.e., heavy vehicles). However, the development of these fuels is costly as it requires new hydrogen production facilities -stressing also renewable energy potentials-, expansion of hydrogen refueling infrastructure hubs and radical changes in industrial processes (e.g., in high-temperature furnaces to decarbonize steel-making and other heavy manufacturing activities).
Macro-Economic Effects of the Low-Carbon Transition
The imposition of carbon pricing drives energy system transformation toward a more capital-intensive structure, with increased investment to renewable energy, energy efficiency projects, and Evs. Decarbonization would lead to increased upfront capital expenditures and lower energy purchasing costs in the long term. GEM-E3-FIT (as CGE model) assumes full and optimal use of available capital resources in Reference scenario under financial closure. Therefore, the reallocation of investment toward low-carbon, energy efficient technologies induced by high carbon pricing in the 2DEG scenario puts pressure on the capital markets and leads to “crowding-out” effects; firms and households finance their clean energy investment by spending less on other (non-energy) commodities and investment purposes.6
High carbon prices increase the cost of energy services for firms and households and hence production costs throughout the economy and have a depressing effect on consumption and GDP, which is partly alleviated by increased low-carbon investment. The Paris goals would have only a limited impact on economic activity with global cumulative GDP declining by 1.4% from Reference levels over 2020–2050 (Figure 11), even without quantifying the benefits related to avoided climate impacts, air quality and human health (Rauner et al., 2020). Many macroeconomic models that have computed the costs of decarbonization provide evidence of net mitigation costs; the modeling results reported in the IPCC 5th Assessment Report (IPCC, 2014) estimated global consumption losses of 2–6% in 2050 for scenarios limiting global warming to <2°C. Our model-based projection lies in the lower range of these estimates, due to the endogenization of technology learning and innovation which leads to reduced costs for low-carbon technologies and creates new industries for clean products (Fragkiadakis et al., 2020). In particular, the detailed representation of technological progress in GEM-E3-FIT implies that the imposition of ambitious climate policies in the 2DEG scenario would result in accelerated cost reduction for low-carbon technologies, as a result of both learning-by-doing (driven by large increases in the capacity of clean technologies) and innovation, as low-carbon R&D also increases in the case of high carbon and energy prices. The 2DEG scenario impacts on the low-carbon technology costs are shown in Figure 11, indicating the large cost reductions induced by ambitious decarbonization policies on wind, solar PV, EV batteries, and advanced energy-efficient equipment and appliances. Endogenous technical change would reduce the price effects from carbon pricing (as low-carbon and energy-efficient technologies become increasingly cheaper), thus mitigating crowding out effects in the CGE context and weakened competitiveness in international markets; thus, resulting in reduced mitigation costs projected by GEM-E3-FIT relative to IPCC estimates and conventional CGE models, which commonly show GDP and consumption losses of 2–6% in scenarios compatible with Paris goals.
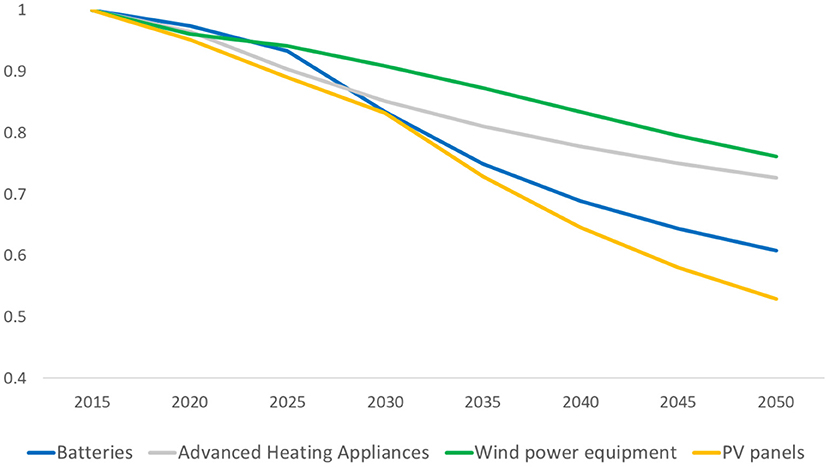
Figure 11. Low-carbon technology costs in the 2DEG scenario (indexed to 2015).
The economic impacts of 2DEG scenario differs across countries, largely depending on their economic structure, their position in international trade (especially for fossil fuels and low-carbon technologies) and the mitigation effort relative to Reference; GDP losses commonly increase when mitigation effort is higher. Macro-economic impacts also depend on assumptions about the costs and availability of mitigation options and country-level specificities (domestic energy production, system structure).
• Major fossil fuel exporters, like Russia, Saudi Arabia and Energy Producers, would face large negative economic impacts due to the reduced revenues from fossil fuel exports and their high carbon intensity per unit of GDP.
• Mitigation costs in large developing countries (China and India) are high, as the universal carbon price leads to higher relative mitigation effort for developing countries, which are negatively impacted due to their currently high carbon intensity and reliance on coal.
• The macro-economic impacts in developed economies are limited, on average <1% of their GDP. Mitigation costs are marginal in countries with low carbon intensities (EU, Japan) that already implement relatively ambitious policies in the Reference scenario. Countries can also benefit from increased low-carbon technology exports (e.g., wind turbines in Germany and Denmark) as the global clean energy market becomes significant.
To put scenario results into perspective, the global GDP growth rate remains high: the 2.70% yearly growth in the Reference scenario over 2015-2050 is marginally reduced to 2.62% in 2DEG. The Paris GDP impacts are minimal for major economies, with annual growth rates declining by 0.03–0.3% from Reference over 2015–2050, implying compatibility of decarbonization with robust economic growth.
Investment in low-carbon technologies and energy efficiency increase in the 2DEG scenario, which may pose challenges for identifying and directing available funds. This implies a potential “crowding-out” effect (as discussed), leading to a small reduction in global investment levels from Reference levels due to stresses in capital markets and declining economic activity. Looking at regional impacts, the limited GDP reduction in EU combined with the scale-up of investment for renewable energy, EVs and energy savings would lead to zero impact on investment volumes. In contrast, private consumption drops more than GDP in most economies, as production costs and prices increase due to carbon pricing and the reallocation of resources compared to Reference. Global private consumption declines by 2% from Reference by 2050, with the most pronounced impacts projected in large fossil fuel exporters. Figure 12 decomposes the changes in global GDP over 2030–2050 in 2DEG scenario compared to Reference into the main GDP components. The decline in consumption is the major factor influencing GDP reduction, as it accounts for more than 80% of GDP losses in 2DEG over 2030–2050. On the other hand, as described above the decline in investment is lower, as the increased investment in low-carbon technologies and energy efficiency counterbalance some of the investment losses due to reduced economic output. Lastly, the endogenous technical progress for low-carbon technologies has limited, but positive impacts on global GDP, as it reduces the costs faced by households and businesses to purchase new low-emission technologies and energy efficient equipment.
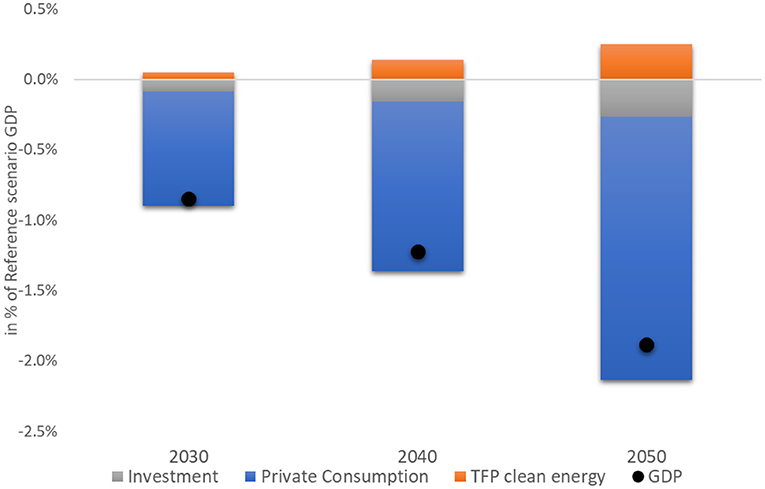
Figure 12. Decomposition of global GDP changes in 2DEG relative to Reference for 2030 and 2050. The contribution of each component reflects its change from Reference levels expressed as a share of GDP in 2030 and 2050.
The 2DEG scenario has limited impacts on aggregate employment, driven by two contradictory trends: on the one hand, declining economic activity tends to reduce employment; on the other, the economy moves toward a more labor-intensive structure as renewable technologies and energy efficiency have higher labor intensity on average compared to fossil fuels (Fragkos et al., 2018). The trade-off between jobs lost in some sectors and jobs creation in others would lead to a modest impact on economy-wide employment (Figure 13). As outlined in OECD (2017), the job effects projected by various studies depend on the modeling approach (neo-Keynesian vs. neo-classical), the climate policy ambition, the way to recycle carbon revenues, the flexibility of labor markets and the availability of labor with the right skill set for the emerging green sectors (to avoid mismatch between labor demand and supply).
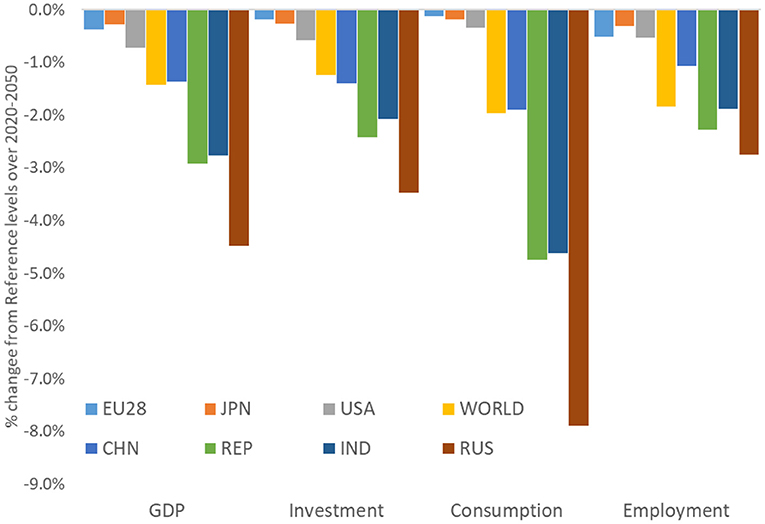
Figure 13. Macro-economic impacts of the 2DEG scenario in major economies.
In GEM-E3-FIT, global decarbonization would lead to limited employment effects, with global jobs declining by 1.2% and 1.8% compared to Reference scenario in 2030 and 2050, respectively. Developed economies would face minimal impacts, as negative job effects from reduced GDP are to a large extent counterbalanced by the creation of green jobs (Karkatsoulis et al., 2016), which include jobs in the manufacturing of low-carbon equipment, thermal insulation of buildings, construction and O&M of RES plants, biofuels production and in biomass feedstock supply. Recent analyses (IEA, 2019a; Fragkos et al., 2018) show that RES technologies are more labor intensive than fossil fuels when jobs in the entire chain of related activities are considered; thus, expansion of low-carbon technologies that replace fossil fuels tends to mitigate the adverse impacts of high carbon pricing on labor markets.
The mitigation effort of the 2DEG (relative to Reference) differentiates by country, with impacts on competitiveness and international trade (Paroussos et al., 2015). The balance of trade of major energy exporters (Russia, Saudi Arabia) deteriorates driven by reduced fossil fuel exports. In contrast, China and the EU benefit from a decline in fossil fuel imports and from increased exports of low-carbon equipment, mainly solar PV (China) and wind turbines (EU). The trade impacts also arise mostly from the fact that in the reference scenario, the climate ambition of the EU is relatively higher compared to major non-EU economies as the European NDC is more ambitious. In contrast, in the 2DEG scenario a universal carbon price is imposed, so that the ambition is the same across all countries, but it increases (from Reference scenario) at a lower rate in the EU, as shown in Figure 5. This means that production of the EU energy intensive industries (Basic metals, Chemicals and Non-metallic minerals) is increased by 7.4% in the 2DEG scenario as compared with reference over 2020–2050. The leakage rate in production of energy intensive industries is estimated at 22% (23% in ferrous metals, 16% in non-ferrous metals, 33% in chemicals and 9% in non-metallic minerals). In addition, the net exports (trade balance) of the EU energy intensive industries are improved by 0.5% of GDP in cumulative terms over 2020–2050. Despite the higher production of European energy intensive industries, the higher climate ambition in 2DEG scenario in all countries (Figure 5) implies a decrease in GHG emissions as the carbon intensity is improved by about 35% (mainly due to the fuel substitution away from fossil fuels).
Carbon pricing impacts negatively the fossil fuel sectors, due to the shift toward low-carbon energy sources and the more efficient use of energy; thus, the global output of fossil fuel supply sectors would decline by about 45% from Reference in 2050. The electricity sector output modestly declines by 4% in 2030 (due to higher energy efficiency), but in the longer term it increases by 5% relative to Reference scenario to provide the required electricity for mobility and heating services, but also to support the emergence of green hydrogen. The output of energy intensive industrial (EITE) sectors is projected to decline by 2.5% from Reference levels by 2050 due to their carbon-intensive production structure. In these sectors, energy costs represent a high percentage of their total costs and thus carbon pricing leads to high increases in production costs. The reduction is limited in metals sectors, as they feature in the production chains of low-carbon technologies and energy-efficient equipment. The 2DEG scenario has limited impacts on the output of services, as the sector is characterized by low carbon intensity per unit of output. Energy efficiency improvements require construction services directed to building retrofits and renovation; thus, the construction sector registers only marginal losses despite reduced GDP. Large positive impacts are projected for low-carbon manufacturing, triggered by the increased demand and production of Evs, batteries, advanced biofuels, wind turbines, and solar PV (Figure 14).
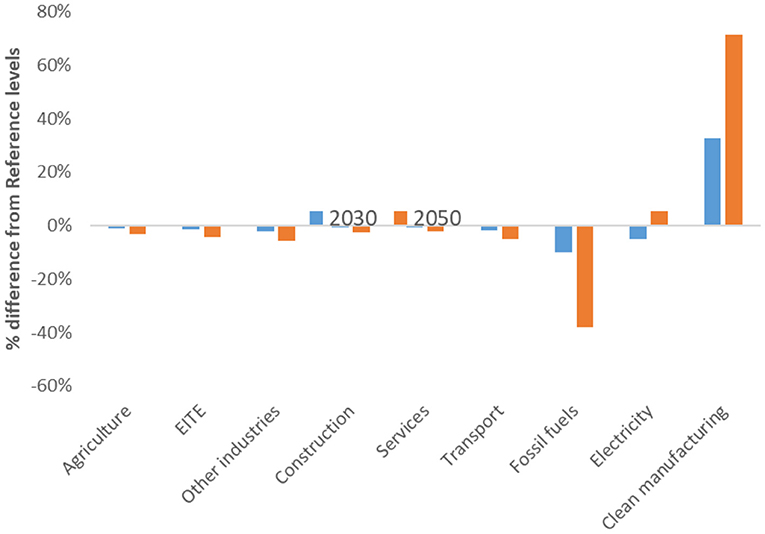
Figure 14. Impacts of 2DEG scenario on global production by main sector.
Model-based results show that decarbonization leads to large structural shifts in employment across sectors (Figure 15). Negative job impacts are found in fossil fuel supply and EITE industries, while additional jobs are created in low-carbon manufacturing, and the effects are ambiguous and limited in other sectors. Decarbonization leads to positive employment effects in the electricity and mechanical and electrical engineering sectors to manufacture and develop renewable energy and energy efficiency technologies, including PV, wind, EVs, energy-efficient equipment, and green hydrogen. In contrast, high carbon pricing directly leads to job losses in coal, oil and gas supply sectors and increases the energy costs thus reducing the output and employment in EITE sectors, including cement, steel, and chemicals. The profound changes in labor markets induced by decarbonization require extensive re-allocation of workforce and skill levels combined with policies to ensure that the workforce has the required skills for the green transition minimizing mismatches between labor demand and supply. The impact on services is driven by reduced GDP; the reduction in service-related jobs is limited in relative terms, but it affects millions of people, as services account for about 45–50% of worldwide jobs.
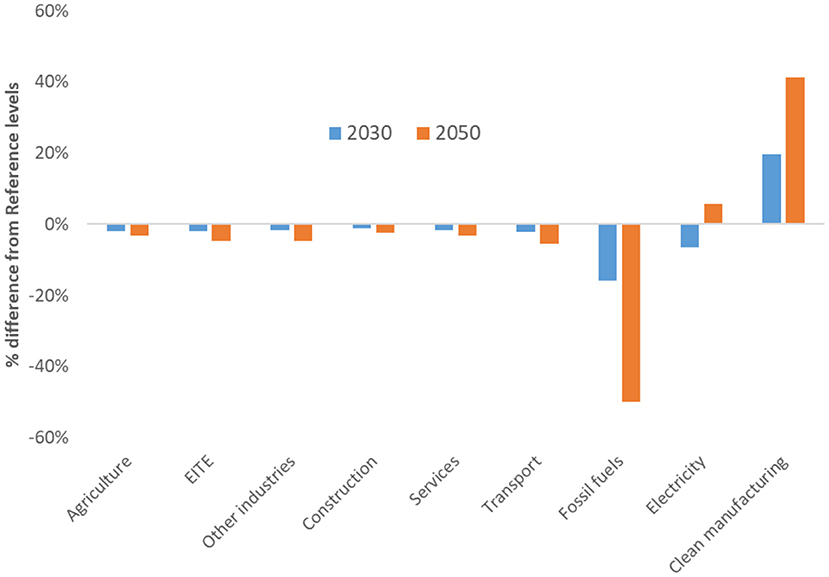
Figure 15. Impacts of 2DEG scenario on global employment by main sector.
Jobs in the electricity sector are impacted by decarbonization. In the medium-term, energy efficiency drives a reduction in electricity demand and hence in electricity sector output and jobs. However, in the longer term, the increasing electrification of end-uses and the uptake of green hydrogen would lead higher power requirements with electricity jobs increasing by 6% relative to Reference levels in 2050. Sectors providing inputs to mitigation strategies, including construction (renovation of buildings and installation of renewable technologies) and agriculture (production of advanced biofuels) would benefit from decarbonization. In addition to the effects on sectors directly related to energy transformation, decarbonization would also impact workers at various levels of the supply chain (indirect effects) or in sectors that observe a knock-on impact through multiplier effects (induced effects). Larger impacts will be felt within, rather than between sectors implying changes to current jobs and skills requirements (OECD, 2017) which may require re-training or topping up of skills (e.g., architects integrating energy-efficient materials and technologies in building design), while existing skills may be used to shift between sectors (e.g., workers from oil & gas using welding and outfitting skills within the wind sector).
The high decarbonization effort in the 2DEG scenario results in limited deviations in the composition of global and national value added with increased share of high-skill occupations, while the share of low skilled decreases. The transition to a low-carbon economy increases the demand for high skilled labor (e.g., managers, engineers, technicians), which receives relatively higher wages. The transition involves replacement of labor-intensive and low skill occupations, like coal mining, oil and gas extraction, by skill-intensive processes (Fragkos and Paroussos, 2018) related to the research, design, manufacturing, development and installation of low-carbon technologies. The model-based analysis shows large job losses in fossil fuel industries, while gains are projected in electricity sector and in clean energy development and manufacturing. These activities demand higher skill levels relative to fossil fuel sectors, including occupations like manufacturing and software engineers, project designers, advisors and other professional or managerial positions. The GDP reduction in the 2DEG scenario results in lower labor demand that increases unemployment across all occupations (Figure 16). The sectors that serve the low-carbon transition (i.e., construction, electricity, clean energy) have limited impacts in labor demand, but register a higher share on technicians and managers occupations as compared to carbon intensive sectors and fossil fuel industries. This means that unskilled occupations suffer from a higher increase in unemployment levels due to decarbonization, as compared to technicians or other skills required for the transition.
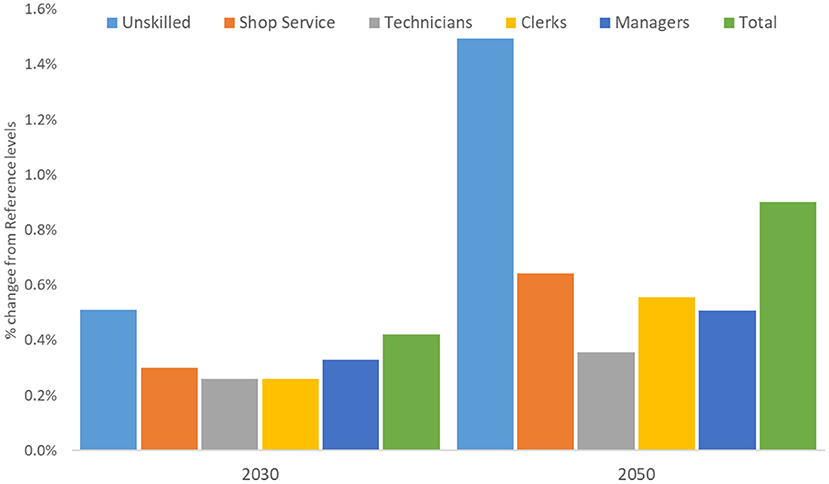
Figure 16. Changes in global unemployment by occupation in 2DEG compared to Reference.
Discussion
The Paris Agreement has been adopted by 196 Parties at COP21 in Paris and its goal is to limit global warming to well-below 2, preferably to 1.5°C, compared to pre-industrial levels. Research has shown that to achieve the Paris goals, global emissions should peak as soon as possible and decline rapidly thereafter to achieve climate neutrality by mid-century. This requires an unprecedented effort to transform the global energy demand and supply systems with a rapid reduction of fossil fuel use combined with accelerated expansion of renewable energy, electrification, energy efficiency and low-carbon fuels. These changes will transform our economies through multiple channels affecting sectoral production, labor and capital markets, consumption patterns, investment dynamics, trade flows and international competitiveness. The socio-economic impacts of climate policies have been extensively analyzed using macroeconomic models, which have provided useful insights on policy impacts on economic activity, investment, and other macro-economic variables. However, these models often do not represent in detail the energy system and technologies, technology progress, low-carbon innovation and spillovers and fail to include real-world modeling of labor and capital markets.
In this study, we use the well-established GEM-E3-FIT model to improve its simulation capabilities and consistently capture the complex socio-economic impacts of decarbonization. The main modeling improvements, compared to conventional CGE modeling, include: Enhanced representation of energy system (e.g., electricity supply, energy efficiency, transport by mode and technology, electrification), detailed representation of sectors manufacturing low-carbon technologies, endogenization of technology progress based on learning by doing and learning by R&D, enhanced modeling of labor markets, including skill levels, and Improved representation of energy and climate policy instruments. The enhanced energy system representation enhances the credibility of CGE modeling for climate policy analysis as the substitution patterns in energy supply and demand are based on bottom-up modeling of technologies rather than restrictive functional forms. This is increasingly important when modeling ambitious emission reduction targets to meet Paris temperature goals and EU Green Deal.
The implementation of high carbon pricing leads to an extensive restructuring of the global energy system, which is driven by: (1) Large-scale expansion of renewable energy toward a decarbonized power system by mid-century, mostly through PV and wind complemented with storage and CCS capacities to provide balancing and flexibility services, (2) Energy efficiency improvements in end-use sectors, driven by investment in energy renovation in buildings, uptake of more efficient cars and appliances and fuel switching to more efficient carriers, (3) Increased electrification of energy services both in developed and in developing economies, driven by the large-scale expansion of Evs and heat pumps, (4) Low-emission energy carriers, including advanced biofuels and hydrogen to decarbonize sectors with limited availability of mitigation options (e.g., freight transport, heavy industries, aviation).
Decarbonization is a complex process requiring large changes in the way we produce and consume energy, but also in global economy, trade, labor, and capital markets. It involves the substitution of fossil fuels by products and services related to renewable energy and energy-efficient equipment. The transformation requires increased investment to low-carbon technologies combined with innovation, development and high diffusion of low-carbon technologies and consumer willingness to change behavior and purchase energy efficient equipment, while policy makers should set clear, predictable, and ambitious climate policies. The economic restructuring toward a more capital structure may be costly in the short-term with increased energy costs that drive upwards the general price level and putting stress on the capital market, while reducing competitiveness. However, GEM-E3-FIT also captures the potential long-term positive externalities which can be driven by low-carbon technology progress and industrial maturity dynamics. The short-term increase in energy prices can provide new opportunities for low-carbon R&D and commercial uptake of low-emissions, energy-efficient technologies, whose costs improve through increased uptake, while new industries may emerge in specific countries with extensive innovation and industrial base. These effects can boost EU and global economic growth and alleviate the “crowding-out” effects in other productive sectors.
We find that high carbon pricing toward achieving Paris goals would have limited global GDP losses that amount to 1.4% of Reference GDP over 2020–2050. The imposition of universal carbon pricing ensures that the global target is met with the lowest possible costs, but the socio-economic impacts are more negative in large hydrocarbon exporters that lose export revenues (e.g., Russia, Saudi Arabia) and in developing economies with large reliance on coal and high energy and carbon intensity, including China and India. In contrast, decarbonization implies opportunities for additional growth in countries with large innovation base and exports of low-carbon technologies. Decarbonization impacts on total investment is minimal, driven by reduced economic activity and increased requirements for investment in renewable energy, EVs and energy efficiency. Overall, our analysis confirms that meeting the 2°C goal is compatible with robust economic growth both in developing and developed economies, as its impact on annual growth rates is minimal. The trade balance is affected by decarbonization, with large export losses for major fossil fuel exporters and some gains for clean energy exporters like China and the EU, for solar PV and wind turbines, respectively.
Decarbonization results in different impacts by production sector, with large reductions projected for fossil fuel supply sectors and energy intensive industries, implying high challenges for their workforce which is also highly geographically concentrated in most cases (e.g., coal regions). In contrast, decarbonization may create possibilities for expansion and job creation for clean energy manufacturing (to produce PV, wind, EVs, etc.) and electricity sectors due to increasing electrification of end uses. Sectors featuring in the supply chain of low-carbon products also benefit from decarbonization, e.g., construction (related to building retrofits) and agriculture (to produce biofuels). The employment impacts of mitigation are minimal as reduced economic activity is to some extent counterbalanced by higher labor intensities (on average) of renewable energy compared to fossil fuels (IEA, 2019a). The low-carbon transition through high carbon pricing would result in a more labor-intensive economy driven by low-carbon investment.
GEM-E3-FIT results crucially depend on assumptions made, e.g., on the values of elasticities used in production or trade functions. A comprehensive sensitivity analysis on the values of these elasticities is required to consistently evaluate the socio-economic impacts of mitigation policies. In addition, the model can be expanded to represent novel mitigation options, including Direct Air Capture, clean synthetic fuels or electrification of aviation and maritime sectors, which currently are costly and lack commercialization but may be needed for the transition to carbon neutrality. The inclusion of novel mitigation options in the next GEM-E3-FIT version will enable the socio-economic analysis of the Paris goal to limit global warming to 1.5°C in future research.
Data Availability Statement
The original contributions presented in the study are included in the article/supplementary material, further inquiries can be directed to the corresponding author.
Author Contributions
All authors listed have made a substantial, direct, and intellectual contribution to the work and approved it for publication.
Funding
This research was funded by the European Union's Horizon 2020 research and innovation programme under Grant Agreement No. 730403 (INNOPATHS) and under Grant Agreement No. 821124 (NAVIGATE).
Conflict of Interest
The authors declare that the research was conducted in the absence of any commercial or financial relationships that could be construed as a potential conflict of interest.
Publisher's Note
All claims expressed in this article are solely those of the authors and do not necessarily represent those of their affiliated organizations, or those of the publisher, the editors and the reviewers. Any product that may be evaluated in this article, or claim that may be made by its manufacturer, is not guaranteed or endorsed by the publisher.
Acknowledgments
The information and views set out in this paper are those of the authors and do not reflect the official opinion of the European Commission.
Footnotes
1. ^Data for investment and operating costs were extracted from the PRIMES database (https://e3modelling.com/modelling-tools/primes/).
2. ^Or carbon price in the form of opportunity cost for the firm and/or household to emit less.
3. ^https://energy.ec.europa.eu/data-and-analysis/energy-modelling/eu-reference-scenario-2020_en#:~:text=The%20EU%20Reference%20Scenario%20is,framework%20in%20place%20in%202020
4. ^For the exact description of the approach see Paroussos et al. (2019).
5. ^The constraint is not restrictive as the model solution already goes beyond the constraint.
6. ^Crowding-out effects can diminish in case a favorable financing scheme is assumed, as illustrated in (E3Mlab, 2016). This study shows that if firms and households can borrow in capital markets without facing increasing unit costs of funding, GDP impacts of decarbonization are minimal and even positive (in the short term).
References
Antosiewicz, M., Nikas, A., Szpor, A., Witajewski-Baltvilks, J., and Doukas, H. (2020). Pathways for the transition of the polish power sector and associated risks. Environ. Innov. Societal Trans. 35, 271–291. doi: 10.1016/j.eist.2019.01.008
Armington, P. S.. (1969). A theory of demand for products distinguished by place of production. IMF Staff Papers 16, 159–178. doi: 10.2307/3866403
Böhringer, C., and Rutherford, T. (2008). Combining bottom-up and top-down. Energy Econ. 30, 574–596. doi: 10.1016/j.eneco.2007.03.004
Capros, P., Paroussos, L., Fragkos, P., Tsani, S., Boitier, B., Wagner, F., et al. (2014). European decarbonization pathways under alternative technological and policy choices: a multi-model analysis. Energy Strategy Rev. 2, 231–245. doi: 10.1016/j.esr.2013.12.007
De Cian, E., Keppo, I., Carrara, S., Schumacher, K., Förster, H., Abrell, J., et al. (2013). European-led climate policy versus global mitigation action: implications on trade, technology, and energy. Climate Change Econ. 4, 1350015. doi: 10.1142/S2010007813400022
E3Mlab (2016). Evaluation of Macroeconomic Impacts of EUCO Energy Scenarios Using the GEM-E3 Model. Report to DG-ENER, Athens.
E3-Modelling (2017). GEM-E3 Model Manual. Available online at: https://e3modelling.com/modelling-tools/gem-e3/
European Commission (2018). In-Depth Analysis in Support of the Commission Communication COM (2018) 773, A Clean Planet for All: A European Long-Term Strategic Vision for a Prosperous, Modern, Competitive and Climate Neutral Economy, Brussels.
European Commission (2020). Impact Assessment, Accompanying Communication' Stepping Up Europe's 2030 Climate Ambition-Investing in a Climate-Neutral Future for the Benefit of Our People. SWD (2020) 176 final. Available online at: https://ec.europa.eu/clima/sites/clima/files/eu-climate-action/docs/impact_en.pdf
European Commission (2021a). Communication From the Commission to the European Parliament, The Council, The European Economic and Social Committee and the Committee of the Regions 'Fit for 55': Delivering the EU's 2030. Brussels: Climate Target on the way to climate neutrality COM/2021/550 final.
European Commission (2021b). The 2021 Ageing Report Economic & Budgetary Projections for the EU Member States (2019-2070), Institutional Paper 148., Brussels.
Fragkiadakis, K., Fragkos, P., and Paroussos, L. (2020). Low-carbon R&D can boost EU growth and competitiveness. Energies 13, 5236. doi: 10.3390/en13195236
Fragkos, P., Fragkiadakis, K., Paroussos, L., Pierfederici, R., Vishwanathan, S. S., Köberle, A. C., et al. (2018). Coupling national and global models to explore policy impacts of NDCs. Energy Policy 118, 462–473. doi: 10.1016/j.enpol.2018.04.002
Fragkos, P., Fragkiadakis, K., Sovacool, B., Paroussos, L., Vrontisi, Z., and Charalampidis, I. (2021). Equity implications of climate policy: assessing the social and distributional impacts of emission reduction targets in the European Union. Energy 237, 121591. doi: 10.1016/j.energy.2021.121591
Fragkos, P., and Paroussos, L. (2018). Employment creation in EU related to renewables expansion. Appl. Energy 230, 935–945. doi: 10.1016/j.apenergy.2018.09.032
Fragkos, P., Tasios, N., Paroussos, L., Capros, P., and Tsani, S. (2017). Energy system impacts and policy implications of the European Intended Nationally Determined Contribution and low-carbon pathway to 2050. Energy Policy 100, 216–226. doi: 10.1016/j.enpol.2016.10.023
Fries, M.. (2017). An Overview of Costs for Vehicle Components, Fuels, Greenhouse Gas Emissions and Total Cost of Ownership Update 2017. Available online at: https://steps.ucdavis.edu/wp-content/uploads/2018/02/FRIES-MICHAEL-An-Overview-of-Costs-for-Vehicle-Components-Fuels-Greenhouse-Gas-Emissions-and-Total-Cost-of-Ownership-Update-2017-.pdf
Garrett-Peltier, H.. (2016). Green versus brown: comparing the employment impacts of energy efficiency, renewable energy, and fossil fuels using an input-output model. Econ. Modell. 61, 439–447. doi: 10.1016/j.econmod.2016.11.012
Harmsen, J. H. M., van Vuuren, D. P., Nayak, D. R., Hof, A. F., Höglund-Isaksson, L., Lucas, P. L., et al. (2019). Long-term marginal abatement cost curves of non-CO2 greenhouse gases. Environ. Sci. Policy 99, 136–149. doi: 10.1016/j.envsci.2019.05.013
Helgesen, P. I.. (2013). “Top-down and Bottom-up: Combining energy system models and macroeconomic general equilibrium models,” in Project: Regional Effects of Energy Policy (RegPol), CenSES Working Paper, 1/2013, Trondheim.
IPCC (2014). “Climate change 2014: synthesis report,” in Contribution of Working Groups I, II and III to the Fifth Assessment Report of the Intergovernmental Panel on Climate Change, eds Core Writing Team, R. K. Pachauri, and L. A. Meyer (Geneva: IPCC), 151.
IRENA (2020). Renewable Power Generation Costs in 2019. Abu Dhabi: International Renewable Energy Agency.
Karkatsoulis, P., Capros, P., Fragkos, P., Paroussos, L., and Tsani, S. (2016). First-mover advantages of the European Union's climate change mitigation strategy. Int. J. Energy Res. 40, 814–830. doi: 10.1002/er.3487
Karkatsoulis, P., Siskos, P., Paroussos, L., and Capros, P. (2017). Simulating deep CO2 emission reduction in transport in a general equilibrium framework: the GEM-E3T model. Transport. Res. Part D Transport Environ. 55, 343–358. doi: 10.1016/j.trd.2016.11.026
Kober, T., and Summerton, P. (2016). Macroeconomic impacts of climate change mitigation in Latin America: a cross-model comparison. Energy Econ. 56, 625–636. doi: 10.1016/j.eneco.2016.02.002
Kriegler, E., Riahi, K., Bauer, N., Schwanitz, V. J., Petermann, N., Bosetti, V., et al. (2015). Making or breaking climate targets: the AMPERE study on staged accession scenarios for climate policy. Technol. Forecast. Soc. Change 90, 24–44. doi: 10.1016/j.techfore.2013.09.021
McCollum, D. L., Zhou, W., Bertram, C., De Boer, H. S., Bosetti, V., Busch, S., et al. (2018). Energy investment needs for fulfilling the Paris Agreement and achieving the Sustainable Development Goals. Nat. Energy 3, 589–599. doi: 10.1038/s41560-018-0179-z
Meng, J., Zhang, Z., Mi, Z., Anadon, L. D., Zheng, H., Zhang, B., et al. (2018). The role of intermediate trade in the change of carbon flows within China. Energy Econ. 76, 303–312. doi: 10.1016/j.eneco.2018.10.009
Mercure, J. F., Knobloch, F., Pollitt, H., Paroussos, L., Scrieciu, S. S., and Lewney, R. (2019). Modelling innovation and the macroeconomics of low-carbon transitions: theory, perspectives and practical use Clim. Policy 19, 1019–1037. doi: 10.1080/14693062.2019.1617665
Navigant Research (2017). World Wind Energy Market Update Univ. S C. Dep. Music 2017, Washington, DC.
OECD (2017). Employment Implications of Green Growth: Linking Jobs, Growth, and Green Policies. Report for the G7 Environment Ministers.
Paroussos, L., Fragkiadakis, K., and Fragkos, P. (2020). Macro-economic analysis of green growth policies: the role of finance and technical progress in Italian green growth. Clim. Change 160, 591–608. doi: 10.1007/s10584-019-02543-1
Paroussos, L., Fragkos, P., Capros, P., and Fragkiadakis, K. (2015). Assessment of carbon leakage through the industry channel: the EU, perspective. Technol. Forecast. Soc. Change 90, 204–219. doi: 10.1016/j.techfore.2014.02.011
Paroussos, L., Mandel, A., Fragkiadakis, K., Fragkos, P., Hinkel, J., and Vrontisi, Z. (2019). Climate clubs and the macro- economic benefits of international cooperation on climate policy. Nat. Clim. Chang. 9 542–546. doi: 10.1038/s41558-019-0501-1
Polzin, F., Sanders, M., Steffen, B., Egli, F., Schmidt, T. S., Karkatsoulis, P., et al. (2021). The effect of differentiating costs of capital by country and technology on the European energy transition. Clim. Change 167, 1–21. doi: 10.1007/s10584-021-03163-4
Probst, B., Anatolitis, V., Kontoleon, A., and Anadon, L. D. (2020). The short term costs of local content requirements in the Indian solar auctions. Nat. Energy. 5, 842–850. doi: 10.1038/s41560-020-0677-7
Rauner, S., Bauer, N., Dirnaichner, A., Van Dingenen, R., Mutel, C., and Luderer, G. (2020). Coal-exit health and environmental damage reductions outweigh economic impacts. Nat. Clim. Chang. 10, 308–312. doi: 10.1038/s41558-020-0728-x
Riahi, K., and Kriegler, E. (2015). Locked into Copenhagen pledges-implications of short-term emission targets for the cost and feasibility of long-term climate goals. Technol. Forecast. Soc. Change 90, 8–23. doi: 10.1016/j.techfore.2013.09.016
Rochedo, P. R. R., Fragkos, P., Garaffa, R., Couto, L. C., Baptista, L. B., Cunha, B. S. L., et al. (2021). Is green recovery enough? Analysing the impacts of post-COVID-19 economic packages. Energies 14, 5567. doi: 10.3390/en14175567
Rogelj, J., Luderer, G., Pietzcker, R. C., Kriegler, E., Schaeffer, M., Krey, V., et al. (2015). Energy system transformations for limiting end-of-century warming to below 1.5C. Nat. Clim. Change 5, 519–527. doi: 10.1038/nclimate2572
Shapiro, C., and Stiglitz, J. E. (1984). Equilibrium unemployment as a worker discipline device. Am. Econ. Rev. 74, 433–444.
Transport Environment (2017). Electric Vehicles 2017. Available online at: https://www.transportenvironment.org/sites/te/files/publications/TE%20EV%20Report%202016%20FINAL.pdf
United Nations Framework Convention on Climate Change (UNFCCC) (2015). Adoption of the Paris Agreement. Available online at: https://unfccc.int/sites/default/files/english_paris_agreement.pdf
van Soest, H., Reis, L. A., Baptista, L. B., Bertram, C., Després, J., Drouet, L., et al. (2021). A global roll-out of nationally relevant policies bridges the emissions gap. Nat. Commun. 12:6419. doi: 10.21203/rs.3.rs-126777/v1
Verdolini, E., Anadón, L. D., Baker, E., Bosetti, V., and Reis, L. A. (2018). Future prospects for energy technologies: insights from expert elicitations. Rev. Environ. Econ. Policy 12, 133–153. doi: 10.1093/reep/rex028
Wene, C.-O.. (2008). Energy technology learning through deployment in competitive markets. Eng. Economist J. Devoted Problems Capital Invest. 53, 340–364. doi: 10.1080/00137910802482287
World Bank (2021). Global Economic Prospects, June 2021. Available online at: https://openknowledge.worldbank.org/bitstream/handle/10986/35647/9781464816659.pdf
Keywords: GEM-E3-FIT, climate policies, macro-economic assessment, employment impacts, EU Green Deal
Citation: Fragkos P and Fragkiadakis K (2022) Analyzing the Macro-Economic and Employment Implications of Ambitious Mitigation Pathways and Carbon Pricing. Front. Clim. 4:785136. doi: 10.3389/fclim.2022.785136
Received: 28 September 2021; Accepted: 29 March 2022;
Published: 25 April 2022.
Edited by:
Ramazan Sari, Technical University of Denmark, DenmarkReviewed by:
Alessandro Antimiani, European Research Area, BelgiumEbru Voyvoda, Middle East Technical University, Turkey
Copyright © 2022 Fragkos and Fragkiadakis. This is an open-access article distributed under the terms of the Creative Commons Attribution License (CC BY). The use, distribution or reproduction in other forums is permitted, provided the original author(s) and the copyright owner(s) are credited and that the original publication in this journal is cited, in accordance with accepted academic practice. No use, distribution or reproduction is permitted which does not comply with these terms.
*Correspondence: Panagiotis Fragkos, cGFuYWdmcmFna29zQGdtYWlsLmNvbQ==