 Mervi Kangas
 Arani Chandrapavan
 Sharon Wilkin
 Nick Caputi
95% of researchers rate our articles as excellent or good
Learn more about the work of our research integrity team to safeguard the quality of each article we publish.
Find out more
ORIGINAL RESEARCH article
Front. Clim. , 20 December 2022
Sec. Climate, Ecology and People
Volume 4 - 2022 | https://doi.org/10.3389/fclim.2022.1043889
This article is part of the Research Topic Advances in Marine Heatwave Interactions View all 18 articles
Saucer scallop, Ylistrum balloti, fisheries along central Western Australia was a key region impacted by the 2010/11 extreme marine heatwave (MHW) when mean sea surface temperature anomalies reached up to 5°C between December and March. The extreme intensity and duration of this event had adverse impacts on survival of larval, juvenile, and adult scallops in the three major stocks in Shark Bay and at the Abrolhos Islands. The severe decline, observed from low commercial landings and verified through fishery-independent surveys required strong and rapid management response, and so in consultation with industry these commercial fisheries were closed to protect the remaining population and allow stock recovery. This provided an opportunity to examine other factors, in the absence of fishing, that may impact recovery. Fishing recommenced in Shark Bay after 3.5 years with one of the two stocks recovering more slowly whilst fishing recommenced in the Abrolhos Islands after 5 years. Differences in recovery rates between regions may be attributed to differences in life-history dynamics which vary with latitude. In Shark Bay, the austral summer is pre-spawning with peak spawning in the autumn/winter and therefore higher temperatures negatively impacted the spawning stock directly. In the Abrolhos Islands however, scallops have already spawned by summer and therefore the larvae and/or the early juveniles were impacted as well as post-spawned adults. Post 2011 MHW, continued warmer ocean conditions were experienced, followed by 4 years (2016-2019) of a “marine cold spell” then “short-lived” moderate MHWs during the summers of 2019/20 to 2021/22. Each stock had, over these years, responded differently to the conditions and fishing impacts and management responses also varied. We describe the science, management and industry response to severe stock declines, recovery rates, the drivers of recruitment and recovery and effects of recent summer MHWs on the current scallop stock status. Secondly, we describe the management arrangements and harvest strategies implemented. We highlight the importance of pre-season stock monitoring that provide a basis for catch/recruitment prediction and adaptive harvest strategies to ensure timely responses to stock declines in the event of extreme events expected to become more frequent in a changing global climate.
The saucer scallop Ylistrum balloti is a short lived (2–3 years) and the primary target species for two key demersal trawl fisheries based in Shark Bay (Gathaguudu) (SB) and in the Abrolhos Islands (AI) (Figure 1) in the mid-west and Gascoyne regions of Western Australia (WA) with a combined value of AUD 10–30 million (Kangas et al., 2021). SB is the most productive scallop region in WA with the annual catch ranging between 120 and 4400 tons. The AI annual catches range between 2 to 200 tons.
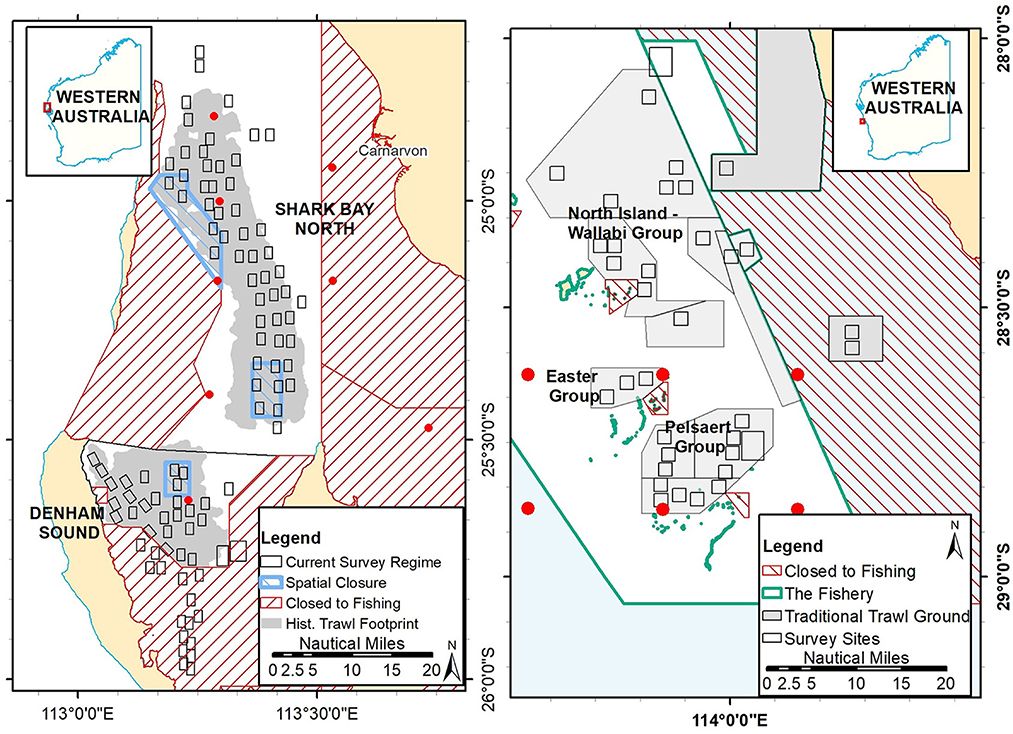
Figure 1. Map of Shark Bay (left) indicating the two main scallop trawl grounds, spatial closures and location of annual survey “boxes”; and the traditional trawl grounds (shaded areas) in the Abrolhos Islands fishery (right) and location of annual survey “boxes”. The red hatched areas are permanently closed trawl areas (known as reef observation areas in the Abrolhos Is.) and the red dots are locations where SST was derived.
Like many scallop stocks around the world, WA stocks also exhibit highly variable recruitment and vulnerability to environmental conditions (Vahl, 1982; Orensanz et al., 1991; Joll, 1994; Wolff et al., 2007; Shephard et al., 2010; Stokesbury et al., 2010; Bethoney et al., 2016). Prior to 2010, very high landings from both fisheries (early to mid-1990s) were associated with cooler sea surface temperatures (SSTs) under El Niño climate phases and weaker Leeuwin Current (LC) (Joll and Caputi, 1995b; Lenanton et al., 2009). Conversely, below-average catch years were associated with above-average sea surface temperatures under La Niña climate phases and stronger LC (Joll and Caputi, 1995b; Lenanton et al., 2009). In 2010/11 an extreme marine heatwave occurred which was associated with an extended and strong La Niña and record strength LC where SSTs reached extreme levels between February and March 2011 (Pearce et al., 2011; Feng et al., 2013) and remained elevated over the summers of 2011/12 and 2012/13. Following this extreme event, both SB and AI fisheries spawning stocks declined to record-low levels to cause recruitment impairment (Caputi et al., 2016). With industry consultation and support, the strongest management measures were deemed appropriate and thus these scallop fisheries were closed to commercial fishing to enable spawning stock recovery.
The SB scallop fishery is comprised of two scallop stocks, SB North (SBN) and Denham Sound (DS), with little larval connectivity (Kangas et al., 2012) (Figure 1). Shark Bay scallops are fished by two demersal trawl fleets, one solely targeting scallops and the other targeting both prawn (shrimp) and scallops. The total scallop catch was managed under an effort-control system (limited number of boats, gear specifications, season length and daily commercial catch triggers to cease fishing) until 2014 with the main management focus of maintaining spawning stock levels at an acceptable level. This was achieved, between 1987 and 2005 by utilizing fishery-independent surveys to determine the relative abundance of juvenile and adult scallops which enabled an annual catch prediction (Caputi et al., 2014) and was used to determine i) if fishing could occur and ii) the commencement date of the fishing season through a simple harvest control rule (Kangas et al., 2011). Between 2006 and 2010, the catch prediction was used to inform the catch for the season and commercial fleet catch and catch rates (meat weight per day) were monitored with fishing ceasing when the fleet average daily catch rate reached a prescribed level (i.e., ~400 kg/day in SBN). A formal catch share between the scallop and prawn fleets was implemented in 2011 at 70 and 30%, respectively (Do, 2017).
Post-2011 MHW, when the SB fishery re-opened in late 2015, quota management was implemented with the catch prediction informing the total allowable commercial catch (TACC). Each license holder held an equal share of their total fleet allocation under an individual transferable quota (ITQ) system. Within-season review points, following fishery-independent surveys were used in combination with commercial catch and catch rate information (Figure 2) to ensure the quota was appropriate in any season.
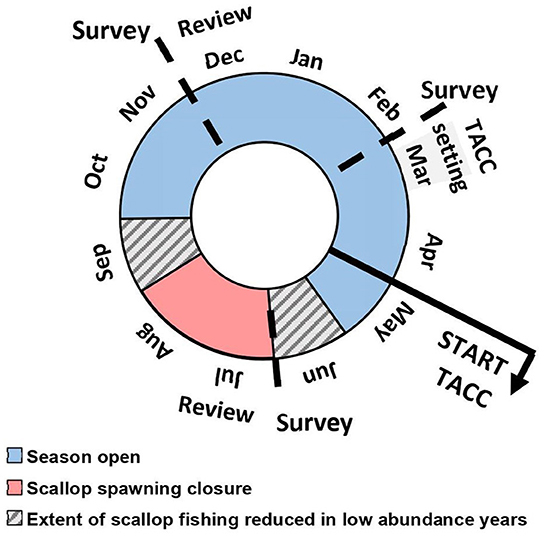
Figure 2. Schematic of the annual management cycle and fishing season for Shark Bay. Surveys conducted to provide information for TACC setting and within-season reviews are also shown.
The AI scallop fishery has remained effort controlled throughout its history with a single fleet and a fishing season of up to 6 months with fishing ceasing when the average fleet catch rate reaches 150 kg/day. Annual stock surveys provide an estimate of abundance of adult scallops providing a catch prediction for the following year and is used in setting the following season's management arrangements. Fishing normally commences March/April after the key spawning period over the austral summer months (Chandrapavan et al., 2020) to optimize the size and value of the scallop meat (adductor muscle) given meat size and quality deteriorates during spawning. Fishing then continues to July/August, depending on abundance.
This paper describes the science, management changes and industry response to the severe stock declines, stock recovery rates, examination of the drivers of recruitment and recovery, and the effect of the previous and current environmental conditions. We present the management arrangements and harvest strategies implemented and describe how they are working in addressing the current scallop stock status under initial favorable, then recent unfavorable environmental conditions. We highlight the importance of regular pre-season stock monitoring that enable catch predictions and flexible harvest strategies to ensure a timely response to changes in spawning stock and/or recruitment in the event unanticipated reductions in stock abundance and incidences of extreme climatic events that are expected to become more frequent in a changing global climate.
Shark Bay is located 800 km north of Perth (at ~26°S) and covers an area of approximately 13,000 km2 (Figure 1). SB was classified as a World Heritage Area (DOF, 2000) and contains the largest marine embayment in Australia and supports the most extensive and diverse seagrass meadows in the world (Walker, 1989). The hydrology of SB is influenced by the Leeuwin Current (LC), which carries warm, low-salinity water southward down the WA coast. The embayment is mostly shallow, with an average depth of 9 m and increasing to 29 m deep in the north (Francesconi and Clayton, 1996). SB is only infrequently impacted by cyclonic flooding and the mean annual rainfall is low, ranging from 200 mm in the west to 400 mm in the east. The lower reaches of the gulfs in SB are hypersaline with scallops only occurring in areas with oceanic salinities in the deeper parts of central SB.
The Houtman Abrolhos Islands are located approximately 60 km off the coast of Geraldton (Figure 1) and are a chain of 122 low-lying islands and reefs on the edge of the continental shelf (Johannes et al., 1983). There are three major island groups, the North Island-Wallabi Group, the Easter Group and the Pelsaert (Southern) Group. The AI scallop resource occurs on sandy substrates within protected areas north and east of these island groups. This region is generally a temperate oceanic zone but is influenced by the LC. The LC is responsible for the existence of the unusual AI coral reefs and high species diversity at latitude 29°S.
Satellite-derived continuous daily sea surface temperatures (SSTs) were obtained from the NOAA OIv2 dataset (National Oceanic and Atmospheric Administration) from 1982 onwards at ¼ degree (~28 km) resolution at nine sites across the varying depths inside SB and six sites around the AI (Figure 1). Daily SST data were used to calculate monthly mean SSTs and anomalies referenced to the 1981–2018 climatology (https://www.esrl.noaa.gov/psd/). Annual MHW days were calculated by the number of mean daily SSTs that were ≥ the 90th percentile for that day across the selected region (Hobday et al., 2016).
Detailed daily logbooks have been completed in SB by commercial licensed trawl fishers since the 1980s and from the early 1990s in the AI. As a minimum, daily catch (kg of meat weight) and total effort (minutes trawled) are recorded with an indication of fishing location or region. In SB, since quota management, commercial fishers are also required to complete commercial catch and disposal records (CDRs) by area, each time they unload their scallop catch.
Demersal trawl surveys using standardized otter trawl gear have been undertaken annually in November across 90 standardized survey sites in SB since 1983. Due to high variability in spatial distribution from year to year within SB (Mueller et al., 2005, 2012), the extensive sampling regime covers the full extent of the Bay where scallops are known to occur (Figure 1) and provides a reliable index of total abundance. In the AI, up to 23 sites over 10 main fishing grounds (Figure 1) have been sampled in November each year since 1997. The night-time surveys are undertaken using the Department's 23 m research vessel towing two six-fathom (11 m) headrope length flat nets with 50 mm mesh in the panels and 45 mm in the cod-end with each trawl being 20 min (~1 nautical mile). The total catch is recorded and a representative sample of 150-200 scallops from each site is collected to measure dorso-ventral length (mm). Therefore, from each survey site a total catch per unit effort (CPUE), juvenile [(0+, <83 mm shell height (SH)] CPUE and adult (1+, ≥83 mm SH) CPUE are calculated.
A subset of sites have been sampled in February in SB and AI since 2012 and additionally in June in SB since 2015. Scallops < 50 mm shell height (SH) are poorly sampled in November due to mesh selectivity but become more catchable by February after growing during the austral summer to provide a more accurate 0+ CPUE. The June survey in SB represents scallop abundance during the key spawning period (Chandrapavan et al., 2020) and informs the within-season review of the TACC (Figure 2). This June abundance index may in future provide a more robust index of spawning stock when a sufficient time series is achieved.
Differences in the timing of key spawning periods between the two regions (Joll and Caputi, 1995a; Chandrapavan et al., 2020) mean that these surveys provide an index of abundance that represents different life-history phases. In the November SB survey, juveniles (0+) derived from the current year's spawning stock (1+) are sampled and both abundance indices are combined to predict the catch the following year (Caputi et al., 2014) as both components of the stock are harvested. Historically, these catch predictions were used in setting the season arrangements (i.e., opening date and approximate season duration) and, since quota management, are used to guide the TACC setting, supplemented by information from the February survey. For the AI, the November survey generally consists of one key cohort of adult (1+) scallops as the juveniles are generally too small to be sampled fully at this time. These 1+ scallops represent most scallops that will be harvested the following season and the abundance index is used to derive a catch prediction.
The SB scallop catch prediction is based on the mean scallop abundance index (scallops/nautical mile (nm) trawled) of the juvenile (0+) and adult (1+) scallops combined in year (y) in the November survey on log scale correlated with the following season's total landings (y+1) (tons of meat weight) for DS and SBN separately (Caputi et al., 2014). This assessment was undertaken only for years prior to the fishery going to quota management. For the AI fishery the catch prediction from the November survey is derived 5 months ahead of the start of the season (Caputi et al., 2014) and informs the season length. The catch prediction is determined using the log relationship of the mean scallop abundance from all survey sites in November each year (y) and the annual scallop landings the following year (y+1).
The 2010-12 La Niña event is considered one of the strongest on record (BOM, 2019) and consisted of two peaks over successive summers (Figure 3). Typically, inside SB, the peak summer period is February to March with an SST range of 24–25°C (Figures 3A, B). The 2011 extreme MHW occurred during the first peak over the summer of 2010/11 (November to March), where the nearshore water temperatures along the Gascoyne and mid-west coast of WA were 2–3°C higher than mean historical levels. Within SB, SSTs rapidly increased from September 2010 onwards to above-average temperatures peaking during February 2011 at ~29°C (Figures 3A, B). Shallower regions of the Bay experienced temperatures of up to 5°C above-average while the central deeper Bay regions experienced up to 3°C above-average temperatures. Overall, both SBN and DS experienced ~140 MHW days during 2011.
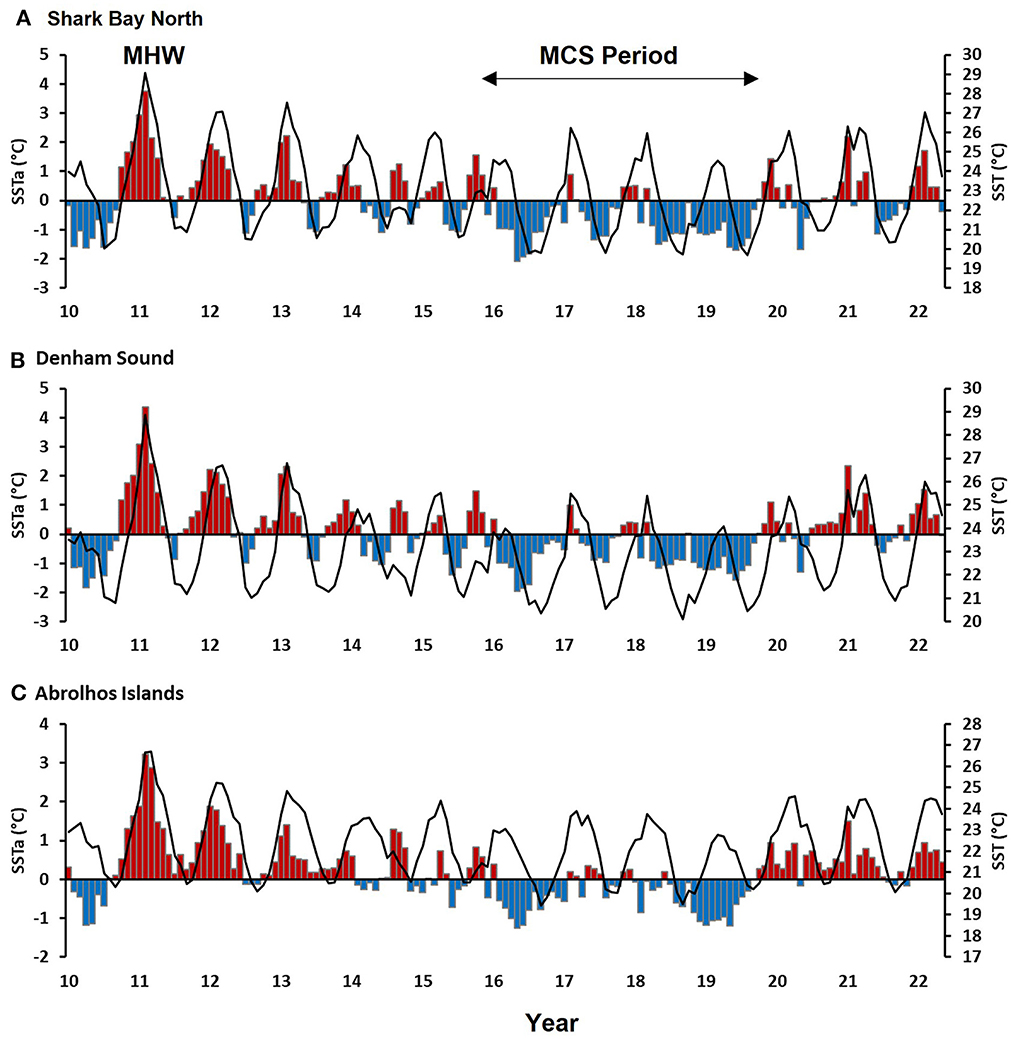
Figure 3. Mean monthly SST (line) and SST anomalies (red and blue bars) from 2010 to 2022 against a climatology of 1981–2018 for (A) Shark Bay North (B) Denham Sound and (C) Abrolhos Islands. The 2011 marine heatwave (MHW) and 2016-19 marine cold spell (MCS) are indicated.
Mean monthly SSTs at AI typically range between 20 and 24°C with the warmest months being February and March (Figure 3C). During the 2011 MHW event, SSTs rapidly increased beyond 24°C and reached peak levels during February/March at 26.7°C when the temperature anomalies were at a maximum of 3.2°C. The AI experienced the highest number of MHW days of 206 during 2011 since 1982 (Figure 4). The 2011 MHW occurred due to an alignment of inter-seasonal to inter-decadal processes, which resulted in an earlier surge of the LC during the austral summer which was associated with high temperatures which intensified by an anomalously high heat flux from the atmosphere entering the ocean (Feng et al., 2013; Pearce and Feng, 2013).
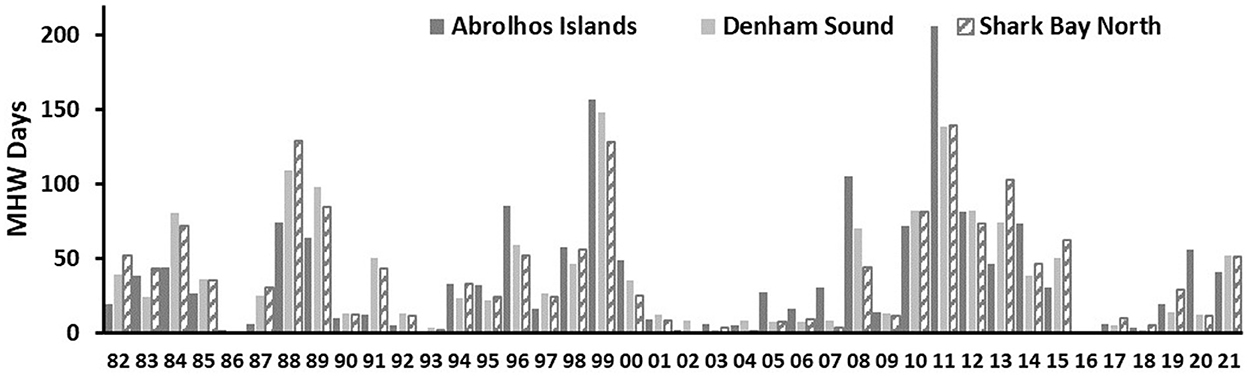
Figure 4. Annual number of MHW days between 1982 and 2021 at the Abrolhos Islands, Denham Sound and Shark Bay North regions.
The 2011/12 La Niña was weaker, but still of moderate strength, and therefore above average SSTs with anomalies up to 2°C persisted into 2012 and 2013 before transitioning toward average to below-average SSTs observed during the “marine cold-spell” (MCS) period 2016 −2019 (Feng et al., 2020) (Figure 3). This MCS period was associated with a strong and extended 2015/16 El Niño event when the LC was largely weaker and further offshore. Sea surface temperatures anomalies were up to 2°C cooler. Since the summer of 2019/20, mean monthly SSTs have remained above average as back-to-back La Niña events returned to influence ocean conditions off WA.
The scallop abundance in November surveys in SBN prior to the 2011 MHW was variable with a range of 17 to 3756 scallops nm−1 for 0+ individuals and 27 to 6664 scallops nm−1 for 1+ individuals which resulted in a variable, but regular annual commercial landings until 2011 (Figure 5A). When the fishery reopened in 2015, the survey scallop abundance in SBN range narrowed to between 32 and 347 scallops nm−1 for 0+ individuals and between 4 and 345 scallops nm−1 for 1+ individuals (Figure 5A). In contrast, prior to the 2011 MHW, DS had two periods of four to five years with low 0+ scallop abundance leading to low 1+ individuals resulting in almost zero landings for several years in a row between1985 to 1989 and 1997 to 2000 inclusive (Figure 5B). These low years were interspersed with scallop survey abundances ranging from 34 to 761 scallops nm−1 for 0+ and between 26 and 683 scallops nm−1 for 1+ individuals commensurate with seven to ten years of commercial landings (Figure 5). Since reopening in 2015, the scallop survey abundance range has slightly improved to between 273 and 736 scallops nm−1 for 0+ and between 79 and 914 scallops nm−1 for 1+ individuals (Figure 5). Abrolhos Island scallop survey indices ranged between 282 and 4279 scallops nm−1 between 1997 and 2010 and since reopening in 2017, returned to pre-2011 MHW years to between 569 and 3339 scallops/nm (Figure 5C). In 2021 however, the survey index was only 45 scallops nm−1.
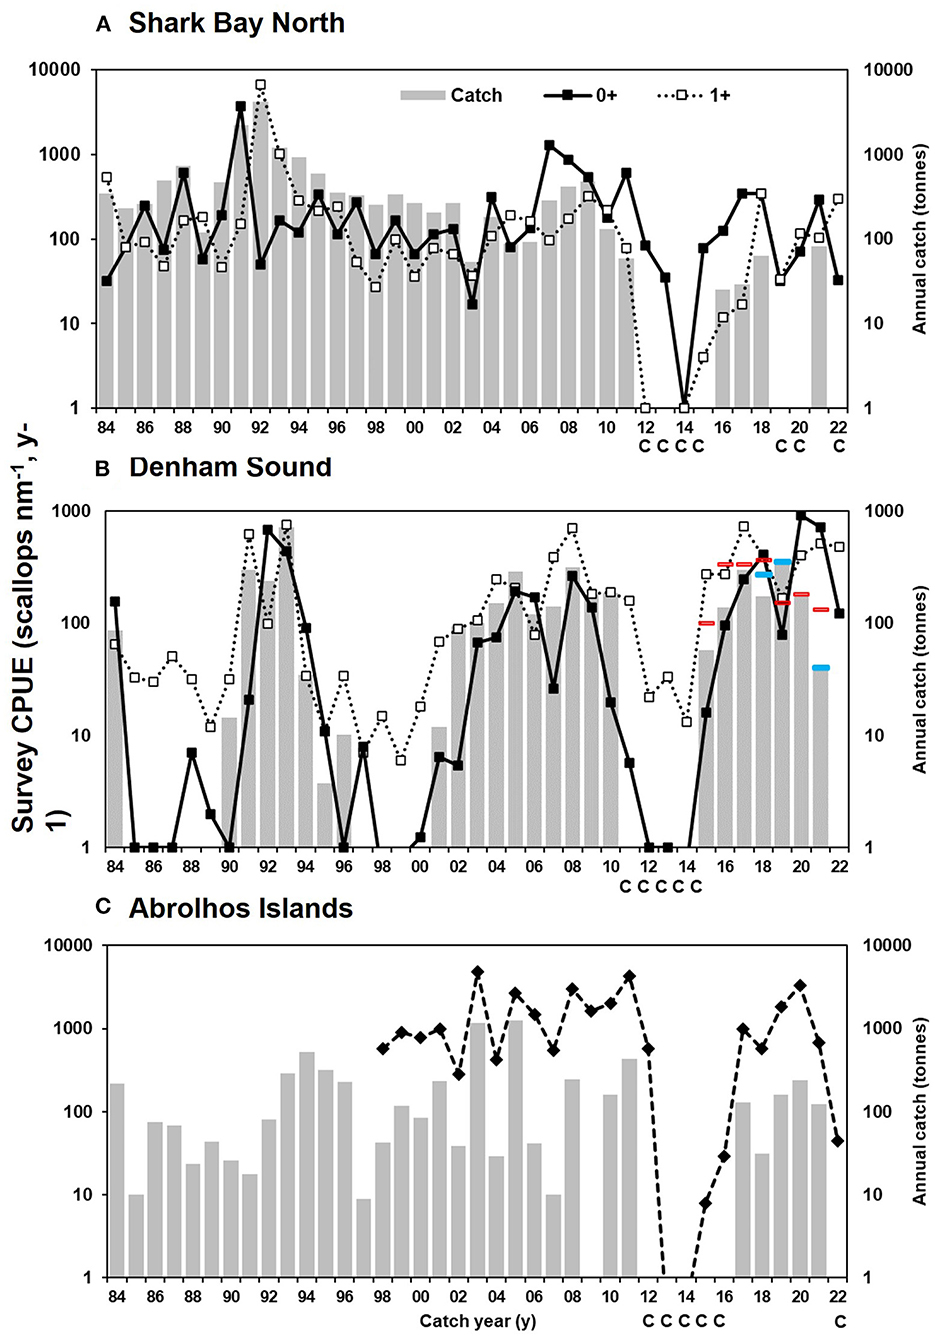
Figure 5. Catch time series and 0+ and 1+ survey index (on logarithmic scale) for (A) Shark Bay North (B) Denham Sound (Red lines indicate the TACC set for the season−1 May to 30 April; Blue lines indicate amended TACC if deemed appropriate); and (C) Abrolhos Islands with the survey index. The survey index is shown in the year following the survey to coincide with the catch year e.g., 1997 survey shown at 1998 catch year. C indicates fishery closure due to MHW or survey abundance below limit reference level.
A strong negative influence of the 2011 MHW is evident on scallop abundances, initially for 1+ individuals in all regions resulting in low spawning stock thus impacting recruitment (0+) the following year (Figure 5). As the spawning stock increased, the level of 0+ also improved providing a significant stock-recruitment-environment relationship (SRER) with R2 of 0.31 to 0.64 with the SST significantly affecting recruitment in these relationships (Caputi et al., 2021). The limit and threshold reference points in the harvest strategies (HS) for SB and AI (DPIRD, 2020a,b) are based on these significant relationships with the limit being the point below which recruitment was demonstrated to be impaired due to spawning stock abundance and the threshold representing the point at which management intervention may be required to shift spawning stock abundance to above this level. In the AI the significant decline in scallop abundance in 2012 was followed by almost no scallops for 2 years (Figure 5C) providing a SRER relationship and limit and threshold reference points for the HS (Chandrapavan et al., 2020; Caputi et al., 2021).
Catch predictions are based on the relationship between the mean survey abundance (both 0+ and 1+ index in November (year y) against the annual landings (year y+1). In SB, prior to implementation of TACC in 2015, the November survey provided a catch prediction as meat weight (Caputi et al., 2014) at least 4 months ahead of the start of the season (about March; e.g., DS Figure 6, R2 = 0.91). This prediction continues to be used for informing the TACC and the value of the TACC and any adjustments within season. In the AI fishery there is a clear positive relationship with survey abundances and annual landings (Figure 7, R2 = 0.66). The limit (250 scallops nm−1, Figure 7) and threshold (750 scallops nm−1) reference points are at points where recruitment is and is not impaired by spawning stock scallop abundance index (Caputi et al., 2021).

Figure 6. Denham Sound catch prediction model prior to fishery going to catch quota based on November survey abundance of 0+ and 1+ scallops nm−1 between 1997 to 2010 (black dots, closed years excluded) when a consistent spatial area was open to scallop fishing. Limit (red vertical line) and threshold (blue vertical line) reference levels indicated. Years under quota management excluded from the catch prediction relationship is indicated by open circles.
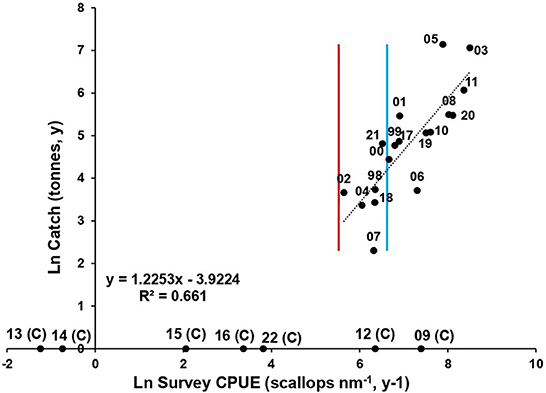
Figure 7. Abrolhos Is. catch prediction model based on total abundance of 0+ and 1+ scallops nm−1 between 1997 to 2021 (black dots) (closed years excluded). Limit (red vertical line) and threshold (blue vertical line) reference levels indicated.
The scallop shell height frequencies observed during surveys in SB post-2011 MHW highlight differences in scallop abundances between SBN and DS with consistently lower abundance in SBN and a lack of sustained recovery in SBN until June 2021 (Figure 8). Generally, 0+ (≤83 mm SH) scallop abundance is higher in February (y+1) compared to November (y) surveys in both areas (Figure 8). Recruit (0+) individuals were observed in DS from 2015 with relatively strong recruitment in 2016 (Figure 8) followed by annual recruitment in the following years. A very high recruitment was observed in February 2019 leading to a high abundance of 1+ individuals in June 2019 which persisted as 1+ into February 2020 (Figure 8). The overall abundance since then has declined. In AI, scallops in November generally consist of one size cohort (1+) at 85–100 mm SH (Figure 8) whilst in February two cohorts (0+ and 1+) have been observed but proportions of 0+ and 1+ can be annually variable. In February 2021 high abundance of 1+ was observed and these were fished during 2021 but a low abundance of 0+ at the time resulted in a low overall scallop abundance in November 2021 to below the limit reference point requiring a fishery closure in 2022. In February 2022 a high abundance of 0+ was observed with very few 1+ individuals (Figure 8).
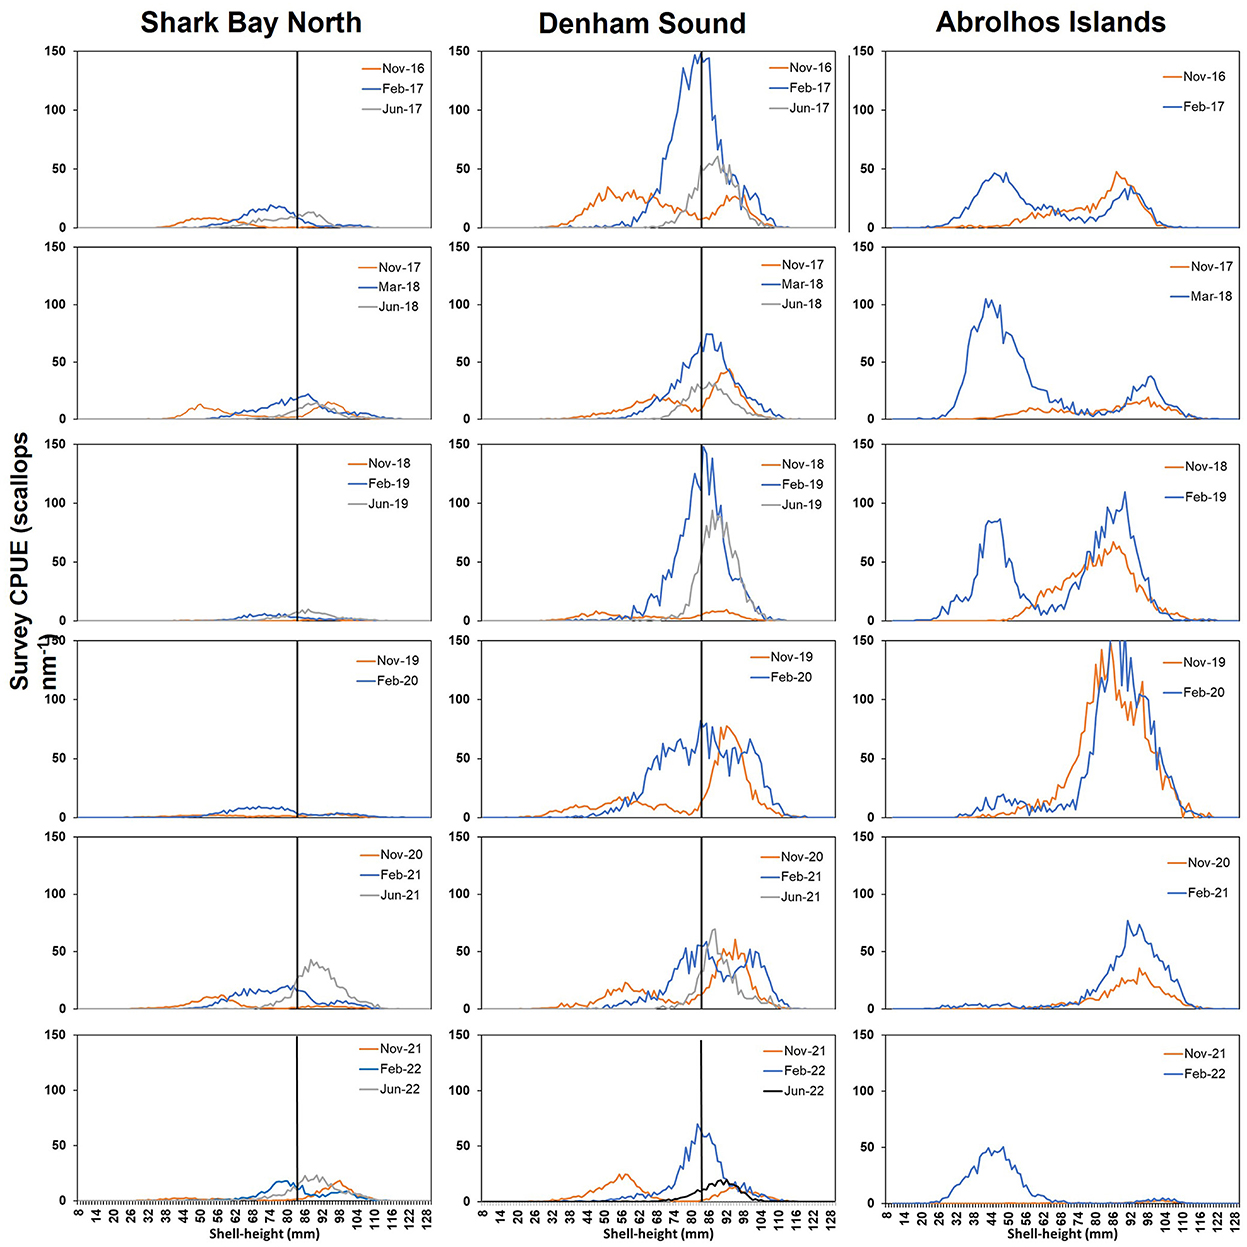
Figure 8. Shell-height (mm) frequencies from November, February and June surveys between 2016 and 2022 in Shark Bay North (left), Denham Sound (middle) and at the Abrolhos Islands (right) (no June surveys undertaken at the Abrolhos Islands and no June 2020 in SB). The size of 83 mm shell height (black vertical line) which represents the average cut off between 0+ and 1+ during the November survey in SB.
The annual landings of saucer scallops in all three areas show high variability between years (Figure 5). For SBN, these landings generally reflect the level of recruitment (0+) and adults (1+) observed in the fishery (Figure 5A). Notably a record-high recruitment event in 1990 in SBN resulted in record-high landings in 1991 to 1993 of 1200 to 4000 t (Joll, 1994) whilst a moderately-strong recruitment in 2006 and 2007 resulted in landings of460 and 560 t in 2008 and 2009, respectively. No high or even moderate recruitment events have been observed in SBN since the 2011 MHW. DS also experienced high scallop recruitment during 1990 to 1992 with the highest recorded landings from this area in 1993 of 700 t (Figure 5B). Prior to the early 1990's the average landings in the AI fishery were around 70 t (historical catch range of 10 to 200 t). Higher landings were also reported between 1993 and 1996 of between 300 and 520 t which may indicate that this region also experienced strong recruitment as observed in SB at a similar time. Since the mid-1990s very high recruitment was observed in 2002 and 2004 resulting in 1160 t and 1300 t of scallops being landed in the fishing seasons of 2003 and 2005 respectively. Following the 2011 MHW event, 441 t was landed which was at the lower end of the predicted range (446 to 669 t) for that season (Sporer et al., 2012). However, unprecedented low scallop abundance was then observed in late 2011 after the fishing season ended and the fishery was closed for 5 years (2012 to 2016 inclusive). Since fishing recommenced in 2017 landings have been between 30 t and 240 t with a return to very low abundance in November 2021 resulting in the fishery's closure in 2022.
The environmental conditions in the last 10 years have been particularly volatile with the 2011 extreme MHW followed by 2 years of above-average SSTs, 4 years (2016-19) of a “marine cold spell” and then “short-lived” moderate marine heatwaves during the three austral summers of 2019/20 to 2021/22. The return to warmer ocean conditions, stronger currents and moderate MHWs in this region is once again having a negative effect on scallop recruitment and driving the populations to their lower abundance ranges. Longer-term climate projections suggest a warming trend in SSTs and potentially more frequent occurrences of extreme events such as marine heatwaves (Oliver et al., 2019). This has important implications for the assessment and management of scallop stocks in both SB and AI that are sensitive to water temperature increases. It will require close monitoring of the stocks and adoption of harvest strategies that are robust to these environmental changes.
Like many scallop stocks around the world, the scallop fisheries in WA exhibit highly variable recruitment and vulnerability to environmental conditions (McGarvey et al., 1993; Joll, 1994; Hart and Rago, 2006; Shephard et al., 2010; Stokesbury et al., 2010; Bethoney et al., 2016). This situation is exacerbated when extreme environmental events occur such as the protracted El Niño in the early 1990s (Lenanton et al., 2009) and the 2011 extreme MHW (Pearce et al., 2011; Pearce and Feng, 2013) resulting in a record-high and record-low recruitment, respectively. The negative relationship between warmer than average water temperature and scallop recruitment was well known before the 2011 MHW (Joll and Caputi, 1995b; Lenanton et al., 2009) therefore the decline in abundance after the MHW was expected. The negative impact of very low abundance resulted in the fisheries' closure. The SB scallop fishery was closed for 3 years and the AI fishery for 5 years after these significant stock declines (Caputi et al., 2016) to enable spawning stock biomass recovery. Initial recovery was impeded by “warm” years in 2012 and 2013 following the MHW and it was only during the “marine cold spell” (MCS) (Feng et al., 2020) phase that optimal conditions occurred for full recovery. Chandrapavan et al. (2020) indicated that the optimal temperatures for Y. balloti in WA are < 23°C during the spawning period. Optimal spawning temperatures and conditions have been highlighted to be important in other scallop species for spawning success and larval survival and feeding (Del Norte, 1988; Courtney et al., 2015).
Stock recovery was contingent on the incremental improvement of spawning stock abundance, during improved environmental conditions and then continued favorable environmental conditions to facilitate ongoing recruitment recovery. Scallops are broadcast spawners, sedentary with only low mobility, therefore scallops need other scallops within their proximity for spawning success as fertilization success depends on the concentration of sperm in the water column (Allee, 1931; Gascoigne and Lipcius, 2004; Bayer et al., 2016). A fundamental requirement to manage fish stocks is to understand the underlying spawning and recruitment processes and stock-recruitment relationship (SRR) to enable sustainable harvests of finite stocks. Globally, the highly variable nature of scallop recruitment and therefore annual landings and catch value (Hart and Rago, 2006; Bethoney et al., 2016) has highlighted the difficulty in establishing a robust SRR for this group of highly valuable marine species (Fifas et al., 1990; McGarvey et al., 1993; Shephard et al., 2010). The effect of spawning stock size on recruitment levels of scallops in SB was examined in the 1980's and 1990's (Joll and Caputi, 1995b; Caputi et al., 1998) but found the spawning stock level was not significant despite a major increase in the spawning stock abundance due to the record-high abundance of the early 1990's. However, the environment, namely the LC strength and its positive influence on water temperature, had a significant negative relationship with recruitment.
As a result of the 2011 MHW, the record-low levels of spawning stock enabled the development of a stock-recruitment-environment relationship (SRER) for each of the three stocks based on fishery-independent survey indices (Caputi et al., 2021). This provided valuable information for determining the limit reference point, the point of recruitment impairment, in the harvest strategies of each stock. The significance of a spawning stock effect on recruitment when the spawning stock was at record-low levels is in contrast with the earlier findings with a lack of spawning stock significance even when spawning stock was a record-high levels for this stock in the early 1990s (Caputi et al., 1998). Similarly, Bethoney et al. (2016) did not find any effect of spawning stock on a number of extremely high recruitment events in the Atlantic sea scallop fishery. It is likely that when spawning stock is above an appropriate “reference” level, environmental conditions are the major drivers of recruitment success irrespective of the spawning stock abundance. However, when spawning stocks are at very low levels then they may become the major driver of recruitment impairment. In contrast to this, Orensanz (1986) found a negative effect of spawning stock of the recruitment of tehuelche scallops in San Jose Gulf, Argentina, when spawning stock was close to carrying capacity.
The fishery-independent surveys during November have been used historically to predict the following seasons' catch (Joll and Caputi, 1995b; Caputi et al., 2014) and to set the start date of the fishery which affected the level of fishing allowed in SB and the AI when both fisheries were effort-controlled. This has continued in the AI and is incorporated into its HS (DPIRD, 2020b). These relationships were valuable as they enabled an assessment of the highly variable annual recruitment and were used to determine the management arrangements for the following season to ensure stock sustainability. This information has also been of benefit to the fishing industry to provide pre-season knowledge to plan their season or whether to not fish in a very low abundance year which would be economically unviable. Similarly for management, the catch prediction is initially used to determine if any fishing can occur and then to determine the level of fishing allowed.
Different types of catch forecasting models have been examined for a number of scallop fisheries around the world. The model developed for the Peruvian scallop fishery was based on spawning stock and settlement rate with the settlement rate being temperature dependent (Wolff et al., 2007). Beukers-Stewart et al. (2003) found the density of 2-year old scallops was generally an accurate predictor of the density of 3 and 4-year old scallops in the Isle of Man scallop fishery. They also investigated the use of spat settlement as a predictor and found that they provided notice of exceptional recruitment events but were not adequate for predicting scallop catches. Liu et al. (2021) used satellite remote sensing to improve the prediction of scallop condition for the Georges Bank scallops in Canada that improved the biomass estimates for stock assessment and the setting of catch quotas.
Since the move to a catch-quota fishery in SB, where the survey index sits in relation to the limit or threshold reference level is used to inform the quota allocation for the following year. The catch prediction relationship therefore contributes to the setting of the TACC. Typically, the TACC is conservatively set at a level lower than the catch prediction e.g., at about 70% of the prediction. The harvest strategy has a threshold reference point which is approximately 1.5 times the limit reference point, and if the survey abundance is below this limit reference point then the TACC is set to a very conservative level to ensure exploitation is reduced.
To further reduce the uncertainty in catch prediction in SB, the use of both November and February surveys have been adopted in the HS (DPIRD, 2020a). The surveys were also used to consider whether additional management measures were needed such as area closures. For example, in SB, discarding of scallops by the prawn fleet during their operations can occur when scallop retention is not permitted. Scallop discard mortality rates have been shown to be higher during warmer austral summer months (Chandrapavan et al., 2012; Kangas et al., 2012) and an indication of a similar increase in mortality during warmer SST conditions has also been shown during scallop tagging studies in Queensland (Australia) (Campbell et al., 2010a; Courtney et al., 2022). Therefore, additional small-scale spatial closures may be implemented around relatively high scallop abundance area when overall abundance is low to reduce recapture/discard mortality and to aid in rebuilding and/or recovery. Small scale spatial closures in both parts of SB have been implemented for a whole season or during the pre-spawning fishing periods since the 2011 MHW. Spatial closures, in a rotational capacity or to protect spawning abundance have been also adopted or evaluated in several scallop fisheries to aid recovery or to reduce recruitment variability (Campbell et al., 2010b; Hart et al., 2013; Wortmann, 2021).
Formal harvest strategies are used to manage the SB and AI scallop fisheries (DPIRD, 2020a,b). The harvest strategy outlines the long and short-term objectives for management and has enabled the AI fishery to achieve “independent sustainability accreditation” through Marine Stewardship Council (MSC) certification. They also provide a description of the performance indicators used to measure performance against these objectives, reference points for each performance indicator, and associated harvest control rules that articulate pre-defined, specific management actions designed to maintain the resource at target levels. The scallop harvest strategies use threshold and limit reference points based on 0+ and 1+ survey abundance with the limit reference point taking into account the SRER (Caputi et al., 2021) to ensure there is sufficient breeding stock left in the water.
A key feature of the HS is its ability to deal with the very large variation in annual scallop abundance, for example, in very high abundance years (e.g., 1991) the management system allowed fishers to maximize the harvest of the resource (i.e., fishing was open all year). Whereas in times of low abundance (below the limit level), the stock is given a high level of protection with little or no fishing prior to the spawning period and in worst case scenarios there is no retention of scallops (e.g., in 2012 to 2014).
Managing widely fluctuating scallop stocks as in WA have been experienced by many scallop fisheries. Bethoney et al. (2016) suggested a continued need for adaptable management based upon empirical data to deal with the complexities surrounding recruitment, exemplified by extremely high recruitment events. While Wolff et al. (2007) identified that the boom and bust situation of the Peruvian scallop made a rational management of the resource difficult as annual catches were considered unpredictable. They provided a catch forecast model to enable the scallop fishery to better prepare for and adapt to the ever-changing conditions of the scallop stock.
The move to a TACC has changed the historical patterns of fishing (timing and extent) in SB with all-year fishing allowed within a quota season (currently 1 May to 30 April) apart from a spawning closure of approximately 2 months during the austral winter (Chandrapavan et al., 2020). This required a different approach to stock assessment and management with within-season review points set in the harvest strategy (DPIRD, 2020a) to meet with the Department's Ecological-Based Fisheries Management objectives (Fletcher et al., 2016).
The HS for SB incorporates review triggers within the season to assess the appropriateness of the TACC through use of fishery-independent survey information and supported by commercial catch and catch rates and feedback from fishers. A formal working group has been established with membership of the Department's managers and scientists and representatives of the license holders to review all available information and guide the final quota allocation determined by the Department. The harvest strategy is responsive to the state of the stock as the commercial scallop fleet catch rates can be monitored daily through the season and scallop fishing can cease within 24–48 h. Commercial catches and catch rates along with mapping the distribution of effort and scallop abundance information from the February survey, (after some fishing/catches have usually been achieved in the fishery) enable the quota to be adjusted from the initial setting, either up or down if appropriate (DPIRD, 2020a). As this process is still evolving, in future, alternative models for setting the quota (and the cycle of a fishing season) may be explored, supplemented by the information from the February and June surveys.
This study has highlighted the importance of regular pre-season fishery-independent stock surveys to be the basis for stock assessment and decision making and the need for harvest strategies, developed in consultation with fishers that provide an adaptive management framework to ensure a timely response to highly variable changes in spawning stock and recruitment that are prevalent in scallop fisheries. This is especially important in short-lived scallop species that are extremely sensitive to environmental conditions. The socio-economic implications of fishery closures to fishers, regional communities and fishing industry service providers were immense and these are likely to become even more important due to marine heatwave events that are expected to become more intense and frequent in a changing global climate.
Successfully managing fisher behavior and activities requires having effective governance systems and a management framework/HS that prevents fishing pressure causing depletion of the scallop spawning stock to a level that might impair recruitment as effort is the main factor that we can be control. This, in turn, requires a suitable level of political and industry support and evidence-based science to enable appropriate rebuilding arrangements to be developed, adopted, and enforced for the time required. It has been recognized that the level of effective governance of fisheries is the key element that determines whether there is successful management of fisheries resources, not only the amount of data that are available (Fletcher, 2008).
Prior to the 2011 MHW, SBN provided between 70 and 80% of the annual landings whereas after reopening in late 2015 the area has not contributed more than 15% of total landings with the area being closed to scallop retention between 2017 and 2021. DS has provided most of the catch since 2015 with overall landings from this area returning to pre-2011 MHW levels within 3 years whilst SBN has not. The reasons for the lack of full recovery in one part of SB continues to be examined. There was a full recovery of the stocks in AI in 5 years aided by the 2016–2019 MCS (Feng et al., 2020). Although moderate catches of larger scallops were taken in 2021 and spawning stock was adequate, observations by commercial fishers during April/May 2021 indicated low recruitment and this was confirmed during the fishery-independent survey in November 2021 resulting in the fishery closure for 2022. However, it appears the “short-lived” marine heatwaves have only impacted stocks for 1 year as the February 2022 survey indicated moderate recruitment, signaling that fishing may resume in 2023.
The original contributions presented in the study are included in the article, further enquiries regarding data can be directed to the corresponding author.
MK performed some of the analyses, most of the research design, and wrote the early version of the manuscript. AC performed the environmental analyses. AC and SW prepared the figures. AC, SW, and NC all helped to interpret the results and participated in improving the manuscript. All authors contributed to the article and approved the submitted version.
All authors are funded by the Department of Primary Industries and Regional Development, Western Australia.
The authors acknowledge the numerous technical and science staff involved in data collection of fishery-independent data and their collation, validation, and entry for commercial fishers in providing daily catch and effort information and participating in developing the adaptive management arrangements currently in place in these fisheries. We thank Griffin Grounds and Stephen Newman for comments to improve the manuscript.
The authors declare that the research was conducted in the absence of any commercial or financial relationships that could be construed as a potential conflict of interest.
All claims expressed in this article are solely those of the authors and do not necessarily represent those of their affiliated organizations, or those of the publisher, the editors and the reviewers. Any product that may be evaluated in this article, or claim that may be made by its manufacturer, is not guaranteed or endorsed by the publisher.
Allee, W. C. (1931). Animal Aggregations: A Study in General Sociology. Chicago: University of Chicago Press.
Bayer, S. R., Wahle, R. A., Jumars, P. A., and Brady, D. C. (2016). Measuring scallop fertilization success in the field: chamber design and test. Marine Ecol. Prog. Ser. 551, 141–54. doi: 10.3354/meps11684
Bethoney, N. D., Asci, S., and Stokesbury, K. D. E. (2016). Implications of extremely high recruitment events into the US sea scallop fishery. Marine Ecol. Prog. Ser. 547, 137–47. doi: 10.3354/meps11666
Beukers-Stewart, B. D., Mosley, M. W. J., and Brand, A. R. (2003). Population dynamics and predictions in the Isle of Man fishery for the great scallop (Pecten maximus, L.). ICES J. Marine Sci. 60, 224–42. doi: 10.1016/S1054-3139(03)00005-5
BOM (2019). Australian Climate Influences Timeline. El Nino and La Nina events. La Nina–Detailed Australian Analysis. Available online at: http://www.bom.gov.au/climate/enso/lnlist/index.shtml (accessed March 02, 2019).
Campbell, M. J., Campbell, A. B., Officer, R. A., O'Neill, M. F., Mayercer, D. G., Thwaites, A., et al. (2010b). “Harvest strategy evaluation to optimise the sustainability and value of the Queensland scallop fishery. Queensland scallop fishery-FRDC Project No 2006/024 Final Report”. Available online at: http://era.daf.qld.gov.au/id/eprint/3049/ (accession December 12, 2022).
Campbell, M. J., Officer, R. A., Prosser, A. J., Lawrence, M/I/. Drabsch, S. I., and Courtney, A. J. (2010a). Survival of graded scallops Amusium balloti in Queensland's (Australia) trawl fishery. J.Shellfish.Res. 29, 373–80. doi: 10.2983/035.029.0213
Caputi, N., Chandrapavan, A., Kangas, M., Lestang, d. e., Hart, S., Johnston, A., et al. (2021). Stock-recruitment-environment relationships of invertebrate resources in Western Australia and their link to pro-active management harvest strategies. Marine Policy 133, 104728. doi: 10.1016/j.marpol.2021.104728
Caputi, N., Kangas, M., Hetzel, Y., Denham, A., Pearce, A., Chandrapavan, A., et al. (2016). Management adaptation of invertebrate fisheries to an extreme marine heat wave event at a global warming hotspot. Ecol. Evolution. 6:3583–3593. doi: 10.1002/ece3.2137
Caputi, N., Lestang, d. e., Hart, S., Kangas, A., Johnston, M., Penn, D., et al. (2014). Catch predictions in stock assessment and management of invertebrate fisheries using pre-recruit abundance; case studies from Western Australia. Rev. Fisheries Sci. 22, 36–54. doi: 10.1080/10641262.2013.832144
Caputi, N., Penn, J. W., Joll, L. M., and Chubb, C. F. (1998). Stock-recruitment-environment relationships for invertebrate species of Western Australia. In: Proceedings of the North Pacific Symposium on Invertebrate Stock Assessment and Management. Edited by G.S. Jamieson and A. Campbell. Can. Spec. Publ. Fish. Aquat. Sci. 125, 247–255.
Chandrapavan, A., Kangas, M., and Caputi, N. (2020). Understanding recruitment variation (including the collapse) of Ballot's saucer scallop stocks in Western Australia and assessing the feasibility of assisted recovery measures for improved management in a changing environment. Fisheries Research Report No. 308 Department of Primary Industries and Regional Development, Western Australia.
Chandrapavan, A., Kangas, M. I., and Sporer, E. C. (2012). Seasonal, spatial and post-harvest variability in the survival of repeatedly discarded saucer scallops in Shark Bay, Western Australia. J. Shellfish Res. 31, 1161–1171. doi: 10.2983/035.031.0427
Courtney, A. J., Leigh, G. M., Yan, Wen-His, C.ampbell, M. J., and McLennan, M.F. (2022). Estimating the natural mortality rate of saucer scallops (Ylistrum balloti) on the Queensland east coast from tag-recaptures. Fish. Res. 250, 1–13. doi: 10.1016/j.fishres.2022.106273
Courtney, A. J., Spillman, C., Lemon, R. T., Thomas, J., Leigh, G., Campbell, A. B., et al. (2015). Physical Oceanographic Influences on Queensland reef fish and scallops. Fisheries Research and Development Corporation (FRDC) Final Report 2013–020.
Del Norte, A. G. C. (1988). Aspects of the growth, recruitment, mortality and reproduction of the Asian moon scallop Amusium pleuronectes (Linne) in the Lingayen Gulf, Philippines. Ophelia 29, 153–68. doi: 10.1080/00785326.1988.10430826
Do, F. (2017). State of the Fisheries Reports 2005/06 to Present. Available online at: https://www.fish.wa.gov.au/Documents/sofar/status_reports_of_the_fisheries_and_aquatic_resources_2017-18.pdf (accession December 12, 2022).
DOF, F. (2000). Fisheries Environmental Management Review No. 1–Gascoyne, Department of Fisheries, Western Australia.
DPIRD (2020a) Saucer Scallop Resource of Shark Bay Harvest Strategy: 2020-2025: Version 1, 0. Perth: Government of Western Australia Department of Fisheries.
DPIRD (2020b) Saucer Scallop Resource of the Abrolhos Islands Harvest Strategy: 2020–2025: Version 1, 1. Perth: Government of Western Australia Department of Fisheries.
Feng, M., Caputi, N., Chandrapavan, A., Chen, M., Hart, A., Kangas, M., et al. (2020). Multi-year marine cold-spells off the west coast of Australia and effects on fisheries. J. Marine Sys. 214. doi: 10.1016/j.jmarsys.2020.103473
Feng, M., McPhaden, M. J., Xie, S. P., and Hafner, J. (2013). La Nina forces unprecedented Leeuwin Current warming in 2011. Nature 3, 1277. doi: 10.1038/srep01277
Fifas, S., Dao, J. C., and Boucher, J. (1990). Un modèle empirique du recrutement pour le stock de coquilles Saint-Jacques, Pecten maximus (L.) en baie de Saint-Brieuc (Manche, France). Aquat. Living Resour. 3, 13–28. doi: 10.1051/alr:1990002
Fletcher, W. J. (2008). “Implementing an ecosystem approach to fisheries management: lessons learned from applying a practical EAFM framework in Australia and the Pacific,” in The Ecosystem Approach to Fisheries (Rome: FAO), 112–124.
Fletcher, W. J., Wise, B. S., Joll, L. M., Hall, N. G., Fisher, E. A., Harry, A. V., et al. (2016). Refinements to harvest strategies to enable effective implementation of Ecosystem Based Fisheries Management for the multi-sector, multi-species fisheries of Western Australia. Fish. Res. 183, 594–608. doi: 10.1016/j.fishres.2016.04.014
Francesconi, K. A., and Clayton, D. (1996). Shark Bay World Heritage Area—management paper for fish resources. Fisheries Management Paper No. 91. Department of Fisheries, Western Australia.
Gascoigne, J., and Lipcius, R. N. (2004). Allee effects in marine systems. Marine Ecol. Prog. 269, 49–59. doi: 10.3354/meps269049
Hart, D. R., Jacobson, L. D., and Tang, J. (2013). To split or not to split: assessment of Georges Bank sea scallops in the presence of marine protected areas. Fish. Res. 144, 74–83. doi: 10.1016/j.fishres.2012.11.004
Hart, D. R., and Rago, P. J. (2006). Long-term dynamics of U.S. Atlantic sea scallop placopecten magellanicus populations. N. Am. J. Fish. Manage. 26, 490–501. doi: 10.1577/M04-116.1
Hobday, A. J., Alexander, L. V., Perkins, S. E., Smale, D. A., Straub, S. C., Oliver, E. C. J., et al. (2016). A hierarchical approach to defining marine heatwaves. Prog. Oceanogr. 141, 227–38. doi: 10.1016/j.pocean.2015.12.014
Johannes, R. E., Wiebe, W. J., Crossland, C. J., Rimmer, D. W., and Smith, S. V. (1983). Latitudinal limits of coral reef growth. Mar. Ecol. Prog Ser. 11, 105–111. doi: 10.3354/meps011105
Joll, L. M. (1994). Unusually high recruitment in the Shark Bay saucer scallop (Amusium balloti) fishery. Mem. Queensl. Mus. 36, 261–67.
Joll, L. M., and Caputi, N. (1995a). Geographic variation in the reproductive cycle of the saucer scallop, Amusium balloti (Bernardi, 1861) (Mollusca: Pectinidae), along the Western Australian coast. Mar. Freshwater Res.46, 779–92. doi: 10.1071/MF9950779
Joll, L. M., and Caputi, N. (1995b). Environmental influences on recruitment in the saucer scallop (Amusium balloti) fishery of Shark Bay, Western Australia. ICES Marine Sci. Symposia 199, 47–53.
Kangas, M., Wilkin, S., Breheny, N., Cavalli, P., and Grounds, G. (2021). “Saucer Scallop Resource Status Report”, in Status Reports of the Fisheries and Aquatic Resources of Western Australia 2020/21: The State of the Fisheries, eds. S.J. Newman, B.S. Wise, K.G. Santoro and D.J. Gaughan. (Western Australia: Department of Primary Industries and Regional Development), 96–103.
Kangas, M. I., Chandrapavan Hetzel, Y.L., and Sporer, E.C. (2012). Minimising gear conflict and resource sharing issues in the Shark Bay trawl fisheries and promotion of scallop recruitment. Fisheries Research Report No 229. Western Australia: Department of Fisheries.
Kangas, M. I., Sporer, E. C., Brown, S., Shanks, M., Chandrapavan, A., and A. Thomson (2011). Stock assessment for the Shark Bay Scallop Fishery. Fisheries research report 226. Western Australia: Department of Fisheries, 76.
Lenanton, R. C., Caputi, N., Kangas, M., and Craine, M. (2009). “The ongoing influence of the Leeuwin Current on economically important fish and invertebrates off temperate Western Australia – has it changed?: in The Leeuwin Current 2007 symposium, ed. K. Meney and M. Brocx. Journal Royal Society of Western Australia. p. 111–128.
Liu, X., Devred, E., Johnson, C. L., Keith, D., and Sameoto, J. A. (2021). Using satellite remote sensing to improve the prediction of scallop condition in their natural environment: Case stud for Georges Bank, Canada. Rem Sens. Env. 254:112251. doi: 10.1016/j.rse.2020.112251
McGarvey, R., Serchuk, F. M., and McLaren, L. A. (1993). Spatial and parentage analysis of stock-recruitment in the Georges Bank sea scallop (Placopecten magellanicus) population. Can. J. Fish Aquat. Sci. 50, 564–574.
Mueller, U., Bloom, L., Kangas, M., Caputi, N., and Tan, T. (2005). “The delineation of fishing times and locations for the Shark Bay, scallop fishery” in Geostatistics for Environmental Applications, eds. P. Renard, H Demougeot-Renard and R Froidevaux. (Springer: Berlin, Germany), p. 87–98.
Mueller, U., Kangas, M., Sporer, E., and Caputi, N. (2012). Variability in the spatial and temporal distribution of the saucer scallop, Amusium balloti in Shark Bay—management implications. Marine Freshwater Res 63, 1152–64. doi: 10.1071/MF12051
National Oceanic and Atmospheric Administration. NOAA Optimum Interpolation (OI) SST V2. Available online at: https://data.noaa.gov/dataset/dataset/noaa-optimum-interpolation-oi-sst-v2 (accessed December 9 2022).
Oliver, E. C. J., Burrows, M, Donat, M., Sen Gupta, A., Alexander, L., and Perkins-Kirkpatrick, S. (2019), Projected marine heatwaves in the 21st century the potential for ecological impact. Front. Mar. Sci. 6, 734. doi: 10.3389/fmars.2019.00734.
Orensanz, J. M. (1986). Size, environment, and density: regulation of a scallop stock and its management implications. Can J Fisheries Aquatic Sci 92, 195–227.
Orensanz, J. M., Parma, A. M., and Iribarne, O. O. (1991). “Population dynamics and management of natural stocks” in Scallops: Biology, Ecology and Aquaculture, ed. S. E. Shumway (Elsevier, Amsterdam) 625–713.
Pearce, A., Lenanton, R., Jackson, G., Moore, J., Feng, M., and Gaughan, D. (2011). The “marine heat wave” off Western Australia during the summer of 2010/11. Fisheries Research Report No. 222. Department of Fisheries, Western Australia.
Pearce, A. F., and Feng, M. (2013). The rise and fall of the “marine heat wave” off Western Australia during the summer of 2010/2011. J Marine Syst 11, 139–156. doi: 10.1016/j.jmarsys.2012.10.009
Shephard, S., Beukers-Stewart, B. D., Hiddink, J. G., Brand, A. R., and Kaiser, M. J. (2010). Strengthening recruitment of exploited scallops Pecten maximus with ocean warming. Mar Biol 157, 91–7. doi: 10.1007/s00227-009-1298-7
Sporer, E., Kangas, M., Brown, S., and Pickles, L. (2012). “Abrolhos Islands and Mid West Trawl Managed Fisheries and South Coast Trawl Fishery Status Report”. in: Status Reports of the Fisheries and Aquatic Resources of Western Australia 2011/12: the State of the Fisheries, eds W.J. Fletcher and K. Santoro. (Western Australia: Department of Fisheries). p. 62–67.
Stokesbury, K. D. E., Carey, J. D., Harris, B. P., and O'Keefe, C. E. (2010). High juvenile sea scallop (Placopecten magellanicus) densities on banks and ledges in the Central Gulf of Maine. J Shellfish Res 29, 369–72. doi: 10.2983/035.029.0212
Vahl, O. (1982). Long-term variations in recruitment of the Iceland scallop, Chlamys islandica from northern Norway. J. Sea Res. 16, 80–87. doi: 10.1016/0077-7579(82)90019-9
Walker, D. I. (1989). “Seagrass in Shark Bay—the foundations of an ecosystem”, in: Seagrasses: A Treatise on the Biology of Seagrasses with Special Reference to the Australian Region, eds. W.D. Larkum, A.J. McComb and S.A. Shepherd (Elsevier/North Holland: Amsterdam), 182–210.
Wolff, M., Taylor, M., Mendo, J., and Yamashiro, C. (2007). A catch forecast model for the Peruvian scallop (Argopecten purpuratus) based on estimators of spawning stock and settlement rate. Eco. Modelling 209, 333–41. doi: 10.1016/j.ecolmodel.2007.07.013
Keywords: scallop fisheries, stock decline, climate change, stock-recruitment, catch prediction, harvest strategies
Citation: Kangas M, Chandrapavan A, Wilkin S and Caputi N (2022) Recovery trajectories and management responses for three scallop stocks over ten years following an extreme marine heatwave in Western Australia. Front. Clim. 4:1043889. doi: 10.3389/fclim.2022.1043889
Received: 14 September 2022; Accepted: 02 December 2022;
Published: 20 December 2022.
Edited by:
Alex Sen Gupta, University of New South Wales, AustraliaReviewed by:
Ute Mueller, Edith Cowan University, AustraliaCopyright © 2022 Kangas, Chandrapavan, Wilkin and Caputi. This is an open-access article distributed under the terms of the Creative Commons Attribution License (CC BY). The use, distribution or reproduction in other forums is permitted, provided the original author(s) and the copyright owner(s) are credited and that the original publication in this journal is cited, in accordance with accepted academic practice. No use, distribution or reproduction is permitted which does not comply with these terms.
*Correspondence: Mervi Kangas,  TWVydmkuS2FuZ2FzQGRwaXJkLndhLmdvdi5hdQ==
Disclaimer: All claims expressed in this article are solely those of the authors and do not necessarily represent those of their affiliated organizations, or those of the publisher, the editors and the reviewers. Any product that may be evaluated in this article or claim that may be made by its manufacturer is not guaranteed or endorsed by the publisher.
Research integrity at Frontiers
Learn more about the work of our research integrity team to safeguard the quality of each article we publish.