 Xi Luo1,2
 Lei Yang
 Dongxiao Wang
94% of researchers rate our articles as excellent or good
Learn more about the work of our research integrity team to safeguard the quality of each article we publish.
Find out more
ORIGINAL RESEARCH article
Front. Clim., 17 November 2022
Sec. Predictions and Projections
Volume 4 - 2022 | https://doi.org/10.3389/fclim.2022.1031158
This article is part of the Research TopicThe Role of Ocean-Atmosphere Interactions and Exchanges in Global and Regional ClimateView all 4 articles
An extremely strong and long-lasting (more than 8 months) oceanic warm core eddy existed in the South China Sea (SCS) from February–October 2010. From July–August 2010, three tropical cyclones (TCs; TC Conson, Chanthu, and Mindulle) consecutively passed over this eddy and sustained at least 21 h. The intensity change of all three TCs reached 20 kt within 24 h when they encountered this eddy. In mid-late July, tropical cyclone heat potential (TCHP) is overall stronger in the eddy region than in its surrounding region, thus TCHP plays an important role in the intensification of TC Conson and Chanthu. It is also found that the intraseasonal oscillation (ISO) and the quasi-biweekly oscillation (QBWO) can be important in favor of the further enhancement of TCs. The TCHP is too low to favor the intensity increase of TC Mindulle in late August, 2010, but weak vertical wind shear, ISO and QBWO act as key roles in the intensification of TC Mindulle.
The South China Sea (SCS) is the largest marginal sea in the western North Pacific (WNP), with about three tropical cyclones (TCs) forming in the SCS and six TCs entering the SCS from the WNP each year during 1993–2018. The intensity changes of TCs are related to both atmospheric environmental variables, such as weak vertical wind shear, moist mid-level, positive vorticity (e.g., Goldenberg et al., 2001; Kaplan and DeMaria, 2003; Camargo et al., 2007), and oceanic factors, including warm sea surface temperature (SST) and deeper thermocline (Cione and Uhlhorn, 2003; Wang and Wu, 2004; Shay and Brewster, 2010). Besides, intraseasonal oscillation (ISO) is an important air–sea coupling mode in the tropics, which has significant seasonal variation in the propagation direction, and has a period of 20–100 days (Madden, 1986; Singh and Kinter, 2020). Quasi-biweekly oscillation (QBWO) has a period of 10–20 days and usually has a northwestward propagation (Wang and Chen, 2017). The ISO and QBWO are active in the SCS and can modulate the genesis and development of TCs (e.g., Li and Zhou, 2013; Ling et al., 2016). Recent studies show that the mesoscale oceanic dynamic process also can modulate the intensity of TCs (Chan et al., 2001; Lin et al., 2005, 2008; Wu et al., 2007; Yablonsky and Ginis, 2012; Ma et al., 2013).
The mesoscale ocean eddy is one of the most energetic mesoscale features in the ocean (Xiu et al., 2010; Ma et al., 2017), which plays an important role in transporting heat and substances and modifying exchange of momentum and heat flux at the air–sea interface (Zhu et al., 2008). Mesoscale ocean eddy includes anticyclonic and cyclonic eddies. Anticyclonic (cyclonic) eddies generate downwelling (upwelling), which results in the thicker (thinner) thermocline and warmer (colder) surface sea temperature (SST) than surrounding region (Chen et al., 2011; Gaube et al., 2015). Therefore, the anticyclonic (cyclonic) eddies are also known as warm (cold) eddies. Abundant mesoscale ocean eddy activities can be found in the SCS, which are active along the northeast-southwest band across the SCS and southwest of Luzon Strait (Hwang and Chen, 2000; Xiu et al., 2010; Chen et al., 2011). The average lifetime of eddies is 8.8 weeks (62 days) in the SCS, and only 26% eddies have longer lifetimes (above 10 weeks; Chen et al., 2011). There is a positive correlation between eddy intensity and lifetime, especially for warm eddies (Xiu et al., 2010). Chen et al. (2011) divided the evolution of long-lived eddies into growth and decay phases and found the radii of eddies increase (decrease) and eddy energy density reduce (increase) during the growth (decay) phase.
Previous studies have investigated the influence of mesoscale ocean eddies on TC activities, including TC intensity and track (Chan et al., 2001; Lin et al., 2005, 2008; Ali et al., 2007; Wu et al., 2007; Ma et al., 2017). Several TCs in the SCS intensify or maintain their strength when they passed over warm eddies (Yang et al., 2016, 2019). Warm eddies act like as an insulator, effectively hindering the heat flux exchange between typhoons and the deeper ocean cold water (Lin et al., 2005). The thick mixed layer owing to the presence of warm eddies can suppress the SST cooling induced by the TCs and supply the heat flux for TCs development. Model simulation results also confirmed the effective role of the warm eddies in the intensification of TCs via enhancing air–sea surface heat flux exchanges (Wu et al., 2007) as well as the tropical cyclone heat potential (TCHP). On the contrary, the cooler sea water related to cold eddies together with the cooling effects induced by the TCs can accelerate the weakening of the TC (Jaimes and Shay, 2009; Ma et al., 2013).
TCs intensity changes in the SCS have been extensively studied (e.g., Sun et al., 2019; Liu and Chan, 2022; Yang et al., 2022). Here, we further surveyed the intensity change of TCs generated in the SCS or the WNP and then entered the SCS during 1993–2018 and found that the 90th percentile of the intensity change of the enhanced TCs within 24 hours in the SCS is 20 knot (kt; 1 kt = 0.51 m/s). Therefore, we define the 24-h TC intensity change of at least 20 kt as strong intensification. From 1993 to 2018, there are 562 records of intensity change in 24 h, with 75 strong intensification events, among which 65.33% of TCs are found passing over the mesoscale ocean eddies.
In the summer of 2010, an exceptionally warm ocean eddy was detected in the northern SCS. The development of this eddy involved a merging process of two small warm eddies, and the eddy has an unusually long lifetime (above 8 months) and large sea level anomaly (SLA; over 0.47 m; Chu et al., 2014). Interestingly, three TCs, Typhoon Conson (TC1), Typhoon Chanthu (TC2), and Typhoon Mindulle (TC3), passed over this warm eddy at the different phases of warm eddy. TC1 passed through the warm eddy for 24 h when the two small eddies are merging into a large warm eddy, and then TC2 encountered the eddy when the two small eddies had just merged into a large warm eddy. One month later, TC3 also passed through this eddy when the eddy is decaying. Correspondingly, the intensity of all three TCs increased up to 20 kt when they passed over the warm eddy. The three TCs passed over the long-lasting eddy at its different phases, yet all three TCs have undergone significant intensity change while passing over the eddy. Therefore, it is worth studying the differences and similarities in the roles of the warm eddy playing in the intensity changes of the three TCs. Are there any other factors involved in the intensity changes? These are the questions we intend to answer in the study.
The hourly horizontal wind, mid-level (600 hPa) relative humidity with a horizontal resolution of 1°latitude × 1°longitude is from the fifth generation of European Reanalysis (ERA5). Interpolated daily outgoing longwave radiation (OLR) with a horizontal resolution of (2.5° × 2.5°) is from the USA National Oceanic and Atmospheric Administration (NOAA).
The 3-h ocean temperature at different depths with a horizontal resolution of 1/12° is downloaded from the gridded reanalysis product based on Hybrid Coordinate Ocean Model (HYCOM) and the Navy Coupled Ocean Data Assimilation (NCODA). It has 41 layers and can be used to analyze the vertical thermal structure of the ocean. To detect and track mesoscale ocean eddy, the daily SLA data from the French Archiving, Validation, and Interpretation of Satellite Oceanographic data (AVISO) project is used. The SLA data starts from 1993 and has 0.25° × 0.25° resolution.
To track the activities of TCs, the best-track dataset from the International Best Track Archive for Climate Stewardship (IBTrACS) (Version v04r00; Knapp et al., 2010) is used in this study. In this study, we only consider the TCs with the maximum sustained wind (MSW) speed above 34 kt.
The 20–100-day and 10–20-day Butterworth band-pass filtered OLR data are used to represent the ISO and QBWO activities in the SCS, respectively.
The TCHP has been used to quantify the impact of ocean heat content on TC's intensification (Lin et al., 2008). TCHP is integrated ocean heat content relative to the 26 isotherm, which is calculated using the following expression (Leipper and Volgenau, 1972; Liu and Chan, 2022):
where Cp is the capacity heat of the seawater at constant pressure, taken as 4,178 J/kg·°C and ρ is the average seawater density of the upper ocean taken as 1,026 represents the depth of the 26°C isotherm and T(z) is the in situ temperature.
This exceptionally warm eddy in the SCS in 2010 had been comprehensively analyzed by Chu et al. (2014). A warm eddy (WE1) was generated in the northeastern SCS on 3 February 2010, and then it propagated westward near the Vietnam coast in early April (Chu et al., 2014). From May, WE1 moved northward to the Xisha Islands and expanded in size. On 9 June, another warm eddy (WE2) formed east of the Xisha Islands and moved northwestward. The co-existence of two small warm eddies (WE1 and WE2) in the SCS demonstrates the beginning of the developing phase. From 10 July, WE1 moved further northward and caught up with the WE2 to merge into a larger warm eddy, named WE3. WE3 appears as a band structure with a southwest-northeast orientation and the radius of WE3 reached its maximum before 19 July, which is considered the end of the merging phase. After 19 July, WE3 moved southward with reduced strength, then dissipated on 13 October (Figure 6 in Chu et al., 2014). If only considering the period from 9 June to 13 October, the life period of this eddy can be divided into three phases: the developing phase (9 June to 9 July); the merging phase (10–19 July); and the decaying phase (20 July to 13 October).
Figure 1 shows the location of eddies, the distribution of SLA, and TCs' trajectory. TC1 formed in the WNP on 12 July, then moved northwestward and entered the SCS on 14 July while the warm eddy was in the merging phase. After entering the SCS, the intensity of TC1 weakened until it was close to the two eddies, WE1 and WE2 (Figure 2A). When TC1 encountered the eddies on 15 July, positive SLA dominated the north SCS (Figure 1A). The WE1 located east of Vietnam, with maximum SLA above 0.5 m [The difference of maximum SLA between this study and Chu et al. (2014) is mainly due to the usage of a different dataset of SLA]. WE2 is located northeast of WE1 with a lower maximum SLA than WE1. The intensity of TC1 boosted from 55 to 75 kt and upgraded to a typhoon (Category 1) when it passed over the region between WE1 and WE2, then it reached its maximum intensity (80 kt) before landing (Figure 2A). TC2 generated near the eastern coast of Philippines in the WNP, then it moved northwestward and entered the SCS after TC1 passed over the region between WE1 and WE2. TC2 passed over the eddy on 20–21 July when WE1 and WE2 just merged as WE3 and intensified 20 kt during the 21 h (Figures 1B, 2B). Both TC1 and TC2 reached maximum intensity over the SCS when they closed to land, the intensification may result from shallow coastal warm water (Pun et al., 2019), coastal downwelling (Gramer et al., 2022), or positive feedback of radiative forcing (Lok et al., 2021). A tropical depression formed in the SCS on 21 August and moved westward, then passed through WE3 on 22 August when the eddy entered the decay phase. Within 27 h (from 6 a.m. on August 22 to 9 a.m. on 23 August), the tropical depression intensified into a tropical storm (TC3) with an increase of 22 kt in its MSW. Particularly, the intensity of TC3 rapidly increased by 20 kt from 6 p.m. on August 22 to 6 a.m. on 23 August (12 h; Figure 2C). All three TCs experienced strong intensification within 24 h when they encountered the warm eddy at its different phase.
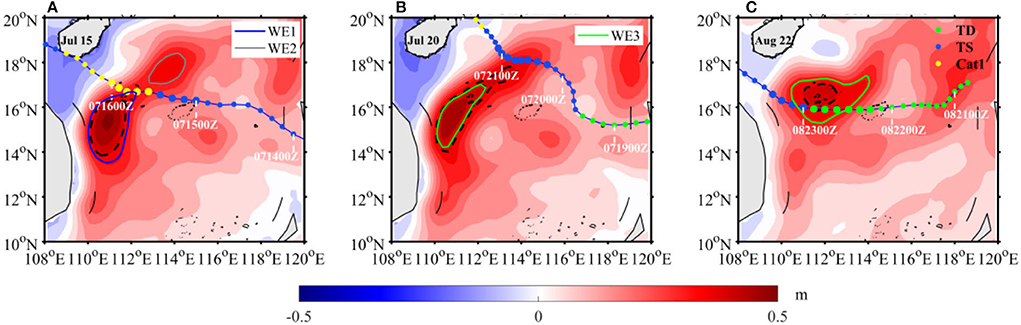
Figure 1. The sea level anomaly (shading; unit: m) in the SCS on (A) 15 July, (B) 20 July, and (C) 22 August. The black dotted line represents the 0.4 m SLA contour on the same day. Green, blue, and yellow dots indicate the tropical depression, tropical storm, and Category 1 typhoon (based on the Saffir-Simpson scale), respectively. The bigger dots represent the locations of TC passing over the warm eddy. Blue, gray, and green contours represent the boundary of WE1, WE2, and WE3, respectively. The tracks and locations of TC1/Conson in (A), TC2/Chanthu in (B), and TC3/Mindulle in (C) are superimposed.
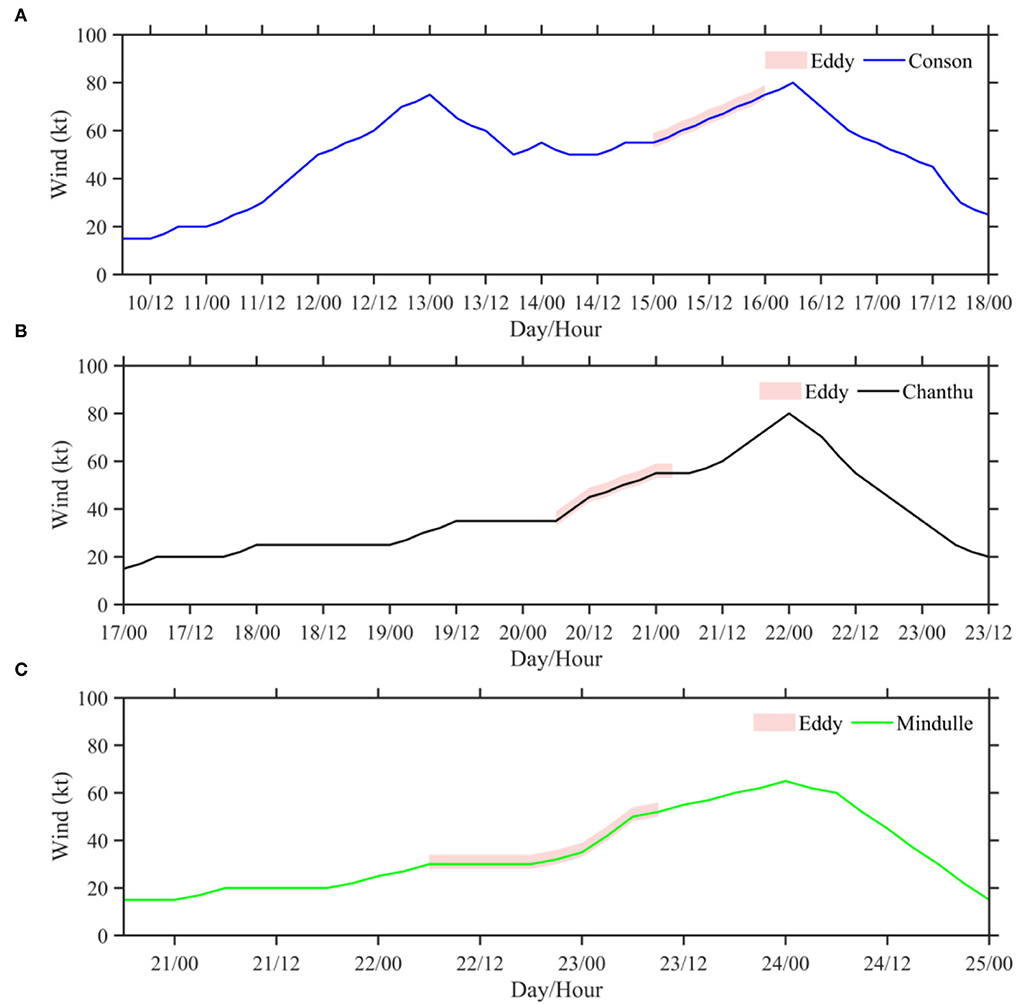
Figure 2. The evolution of sustained maximum wind speed of (A) TC1/Conson, (B) TC2/Chanthu, and (C) TC3/Mindulle. The pink shading represents the maximum wind speed of TCs when they passed over the warm eddy.
TCHP is usually taken as a criterion of ocean heat content that supports TC intensification (Yan et al., 2017). Figure 3 shows the distribution of TCHP in the northern SCS 1 day before, during, and after the passage of TC1, TC2, and TC3. Higher TCHP can be found over the warm eddies in the SCS (Figure 3). WE1 has the highest TCHP and the largest SLA (above 0.5 m) in the northwestern SCS, while the WE2, has a smaller size and lower TCHP as well as weak SLA. After TC1 passed over the area between WE1 and WE2, the TCHP over both the WE2 and northeastern quadrant of WE1 significantly decreased, resulting from the enhanced mixing of TC1 (Figures 3A–C). With the merging of WE1 and WE2, TCHP in the eddy recovered quickly, which favors the intensification of TC2 during its passage over WE3 (Figures 3D–F). When WE1 and WE2 just merged as WE3, WE3 had lower TCHP and a larger area of 0.4 m SLA contour than WE1 (Figures 3E,F). During the decay phase of the eddy, the WE3 changed from a band-like structure to a round shape. Compared to that in late July, both TCHP and the area of 0.4 m SLA contour in eddy during late August are greatly reduced (Figure 3).
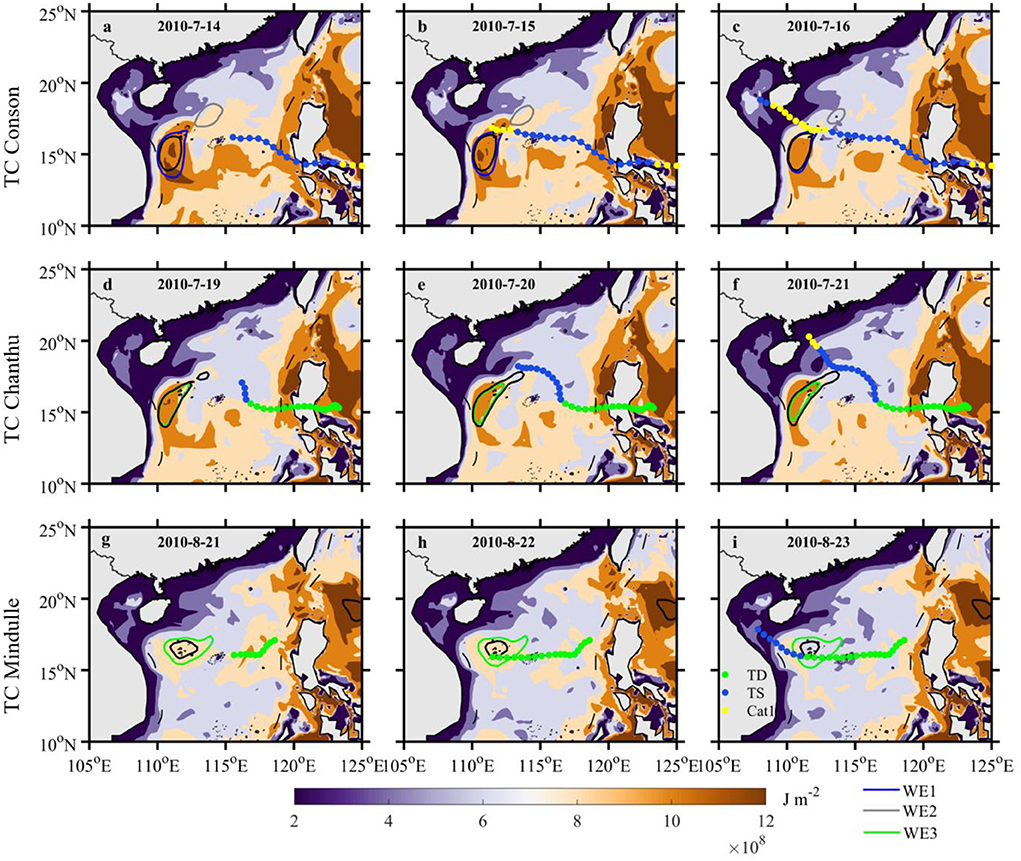
Figure 3. The TCHP (shading; unit: J m−2) in the SCS 1 day before TCs pass over the warm eddy (a,d,g), the day TCs pass over the warm eddy (b,e,h), and 1 day after TCs passed over the warm eddy (c,f,i). The dots represent the location and trajectory of TCs. Green, blue, and yellow dots indicate the tropical depression, tropical storm, and Category 1 typhoon (based on the Saffir-Simpson scale), respectively. Black contours represent the 0.4 m SLA. Blue, gray, and green contour represents the boundary of WE1, WE2, and WE3, respectively.
To further explore the dynamic mechanism of the strong intensification for three TCs when they passed through the warm eddy at its different phases, the meridional average of 12°N−18°N is used to show the change of environmental variables and intraseasonal activities in the main meridional range of the warm eddy. Based on the location of the warm eddy, here we define 110°E−115°E as an eddy region and 115°E−120°E as a non-eddy region.
Figure 4 shows the zonal variation of oceanic and atmospheric environmental variables and intraseasonal convective activities before TCs passed through the eddy. The TCHP is calculated the day before TC passed over the eddy. The TCHP is plotted only from 110°E to 118°E in Figure 4A since the area west of 110°E is close to the land and east of 118°E belongs to the warm pool of WNP that has much higher TCHP (Figure 3). Atmospheric environmental variables and intraseasonal activities are averaged during 3 days before TC passed over the eddy to eliminate the influence of TC circulation.
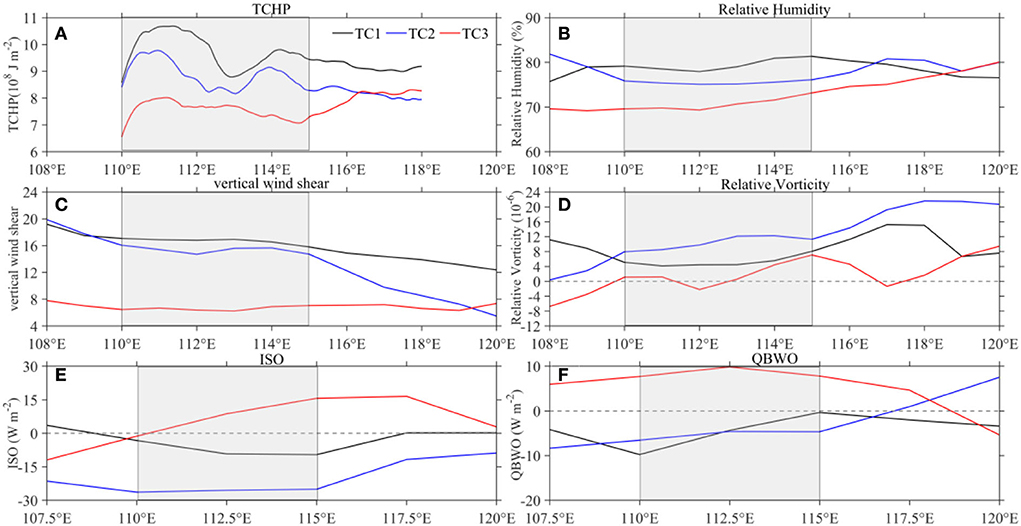
Figure 4. The 12°N−18°N meridional averaged TCHP on 1 day before TCs encountered with warm eddy (A), 600 hPa relative humidity (B), vertical wind shear (C), 850 hPa relative vorticity (D), convective activities related to ISO (E), and QBWO (F) during 3 days before TCs entered the SCS. Black (blue and red) line represents the zonal variation of environmental variables or intraseasonal convective activities related to TC1/Conson, TC2/Chanthu, and TC3/Mindulle, respectively. Dotted line indicated the zero value of relative vorticity (D) and ISO (E) as well QBWO (F). Gray shaded area indicates the eddy region.
For the TC1, there are two peaks of TCHP in Figure 4A, one reaching 10.688 × 10⁸ J m−2 near 111°E and the other is 9.809 × 10⁸ J m−2 at 114°E, respectively. Compared to the non-eddy region (115°E to 120°E), the oceanic environment over the eddy region (110°E−115°E) can favor TC1 intensification due to higher TCHP (Figure 4A). From the perspective of atmospheric environmental variables, the 600 hPa relative humidity remains high with an average of 78.7% with small variations (< 5.6%), which means the mid-level atmosphere is humid enough for TC activities, but may not play an important role in the intensity change of TC1 (Figure 4B). Vertical wind shear and relative vorticity show reversed change in the eddy region and non-eddy region. Vertical wind shear in the eddy region is greater than in the non-eddy region, which cannot boost the intensity of TC1 in the eddy region (Figure 4C). Similar change can be found in relative vorticity, relative vorticity in eddy region is less than that in the non-eddy region (Figure 4D). Thus, atmospheric environmental variables provide an unfavorable environment for TC1 intensification when TC1 passes the warm eddy. In addition, the intraseasonal activities (including ISO and QBWO) show strong positive convective activity anomaly over the region of 110°-117.5°E. The maximum convection related to ISO and QBWO are located over the eddy region (Figures 4E,F), suggesting a strong influence of intraseasonal activities on the intensification of TC1 over the eddy region. Therefore, we can conclude the higher TCHP related to warm eddy and convection associated with the ISO as well as QBWO all contribute to the intensification of TC1.
TC2 passed through WE3 2 days after TC1 made landfall in Vietnam (18 July). Although the TCHP on 19 July has a similar location of the maximum TCHP (9.78 × 10⁸ J m−2) on 14 July, it is smaller than on 14 July (Figure 3). The TCHP can boost the intensity of TC2 due to higher TCHP in the eddy region (Figure 4A). Similar to the situation when TC1 passed over the eddy, high relative humidity with small variation, strong vertical wind shear and lower relative vorticity also cannot lead to the intensification of TC2 over the eddy region (Figures 4B–D). However, positive convective activity related to the ISO and the QBWO is stronger in the eddy region than in the non-eddy region (Figures 4E,F), suggesting both ISO and QBWO can favor TC2's intensification when TC2 passed through the eddy.
Different from TC1 and TC2, TC3 is the only TC formed in the SCS among the three TCs and passed through a warm eddy during the decaying phase. As seen in Figure 4A, the peak of TCHP in the non-eddy region is larger than in the eddy region, which may attribute to the decay of warm eddy. Relative humidity at 600 hPa in the eddy region is drier than in the non-eddy region, which is unfavorable for TC3 intensification over the eddy region (Figure 4B). Relative vorticity was too low to boost the intensification of TC3 in the eddy region (Figure 4D). However, the vertical wind shear is overall weak over the entire SCS, which provide favorable condition for TC3 intensification (Figure 4C). Meanwhile, the positive convection related to the ISO west of the 110°E is also favorable for the intensification of TC3 (Figure 4E). Thus, both weak vertical wind shear and ISO may favor TC3 intensification over the eddy when it is decayed.
Based on the analyses of environmental variables and intraseasonal activities along the movement of the three TCs, TCHP, vertical wind shear, ISO and QBWO can be considered as the key factors for the strong intensification of TCs. The strong intensification of three TCs resulted from combined forcing, which varies with different TCs. The intensifications of TC1 and TC2 are mainly caused by high TCHP in the warm eddy and positive intraseasonal activities. The enhancement of TC3 may be more related to positive intraseasonal activities and weak vertical wind shear.
To further explore the variation of TCHP during different phases of warm eddy and investigate the impact of ISO and QBWO on the TCs' intensity change, the evolution of the three variables have been shown in Figures 5, 6, respectively.
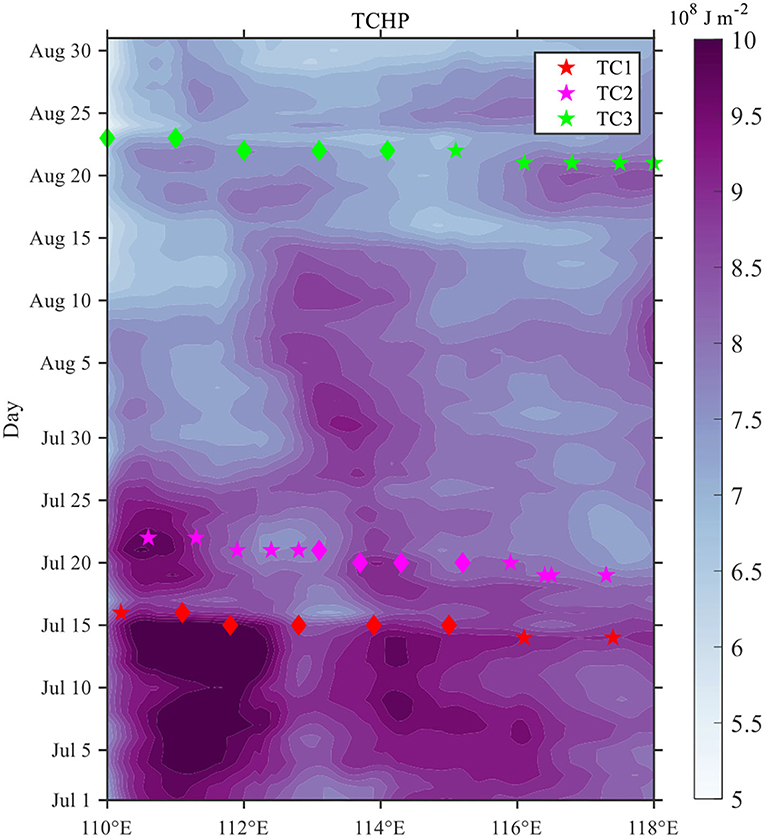
Figure 5. Longitude-time series of TCHP (shading; units: J m−2), averaged 12°N−18°N. Red, purple, and green stars represent the zonal location of TC1/Conson, TC2/Chanthu, and TC3/Mindulle, respectively. Red, purple, and green diamonds represent the zonal location of TCs passing over the warm eddy.
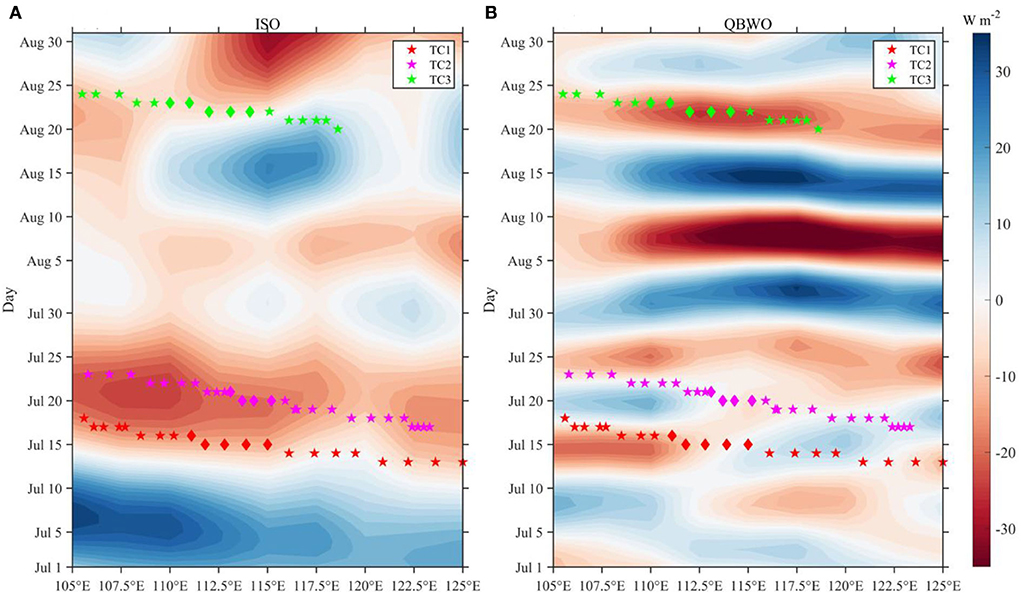
Figure 6. (A) Longitude-time series of ISO (shading; units: W m−2), averaged 10°N−20°N. (B) Longitude-time series of QBWO (shading; units: W m−2), averaged 10°N−20°N. Red, purple, and green stars represent the zonal location of TC1/Conson, TC2/Chanthu, and TC3/Mindulle, respectively. Red, purple, and green diamonds represent the zonal location of TCs passing over the warm eddy.
Figure 5 shows the zonal-time variation of meridional averaged TCHP. There is a high TCHP center located at 110°E−112°E in July while a sub-high TCHP center is located around 115°E. Both the two centers of high TCHP developed in early July and decayed since mid-July. Only one high TCHP center can be seen in August, which is located at 113°E−114°E. TC1 moved to the eddy region with higher TCHP and then intensified (Figure 5). When TC2 was passing through the warm eddy with higher TCHP located at 114°E, it experienced strong intensification (Figure 5). TC3 formed in the region with higher THCP, then it moved westward to eddy-region with relatively lower TCHP. In summary, the presence of warm eddy can increase the intensity of TC1 and TC2 by its higher TCHP but it cannot favor the enhancement of TC3.
From mid-July to late July, the positive convective activity associated with the ISO dominated the northern SCS, while the center of convective activity located around 105°E−110°E (Figure 6A). TC1 and TC2 successively moved westward and passed over this convective region. Along the trajectory of TC1, it is can be found that the convective activity was stronger in the eddy region than in the non-eddy region. The ISO activity can thus favor TC1 intensification. Meanwhile, TC2 arrived at the eddy region with a stronger convective activity which could favor its intensification. TC3 formed in a suppressed convective region and then moved westward to an eddy region with weak convective. The ISO activity thus can favor the intensification of TC3 in the eddy region. Regarding QBWO (Figure 6B), both TC1 and TC3 passed through the eddy region with stronger convective activity related to the QBWO, thus the QBWO activity was favorable for the intensification of TC1 and TC3. But for the intensification of TC2, the convective activity related to QBWO is not favorable. In conclusion, high TCHP combined with ISO and QBWO tend to intensify TC1 and TC2 when TCs passed through a warm eddy. But in late August, the effect of TCHP became weak while ISO and QBWO could have an important impact on the intensification of TC3.
In this study, we investigated the intensification of three TCs that consecutively passed over a long-lasting warm ocean eddy in the South China Sea in 2010. With the evolution of this warm eddy, the life cycle of a warm eddy can be divided into three phases: developing, merging, and decaying. In the merging phase, TC Conson passed through the area between WE1 and WE2, and its intensity increased by 20 kt for 24 h. Then, TC Chanthu passed over the northeastern quadrant of the warm eddy and enhanced 20 kt during 21 h. After 1 month, TC Mindulle encountered the center of the warm eddy at the decaying phase of this eddy. Three TCs passed over this warm eddy in different phases of the warm eddy, and all three TCs intensified by at least 20 kt within 24 h over the warm eddy.
Ocean warm eddy plays an important role in the intensification of TC1 and TC2 because it can modulate the intensity of TCs with high TCHP, which can inhibit cooling induced by the strong mixing of TCs. The TCHP in the eddy region is different in the different phases of the warm eddy, with higher TCHP in the merging phase while the lower TCHP in the decaying phase. Based on the location of the eddy, the region of 110°E−115°E is defined as an eddy region while the region of 115°E−120°E is a non-eddy region. TCHP in the eddy region is larger than it in the non-eddy region, which provides a favorable environment for strong intensification (24-h TC intensity change ≥ 20 kt) of TC1 and TC2. Besides, the convective activity associated with ISO and QBWO are active over the SCS and act key roles in the intensification of three TCs. However, the atmospheric environmental variables, including strong vertical wind shear, and weak low-level relative vorticity are unfavorable for the development of TC1 and TC2 over the eddy region. A humid mid-level atmosphere could not be the important factor for the intensification of TC1 and TC2 when they pass the warm eddy since it has a small variation between the eddy region and the non-eddy region. Thus, with the combined effect of TCHP, ISO, and QBWO, TC1 and TC2 experienced strong intensification when they passed through the warm eddy. With the decay of warm eddy, the TCHP reduced in late August thus oceanic environmental cannot favor the increase of TC3's intensity. But the ISO, QBWO, and weak vertical wind shear can provide favorable conditions for the strong intensification of TC3.
All data used are available from the following website: IBTrACS (https://www.ncdc.noaa.gov/ibtracs/index.php?name=ibv4-access), ERA5 (https://cds.climate.copernicus.eu/cdsapp#!/dataset/reanalysis-era5-pressure-levels?tab=overview), OLR (https://psl.noaa.gov/data/gridded/data.olrcdr.interp.html), AVISO (https://resources.marine.copernicus.eu/product-detail/SEALEVEL_GLO_PHY_L4_MY_008_047/INFORMATION), and HYCOM (https://ncss.hycom.org/thredds/ncss/grid/GLBv0.08/expt_53.X/data/2010/dataset.html).
DW and WY contributed to the conception of this study. XL conducted the data analyses. LY and XL designed the study and contributed to writing the paper. All authors discussed the result of the study and contributed to manuscript revision, read, and approved the submitted version.
This study was supported by Key Laboratory of South China Sea Meteorological Disaster Prevention and Mitigation of Hainan Province (SCSF202002) and the National Natural Science Foundation of China (92158204). LY was also funded by the Key Special Project for Introduced Talents Team of Southern Marine Science and Engineering Guangdong Laboratory (Guangzhou; GML2019ZD0306), the Guangzhou City Project (202102080482), the Strategic Priority Research Program of Chinese Academy of Sciences (XDA20060500), and Guangdong Basic and Applied Basic Research Foundation (2022A1515010945).
We would like to thank Chi Xu for supporting the program of simple eddy detection.
The authors declare that the research was conducted in the absence of any commercial or financial relationships that could be construed as a potential conflict of interest.
All claims expressed in this article are solely those of the authors and do not necessarily represent those of their affiliated organizations, or those of the publisher, the editors and the reviewers. Any product that may be evaluated in this article, or claim that may be made by its manufacturer, is not guaranteed or endorsed by the publisher.
Ali, M. M., Sinha, P., Jain, S., and Mohanty, U. C. (2007). Impact of sea surface height anomalies on cyclone track. Nat. Prec. 1:1. doi: 10.1038/npre.2007.1001.1
Camargo, S. J., Emanuel, K. A., and Sobel, A. H. (2007). Use of a genesis potential index to diagnose ENSO effects on tropical cyclone genesis. J. Climate 20, 4819–4834. doi: 10.1175/JCLI4282.1
Chan, J. C. L., Duan, Y., and Shay, L. K. (2001). Tropical cyclone intensity change from a simple ocean–atmosphere coupled model. J. Atmos. Sci. 58, 154–172. doi: 10.1175/1520-0469(2001)058<0154:TCICFA>2.0.CO;2
Chen, G., Hou, Y., and Chu, X. (2011). Mesoscale eddies in the South China Sea: mean properties, spatiotemporal variability, and impact on thermohaline structure. J. Geophys. Res. 116, C06018. doi: 10.1029/2010JC006716
Chu, X., Xue, H., Qi, Y., Chen, G., Mao, Q., Wang, D., et al. (2014). An exceptional anticyclonic eddy in the South China Sea in 2010. J. Geophys. Res. 119, 881–897. doi: 10.1002/2013JC009314
Cione, J. J., and Uhlhorn, E. W. (2003). Sea surface temperature variability in hurricanes: implications with respect to intensity change. Monthly Weather Rev. 131, 1783–1796. doi: 10.1175//2562.1
Gaube, P., Chelton, D. B., Samelson, R. M., Schlax, M. G., and O'Neill, L. W. (2015). Satellite observations of mesoscale eddy-induced ekman pumping. J. Phys. Ocanograph. 45, 104–132. doi: 10.1175/JPO-D-14-0032.1
Goldenberg, S. B., Landsea, C. W., Mestas-Nunez, A. M., and Gray, W. M. (2001). The recent increase in Atlantic hurricane activity: causes and implications. Science 293, 474–479. doi: 10.1126/science.1060040
Gramer, L. J., Zhang, J. A., Alaka, G., Hazelton, A., and Gopalakrishnan, S. (2022). Coastal downwelling intensifies landfalling hurricanes. Geophys. Res. Lett. 49, e2021GL096630. doi: 10.1029/2021GL096630
Hwang, C., and Chen, S.-A. (2000). Circulations and eddies over the South China Sea derived from TOPEX/Poseidon altimetry. J. Geophys. Res. 105, 23943–23965. doi: 10.1029/2000JC900092
Jaimes, B., and Shay, L. K. (2009). Mixed layer cooling in mesoscale oceanic eddies during hurricanes katrina and rita. Monthly Weather Rev. 37, 4188–4207. doi: 10.1175/2009MWR2849.1
Kaplan, J., and DeMaria, M. (2003). Large-scale characteristics of rapidly intensifying tropical cyclones in the North Atlantic Basin. Weather Forecast. 18, 1093–1108. doi: 10.1175/1520-0434(2003)018<1093:LCORIT>2.0.CO;2
Knapp, K. R., Kruk, M. C., Levinson, D. H., Diamond, H. J., and Neumann, C. J. (2010). The International Best Track Archive for Climate Stewardship (IBTrACS): Unifying tropical cyclone best track data. Bull. Am. Meteorolog. Soc. 91, 363–376. doi: 10.1175/2009BAMS2755.1
Leipper, D. F., and Volgenau, D. (1972). Hurricane heat potential of the gulf of mexico. J. Phys. Ocanograph. 2, 218–224. doi: 10.1175/1520-0485(1972)002<0218:HHPOTG>2.0.CO;2
Li, R. C. Y., and Zhou, W. (2013). Modulation of Western North Pacific tropical cyclone activity by the ISO. Part I: genesis and intensity. J. Climate 26, 2904–2918. doi: 10.1175/JCLI-D-12-00210.1
Lin, I.-I., Wu, C., Emanuel, K. A., Lee, I., Wu, C., and Pun, I. (2005). The interaction of supertyphoon Maemi (2003) with a warm ocean eddy. Monthly Weather Rev. 133, 2635–2649. doi: 10.1175/MWR3005.1
Lin, I.-I., Wu, C., Pun, I., and Ko, D. (2008). Upper-ocean thermal structure and the western north pacific category 5 typhoons. Part I: ocean features and the category 5 typhoons' intensification. Monthly Weather Rev. 136, 3288–3306. doi: 10.1175/2008MWR2277.1
Ling, Z., Wang, Y., and Wang, G. (2016). Impact of intraseasonal oscillations on the activity of tropical cyclones in summer over the South China Sea. Part I: local tropical cyclones. J. Climate 29, 855–868. doi: 10.1175/JCLI-D-15-0617.1
Liu, K. S., and Chan, J. C. L. (2022). Growing threat of rapidly-intensifying tropical cyclones in East Asia. Adv. Atmos. Sci. 39, 222–234. doi: 10.1007/s00376-021-1126-7
Lok, C. C. F., Chan, J. C. L., and Toumi, R. (2021). Tropical cyclones near landfall can induce their own intensification through feedbacks on radiative forcing. Commun. Earth Environ. 2, 8. doi: 10.1038/s43247-021-00259-8
Ma, Z., Fei, J., Liu, L., Huang, X., and Cheng, X. (2013). Effects of the cold core eddy on tropical cyclone intensity and structure under idealized air–sea interaction conditions. Monthly Weather Rev. 141, 1285–1303. doi: 10.1175/MWR-D-12-00123.1
Ma, Z., Fei, J., Liu, L., Huang, X., and Li, Y. (2017). An investigation of the influences of mesoscale ocean eddies on tropical cyclone intensities. Monthly Weather Rev. 145, 1181–1201. doi: 10.1175/MWR-D-16-0253.1
Madden, R. A. (1986). Seasonal variations of the 40-50 day oscillation in the tropics. J. Atmos. Sci. 43, 3138–3158. doi: 10.1175/1520-0469(1986)043<3138:SVOTDO>2.0.CO;2
Pun, I. F., Chan, J. C. L., Lin, I. I., Chan, K. T. F., Price, J. F., Ko, D. S., et al. (2019). Rapid intensification of typhoon Hato (2017) over shallow water. Sustainability 11, 3709. doi: 10.3390/su11133709
Shay, L. K., and Brewster, J. K. (2010). Oceanic heat content variability in the eastern pacific ocean for hurricane intensity forecasting. Month. Weather Rev. 138, 2110–2131. doi: 10.1175/2010MWR3189.1
Singh, B., and Kinter, J. L. (2020). Tracking of tropical intraseasonal convective anomalies: 1. Seasonality of the tropical intraseasonal oscillations. J. Geophys. Res. 125, e2019JD030873. doi: 10.1029/2019JD030873
Sun, J., Xu, F., Oey, L. Y., and Lin, Y. (2019). Monthly variability of Luzon Strait tropical cyclone intensification over the Northern South China Sea in recent decades. Climate Dyn. 52, 3631–3642. doi: 10.1007/s00382-018-4341-x
Wang, X., and Chen, G. (2017). Quasi-biweekly oscillation over the South China Sea in late summer: propagation dynamics and energetics. J. Climate 30, 4103–4112. doi: 10.1175/JCLI-D-16-0533.1
Wang, Y., and Wu, C.-C. (2004). Current understanding of tropical cyclone structure and intensity changes - a review. Meteorol. Atmos. Phys. 87, 257–278. doi: 10.1007/s00703-003-0055-6
Wu, C., Lee, C., and Lin, I.-I. (2007). The effect of the ocean eddy on tropical cyclone intensity. J. Atmos. Sci. 64, 3562–3578. doi: 10.1175/JAS4051.1
Xiu, P., Chai, F., Shi, L., Xue, H., and Chao, Y. (2010). A census of eddy activities in the South China Sea during 1993–2007. J. Geophys. Res. 115, C03012. doi: 10.1029/2009JC005657
Yablonsky, R. M., and Ginis, I. (2012). Impact of a warm ocean eddy's circulation on hurricane-induced sea surface cooling with implications for hurricane intensity. Month. Weather Rev. 141, 997–1021. doi: 10.1175/MWR-D-12-00248.1
Yan, Y., Li, L., and Wang, C. (2017). The effects of oceanic barrier layer on the upper ocean response to tropical cyclones. J. Geophys. Res. 122, 4829–4844. doi: 10.1002/2017JC012694
Yang, F., Peng, H., Du, Y., and Wu, G. (2016). A GIS study of the influences of warm ocean eddies on the intensity variations of tropical cyclones in the South China Sea. ISPRS Int. J. Geo-Informat. 5, 169. doi: 10.3390/ijgi5100169
Yang, L., Luo, X., Chen, S., Zhou, X., Wang, W., and Wang, D. (2022). Characteristics of rapidly intensifying tropical cyclones in the South China Sea, 1980–2016. Adv. Climate Change Res. 13, 333–343. doi: 10.1016/j.accre.2022.04.004
Yang, W., Cai, Q., Li, X., and Cheng, S. (2019). Observational and numerical study of impacts of ocean warm eddy on Rammasun (2014). J. Natural Disast. 28, 165–174. doi: 10.13577/j.jnd.2019.0120
Keywords: tropical cyclone, mesoscale ocean eddy, the South China Sea, tropical cyclone heat potential, intraseasonal oscillation
Citation: Luo X, Yang W, Yang L and Wang D (2022) The intensification of consecutive three tropical cyclones passing over a warm ocean eddy in the South China Sea. Front. Clim. 4:1031158. doi: 10.3389/fclim.2022.1031158
Received: 29 August 2022; Accepted: 20 October 2022;
Published: 17 November 2022.
Edited by:
M. M. Ali, Florida State University, United StatesReviewed by:
Lucas Harris, Princeton University, United StatesCopyright © 2022 Luo, Yang, Yang and Wang. This is an open-access article distributed under the terms of the Creative Commons Attribution License (CC BY). The use, distribution or reproduction in other forums is permitted, provided the original author(s) and the copyright owner(s) are credited and that the original publication in this journal is cited, in accordance with accepted academic practice. No use, distribution or reproduction is permitted which does not comply with these terms.
*Correspondence: Dongxiao Wang, ZHh3YW5nQG1haWwuc3lzdS5lZHUuY24=
Disclaimer: All claims expressed in this article are solely those of the authors and do not necessarily represent those of their affiliated organizations, or those of the publisher, the editors and the reviewers. Any product that may be evaluated in this article or claim that may be made by its manufacturer is not guaranteed or endorsed by the publisher.
Research integrity at Frontiers
Learn more about the work of our research integrity team to safeguard the quality of each article we publish.