 Nahid A. Hasan
 Yoshimitsu Chikamoto
 Michael J. McPhaden
94% of researchers rate our articles as excellent or good
Learn more about the work of our research integrity team to safeguard the quality of each article we publish.
Find out more
ORIGINAL RESEARCH article
Front. Clim., 20 September 2022
Sec. Predictions and Projections
Volume 4 - 2022 | https://doi.org/10.3389/fclim.2022.1001174
This article is part of the Research TopicInteractions among Climates of Ocean BasinsView all 8 articles
The recharge oscillator mechanism suggests that a strong El Niño event can trigger a following La Niña event that sometimes lasts for two or even three years through warm water volume preconditioning within the tropical Pacific. However, a prominent and persistent “double-dip” La Niña event appeared in the boreal winters of 2020/2021 and 2021/2022 without any significant El Niño preconditioning. Here we explore the possibility that tropical basin interactions may have initiated and helped to prolong La Niña conditions over the 2-year period 2020–2022. This period was preceded by a strong positive Indian Ocean Dipole (IOD) during the boreal fall of 2019 that gave way to basin-scale warming in the Indian Ocean in early 2020 and a notable tropical Atlantic warming in the boreal winter of 2019/2020. Later, a strong Atlantic Niño developed in the boreal summer of 2021. Using composite analyses to characterize earlier double-dip La Niñas, we argue the unusual sequence of events in 2019–2021 in the Indian and Atlantic Oceans may have energized and sustained the 2020–2022 La Niña event without any significant warm water volume preconditioning within the tropical Pacific.
The El Niño Southern Oscillation (ENSO), a dominant mode of climate variability on interannual timescales, has significant impacts on climate worldwide through atmospheric teleconnections (Glantz, 2001; Clarke, 2008; Hirons and Klingaman, 2016; Wang, 2019). For example, the negative or cold phase of ENSO (i.e., La Niña), defined by below-average sea surface temperature in the eastern equatorial Pacific, strengthened trade winds, and enhanced convection in the western tropical Pacific leads to more cyclone landfalls in continental Asia and China, and increased hurricane activity in the Caribbean and central Atlantic (Ropelewski and Halpert, 1987; Bove, 1998; Wu et al., 2004; Hoyos et al., 2013; Zhao and Wang, 2019). La Niña also favors increased rainfall in Australia, Indonesia, and southern Africa, but a greater probability of drought in the western United States (Wang et al., 2000; Cai et al., 2010; Yu et al., 2012; Jong et al., 2020). La Niñas sometimes persist for two or even three years, referred to as double-dip or triple-dip La Niña (DiNezio et al., 2017a,b; Luo et al., 2017; Okumura et al., 2017; Iwakiri and Watanabe, 2020), which causes prolonged drought conditions in the western United States and severe flooding in the southeast Asia (Chikamoto et al., 2015; Yoon and Leung, 2015; Fasullo et al., 2018). From a perspective of proactive management, skillful ENSO prediction can help decision-makers, stakeholders, and policymakers to develop mitigation strategies for impending natural threats. Thus, understanding the mechanisms that energize ENSO development is a priority for improving climate predictability on seasonal time scales.
A key ENSO mechanism involves internal ocean dynamics within the tropical Pacific characterized by the upper 300 m ocean heat content (OHC) or warm water volume variations (Wyrtki, 1985; Meinen and McPhaden, 2000). According to ENSO recharge theory (Wyrtki, 1985; Jin, 1997), trade winds control the build-up or release of the warm water volume due to meridional Sverdrup transport, leading to the activation of the Bjerknes feedback. During the mature stage of El Niño, warmer SST in the eastern Pacific accompanies weakened trade winds and a relaxed zonal thermocline tilt (deeper in the east and shallower in the west). This thermocline tilting is followed by a discharge of heat from the equatorial Pacific to higher latitudes, leading to a shallower thermocline and El Niño decay. The resultant shallower thermocline and negative OHC subsequently induce colder SST in the eastern Pacific as the energizing process for La Niña. In case of a strong El Niño, the discharging process of the equatorial Pacific OHC can leave a very large deficit that persists for more than 1 year, leading to a double or sometimes even a triple-dip La Niña (Okumura and Deser, 2010). Based on the recharge oscillator theory, boreal spring OHC averaged across the equatorial Pacific is an effective ENSO precursor for the following winter (Burgers et al., 2005; Ruiz et al., 2005; McPhaden et al., 2006a; Lima et al., 2009; Izumo et al., 2010, 2014; Yu et al., 2016), though some studies have pointed out that the western Pacific OHC during the previous fall could be a better and longer lead ENSO precursor compared to spring OHC (Meinen and McPhaden, 2000; Boschat et al., 2013; Ramesh and Murtugudde, 2013; Lai et al., 2015; Ballester et al., 2016; Petrova et al., 2017). The recharging process within the tropical Pacific has proven to be beneficial for predicting La Niña, such as the La Niña events in 1988/1989, 1998/1999, and 2010/2011 after the prominent El Niño events in 1987/1988, 1997/1998, and 2009/2010, respectively.
However, we will show that the current 2020–2022 La Niña event is inconsistent with the conventional ENSO recharging process, suggesting other factors must be important in triggering 2020/2021 and 2021/2022 cold events. According to the National Oceanic and Atmospheric Administration, the 2020/2021 La Nina event ranks the sixth strongest La Niña since 1982 (Van Oldenborgh et al., 2021; Li et al., 2022), even though the proceeding 2019/2020 El Niño was weak and insufficient to produce significant OHC discharge. Alternatively, recent studies point out the remote impacts of the Indian and Atlantic Oceans on ENSO triggering and maintenance through inter-basin interactions (Kug et al., 2006; Ohba and Ueda, 2007; Okumura and Deser, 2010; Frauen and Dommenget, 2012; Dommenget and Yu, 2017; Cai et al., 2019; Wang, 2019; Chikamoto et al., 2020; Wang and Wang, 2021). A strong positive Indian Ocean Dipole (IOD) event was observed during the 2019 boreal fall, followed by a subsequent Indian Ocean basin-wide (IOB) warming during the 2020 boreal spring which could have plausibly energized the 2020–2022 La Niña event (Izumo et al., 2010; Okumura and Deser, 2010; Okumura et al., 2011; McGregor et al., 2014). Warmer SST anomalies in the southern tropical Atlantic were also observed during the 2020 boreal spring, potentially contributing to the 2020–2022 La Niña event (Dommenget et al., 2006; Frauen and Dommenget, 2012; Ham et al., 2013; Dayan et al., 2015; Chikamoto et al., 2016). In addition to these remote forcings, an Atlantic Niño during boreal summer 2021 could have helped to sustain tropical Pacific cooling through the modulation of Walker circulation (Polo et al., 2015; Luo et al., 2017). However, relative contributions of those factors to the development of the 2020–2022 La Niña are unknown.
This study examines the hypothesis that the 2020–2022 La Niña event was significantly influenced by remote impacts from the Indian and Atlantic oceans. Section 2 describes the datasets and methods used and the results of the observational analysis are described in Section 3. Section 4 provides summary and discussion.
This study uses monthly observation-based products available from 1980 to 2021. The main manuscript datasets include sea surface temperature in Centennial in-situ Observation Based Estimates (COBE–SST2) (Hirahara et al., 2014), the upper 300 m ocean heat content (OHC) in the Japan Meteorological Agency's Meteorological Research Institute (MRI/JMA) (Ishii et al., 2017), precipitation in the CPC Merged Analysis of Precipitation (CMAP) (Xie and Arkin, 1997), and horizontal winds at the surface, 850 hPa, and 250 hPa in the Japanese 55-year Reanalysis (JRA-55) (Kobayashi et al., 2015; Harada et al., 2016). These datasets are compared with sea surface temperature in NOAA Optimum Interpolation (OI) SST V2 (Reynolds et al., 2002), the upper 300 m ocean heat content (OHC) in the Global Data Assimilation System (GODAS) (Behringer, 2007), and horizontal winds at the surface, 850 hPa, and 250 hPa in the ECMWF Reanalysis version 5 (ERA-5) (Hersbach et al., 2020) to show consistency among different datasets. We defined anomalies as deviations from climatological means for the 42 years and then removed the linear trend at each grid point. The ENSO index corresponds to the SST anomalies averaged in the Niño 3.4 region (5°S–5°N, 170°–120°W). The OHC indices in the entire and western equatorial Pacific (referred to as OHCall and OHCwest) are the area average of the depth-averaged temperature anomalies of the upper 300 m of the ocean over the region of 5°S–5°N, 120°E–80°W (Meinen and McPhaden, 2000) and 5°S–5°N, 120°E–155°W (Izumo et al., 2019), respectively.
To describe the ENSO precursors, we made a time-series of the normalized Niño 3.4 index overlaying with the OHC in the entire equatorial Pacific (OHCall) and the OHC in the western Pacific (OHCwest) indices for 1980–2021 (Figure 1A). As demonstrated in the recharge oscillator theory, we can find negative spikes of the OHCwest first (red line in Figure 1A) and then the subsequent peaks of OHCall several seasons later (blue line in Figure 1A), implying the subsurface ocean temperature preconditioning for an upcoming La Niña event (Meinen and McPhaden, 2000; McPhaden et al., 2006a). The lead-lag correlation analysis demonstrates that the OHCwest and OHCall show the highest correlations with the Niño 3.4 index at a 13- and 4-month leads, respectively, although correlation coefficients are weaker for the OHCwest (correlation coefficient, R = 0.39) than the OHCall (R = 0.69) (Supplementary Figure S1). The lead time of OHC precursors to the Niño 3.4 index was reduced for the first decade of the twenty-first century (McPhaden, 2012). Significant decreases in the OHCwest and the OHCall indices appear after the 2015/2016 El Niño event. The prominent negative spikes of OHCall and OHCwest, particularly after the large El Niño events, imply that the internal dynamics within the tropical Pacific are the main driver for initiating La Niña events in the framework of the recharge oscillator theory (Jin and An, 1999; Burgers et al., 2005; Izumo et al., 2019; Jin et al., 2020).
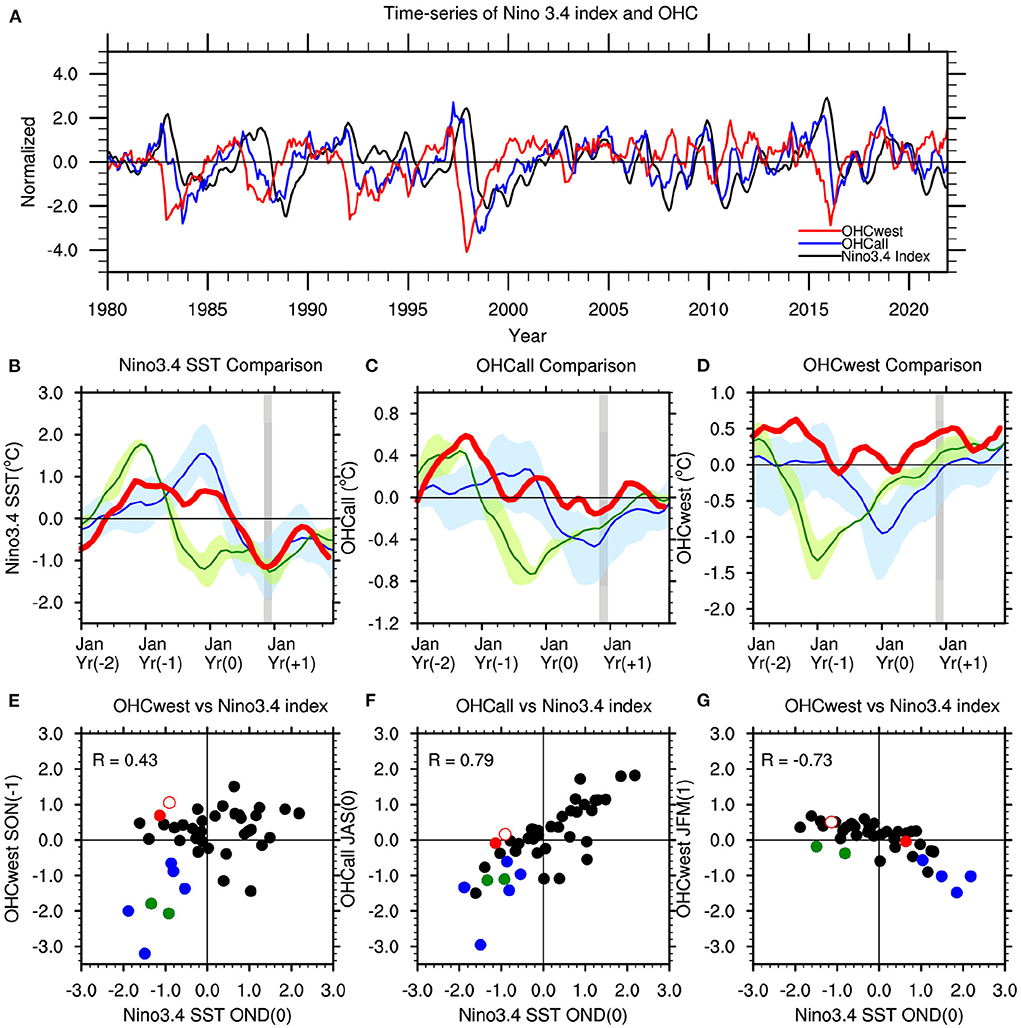
Figure 1. (A) Time-series of normalized Niño 3.4 index (black; 5°S–5°N,120°–170°W), OHCall (blue; 5°S–5°N, 120°E–80°W), and OHCwest indices (red; 5°S–5°N, 120°E–155°W). A 3−month running mean filter is applied to these indices. Time-series of (B) Niño 3.4 SST (C) OHCall and (D) OHCwest of 2020–2022 La Niña event (red) compared with typical La Nina events (blue: 1983/84, 1988/89, 1995/96, 1998/99, 2016/17, and green: 1984/85, 1999/00) following a large El Niño. Scatterplots of the Niño 3.4 index in OND(0) with (E) the OHCwest in SON(-1), (F) the OHC all in JAS(0), and (G) the OHCwest in JFM(1). The blue and green dots represent the typical La Niña years (1983/84, 1988/89, 1995/96, 1998/99, 2016/17, and 1984/85, 1999/00) and the filled red and hollow red dots represent the 2020/21 and 2021/22 case, respectively.
Time-series analysis and the scatter diagrams of Niño 3.4 SST, OHCall, and OHCwest (Figures 1B–G) highlight La Niña development through tropical Pacific Ocean preconditioning. Consistent with the lead-lag relationship, the Niño 3.4 index during OND(0) positively correlates with the OHCwest during SON(-1) (the center month is used to reference the year) (Figure 1E; R = 0.47). Seven La Niña events (i.e., 1983/1984, 1984/1985, 1988/1985, 1995/1996, 1998/1999, 1999/2000, and 2016/2017) chosen using the criteria of −0.5 standard deviations in both Niño 3.4 index during OND(0) and the OHCwest index during SON(-1), all exhibit negative anomalies of OHCall during JAS(0) (Figure 1F). All seven past La Niña events were observed after a pronounced positive Niño 3.4 SST 1 or 2 years earlier (blue and green lines, respectively in Figure 1B). Consistent with the recharge mechanism, negative OHCwest and OHCall emerged in the subsequent year for all seven La Niña events (Figures 1C,D). In some cases, negative equatorial OHC persisted into a second year due to the initial prominent El Niño preconditioning (Figures 1C,D). For example, the multi-year cold events in 1983–1985 and 1998–2000 are mainly caused by the excessive heat deficit in the wake of large El Niño events in 1982/1983 and 1997/1998 (green lines in Figures 1B–D) (Iwakiri and Watanabe, 2020).
To trace back how ENSO induces the negative OHCwest anomalies, we made a scatter plot between the Niño 3.4 index during OND and the OHCwest in the subsequent JFM (Figure 1G). Five events out of these seven cases show negative OHCwest anomalies during JFM just after large El Niño events during OND (Figure 1G). The remaining two La Niña events (i.e., 1984–1985 and 1999–2000) are characterized as the persistent La Niña events following major El Niño events, so-called double-dip or 2-year La Niña, (Kug and Ham, 2011; Zheng et al., 2015; DiNezio et al., 2017a,b; Luo et al., 2017; Okumura et al., 2017; Iwakiri and Watanabe, 2020). During the mature stage of El Niño, weakened trade winds cause the thermocline to shoal in the western Pacific, which is reflected in the negative OHCwest anomalies. This shallower thermocline induces the zonal thermocline tilting and leads to the discharge of the equatorial Pacific OHC through the Sverdrup transport. This discharging process leads to the negative values of the equatorial Pacific OHC and then energizes the subsequent La Niña event. Some major El Niño events involve a usually long discharging process, contributing to the prolonged La Niña events, such as in 1984–1985 and 1999–2000 (Iwakiri and Watanabe, 2020). These seven La Niña events are typical from the perspective described in the recharge oscillator theory.
However, 2020–2022 La Niña event occurs without any warm water volume preconditioning (Figures 1B–G). Niño 3.4 SST comparison demonstrated that 2020–2022 La Niña trailed a weak El Niño event in 2019/2020 (Figure 1B). It prompted a positive equatorial OHCwest/OHCall in 2020/2021 contrary to the typical La Niña events (Figures 1C,D). Irrespective of a weak preceding El Niño event, the positive equatorial OHC anomalies prevail in 2021/2022 making it a 2-year persistent La Niña event (Figures 1C,D). Both the OHCwest during SON(-1) and the OHCall during JAS(0) contain positive anomalies for 2020–2022 La Niña event (Figures 1E–G). In addition to these OHC anomalies, the Niño 3.4 index during 2019/2020 winter also shows neutral or only weak El Niño (Figure 1G). Nevertheless, the 2020/2021 event ranks the sixth-largest La Niña since 1982, and its amplitude is comparable to the average of the seven typical La Niña events (Van Oldenborgh et al., 2021; Li et al., 2022). In other words, the internal dynamics within the tropical Pacific are not strong enough to energize and sustain the 2020–2022 La Niña. Another driver is required to initiate and sustain the event, which we hypothesize is remote forcing from the Indian and Atlantic oceans (Cai et al., 2019; Wu, 2020).
To describe the uniqueness of 2020–2022 La Niña event, we compare SST and surface wind anomalies maps for this event with those for composite La Niña conditions (Figure 2). We can find warmer SST anomalies in the eastern equatorial Pacific during SON(-1) and DJF(0) for the typical La Niña composite (Figures 2A,C), which corresponds to the preceding El Niño event. Consistent with the El Niño conditions, westerly wind anomalies appear from the western equatorial Pacific toward 120°W during these seasons, maintaining the warmer SST anomalies in the eastern Pacific through the Bjerknes feedback. By contrast to the typical La Niña composite, 2020–2022 La Niña event exhibits warmer SST anomalies in the central equatorial Pacific, instead of the east, during the preconditioning seasons of SON 2019 and DJF 2020 (Figures 2B,D). Especially, SST in the eastern equatorial Pacific shows colder anomalies, limiting the westerly wind anomalies in the western equatorial Pacific during these seasons. In addition to the tropical Pacific, there are noticeable differences in the other ocean basins between the typical and 2020–2022 La Niña event, such as the positive IOD during SON 2019 (Figure 2B), the tropical Atlantic warming during DJF 2020 (Figure 2D) and Atlantic Niño during JJA 2021 (Figure 2J). Even though the SST patterns are different during these preconditioning seasons between the typical and 2020–2022 La Niña event, the tropical Pacific shows similar SST and surface wind anomalies patterns during subsequent La Niña development (Figures 2E–L). The easterly wind anomalies at the surface persist in the western equatorial Pacific from MAM(0) to OND(0) (Figures 2E–H), triggering the cold SST anomaly development in the central and the eastern equatorial Pacific during the following SON(0) and OND(0) seasons (Figures 2G,H). The surface easterly wind anomalies in the western equatorial Pacific persist in the succeeding seasons, sustaining the cold SST anomalies in the central-eastern equatorial Pacific during the OND(+1) season (Figures 2I–L).
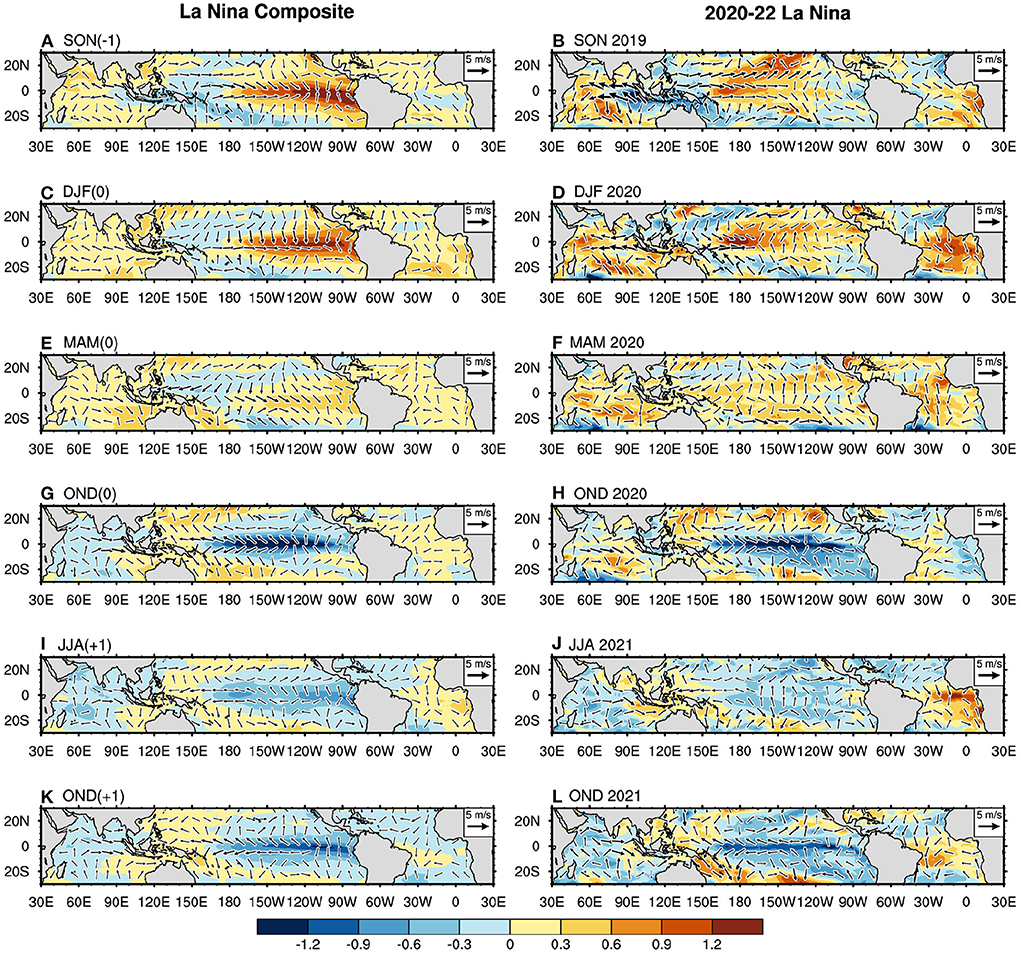
Figure 2. Temporal evolutions of SST (in °C indicated by color shading) and surface wind anomalies (vector) in the typical La Niña composite (left) and the 2020–2022 case (right) during the stage of (A,B) SON(-1), (C,D) DJF(0), (E,F) MAM(0), (G,H) OND(0), (I,J) JJA(+1), and (K,L) OND(+1). Anomalies are defined as deviations from climatological means, and linear trends are removed in each grid point. The reference vector (5 ms−1) is in the upper right corner. As noted in parentheses after the season abbreviation, 0 indicates the first La Niña year, +1 indicates the second La Niña year whereas −1 indicates the preceding year of first La Niña.
The differences between the typical and 2020–2022 La Niña events become more apparent in the spatial maps of OHC than in SST anomalies (Figure 3). The typical La Niña event shows a large zonal contrast of OHC at the equatorial Pacific during SON(-1) and DJF(0) (Figures 3A,C), exhibiting negative OHC anomalies in the western tropical Pacific. This cold OHC in the western tropical Pacific, representing a preconditioning for La Niña, slowly extends eastward during the following MAM(0) season, resulting in negative OHC and shallower thermocline in the entire equatorial Pacific (Figure 3E). During OND(0), the cold OHC reaches the west coast of the American continent and then strengthens the zonal contrast of OHC associated with the mature phase of La Niña (Figure 3G). This zonal OHC contrast is sustained in the following OND(+1) season making the La Niña persistent over 2-years (Figure 3K). Whereas this OHC evolution during the typical La Niña is consistent with the recharge oscillator theory, the 2020–2022 La Niña tells a very different story. During the preconditioning seasons of SON and DJF in 2019, cold OHC in the western tropical Pacific is found at higher latitudes rather than along the equator (Figures 3B,D). As a result, the Pacific zonal contrast of OHC during the preconditioning seasons is unclear in the 2020–2022 La Niña compared to typical events. In MAM 2020, slightly negative OHC anomalies suddenly emerge at the equatorial Pacific, but its meridional distribution is limited to within a narrow band around the equator (Figure 3F). Even though these preconditions are different between the 2020–2022 and typical La Niña events, they share similar patterns in persistent easterly wind anomalies in the western equatorial Pacific and a Pacific zonal contrast in OHC during OND(0) and OND (+1) (Figures 3G,L). These results indicate that the warm water volume preconditioning described in the ENSO theory is not a primary driver for the 2020–2022 La Niña event.

Figure 3. Temporal evolutions of OHC (in °C indicated by color shading) and surface wind anomalies (vector) in the typical La Niña composite (left) and the 2020–2022 case (right) during the developing stage of (A,B) SON(-1), (C,D) DJF(0), (E,F) MAM(0), (G,H) OND(0), (I,J) JJA(+1), and (K,L) OND(+1). Anomalies are defined as deviations from climatological means, and linear trends are removed in each grid point. The reference vector (5 ms−1) is in the upper right corner. As noted in parentheses after the season abbreviation, 0 indicates the first La Niña year, +1 indicates the second La Niña year whereas −1 indicates the preceding year of first La Niña.
The temporal evolution of these La Niña events are also highlighted by the Hovmöller diagrams of SST, OHC, and surface zonal wind anomalies at the equator (Figures 4, 5B,E). From JFM(-1) to JFM(0), the typical La Niña composite shows warmer SST anomalies in the eastern equatorial Pacific, indicating the mature phase of El Niño before the La Niña event (Figures 4A,C). Consistent with the ENSO theory, we can find the eastward propagation of westerly wind anomalies and negative OHC from the western to the eastern equatorial Pacific during the El Niño decaying phase (Figure 4C), which makes a transition from the westerly to easterly wind anomalies at the western equatorial Pacific around JFM(0). These easterly wind anomalies are associated with the development of cold SST anomalies in the central-eastern equatorial Pacific in the mature season of La Niña. The surface easterly wind anomalies persist the subsequent year and sustain the cold SST anomalies in the central-eastern equatorial Pacific for another year (Figures 4A,C). In contrast to this typical La Niña event, the 2020–2022 La Niña event shows warmer SST anomalies in the central equatorial Pacific and the constricted westerly wind anomalies in the longitude band of 150°E–150°W from JFM 2019 to JFM 2020 (Figures 4B,D). These westerly wind anomalies suddenly change their phases to easterly across the entire Pacific around AMJ 2020. The easterly wind anomalies persist through the winter 2021 similar to typical La Niña events (Figure 4D). The eastward propagation of OHC is however unclear in the 2020–2022 La Niña event, suggesting that the subsurface preconditioning in the tropical Pacific is a secondary process in this event. The consistent results are also obtained in OISST, GODAS, and ERA5 products (Supplementary Figure S4).
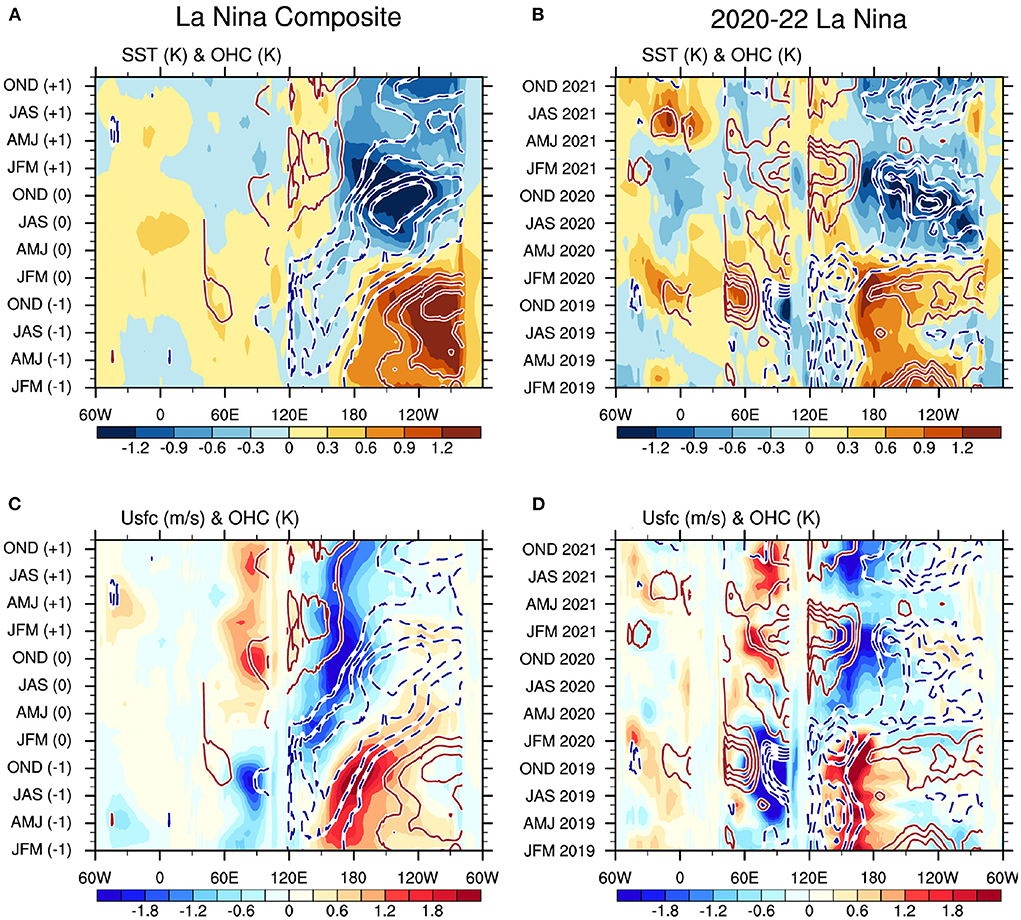
Figure 4. Hovmöller diagrams of (A,B) SST (colors) and (C,D) surface zonal wind anomalies (colors) overlaying with OHC (contours) averaged over the 2.5°N–2.5°S latitude band in the typical La Niña composite (left) and the 2020–2022 case (right panels). The contour interval is 0.3. Positive and negative counters are red and blue lines, respectively. Anomalies are defined as deviations from climatological means, and linear trends are removed in each grid. As noted in parentheses after the season abbreviation, 0 indicates the first La Niña year, +1 indicates the second La Niña year whereas −1 indicates the preceding year of the first La Niña.
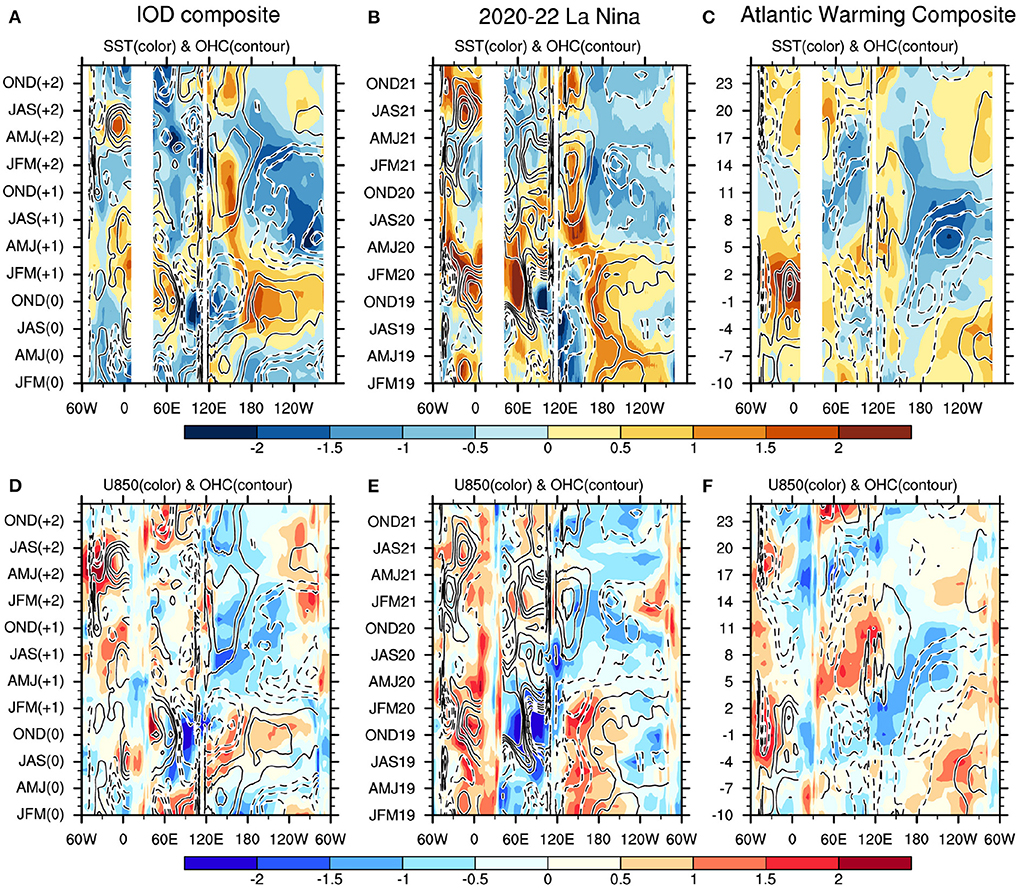
Figure 5. Hovmöller diagrams of normalized (A–C) SST (colors) and (D–F) zonal wind anomalies at 850 hPa (colors) overlaying with (A–F) OHC (contours) averaged over 2.5°N–2.5°S latitude band in (A,D) the IOD composite, (B,E) 2020–2022 La Niña case, and (C,F) Atlantic warming composite. The contour interval is 0.3. Positive and negative counters are solid and broken black lines respectively. We select the three positive IOD years excluding strong preceding El Niño years for the IOD composite (1994, 2006, and 2012) and four Atlantic warming years with different seasons (July 1984, February 1988, March 1996, and May 1998). The amplitudes in these composites are adjusted to fit the 2020–2022 La Niña event.
Instead of OHC preconditioning in the Pacific, we next explored the possibility of remote forcing related to a strong positive IOD event during the 2019 fall, a subsequent IOB warming during the 2020 spring, the tropical Atlantic SST warming during the 2019/2020 fall-winter seasons, and an Atlantic Niño during the 2021 summer. To examine the remote impacts from the Indian and Atlantic Oceans on La Niña, we made composites that minimize the leading influence of the tropical Pacific on the IOD and Atlantic warm events. Specifically, we selected three positive IOD events that did not co-occur with large El Niños (1994, 2006, and 2012), and four Atlantic warming events, including all seasons (the peak months are July 1984, Feb 1988, March 1996, and May 1998). IOD events typically peak during the boreal fall and decay quickly during the boreal winter. For the IOD composite, 0 indicates the IOD peak year, +1 indicates the first La Niña year, and +2 indicates the second La Niña year. For the Atlantic warming composite, the peak months for all four warming events are represented as 0 which is fitted with the month of Atlantic warming in 2020–2022 La Niña event, the positive (negative) time values indicate the succeeding (preceding) months. Figure 5 shows the standardized anomalies of SST, OHC, and 850 hPa zonal winds. The amplitudes of the IOD index and the Atlantic SST warming are adjusted to match with the 2020–2022 La Niña event.
As described in the previous studies (Izumo et al., 2010, 2014; Luo et al., 2010; Yoo et al., 2020), positive IOD events exhibit colder SST animalies in the eastern basin but warmer SST anomalies in the western Indian Ocean during the boreal summer-fall seasons. These conditions are associated with westerly wind anomalies in the western and central equatorial Pacific (Figures 2B, 5A,D). The cooling in the eastern Indian Ocean decays and is followed by IOB warming during the subsequent winter (Du et al., 2013) (Figures 2D,F, 5A,B). Both positive IOD and IOB events can generate easterly wind anomalies in the western Pacific (Dong and McPhaden, 2018). With the collapse of the westerly wind anomalies in the western and central Pacific associated with the quick decay of cold SST anomalies in the eastern Indian Ocean and the development of an IOB in the winter, the negative OHC in the western Pacific propagates eastward and provides favorable conditions for La Niña to develop (Izumo et al., 2010, 2014; Yoo et al., 2020). The IOB warming can foster easterly wind anomalies in the western to central Pacific as well by triggering an atmospheric Kelvin wave response in convection activity over the Indian Ocean (Okumura and Deser, 2010; Okumura et al., 2011). The easterly wind anomalies persist in the western to central Pacific in the successive La Niña year following a positive IOD and subsequent IOB warming event through the initiation of Bjerknes feedback in the equatorial Pacific (Figure 5D). Consistent with the IOD composite, the 2020–2022 La Niña event is preceded by a positive IOD during the 2019 fall and a subsequent IOB warming in early through mid 2020. These developments are associated with the easterly wind anomalies in the central and western Pacific, the Pacific zonal contrast of OHC (the negative in the east and the positive in the west) from AMJ 2020 to AMJ 2021, and persistent easterlies from JAS 2021 to NDJ 2021 (Figures 5B,E).
Atlantic warming can also contribute to La Niña development but from different mechanisms compared to the IOD/ IOB forcing. According to Chikamoto et al. (2020), warm SST anomalies in the tropical Atlantic cause lower sea-level pressure (SLP) anomalies which slowly propagate eastward across the Indian Ocean toward the western Pacific. Chikamoto et al. (2020) noted that this process can occur at any time of year, which is why we have composited Atlantic warm anomalies from different seasons. Consistent with this concept, the Atlantic warming composite shows surface wind convergence in the Atlantic from –4 to 0-month lags, eastward propagation of easterly wind anomalies from –4 month lag in the Indian Ocean to 10-month lag in the central Pacific, and the subsequent eastward propagation of negative OHC in the Pacific (Figure 5F). We can confirm these features in the 2020–2022 La Niña event although the timing of eastward propagation is slightly later than in the Atlantic warming composite. The eastward propagation forced by Atlantic warming persists for another year contributing to the multi-year La Niña persistence. The Atlantic warming composite continually shows surface wind convergence in the Atlantic from 15-month lag, eastward propagation of easterly wind anomalies from 15-month lag in the Indian Ocean to 25-month lag in the western Pacific, and subsequent eastward propagation of negative OHC in the Pacific (Figure 5F).
The eastward propagation of easterly wind anomalies during the 2020–2022 La Niña event is unclear when an Atlantic Niño emerges from boreal spring to early boreal summer of 2021 (Figure 5B). The Atlantic Niño is accompanied by lower atmospheric wind convergence and upper atmospheric wind divergence over the Atlantic Niño region (3°N–3°S, 0°–20°W) during JAS 2021 (Supplementary Figures S2B,F). This upper atmospheric divergence compensates for the upper atmospheric convergence over the central-eastern tropical Pacific which connects the zonal circulation between tropical Atlantic and central-eastern tropical Pacific (Supplementary Figures S2B,F). The descending branch of the Pacific-Atlantic zonal circulation may contribute to the persistence of easterlies in the western Pacific by modifying global Walker circulation during the winter of 2021/2022 (Rodŕıguez-Fonseca et al., 2009; Ding et al., 2012; Keenlyside et al., 2013; Mart́ın-Rey et al., 2015; Polo et al., 2015; Jia et al., 2019). However, the causality remains unclear as to whether the Atlantic Niño is simply a response to the remote impact of persistent La Niña or not (Enfield and Mayer, 1997; Latif and Grötzner, 2000; Handoh et al., 2006; Lübbecke and McPhaden, 2012; Tokinaga et al., 2019). It is also unknown whether the upper atmospheric convergence over the central-eastern tropical Pacific is mainly forced by the Pacific or Atlantic. In any case, our analysis suggests that the synergistic impact of Atlantic warming, positive IOD, and subsequent IOB events favor the development of La Niña conditions in 2020–2022, especially in the absence of preconditioning from OHC in the tropical Pacific Ocean.
This study focuses on processes involved in the development of the 2020–2022 La Niña event compared to typical events using an observational dataset from 1980 to 2021. Conventional wisdom posits that prolonged La Niña events are energized and sustained by a large deficit of heat along the equator following strong El Niño events. However, our analysis demonstrates that the 2020–2022 La Niña event developed without this tropical Pacific discharging process. Another process contributing to the development of La Niña events is stochastic forcing like easterly wind surges and the Madden Julian Oscillation (MJO) (McPhaden et al., 2006b; Hendon et al., 2007; Chiodi and Harrison, 2015). However, this activity was not unusual during the 2020–2022 La Niña development (Supplementary Figure S3). We contend instead that the 2020–2022 La Niña event was energized and sustained by a strong positive IOD event in the fall of 2019, subsequent IOB warming during the first half of 2020, a noticeable tropical Atlantic warming during the winter of 2019/2020, and a potential contribution of Atlantic Niño during the summer of 2021 as summarized in a schematic view (Figure 6). The positive IOD event alters Pacific zonal OHC by affecting wind anomalies in the western-central Pacific and the subsequent IOB warming can trigger an atmospheric Kelvin wave response that generates easterly wind anomalies over the Indo-Pacific sector. The Atlantic warming leads to the eastward propagation of easterly wind anomalies and negative OHC in the tropical Pacific while the Atlantic Niño may further strengthen the Walker circulation and the La Niña conditions. The synergistic effect of these remote ocean forcings may have energized and sustained the 2020–2022 La Niña event which makes this event especially unique compared to other multi-year events.
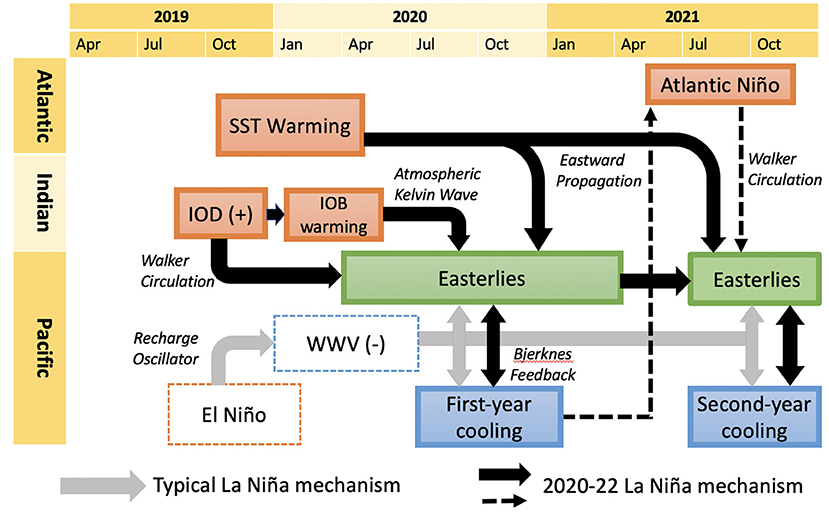
Figure 6. Schematic representation of the energizing and persistent processes of 2020–2022 La Niña in comparison to typical double-dip La Niña events. Solid grey arrow represents typical La Niña mechanism whereas the solid and dashed black arrow represent 2020–2022 La Niña mechanism.
Our results provide a different perspective for ENSO forecasting. The current ENSO predictive skill is practically speaking about 1-year (Jin et al., 2008; Wang et al., 2012). An intense El Niño event can cause a 2-year La Niña, enhancing La Niña predictive skill for up to 2-years (DiNezio et al., 2017a,b; Luo et al., 2017; Iwakiri and Watanabe, 2020; Wu et al., 2021). This ENSO predictive skill is consistent with the warm water volume preconditioning in the recharge mechanism. In contrast, our results regarding the 2020–2022 La Niña event suggest that the remote ocean impacts from the Indian and Atlantic Oceans may also affect ENSO predictive skill. Even though our conclusion comes from one case study, it is consistent with the importance of inter-basin interactions for ENSO development (Kug et al., 2006; Ohba and Ueda, 2007; Frauen and Dommenget, 2012; McGregor et al., 2014; Chikamoto et al., 2015; Li et al., 2016; Dommenget and Yu, 2017; Cai et al., 2019; Wang, 2019; Wang and Wang, 2021). The next important step is therefore to carefully plan numerical model experiments to test our proposed hypothesis about the unique and unusual energizing mechanism for the 2020–2022 double-dip La Niña, such as partial ocean assimilation experiments incorporating observed ocean information in Indian or Atlantic Oceans only (Ding et al., 2012; Chikamoto et al., 2020; Johnson et al., 2020; Stuivenvolt-Allen et al., 2021). Since current climate models still suffer from model biases in simulating inter-basin interactions (Ham and Kug, 2015; Kucharski et al., 2015; Kajtar et al., 2018; Luo et al., 2018; McGregor et al., 2018), the 2020–2022 La Niña event could also provide an excellent test-bed for improving climate model performance and ENSO predictability.
The original contributions presented in the study are included in the article/Supplementary material, further inquiries can be directed to the corresponding author.
NH produced the results and wrote the manuscript with valuable inputs and feedback from YC and MM. YC and MM have the second authorship to the article. All authors contributed to the article and approved the submitted version.
YC is supported by the Utah Agricultural Experiment Station, Utah State University, (approved as journal paper UAES 9605), SERDP Award RC20-3056, and the U.S. Department of Interior, Bureau of Reclamation (R19AP00149 and R22AP00220). MM is supported by NOAA (PMEL contribution 5395).
Observed datasets for COBE-SST2, (OI)SST V2, MRI/JMA, GODAS, CMAP, JRA-55, and ERA-5 are provided by NOAA/OAR/ESRL PSL, Boulder, Colorado, USA (https://www.psl.noaa.gov/data/gridded/index.html), JMA (https://www.data.jma.go.jp/gmd/kaiyou/english/ohc.html), JMA Data Dissemination System (https://jra.kishou.go.jp/JRA-55/index.html), and Copernicus Climate Change Service (C3S) Climate Date Store (https://cds.climate.copernicus.eu).
The authors declare that the research was conducted in the absence of any commercial or financial relationships that could be construed as a potential conflict of interest.
All claims expressed in this article are solely those of the authors and do not necessarily represent those of their affiliated organizations, or those of the publisher, the editors and the reviewers. Any product that may be evaluated in this article, or claim that may be made by its manufacturer, is not guaranteed or endorsed by the publisher.
The Supplementary Material for this article can be found online at: https://www.frontiersin.org/articles/10.3389/fclim.2022.1001174/full#supplementary-material
Ballester, J., Petrova, D., Bordoni, S., Cash, B., García-Díez, M., and Rodó, X. (2016). Sensitivity of el ni no intensity and timing to preceding subsurface heat magnitude. Sci. Rep. 6, 1–9. doi: 10.1038/srep36344
Behringer, D. W. (2007). “3.3 the global ocean data assimilation system (godas) at ncep,” in Proceedings of the 11th Symposium on Integrated Observing and Assimilation Systems for the Atmosphere, Oceans, and Land Surface (San Antonio, TX: Amer. Meteor. Soc.), 14–18.
Boschat, G., Terray, P., and Masson, S. (2013). Extratropical forcing of enso. Geophys. Res. Lett. 40, 1605–1611. doi: 10.1002/grl.50229
Bove, M. C. (1998). “Impacts of enso on united states tornadic activity,” in Preprints, 19th Conference on Severe Local Storms, Vol. 313 (Minneapolis, MN: American Meteor Society), 316.
Burgers, G., Jin, F.-F., and Van Oldenborgh, G. J. (2005). The simplest enso recharge oscillator. Geophys. Res. Lett. 32, 13. doi: 10.1029/2005GL022951
Cai, W., Van Rensch, P., Cowan, T., and Sullivan, A. (2010). Asymmetry in enso teleconnection with regional rainfall, its multidecadal variability, and impact. J. Clim. 23, 4944–4955. doi: 10.1175/2010JCLI3501.1
Cai, W., Wu, L., Lengaigne, M., Li, T., McGregor, S., Kug, J.-S., et al. (2019). Pantropical climate interactions. Science 363, 6430. doi: 10.1126/science.aav4236
Chikamoto, Y., Johnson, Z., Wang, S.-Y. S., McPhaden, M., and Mochizuki, T. (2020). El niño-southern oscillation evolution modulated by atlantic forcing. J. Geophys. Res. Oceans 125, e2020JC016318. doi: 10.1029/2020JC016318
Chikamoto, Y., Mochizuki, T., Timmermann, A., Kimoto, M., and Watanabe, M. (2016). Potential tropical atlantic impacts on pacific decadal climate trends. Geophys. Res. Lett. 43, 7143–7151. doi: 10.1002/2016GL069544
Chikamoto, Y., Timmermann, A., Luo, J.-J., Mochizuki, T., Kimoto, M., Watanabe, M., et al. (2015). Skilful multi-year predictions of tropical trans-basin climate variability. Nat. Commun. 6, 1–7. doi: 10.1038/ncomms7869
Chiodi, A. M., and Harrison, D. (2015). Equatorial pacific easterly wind surges and the onset of la ni na events. J. Clim. 28, 776–792. doi: 10.1175/JCLI-D-14-00227.1
Clarke, A. J. (2008). An introduction to the dynamics of El Niño and the Southern Oscillation. San Diego, CA: Elsevier. p. 324.
Dayan, H., Izumo, T., Vialard, J., Lengaigne, M., and Masson, S. (2015). Do regions outside the tropical pacific influence enso through atmospheric teleconnections? Clim. Dyn. 45, 583–601. doi: 10.1007/s00382-014-2254-x
DiNezio, P. N., Deser, C., Karspeck, A., Yeager, S., Okumura, Y., Danabasoglu, G., et al. (2017a). A 2 year forecast for a 60-80% chance of la ni na in 2017-2018. Geophys. Res. Lett. 44, 11–624. doi: 10.1002/2017GL074904
DiNezio, P. N., Deser, C., Okumura, Y., and Karspeck, A. (2017b). Predictability of 2-year la niña events in a coupled general circulation model. Clim. Dyn. 49, 4237–4261. doi: 10.1007/s00382-017-3575-3
Ding, H., Keenlyside, N. S., and Latif, M. (2012). Impact of the equatorial atlantic on the el ni no southern oscillation. Clim. Dyn. 38, 1965–1972. doi: 10.1007/s00382-011-1097-y
Dommenget, D., Semenov, V., and Latif, M. (2006). Impacts of the tropical indian and atlantic oceans on enso. Geophys. Res. Lett. 33, 4627–4640. doi: 10.1029/2006GL025871
Dommenget, D., and Yu, Y. (2017). The effects of remote sst forcings on enso dynamics, variability and diversity. Clim. Dyn. 49, 2605–2624. doi: 10.1007/s00382-016-3472-1
Dong, L., and McPhaden, M. J. (2018). Unusually warm indian ocean sea surface temperatures help to arrest development of el niño in 2014. Sci. Rep. 8, 1–10. doi: 10.1038/s41598-018-20294-4
Du, Y., Xie, S.-P., Yang, Y.-L., Zheng, X.-T., Liu, L., and Huang, G. (2013). Indian ocean variability in the cmip5 multimodel ensemble: the basin mode. J. Clim. 26, 7240–7266. doi: 10.1175/JCLI-D-12-00678.1
Enfield, D. B., and Mayer, D. A. (1997). Tropical atlantic sea surface temperature variability and its relation to el ni no-southern oscillation. J. Geophys. Res. Oceans 102, 929–945. doi: 10.1029/96JC03296
Fasullo, J., Otto-Bliesner, B., and Stevenson, S. (2018). Enso's changing influence on temperature, precipitation, and wildfire in a warming climate. Geophys. Res. Lett. 45, 9216–9225. doi: 10.1029/2018GL079022
Frauen, C., and Dommenget, D. (2012). Influences of the tropical indian and atlantic oceans on the predictability of enso. Geophys. Res. Lett. 39, 520. doi: 10.1029/2011GL050520
Glantz, M. H. (2001). Currents of Change: Impacts of El Niño and La Niña on Climate and Society. Cambridge: Cambridge University Press.
Ham, Y.-G., and Kug, J.-S. (2015). Role of north tropical atlantic sst on the enso simulated using cmip3 and cmip5 models. Clim. Dyn. 45, 3103–3117. doi: 10.1007/s00382-015-2527-z
Ham, Y.-G., Kug, J.-S., Park, J.-Y., and Jin, F.-F. (2013). Sea surface temperature in the north tropical atlantic as a trigger for el niño/southern oscillation events. Nat. Geosci. 6, 112–116. doi: 10.1038/ngeo1686
Handoh, I. C., Matthews, A. J., Bigg, G. R., and Stevens, D. P. (2006). Interannual variability of the tropical atlantic independent of and associated with enso: Part i. the north tropical atlantic. Int. J. Climatol. A J. R. Meteorol. Soc. 26, 1937–1956. doi: 10.1002/joc.1343
Harada, Y., Kamahori, H., Kobayashi, C., Endo, H., Kobayashi, S., Ota, Y., et al. (2016). The jra-55 reanalysis: representation of atmospheric circulation and climate variability. J. Meteorol. Soc. Jpn. Ser. II 94, 269–302. doi: 10.2151/jmsj.2016-015
Hendon, H. H., Wheeler, M. C., and Zhang, C. (2007). Seasonal dependence of the mjo-enso relationship. J. Clim. 20, 531–543. doi: 10.1175/JCLI4003.1
Hersbach, H., Bell, B., Berrisford, P., Hirahara, S., Horányi, A., Muñoz-Sabater, J., et al. (2020). The era5 global reanalysis. Q. J. R. Meteorol. Soc. 146, 1999–2049. doi: 10.1002/qj.3803
Hirahara, S., Ishii, M., and Fukuda, Y. (2014). Centennial-scale sea surface temperature analysis and its uncertainty. J. Clim. 27, 57–75. doi: 10.1175/JCLI-D-12-00837.1
Hirons, L., and Klingaman, N. (2016). La Niña 2016/2017: Historical Impact Analysis. Evidence on Demand, UK. p. 32. doi: 10.12774/eod_cr.february2016.hironsetal4
Hoyos, I., Baquero-Bernal, A., Jacob, D., and Rodríguez, B. A. (2013). Variability of extreme events in the colombian pacific and caribbean catchment basins. Clim. Dyn. 40, 1985–2003. doi: 10.1007/s00382-012-1487-9
Ishii, M., Fukuda, Y., Hirahara, S., Yasui, S., Suzuki, T., and Sato, K. (2017). Accuracy of global upper ocean heat content estimation expected from present observational data sets. Sola 13, 163–167. doi: 10.2151/sola.2017-030
Iwakiri, T., and Watanabe, M. (2020). Mechanisms linking multi-year la niña with preceding extreme el niño. Sci. Rep. 11, 17465. doi: 10.21203/rs.3.rs-123982/v1
Izumo, T., Lengaigne, M., Vialard, J., Luo, J.-J., Yamagata, T., and Madec, G. (2014). Influence of indian ocean dipole and pacific recharge on following year's el ni no: interdecadal robustness. Clim. Dyn. 42, 291–310. doi: 10.1007/s00382-012-1628-1
Izumo, T., Lengaigne, M., Vialard, J., Suresh, I., and Planton, Y. (2019). On the physical interpretation of the lead relation between warm water volume and the el ni no southern oscillation. Clim. Dyn. 52, 2923–2942. doi: 10.1007/s00382-018-4313-1
Izumo, T., Vialard, J., Lengaigne, M., de Boyer Montegut, C., Behera, S. K., Luo, J.-J., et al. (2010). Influence of the state of the indian ocean dipole on the following year's el niño. Nat. Geosci. 3, 168–172. doi: 10.1038/ngeo760
Jia, F., Cai, W., Wu, L., Gan, B., Wang, G., Kucharski, F., et al. (2019). Weakening atlantic niño -pacific connection under greenhouse warming. Sci. Adv. 5, eaax4111. doi: 10.1126/sciadv.aax4111
Jin, E. K., Kinter, J. L., Wang, B., Park, C.-K., Kang, I.-S., Kirtman, B., et al. (2008). Current status of enso prediction skill in coupled ocean-atmosphere models. Clim. Dyn. 31, 647–664. doi: 10.1007/s00382-008-0397-3
Jin, F.-F. (1997). An equatorial ocean recharge paradigm for enso. part i: conceptual model. J. Atmosphere. Sci. 54, 811–829. doi: 10.1175/1520-0469(1997)054andlt;0811:AEORPFandgt;2.0.CO;2
Jin, F.-F., and An, S.-I. (1999). Thermocline and zonal advective feedbacks within the equatorial ocean recharge oscillator model for enso. Geophys. Res. Lett. 26, 2989–2992. doi: 10.1029/1999GL002297
Jin, F.-F., Chen, H.-C., Zhao, S., Hayashi, M., Karamperidou, C., Stuecker, M. F., et al. (2020). “Simple ENSO models,” in El Niño-Southern Oscillation in a Changing Climate, eds M. J. McPhaden, A. Santoso, and W. Cai (Amer. Geophys. Union), 121–151.
Johnson, Z. F., Chikamoto, Y., Wang, S.-Y. S., McPhaden, M. J., and Mochizuki, T. (2020). Pacific decadal oscillation remotely forced by the equatorial pacific and the atlantic oceans. Clim. Dyn. 55, 789–811. doi: 10.1007/s00382-020-05295-2
Jong, B.-T., Ting, M., Seager, R., and Anderson, W. B. (2020). Enso teleconnections and impacts on us summertime temperature during a multiyear la ni na life cycle. J. Clim. 33, 6009–6024. doi: 10.1175/JCLI-D-19-0701.1
Kajtar, J. B., Santoso, A., McGregor, S., England, M. H., and Baillie, Z. (2018). Model under-representation of decadal pacific trade wind trends and its link to tropical atlantic bias. Clim. Dyn. 50, 1471–1484. doi: 10.1007/s00382-017-3699-5
Keenlyside, N. S., Ding, H., and Latif, M. (2013). Potential of equatorial atlantic variability to enhance el ni no prediction. Geophys. Res. Lett. 40, 2278–2283. doi: 10.1002/grl.50362
Kobayashi, S., Ota, Y., Harada, Y., Ebita, A., Moriya, M., Onoda, H., et al. (2015). The jra-55 reanalysis: general specifications and basic characteristics. J. Meteorol. Soc. Jpn. II 93, 5–48. doi: 10.2151/jmsj.2015-001
Kucharski, F., Syed, F., Burhan, A., Farah, I., and Gohar, A. (2015). Tropical atlantic influence on pacific variability and mean state in the twentieth century in observations and cmip5. Clim. Dyn. 44, 881–896. doi: 10.1007/s00382-014-2228-z
Kug, J.-S., and Ham, Y.-G. (2011). Are there two types of la ni na? Geophys. Res. Lett. 38, 16. doi: 10.1029/2011GL048237
Kug, J.-S., Li, T., An, S.-I., Kang, I.-S., Luo, J.-J., Masson, S., et al. (2006). Role of the enso-indian ocean coupling on enso variability in a coupled gcm. Geophys. Res. Lett. 33, 916. doi: 10.1029/2005GL024916
Lai, A. W.-C., Herzog, M., and Graf, H.-F. (2015). Two key parameters for the el niño continuum: zonal wind anomalies and western pacific subsurface potential temperature. Clim. Dyn. 45, 3461–3480. doi: 10.1007/s00382-015-2550-0
Latif, M., and Grötzner, A. (2000). The equatorial atlantic oscillation and its response to enso. Clim. Dyn. 16, 213–218. doi: 10.1007/s003820050014
Li, X., Hu, Z.-Z., Tseng, Y.-H., Liu, Y., and Liang, P. (2022). A historical perspective of the la niña event in 2020/2021. J. Geophys. Res. Atmosphere. 127, e2021JD035546. doi: 10.1029/2021JD035546
Li, X., Xie, S.-P., Gille, S. T., and Yoo, C. (2016). Atlantic-induced pan-tropical climate change over the past three decades. Nat. Clim. Chang 6, 275–279. doi: 10.1038/nclimate2840
Lima, C. H., Lall, U., Jebara, T., and Barnston, A. G. (2009). Statistical prediction of enso from subsurface sea temperature using a nonlinear dimensionality reduction. J. Clim. 22, 4501–4519. doi: 10.1175/2009JCLI2524.1
Lübbecke, J. F., and McPhaden, M. J. (2012). On the inconsistent relationship between pacific and atlantic niños. J. Clim. 25, 4294–4303. doi: 10.1175/JCLI-D-11-00553.1
Luo, J.-J., Liu, G., Hendon, H., Alves, O., and Yamagata, T. (2017). Inter-basin sources for two-year predictability of the multi-year la niña event in 2010-2012. Sci. Rep. 7, 1–7. doi: 10.1038/s41598-017-01479-9
Luo, J.-J., Wang, G., and Dommenget, D. (2018). May common model biases reduce cmip5's ability to simulate the recent pacific la ni na-like cooling? Clim. Dyn. 50, 1335–1351. doi: 10.1007/s00382-017-3688-8
Luo, J.-J., Zhang, R., Behera, S. K., Masumoto, Y., Jin, F.-F., Lukas, R., et al. (2010). Interaction between el nino and extreme indian ocean dipole. J. Clim. 23, 726–742. doi: 10.1175/2009JCLI3104.1
Martín-Rey, M., Rodríguez-Fonseca, B., and Polo, I. (2015). Atlantic opportunities for enso prediction. Geophys. Res. Lett. 42, 6802–6810. doi: 10.1002/2015GL065062
McGregor, S., Stuecker, M. F., Kajtar, J. B., England, M. H., and Collins, M. (2018). Model tropical atlantic biases underpin diminished pacific decadal variability. Nat. Clim. Chang 8, 493–498. doi: 10.1038/s41558-018-0163-4
McGregor, S., Timmermann, A., Stuecker, M. F., England, M. H., Merrifield, M., Jin, F.-F., et al. (2014). Recent walker circulation strengthening and pacific cooling amplified by atlantic warming. Nat. Clim. Chang 4, 888–892. doi: 10.1038/nclimate2330
McPhaden, M. J. (2012). A 21st century shift in the relationship between enso sst and warm water volume anomalies. Geophys. Res. Lett. 39, 1826. doi: 10.1029/2012GL051826
McPhaden, M. J., Zebiak, S. E., and Glantz, M. H. (2006a). Enso as an integrating concept in earth science. Science 314, 1740–1745. doi: 10.1126/science.1132588
McPhaden, M. J., Zhang, X., Hendon, H. H., and Wheeler, M. C. (2006b). Large scale dynamics and mjo forcing of enso variability. Geophys. Res. Lett. 33, 16. doi: 10.1029/2006GL026786
Meinen, C. S., and McPhaden, M. J. (2000). Observations of warm water volume changes in the equatorial pacific and their relationship to el niño and la niña. J. Clim. 13, 3551–3559. doi: 10.1175/1520-0442(2000)013andlt;3551:OOWWVCandgt;2.0.CO;2
Ohba, M., and Ueda, H. (2007). An impact of sst anomalies in the indian ocean in acceleration of the el niño to la niña transition. J. Meteorol. Soc. Jpn. II 85, 335–348. doi: 10.2151/jmsj.85.335
Okumura, Y. M., and Deser, C. (2010). Asymmetry in the duration of el niño and la niña. J. Clim. 23, 5826–5843. doi: 10.1175/2010JCLI3592.1
Okumura, Y. M., DiNezio, P., and Deser, C. (2017). Evolving impacts of multiyear la niña events on atmospheric circulation and us drought. Geophys. Res. Lett. 44, 11–614. doi: 10.1002/2017GL075034
Okumura, Y. M., Ohba, M., Deser, C., and Ueda, H. (2011). A proposed mechanism for the asymmetric duration of el niño and la niña. J. Clim. 24, 3822–3829. doi: 10.1175/2011JCLI3999.1
Petrova, D., Koopman, S. J., Ballester, J., and Rodó, X. (2017). Improving the long-lead predictability of el niño using a novel forecasting scheme based on a dynamic components model. Clim. Dyn. 48, 1249–1276. doi: 10.1007/s00382-016-3139-y
Polo, I., Martin-Rey, M., Rodriguez-Fonseca, B., Kucharski, F., and Mechoso, C. R. (2015). Processes in the pacific la ni na onset triggered by the atlantic ni no. Clim. Dyn. 44, 115–131. doi: 10.1007/s00382-014-2354-7
Ramesh, N., and Murtugudde, R. (2013). All flavours of el niño have similar early subsurface origins. Nat. Clim. Chang 3, 42–46. doi: 10.1038/nclimate1600
Reynolds, R. W., Rayner, N. A., Smith, T. M., Stokes, D. C., and Wang, W. (2002). An improved in situ and satellite sst analysis for climate. J. Clim. 15, 1609–1625. doi: 10.1175/1520-0442(2002)015andlt;1609:AIISASandgt;2.0.CO;2
Rodríguez-Fonseca, B., Polo, I., García-Serrano, J., Losada, T., Mohino, E., Mechoso, C. R., et al. (2009). Are atlantic niños enhancing pacific enso events in recent decades? Geophys. Res. Lett. 36, 48. doi: 10.1029/2009GL040048
Ropelewski, C. F., and Halpert, M. S. (1987). Global and regional scale precipitation patterns associated with the el niño/southern oscillation. Mon. Weather Rev. 115, 1606–1626. doi: 10.1175/1520-0493(1987)115andlt;1606:GARSPPandgt;2.0.CO;2
Ruiz, J. E., Cordery, I., and Sharma, A. (2005). Integrating ocean subsurface temperatures in statistical enso forecasts. J. Clim. 18, 3571–3586. doi: 10.1175/JCLI3477.1
Stuivenvolt-Allen, J., Wang, S.-Y. S., Johnson, Z., and Chikamoto, Y. (2021). Atmospheric rivers impacting northern california exhibit a quasi-decadal frequency. J. Geophys. Res. Atmosphere. 126, e2020JD034196. doi: 10.1029/2020JD034196
Tokinaga, H., Richter, I., and Kosaka, Y. (2019). Enso influence on the atlantic niño, revisited: multi-year versus single-year enso events. J. Clim. 32, 4585–4600. doi: 10.1175/JCLI-D-18-0683.1
Van Oldenborgh, G. J., Hendon, H., Stockdale, T., L'Heureux, M., De Perez, E. C., Singh, R., et al. (2021). Defining el niño indices in a warming climate. Environ. Res. Lett. 16, 044003. doi: 10.1088/1748-9326/abe9ed
Wang, B., Wu, R., and Fu, X. (2000). Pacific-east asian teleconnection: how does enso affect east asian climate? J. Clim. 13, 1517–1536. doi: 10.1175/1520-0442(2000)013andlt;1517:PEATHDandgt;2.0.CO;2
Wang, C. (2019). Three-ocean interactions and climate variability: a review and perspective. Clim. Dyn. 53, 5119–5136. doi: 10.1007/s00382-019-04930-x
Wang, J.-Z., and Wang, C. (2021). Joint boost to super el niño from the Indian and Atlantic oceans. J. Clim. 34, 4937–4954. doi: 10.1175/JCLI-D-20-0710.1
Wang, S.-Y., L'Heureux, M., and Chia, H.-H. (2012). Enso prediction one year in advance using western north pacific sea surface temperatures. Geophys. Res. Lett. 39, 909. doi: 10.1029/2012GL050909
Wu, M., Chang, W., and Leung, W. (2004). Impacts of el ni no-southern oscillation events on tropical cyclone landfalling activity in the western north pacific. J. Clim. 17, 1419–1428. doi: 10.1175/1520-0442(2004)017andlt;1419:IOENOEandgt;2.0.CO;2
Wu, X. (2020). Duration of El Niño and La Niña events: mechanisms and multiyear predictability (Ph.D. thesis).
Wu, X., Okumura, Y. M., Deser, C., and DiNezio, P. N. (2021). Two-year dynamical predictions of enso event duration during 1954-2015. J. Clim. 34, 4069–4087. doi: 10.1175/JCLI-D-20-0619.1
Wyrtki, K. (1985). Water displacements in the pacific and the genesis of el niño cycles. J. Geophys. Res. Oceans 90, 7129–7132. doi: 10.1029/JC090iC04p07129
Xie, P., and Arkin, P. A. (1997). Global precipitation: a 17-year monthly analysis based on gauge observations, satellite estimates, and numerical model outputs. Bull. Am. Meteorol. Soc. 78, 2539–2558. doi: 10.1175/1520-0477(1997)078andlt;2539:GPAYMAandgt;2.0.CO;2
Yoo, J.-H., Moon, S., Ha, K.-J., Yun, K.-S., and Lee, J.-Y. (2020). Cases for the sole effect of the indian ocean dipole in the rapid phase transition of the el niño-southern oscillation. Theor. Appl. Climatol. 141, 999–1007. doi: 10.1007/s00704-020-03265-6
Yoon, J.-H., and Leung, L. R. (2015). Assessing the relative influence of surface soil moisture and enso sst on precipitation predictability over the contiguous united states. Geophys. Res. Lett. 42, 5005–5013. doi: 10.1002/2015GL064139
Yu, J.-Y., Zou, Y., Kim, S. T., and Lee, T. (2012). The changing impact of el niño on us winter temperatures. Geophys. Res. Lett. 39, 52483. doi: 10.1029/2012GL052483
Yu, Y., Dommenget, D., Frauen, C., Wang, G., and Wales, S. (2016). Enso dynamics and diversity resulting from the recharge oscillator interacting with the slab ocean. Clim. Dyn. 46, 1665–1682. doi: 10.1007/s00382-015-2667-1
Zhao, H., and Wang, C. (2019). On the relationship between enso and tropical cyclones in the western north pacific during the boreal summer. Clim. Dyn. 52, 275–288. doi: 10.1007/s00382-018-4136-0
Keywords: El Niño southern oscillation (ENSO), ENSO recharge-oscillator, double-dip La Niña, inter-basin interaction, Indian Ocean dipole (IOD), tropical Atlantic warming, Indian Ocean basin (IOB) warming, Atlantic Niño
Citation: Hasan NA, Chikamoto Y and McPhaden MJ (2022) The influence of tropical basin interactions on the 2020–2022 double-dip La Niña. Front. Clim. 4:1001174. doi: 10.3389/fclim.2022.1001174
Received: 22 July 2022; Accepted: 02 September 2022;
Published: 20 September 2022.
Edited by:
Chunzai Wang, South China Sea Institute of Oceanology (CAS), ChinaReviewed by:
Zhiwei Zhu, Nanjing University of Information Science and Technology, ChinaCopyright © 2022 Hasan, Chikamoto and McPhaden. This is an open-access article distributed under the terms of the Creative Commons Attribution License (CC BY). The use, distribution or reproduction in other forums is permitted, provided the original author(s) and the copyright owner(s) are credited and that the original publication in this journal is cited, in accordance with accepted academic practice. No use, distribution or reproduction is permitted which does not comply with these terms.
*Correspondence: Nahid A. Hasan, YWttbmFoaWQuaGFzYW5AdXN1LmVkdQ==
†These authors have contributed equally to this work and share first authorship
Disclaimer: All claims expressed in this article are solely those of the authors and do not necessarily represent those of their affiliated organizations, or those of the publisher, the editors and the reviewers. Any product that may be evaluated in this article or claim that may be made by its manufacturer is not guaranteed or endorsed by the publisher.
Research integrity at Frontiers
Learn more about the work of our research integrity team to safeguard the quality of each article we publish.