 Ishrat Jahan Dollan
 Viviana Maggioni
 Jeremy Johnston
94% of researchers rate our articles as excellent or good
Learn more about the work of our research integrity team to safeguard the quality of each article we publish.
Find out more
ORIGINAL RESEARCH article
Front. Clim., 07 January 2022
Sec. Climate Services
Volume 3 - 2021 | https://doi.org/10.3389/fclim.2021.799055
This article is part of the Research TopicA Quest to Fully Understand Precipitation: Novel Methods to Characterize, Model, and Detect Precipitation ProcessesView all 6 articles
The investigation of regional vulnerability to extreme hydroclimatic events (e.g., floods and hurricanes) is quite challenging due to its dependence on reliable precipitation estimates. Better understanding of past precipitation trends is crucial to examine changing precipitation extremes, optimize future water demands, stormwater infrastructure, extreme event measures, irrigation management, etc., especially if combined with future climate and population projections. The objective of the study is to investigate the spatial-temporal variability of average and extreme precipitation at a sub-regional scale, specifically in the Southern Mid-Atlantic United States, a region characterized by diverse topography and is among the fastest-growing areas in North America. Particularly, this work investigates past precipitation trends and patterns using the North American Land Data Assimilation System, Version 2 (NLDAS-2, 12 km/1 h resolution) reanalysis dataset during 1980–2018. Both parametric (linear regression) and non-parametric (e.g., Theil-Sen) robust statistical tools are employed in the study to analyze trend magnitudes, which are tested for statistical significance using the Mann-Kendall test. Standard precipitation indices from ETCCDI are also used to characterize trends in the relative contribution of extreme events to precipitation in the area. In the region an increasing trend (4.3 mm/year) is identified in annual average precipitation with ~34% of the domain showing a significant increase (at the 0.1 significance level) of +3 to +5 mm/year. Seasonal and sub-regional trends are also investigated, with the most pronounced increasing trends identified during summers along the Virginia and Maryland border. The study also finds a statistically significant positive trend (at a 0.05 significance level) in the annual maximum precipitation. Furthermore, the number of daily extremes (daily total precipitation higher than the 95th and 99th percentiles) also depicts statistically significant increases, indicating the increased frequency of extreme precipitation events. Investigations into the proportion of annual precipitation occurring on wet days and extremely wet days (95th and 99th percentile) also indicate a significant increase in their relative contribution. The findings of this study have the potential to improve local-scale decision-making in terms of river basin management, flood control, irrigation scheme scheduling, and stormwater infrastructure planning to address urban resilience to hydrometeorological hazards.
Precipitation is an essential component of Earth's hydrologic cycle, one that influences complex interactions among elements of the biosphere, such as soil moisture (Sehler et al., 2019), vegetation growth (Chen et al., 2020), and streamflow (Goovaerts, 2000; Lobligeois et al., 2014). Therefore, investigating precipitation variability in space and time is crucial for managing sustainable water resources (Fowler et al., 2003), characterizing extremes and their socioeconomic impacts (Howarth et al., 2019), and policymaking based on the connection of hydroclimatic hazards and long-term vulnerabilities (Raymond et al., 2020). At the continental scale, extreme daily precipitation patterns in the contiguous United States (U.S.) have shown variability (Hoerling et al., 2016). During the period of 1910–1996, Karl and Knight (1998) demonstrate that the intensity of extreme precipitation events (top 10%) increased across the contiguous U.S. along with a 53% increase in annual total precipitation. Additionally, many studies examine variability at the hourly scale. One such effort by Prein et al. (2017) suggests that short duration (hourly) events are projected to increase along with temperatures in the contiguous U.S., especially in areas with abundant moisture. Another study by Brown et al. (2020) indicates a significant increase in the 90th percentile hourly accumulation at 36% of recording stations across the southeastern U.S. from 1960 to 2017. Continued rainfall increases in already wet regions and continuous drying of dry areas are also expected to occur in a warming climate (Chou and Neelin, 2004).
Analyzing the distribution of changes in extreme precipitation at the local and regional scales is essential to quantify smaller-scale changes in precipitation patterns that cannot be specified when taking a synoptic view. Several studies focusing on regional extremes report increasing intensity and frequency of extremes in the northeast U.S. (DeGaetano, 2009; Kunkel et al., 2013). Moreover, a significant increase in extreme precipitation has been linked to warm and moist atmospheric conditions, which are governed by the Clausius–Clapeyron equation (Trenberth et al., 2003; Prein et al., 2017). Myhre et al. (2019) highlight the increase in the frequency of extreme precipitation and a doubling of future intense rain in Europe, the U.S., Japan, and Australia. The authors also investigate historical trends and suggest a doubling in the frequency of intense precipitation events per degree of warming. Furthermore, Huang et al. (2017) identify a statistically significant increase (6.8%) in annual total precipitation and a higher increase in extreme precipitation (41%) considering the historical record (1901–2014) over the northeast U.S. The authors characterize the increase in annual total and extreme precipitation as abrupt in the late 1990s and early 2000s. Therefore, analyzing precipitation spatiotemporal variability at the regional scale is essential for developing resilient plans for extreme hydroclimatic events, such as flash floods, landslides, etc. (Wyard and Fettweis, 2016).
Although ground-based gauges provide direct measurements and are used in trend analysis in several studies (Kidd, 2001), they are not continuous in space (Wang et al., 2019) and have limited global and regional coverage. A common approach to generating a continuous precipitation field is to interpolate spatially from irregularly spaced weather stations, with interpolation errors increasing where gauges are sparsely distributed (Xie et al., 1996; Shi and Song, 2015). Satellite-based retrievals generate spatially homogeneous estimates (Golian et al., 2019); however, they are often available at coarse resolutions and subject to systematic biases, sampling errors, sensor limitations, and uncertainties in the retrieval algorithms (Yang et al., 2017). Reanalysis precipitation products merge available observations and models with physical processes (Sun et al., 2018) and have consistent spatial and temporal coverage in a gridded form. Spatial homogeneity and temporally consistent precipitation estimates are essential to study precipitation variability (Pfeifroth et al., 2013). Moreover, extreme precipitation analysis from fewer weather stations does not represent the climatology of a region (Sridhar et al., 2019). The reanalysis precipitation products such as the North American Land Data Assimilation System, Version 2 (NLDAS-2) (Cosgrove et al., 2003) dataset used in our study provides a valuable source for historical analyses.
Analyzing changes in extremes (frequency and intensity) has been carried out by different groups using robust statistical procedures, including extreme indices with specific relevance to precipitation. Generally, the tail distribution of climatic variables (representing extremes) is uncertain (Zhang et al., 2011). The WMO (World Meteorological Organization) and the WCRP (World Climate Research Program) collaborate to form the Expert Team on Climate Change Detection and Indices (ETCCDI), which paves the way to investigate regional and global climatic extremes (Alexander et al., 2006; Tank et al., 2009; Yin and Sun, 2018). While these indices have been applied to global climate models (Sillmann et al., 2013) to understand changes and trends in extremes, our study focuses on their use in the context of higher resolution model reanalysis precipitation estimates. This approach provides a comprehensive understanding of precipitation trends and characteristics at the sub-regional scale, such as the domain of our study, which includes Northern Virginia and the adjacent states.
Heavy precipitation events continue to make Northern Virginia and its surroundings more exposed to flood hazards. Coastal storms (e.g., nor'easters and hurricanes) drive water surges from the Atlantic up the Chesapeake Bay and into the Potomac River, inducing tidal flooding in the lower Potomac. Our study area includes the Central Appalachian region, where orographic convective systems produce extreme flood producing rainfall events (Smith et al., 2011). In addition, the rapid population growth has made investigations into a sub-regional precipitation hazards especially important. For instance, the forecast growth between 2014 and 2040 depicts a 77% to 81% increase in four planning districts (including Northern Virginia) in Virginia (Miller et al., 2016). It is expected to create challenges at combatting the effects of multiple climate stressors. Global mean sea level is also anticipated to rise (0.45–0.82 m) by late 2100 in the event of continued high emissions e.g., Representative Concentration Pathway (RCP 8.5) (Stocker et al., 2014). Additionally, Knutson et al. (2013) demonstrate a robust increase in the Atlantic hurricane rainfall rates using the Coupled Model Intercomparison Project, Phase 3 (CMIP3), and phase 5 (CMIP5) projections. Therefore, extensive coastal inundations from storm surge and extreme precipitation linked to riverine flooding are expected to occur in the future (Li et al., 2020). Thus, making the study of precipitation patterns in this region especially important.
As previous studies show a substantial increase in extreme precipitation in the northeastern U.S., this work attempts to identify trends in past precipitation (1980–2018) in a region inclusive of the administrative boundaries of Northern Virginia, parts of Washington D.C., and extending into western Maryland and northeastern West Virginia (Guttman and Quayle, 1996). Both parametric and non-parametric statistical tools (Gocic and Trajkovic, 2013) are used in trend analysis. The study provides a comprehensive analysis of spatial and temporal variability of precipitation distribution utilizing a reanalysis gridded dataset available at a finer resolution. Specifically, this work aims to: (1) identify significant temporal trends in annual total and extreme precipitation; (2) quantify the spatial variability in the distribution and magnitude of extreme precipitation events (e.g., 95th and 99th percentile) and associated trends; and (3) characterize seasonal variations in total and extreme precipitation. A broader understanding of past precipitation patterns is necessary for optimizing future demands on stormwater infrastructure, particularly when combined with future climate and population projections (Sokol Jurković and Pasarić, 2013). The structure of the manuscript is presented as follows. Material and methods introduces the study area, precipitation data and sub-regional climatology, and statistical procedures used in the study. Results shows results from annual, seasonal, and extreme trend magnitudes. Discussion provides insights into potential drivers of precipitation trends and region-specific relevance of precipitation regime changes. Finally, conclusion summarizes the key findings.
The study domain (37.75 N to 40 N, 77 W to 78.65 W) comprises Northern Virginia (east of the Appalachian Mountains), west of the capital region, and Maryland demarcated by the Potomac River (Figure 1A). The area also covers the northeastern side of West Virginia adjacent to Northern Virginia, which all share similar climates (Baechler et al., 2015). The North Branch of Potomac traverses between West Virginia and Maryland and merges at the border of Northern Virginia and Maryland. The region captures variable topography ranging from low-lying tidewater rivers in the eastern coastal plain to the Appalachian Mountains in the west, which creates different climatic zones in the domain (e.g., mixed humid). Also, the study area encompasses densely populated counties to the west of Washington D.C. Within the area, the Potomac, Rappahannock, York, and James Rivers are the major regional tributaries, draining into the Chesapeake Bay. A unique combination of different topography with the Appalachian Mountains in the west and lowlands in the east control precipitation production and spatial distribution. Generally, higher elevation produces enhanced precipitation (Kappel et al., 2015). The region receives most rainfall resulting from frontal storms with storm tracks that follow the Blue Ridge Mountains and Gulf Stream, moving from the west in a northeasterly direction and paralleling the Atlantic Ocean. Unlike frontal storms, hurricanes are formed within the moist air layer over warm ocean waters, usually impacting the region in early August and September. Major hurricanes such as Isabel (2003), Irene (2011), and Sandy (2012) have made landfall near the region in recent years, resulting in extreme flooding from intense rainfall and coastal storm surges (Booth et al., 2016). Hurricane track variability and mountainous terrain play a vital role in determining the spatial distribution of excessive rainfall in this region (Liu and Smith, 2016). The region also receives heavy rainfall events due to convective process. According to the Northern Virginia Regional Commission, summer precipitation has increased in recent times (2006–2017) in Northern Virginia (Fischbach et al., 2019). The combined factors of geographic variability and warm moist air from the Atlantic influence the precipitation variability in Northern Virginia and surrounding areas. The region is expected to be threatened by the combined effects of the predicted sea-level rise, the occurrence of intense storms and nor'easters, and changes in precipitation intensity and duration.
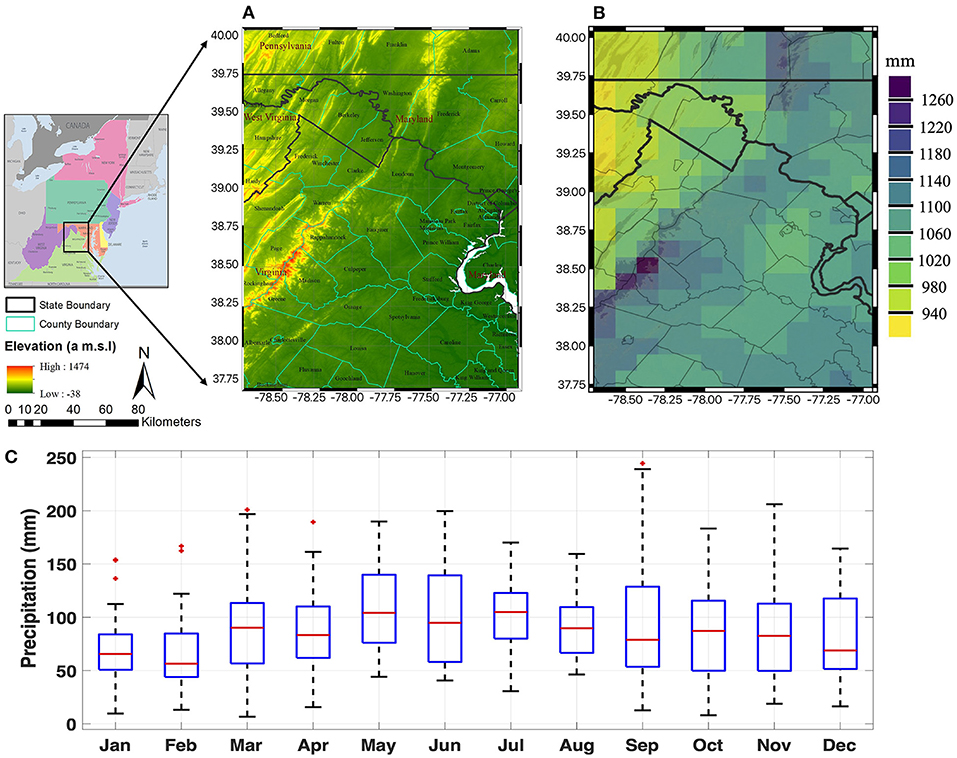
Figure 1. (A) Left: Mid-Atlantic region (www.worldatlas.com/geography/mid-atlantic) with the study area outlined by a black box. Right: regional topography in terms of elevation above mean sea level; (B) NLDAS annual mean precipitation from 1980 to 2018; and (C) boxplots of 39-year monthly precipitation distribution (1980–2018). In each box, the red line indicates the median, the box bottom and top edges indicate the 25th and 75th percentiles, respectively. The whiskers extend to the most extreme data points not considered outliers, and outliers are shown with plus marker symbols.
To assess the average and extreme spatiotemporal trends in precipitation, we use the NLDAS-2 reanalysis precipitation product spanning from 1979 to 2018 and is available at hourly temporal resolution and 1/8th degree spatial resolution (Cosgrove et al., 2003). The National Weather Service Doppler radar-based (WSR-88D) precipitation disaggregates the CPC's (Climate Prediction Center) daily gauge-based precipitation into hourly precipitation. The disaggregation procedure considers precipitation time to maintain the daily gauge-based measurements (Ferguson and Mocko, 2017).
Annual average precipitation during 1980–2018 varies from 1,000 mm in the eastern panhandle of West Virginia to 1,300 mm along the Appalachian Mountains on a southwest-northeast gradient, as shown in Figure 1B. The average monthly precipitation illustrated in Figure 1C shows January and February as the driest months, while May, July, and September receive the maximum average monthly total precipitation. The regional precipitation distribution in the eastern United States shows a wet signal in June and August, according to NOAA's (National Oceanic and Atmospheric Administration) Climate Prediction Center's current precipitation outlook (Liberto, 2021). For instance, the likelihood of the northern part of Virginia experiencing wetter than average conditions throughout the months of June and August is between 33 and 40% based on the climatological period (1981–2010). To examine sub-regional precipitation extremes, we evaluate spatial range of the 95th and 99th daily percentiles by aggregating hourly NLDAS-2 to a daily scale within a given calendar day. Both 95th and 99th percentiles are computed considering the 39-years daily precipitation at each grid shown in Figure 2. Extreme daily precipitation distribution in Figure 2 illustrates higher magnitude of extremes in the northeastern and along the southwest-northeast gradient, with higher elevations areas receiving larger daily totals. Higher magnitudes can be expected due to the orographic effects.
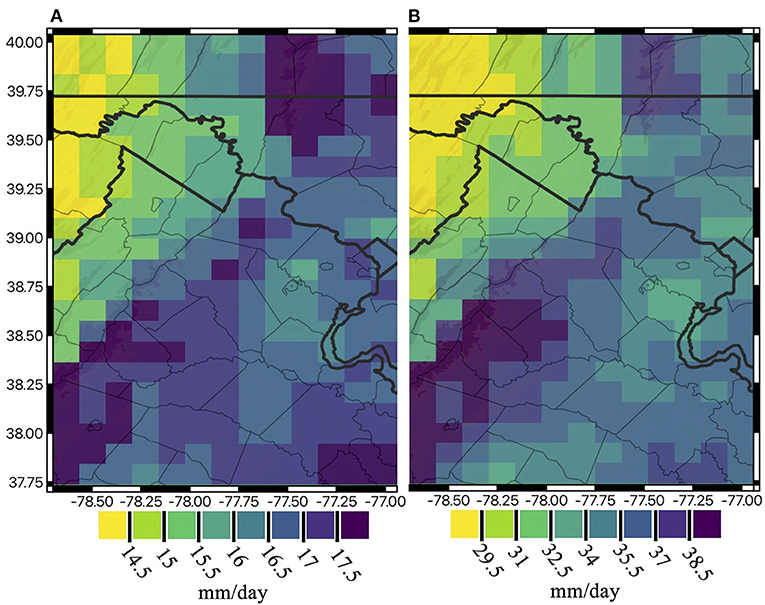
Figure 2. Extreme precipitation magnitudes in mm/day observed during 1980–2018 across the study region represented by the (A) 95th and (B) 99th daily total percentiles at each gird point. State boundaries are shown as thick black lines, whereas county boundaries are presented as thinner black lines. Elevations above 500 m are also shown in dark brown in the background.
The study investigates the spatial and temporal changes of average and extreme precipitation using several indices from ETCCDI, among other derived indices based on daily rainfall, detailed in Table 1 (Kim et al., 2020). The analyses include two types of indices: (1) absolute indices, such as annual maximum daily (RX1day) (Pfahl et al., 2017) and annual maximum consecutive 5-day precipitation (RX5day). Several studies have investigated these two indices on extreme precipitation as RX1day represents an important input in flood risk assessment (Westra et al., 2013), and RX5day, an extreme wet condition, plays an important role in flooding and landslide studies (Sun et al., 2021); (2) threshold-based indices, such as the number of days exceeding the 95th (wet days) and 99th (very wet days) percentile events (D95p and D99p), and the total yearly precipitation contribution by these days (R95pTOT and R99pTOT).
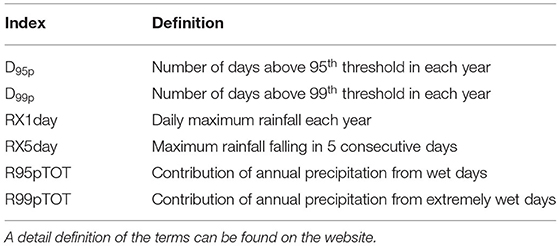
Table 1. Extreme Precipitation Indices introduced by ETCCDI (www.wcrp-climate.org/etccdi).
Detectability of significant trends in time and space is investigated using the non-parametric statistical Mann-Kendall (MK) test (Mann, 1945; Kendall, 1948) from 1980 to 2018. MK is a widely used trend detection method in precipitation studies (Pujol et al., 2007; Pingale et al., 2014; Cooley and Chang, 2021), which include analyses of extreme events (Donat et al., 2013). Non-parametric tests have been proven efficient in analyzing climatic trends as they are less sensitive to outliers (Zilli et al., 2017; Haghtalab et al., 2020).
MK tests the hypothesis that either an increasing or decreasing trend exists in the time series against the null hypothesis of no trend. The hypothesis is tested at three alpha significance levels (α), i.e., 0.01, 0.05, and 0.10 at each grid point. The standardized test statistics Z at each grid point is estimated as follows, as defined by Hirsch et al. (1982).
where the variance (Var) of S statistics function is defined as:
Var is adjusted when there are ties in the sequence of the observation where ft represents frequency of rank t within a tied group. In a timeseries sequence, a tied group is a set of identical observations. Where n is the number of years within the record (39).
The MK S statistics used in the calculation of Z is defined as follows:
where the function sign is:
yj and yi denote observation at time j and i respectively, where j is the latter period. The test statistics are calculated as the sum of all the integer values (+1, 0, and −1). A positive S indicates that observations toward the end of a time series tend to be higher than the observations in the earlier period.
The slope of the temporal trends (annual average and frequency of extremes) is analyzed using linear regression (Han et al., 2021). The least-square method in the traditional linear regression provides the trend in the time series, e.g., annual average precipitation, number of days above 95th percentile, and number of days above 99th percentile. We also focus on trend seasonality and changes in extreme precipitation magnitudes using the non-parametric Theil-Sen (TS) slope estimator (Theil, 1950; Sen, 1968), used in several studies (Chandniha et al., 2017; Slater et al., 2021). TS produces more accurate trend magnitude predictions when applied on skewed datasets with several extremes (Arora et al., 2017).
Sen's non-parametric approach produces a robust estimation of the trend magnitude in a time series. The slope estimator β is calculated as follows.
where Xj and Xi are consecutive data points in temporal series at time j and i (j > i). The possible number of combinations N for one data point in each period is given by:
where, n is the number of years within the record (39).
β is calculated as the median of the combination of all pairs of slopes in the annual average time series. The positive value of β indicates an upward trend, and the negative value represents a downward trend (da Silva et al., 2015).
The annual maximum daily precipitation (RX1day) is calculated at each NLDAS-2 grid to find the maximum precipitation range spatially. The TS test is then applied for the RX1day 39-year time series to quantify the sub-regional trends, while the MK test identifies the pixels with statistically significant trends. The maximum 5-day total precipitation (RX5day) time series extracts the maximum amount of rainfall falling in a moving window of five consecutive days each year for the entire period. The TS estimator is then used to compute RX5day trends. In this study, the number of days exceeding the 95th and 99th percentiles (values shown in Figure 2) are recorded annually and then fitted into a linear regression model. This model predicts the change in the number of very wet (exceeding 95th) and extremely wet days (exceeding 99th) during the period of interest. The annual contribution of both very wet days and extremely wet days accumulated precipitation to the total annual precipitation is calculated at each location. The contribution is mapped as a percentage at each grid point, where high values indicate a precipitation regime dominated by high intensity daily events. Both the TS estimator and MK are used to investigate the fraction of areas with a significant trend. The trend in seasonal total has been analyzed using the TS estimator for both warm and cold seasons, e.g., spring (March-May, MAM), summer (June-August, JJA), fall (September-November, SON), and winter (December–February, DJF). The precipitation distribution in the maximum top 5% of daily precipitation in each season for two time periods (1981–1999 and 2000–2018) is also analyzed to observe periods contributing most to extremes.
The analysis of average annual precipitation across the entire region illustrates a positive linear trend (4.3 mm per year, 1980–2018), as illustrated in Figure 3A. However, the p-value (0.09) derived from the linear model defines a non-significant trend at the 95% confidence level. The regression model suggests a 16% increase in annual average precipitation from 1980 (~990 mm) to 2018 (~1,160 mm) across the area. In terms of annual maximum precipitation at subregional scale, the results present a statistically significant positive trend (α = 0.05, Figure 3B) with a 1.6 mm/year average rate of increase. The yearly maximum daily precipitation prediction from linear regression varies from 66 mm to 128 mm, representing larger variability in inter-annual maximum precipitation.
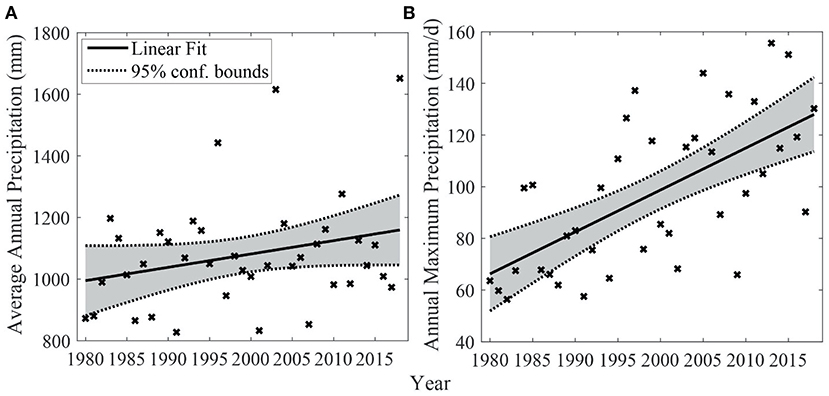
Figure 3. Linear trends during 1980–2018 in (A) annual mean precipitation in mm and (B) annual maximum precipitation in mm/day. Cross markers represent the observed precipitation values for each year and the fitted least square regression line is shown as a solid black line. Dotted lines indicate the upper and lower 95% confidence bounds of the regression model.
As region-wide annual precipitation trends are not statistically significant, the non-parametric MK test is applied across the study area at the pixel scale to detect trends in annual average precipitation at three different significance levels (i.e., 0.01, 0.05, and 0.10). The spatial pattern shown in Figure 4 exhibits a dominant positive trend in the northwestern portions of the domain at the mentioned significance levels.
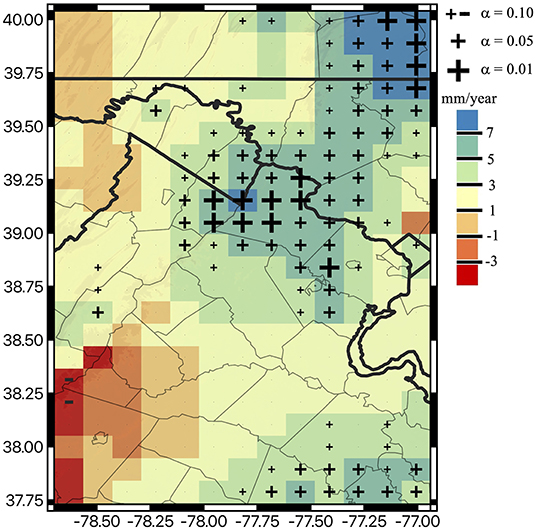
Figure 4. Theil-Sen trends in annual precipitation average during 1980–2018. The size of the cross markers show the three significance levels used to perform a Mann-Kendall test on the Theil-Sen trends. Markers are not shown in grids with non-significant trends.
About 34% of the domain presents significant positive trends at the 90% confidence level, but only 6% of the study area shows significant positive trends at the 99% confidence level (Figure 4). In general, most of the northeastern portion of the region (such as Loudon, Fairfax etc. counties in Northern Virginia and Frederick county in Maryland) presents a statistically significant increasing trend in annual average precipitation (1980–2018). Figure 4 shows that TS identifies the range of annual trends (5 to 7 mm/year) at alpha 0.05 significance level. At 0.1 significance level the range falls within 3 to 5 mm/year which increases above 7 mm/year at alpha 0.01 for a limited region.
The number of extreme days exceeding the top 5% (above 95th percentile) and 1% (above 99th percentile) daily precipitation values considering the entire period is calculated. The number of days above thresholds depicts statistically significant increases at a 0.05 significance level, with a rate of +0.16 event/year considering the top 5% of wet days (Figure 5A) and +0.04 event/year considering the top 1% (Figure 5B). The average annual number of extreme precipitation days above the 95th percentile is 15, whereas the number above the 99th threshold occurring in a year is about five times less (between 0 and 4 events per year). The frequency analysis of the top 5% and top 1% of the linear model predicts six additional extremes in the top 5% in 2018 compared to 1980 and two additional extremes as defined by the top 1% daily event.
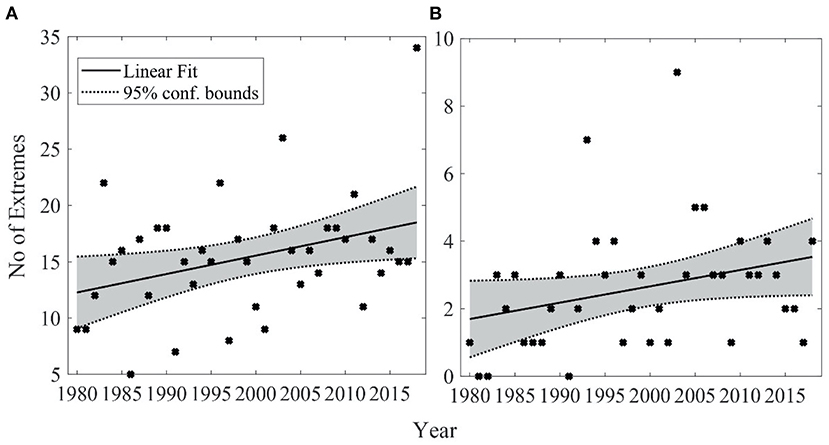
Figure 5. Linear trend in the number of days with precipitation rates above the (A) 95th and (B) 99th percentile. The 95th and 99th percentiles are calculated at each grid during 1980–2018. The threshold used in the figure is the sub-regional mean derived by averaging the 95th and 99th percentiles across all the gird points from Figures 2A,B (i.e., 16.5 and 34.7 mm/day, for the 95th and 99th, respectively). Cross markers represent the observed precipitation values for each year, and the fitted least square regression line is shown as a solid black line. Dotted lines indicate the upper and lower 95% confidence bounds of the regression model.
The seasonal analysis shows primarily a wetting trend during spring (MAM). Specifically, increasing precipitation is prevalent in the central and southern parts of the domain (most counties in Northern Virginia) as shown in Figure 6A. However, only a single cell indicates a significant (decreasing) trend (α = 0.10), whereas all positive trends are markedly smaller than those observed in summer (JJA). Specifically, summer shows a large variability in trend magnitudes with positive trends in the northeastern counties of Northern Virginia along the western side of Potomac River, north of DC, and west of Maryland and slightly negative trends in the southwestern region near the Shenandoah Valley (Figure 6B). About 30% of the area shows a significant positive trend at the 0.05 significance level. In the northeastern region, trend magnitude patterns during JJA are similar to their corresponding annual average patterns (Figure 4), demonstrating a large contribution of summer precipitation to annual precipitation and associated trends.
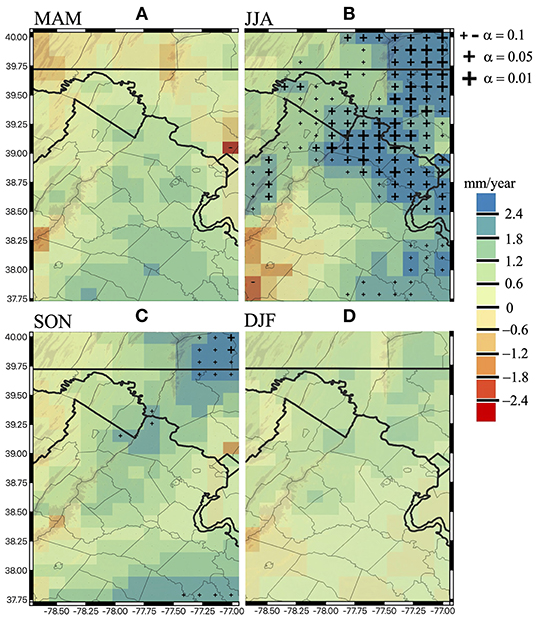
Figure 6. Theil-Sen trends of seasonal precipitation totals (1980–2018) for (A) spring (March–April–May), (B) summer (June–July–August), (C) fall (September–October–November), and (D) winter (December–January—February). Cold colors indicate a wetting trend, whereas warm colors refer to drying trends. The size of the cross markers shows the three significance levels used to perform a Mann-Kendall test on the Theil-Sen trends. Markers are not shown in grids with non-significant trends.
Fall precipitation trends in the region are primarily positive (Figure 6C), with ~6% of the region showing a significant positive trend (larger than 2.4 mm/year) at α = 0.1, clustered in northern Maryland and southern Pennsylvania. Fall (SON) precipitation follows similar spatial increasing trends as in summer except for areas in the immediate Washington D.C. metro region which are markedly lower. The cold season (DJF) shows a higher positive trend in the northeastern (west of Maryland) and central parts of the Northern Virginia region, whereas, elsewhere, there is a general slight positive trend (Figure 6D). Nevertheless, trend magnitudes in winter are not deemed significant by the MK-test suggesting relatively small changes in cold season precipitation events.
The probability density function of the top 5% daily extremes aggregated to seasons reveals how daily extremes in the latter period (2000–2018) are changing rapidly than in the previous two decades in Figure 7. Spring shows the most significant shift toward larger precipitation extremes, followed by fall and summer, whereas winter does not show any visible difference between the two time periods. Summer total precipitation shows a strong positive signal in trend magnitudes (Figure 6B), whereas the intensity of the top 5% daily extremes is relatively unchanged in the latter period (2000–2018) during summer compared to spring and fall (Figure 7B). The increasing seasonal totals in summer are likely driven more by the increasing frequency of events than by the increased rain intensity.
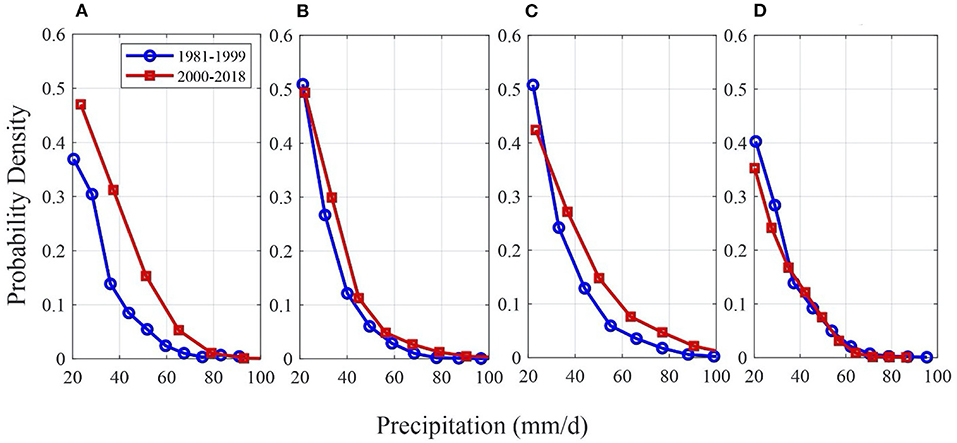
Figure 7. Probability density functions of the top 5% daily precipitation during (A) spring, (B) summer, (C) fall, and (D) winter across the entire study area. The time series is broken into two periods: 1981–1999 (blue) and 2000–2018 (red).
The percent contribution of extremes to the total precipitation is analyzed for two extreme cases, i.e., 95th (wet days contribution) and 99th (extremely wet days contribution) from 1980 to 2018. The contribution is calculated as the ratio of cumulative precipitation that falls in the top 5% (95th percentile) and top 1% (99th percentile) of daily precipitation to the total cumulative precipitation in each year (R95pTOT, R99pTOT). R95pTOT results in Figure 8A show that in the northeastern region (Northern Virginia, Maryland), more than 50% of the total precipitation comes from the top 5% extreme events. Such contribution increases even further (55%) in the southwestern region. Significant increasing trends in the percent contribution from the top 5% events are identified over nearly the whole region (Figure 8B). TS trend magnitudes are tested for statistical significance using the MK test at three significance levels e.g., 0.01, 0.05, and 0.1. Results show that the majority of the region presents statistically significant positive trends even at the highest confidence level.
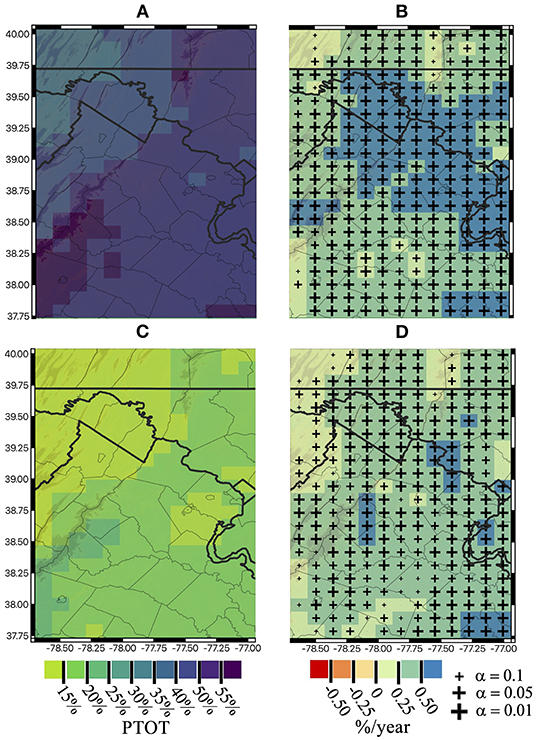
Figure 8. Average percentage contribution of the top 5% [R95pTOT; (A)] and the top 1% [R99pTOT; (C)] to the total wet day precipitation derived at each grid point. Theil-Send trend magnitudes are presented for R95pTOT (B) and R99pTOT (D) during 1980–2018. Results from the Mann-Kendall test at 0.01 (large crosses), 0.05 (medium crosses), and 0.10 (small cross) significance levels are presented.
The R99pTOT index in Figure 8C exhibits similar spatial patterns as R95pTOT with contributions of the extremely wet events varying from 15 to 30% of total precipitation. TS trend magnitudes mostly fall in the range of 0.25 to 0.5%/year (Figure 8D). Similar to the trends shown in R95pTOT results from the MK test indicate that the majority of the area has experienced statistically significant increasing trends in R99pTOT.
Both indices show their highest contribution (in percentage) along higher elevations in the southwest gradient, and their associated trends are significant for most of the region. The maximum trend magnitude for R95pTOT is above 0.5%/year, whereas for R99pTOT, the range is from 0.25 to 0.5%/year (Figures 8C,D, respectively).
The spatial variability of 5-day maximum total precipitation per year is shown in Figure 9A. Figure 9A illustrates that the average 5-day maximum total precipitation for the period (39 years average) varies from 75 to 130 mm spatially. The histogram shows a wide range of RX5day distribution above the median, which implies even the spatial average is in the range of 75 to 130 mm/year, there are RX5day amounts above 130 mm when taking 39 years distribution of all pixels.
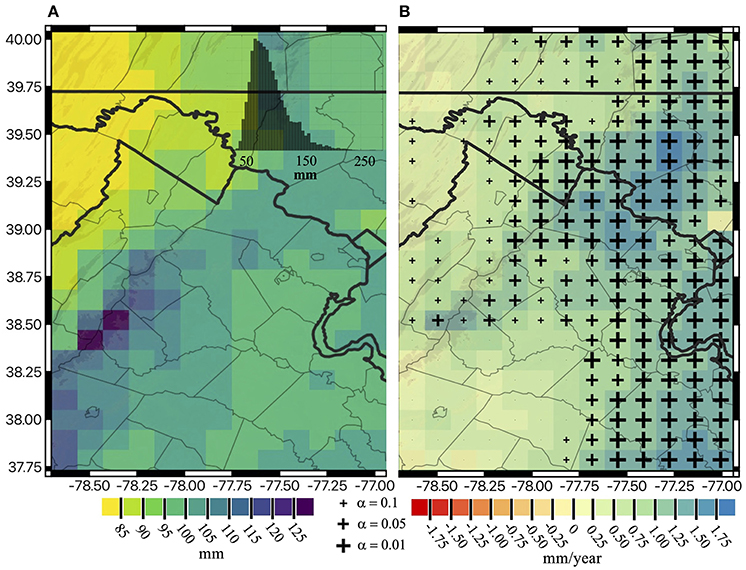
Figure 9. Spatial distribution of extremes and associated trends (1980–2018) for (A) average 5-day annual maximum precipitation with a histogram in the right corner showing a right skewed distribution of the 5-day maximum precipitation; and (B) Theil-Sen 5-day maximum annual precipitation trend. Cold colors indicate a wet trend, whereas warm colors refer to dry trends. The size of the cross markers shows the three significance levels used to perform a Mann-Kendall test on the Theil-Sen trends. Markers are not shown in grids with non-significant trends.
The northeastern and most of the eastern part of the domain show a higher magnitude of 5-day maximum total precipitation (a maximum of +2 mm/year rate) illustrated in Figure 9B (α = 0.05). The southwestern region, comprising only 1% of the domain, shows negative trends of 5-day maximum total precipitation, with no significant trend indicated by the MK test. In contrast, around 1/5th of the domain shows an increasing trend >1.5 mm/year in Figure 9B clustered in the Northern Virginia and DC border and west of Maryland. This increase is considerable, equivalent to 58.5 mm in 5-day maximum total precipitation when considered over the 39 years. Furthermore, the MK test indicates that approximately 56% of the region shows a statistically significant positive trend (α = 0.05) illustrated in Figure 9B with markers overlaid. The MK analysis of the 5-day maximum total precipitation trend agrees with the identified positive trend derived from TS.
The average 1-day maximum total precipitation for 39 years has a similar spatial pattern as the average 5-day maximum total precipitation shown in Figure 10A, with magnitudes that vary from 45 to 77 mm/year. The histogram shows a right skewed distribution of RX1day with values above 77 mm/year considering 39 years statistics at pixel scale. Higher 1-day rainfall magnitudes are shown along a southwest gradient due to orographic effects. The trend map in Figure 10B illustrates a maximum trend value of 1.07 mm/year clustered in the northeast (e.g., Fairfax), southeast (Stafford), and higher elevations (e.g., Madison) across a northeast to a southwest gradient. Most areas (70%) have statistically significant trends above 0.5 mm/year (>19.5 mm increase in 1-day maximum total precipitation, 1980–2018). In general, around 75.5% of these areas present a statistically significant positive trend (α = 0.05) identified by the MK test. The MK test captures significant trends at both higher and lower elevations.
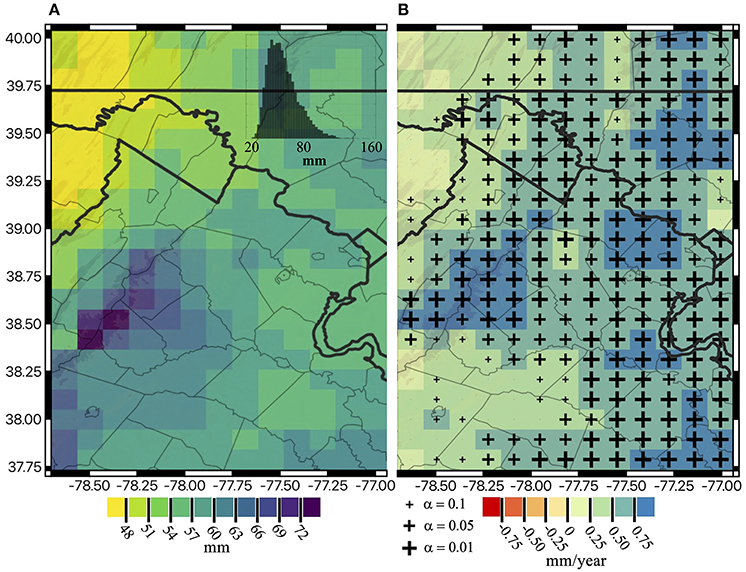
Figure 10. Spatial distribution of extremes and associated trends in extremes (1980–2018) for (A) average 1-day maximum annual precipitation with a histogram in the right corner showing the right skewed distribution of 1-day maximum precipitation for all grids; and (B) Theil-Sen 1-day maximum annual precipitation trend. The size of the cross markers shows the three significance levels used to perform a Mann-Kendall test on the Theil-Sen trends. Markers are not shown in grids with non-significant trends.
The study investigates the spatial distribution of annual average, seasonal total and extreme daily precipitation over mid-latitude humid climate divisions comprising counties in Northern Virginia, surrounding DC, Maryland, and West Virginia, thus, illustrating an application of NLDAS-2 for the detection of interannual precipitation changes at a sub-regional scale. Changes in precipitation are reflected in the trends of higher percentiles (e.g., 95th and 99th) contribution to the total precipitation. The top 5% daily maximum precipitation probability density function shows a shift in the density estimate toward higher precipitation magnitudes for spring, summer, and fall in recent decades. Moreover, strong trend signals are prevalent in the northeastern (statistically significant, α = 0.1 in the annual average) and central parts of Northern Virginia, while the southwestern topographic gradient is more associated with extremes (RX1day, RX5day). A possible cause of strong extreme trend signals in RX1day along the higher elevation in the southwestern gradient is the influence of convective storms favored by the Appalachian lee trough in between the Appalachian and mid-Atlantic ocean (Thompson, 2012) and by the formation of sea breeze boundaries from the difference in air-water interface mainly occurs in Delmarva Peninsula of Chesapeake Bay (Cullen, 2003).
The annual average precipitation shows a statistically significant trend clustered in Northern Virginia. The finding also corroborates with a study by Allen and Allen (2019) that demonstrates an overall increase in the annual average precipitation and frequency of heavy rainfall across 43 stations using daily data from the Global Historical Climate Network (GHCN) from 1947 to 2016. A case study by Kumar et al. (2018) quantifies water yield trends of 10 watersheds (both urban and rural) in the Washington DC region and illustrates wetter conditions in the growing season (May-August) and fall (1973–2012). Similarly, our study illustrates a noticeable increase in past summer precipitation totals (Figure 6B) clustered in the Northern Virginia and the west of DC and Maryland areas. Another recent study by (Li et al., 2021) evaluates the average and extreme summer precipitation climatology from 2004 to 2017 for the mid-Atlantic region (MAR). The authors quantify the contribution of four different types of precipitation systems, namely tropical cyclone (TC), isolated deep convection (IDC), non-convective (NC), and the mesoscale convective systems average and extreme summer precipitation. The authors identify that the IDC dominates the summer precipitation in the southern MAR, whereas the TC systems contribute to the coastal areas east of the Appalachian Mountains.
Topography, proximity to the coastline and tropical cyclones, regional variations in the frequency of convective systems, and other factors can cause sub-regional differences in extreme precipitation patterns. There is a strong signal of a positive trend in the northeastern region of Northern Virginia and adjacent D.C., Maryland, and West Virginia, in R95pTOT. The clustered high magnitude of R95pTOT along the upper Potomac River (likely from coastal precipitation events) and the central region suggests an extension of the extremes exhibiting further inland from the coastal track. A similar study by Howarth et al. (2019) infers changes in the inland storm track in the top 1% precipitation of the northeast United States. Another possible explanation of the extremes occurring in the coastal parts is the recent tropical events that have been linked to inland heavy rainfall and flooding (Smirnov et al., 2018).
The hurricane season runs from summer to the end of November, with September being the most active month. During autumn, the high latitude atmospheric circulation shifts southward, triggering mid-latitudes cyclones. These cyclones provide moisture in the northeastern region (Henderson, 2000). Our study has not distinguished hurricane-induced heavy events; however, the spatial distribution of extremes, particularly near coastal areas at lower elevations, can be attributable to more frequent tropical cyclones in recent years (Kunkel et al., 2010). The 1-day maximum total precipitation trend strongly signals a positive trend in the southwest-northeast gradient compared to the 5-day maximum total precipitation. During spring, the magnitude of extreme events (exceeding the top 5%) may be increasing in recent years but does not necessarily lead to significant increasing trends in total seasonal accumulations. Bishop et al. (2019) identify an increase in daily total fall precipitation in the southeast (comprising southern mid-Atlantic) from 1895 to 2018 using stations of the Global Historical Climatology Network (GHCN). The authors identify the non-tropical, mainly frontal systems precipitation climatology, which dominates the fall precipitation trend during the study period (1895–2018).
Detecting changes in extreme precipitation is essential to build resilient infrastructure. This study seeks to bridge the gap of detecting the trends and understanding the spatial variability of the trends in precipitation estimates at subregional scale. This comprehensive analysis can be linked to constructing the Intensity-Duration-Frequency curves of the past extreme events using high resolution gridded reanalysis to investigate the short-term precipitation characteristics within faster growing regions such as Northern Virginia and adjacent areas (i.e., D.C., Maryland). These curves transfer knowledge from the observed changes of extremes into actionable information that can be used to construct resilient infrastructures in the region over the coming decades. Our findings are helpful in decision-making at the watershed scale, such as applying similar methodologies to assess trends in extremes (past heavy precipitation events) in the Chesapeake Bay. Furthermore, to address urban resilience vulnerable to hydrometeorological hazards across the country, the geographical distribution of extremes can be effectively transmitted in flood control, irrigation scheme scheduling, and stormwater infrastructure planning.
This study examines sub-regional changes in precipitation both spatially and temporally across the southern mid-Atlantic region using the gridded NLDAS-2 reanalysis precipitation product. A comprehensive analysis of extreme precipitation characteristics at a sub-regional scale is fundamental to designing water resources infrastructure and increasing regional resilience to extreme climatic events. Significant increases in annual total precipitation were observed in the northeastern part of the southern mid-Atlantic U.S. Positive trends were particularly strong during summer months in the northeastern, central region of the domain, with a shift in spring maximum rain rates to larger magnitudes. During the colder seasons, smaller trends were detected, especially in the southwestern part of the study area, where drying trends were observed. Studies investigating future precipitation projections might be helpful to compare the change in precipitation distributions observed in this work and project these trends into the future.
Topography and climatology appear to drive heavy precipitation events in the region, partitioning various trend magnitudes across the area. The strong trend signal is prevalent in the northeast-southwest gradient along the Appalachian Mountains. Notably, as the study does not explicitly investigate the drivers of the observed precipitation trends and extremes, these extreme events may also be attributed to other climatic factors such as tropical cyclones, hurricanes, increased temperature, and intensifying convective precipitation in the region. This study presented a widely applicable methodology to better understand past precipitation extremes that can be leveraged to effectively determine regional resilience to hydroclimatic events (e.g., floods and droughts) with relevance to policymaking and risk management.
If the trends identified in this study persist in the future, the millions of people living in the region should expect more frequent extreme weather events and their accompanying socioeconomic consequences. Global climate models have been used to project extreme precipitation trends (Akinsanola et al., 2020) and have predicted considerable variability in summer precipitation along the Atlantic coast of the U.S. (Singh et al., 2013). Therefore, continued efforts to connect past and future regional precipitation are crucial for improving climate resiliency. Future studies should investigate how engineering design standards may change based on future precipitation scenarios. The expansion of the methodology presented here across the U.S. and the world is a valuable step toward achieving these goals.
The raw data supporting the conclusions of this article will be made available by the authors, without undue reservation. The datasets analayzed for this study can be found in NASA Goddard Earth Sciences Data and Information Services Center (GES DISC) (https://disc.gsfc.nasa.gov).
ID conducted research on the trends in extreme precipitation indices, compiled the findings, and produced the original manuscript. VM conceptualized the analysis of extreme precipitation, provided critical review, and guided the team in connecting the findings to the drivers of trends. JJ updated spatial plots in QGIS, performed draft revision, and participated in the computation of observed trend magnitudes. All authors participated in reviewing the manuscript.
The authors declare that the research was conducted in the absence of any commercial or financial relationships that could be construed as a potential conflict of interest.
All claims expressed in this article are solely those of the authors and do not necessarily represent those of their affiliated organizations, or those of the publisher, the editors and the reviewers. Any product that may be evaluated in this article, or claim that may be made by its manufacturer, is not guaranteed or endorsed by the publisher.
The authors would like to thank the Northern Virginia Regional Commission (NVRC) community leaders for partnering with American Geophysical Union's Thriving Earth Exchange program which provided the academic collaborators with a platform to investigate Northern Virginia's historical precipitation pattern. The datasets used in the research are downloaded on ARGO Cluster managed by the Office of Research Computing (orc.gmu.edu) in George Mason University.
Akinsanola, A. A., Kooperman, G. J., Reed, K. A., Pendergrass, A. G., and Hannah, W. M. (2020). Projected changes in seasonal precipitation extremes over the United States in CMIP6 simulations. Environ. Res. Lett. 15:104078. doi: 10.1088/1748-9326/abb397
Alexander, L. V., Zhang, X., Peterson, T. C., Caesar, J., Gleason, B., Klein Tank, A. M. G., et al. (2006). Global observed changes in daily climate extremes of temperature and precipitation. J. Geophys. Res. 111:D05109. doi: 10.1029/2005JD006290
Allen, M., and Allen, T. (2019). Precipitation trends across the commonwealth of Virginia (1947 – 2016). Va. J. Sci. 70:4. doi: 10.25778/3cay-z849
Arora, H., Ojha, C. S. P., Buytaert, W., Kaushika, G. S., and Sharma, C. (2017). Spatio-temporal trends in observed and downscaled precipitation over Ganga Basin. Engineering Hydrology/Mathematical Applications. doi: 10.5194/hess-2017-388
Baechler, M. C., Gilbride, T. L., Cole, P. C., Hefty, M. G., and Ruiz, K. (2015). Building America best practices series: volume 7.3, guide to determining climate regions by county. PNNL-17211 Rev. 3:50. Available online at: https://www.energy.gov/sites/prod/files/2015/10/f27/ba_climate_region_guide_7.3.pdf
Bishop, D. A., Williams, A. P., and Seager, R. (2019). Increased fall precipitation in the Southeastern United States driven by higher-intensity, frontal precipitation. Geophys. Res. Lett. 46, 8300–8309. doi: 10.1029/2019GL083177
Booth, J. F., Rieder, H. E., and Kushnir, Y. (2016). Comparing hurricane and extratropical storm surge for the Mid-Atlantic and Northeast Coast of the United States for 1979–2013. Environ. Res. Lett. 11:094004. doi: 10.1088/1748-9326/11/9/094004
Brown, V. M., Keim, B. D., and Black, A. W. (2020). Trend analysis of multiple extreme hourly precipitation time series in the Southeastern United States. J. Appl. Meteorol. Climatol. 59, 427–442. doi: 10.1175/JAMC-D-19-0119.1
Chandniha, S. K., Meshram, S. G., Adamowski, J. F., and Meshram, C. (2017). Trend analysis of precipitation in Jharkhand State, India: investigating precipitation variability in Jharkhand State. Theor. Appl. Climatol. 130, 261–274. doi: 10.1007/s00704-016-1875-x
Chen, Z., Wang, W., and Fu, J. (2020). Vegetation response to precipitation anomalies under different climatic and biogeographical conditions in China. Sci. Rep. 10:830. doi: 10.1038/s41598-020-57910-1
Chou, C., and Neelin, J. (2004). Mechanisms of global warming impacts on regional Tropical precipitation. J. Clim. 17, 2688–2701. doi: 10.1175/1520-0442(2004)017<2688:MOGWIO>2.0.CO;2
Cooley, A. K., and Chang, H. (2021). Detecting change in precipitation indices using observed (1977–2016) and modeled future climate data in Portland, Oregon, USA. J. Water Clim. Change 12, 1135–1153. doi: 10.2166/wcc.2020.043
Cosgrove, B. A., Lohmann, D., Mitchell, K. E., Houser, P. R., Wood, E. F., Schaake, J. C., et al. (2003). Real-time and retrospective forcing in the North American Land Data Assimilation System (NLDAS) project. J. Geophys. Res. 108:2002JD003118. doi: 10.1029/2002JD003118
Cullen, B. T. (2003). A Severe Weather Climatology for the WFO Wakefield, VA County Warning Area. NOAA Technical Memorandum. Wakefield, VA.
da Silva, R. M., Santos, C. A. G., Moreira, M., Corte-Real, J., Silva, V. C. L., and Medeiros, I. C. (2015). Rainfall and river flow trends using Mann–Kendall and Sen's slope estimator statistical tests in the Cobres River basin. Nat. Hazards 77, 1205–1221. doi: 10.1007/s11069-015-1644-7
DeGaetano, A. T. (2009). Time-dependent changes in extreme-precipitation return-period amounts in the Continental United States. J. Appl. Meteorol. Climatol. 48, 2086–2099. doi: 10.1175/2009JAMC2179.1
Donat, M. G., Alexander, L. V., Yang, H., Durre, I., Vose, R., and Caesar, J. (2013). Global land-based datasets for monitoring climatic extremes. Bull. Am. Meteorol. Soc. 94, 997–1006. doi: 10.1175/BAMS-D-12-00109.1
Ferguson, C. R., and Mocko, D. M. (2017). Diagnosing an artificial trend in NLDAS-2 afternoon precipitation. J. Hydrometeorol. 18, 1051–1070. doi: 10.1175/JHM-D-16-0251.1
Fischbach, J. R., Miro, M. E., Grocholski, K. R., DeGaetano, A. T., and Borisoff, S. (2019). Chesapeake Bay Watershed Climate Impacts Summary and Outlook: Spring 2019. Available online at: http://www.midatlanticrisa.org/climate-summaries/2019/06.html (accessed October 21, 2021).
Fowler, H. J., Kilsby, C. G., and O'Connell, P. E. (2003). Modeling the impacts of climatic change and variability on the reliability, resilience, and vulnerability of a water resource system: impacts of climatic change on water resources. Water Resour. Res. 39:1222. doi: 10.1029/2002WR001778
Gocic, M., and Trajkovic, S. (2013). Analysis of changes in meteorological variables using Mann-Kendall and Sen's slope estimator statistical tests in Serbia. Global Planet. Change 100, 172–182. doi: 10.1016/j.gloplacha.2012.10.014
Golian, S., Javadian, M., and Behrangi, A. (2019). On the use of satellite, gauge, and reanalysis precipitation products for drought studies. Environ. Res. Lett. 14:075005. doi: 10.1088/1748-9326/ab2203
Goovaerts, P. (2000). Geostatistical approaches for incorporating elevation into the spatial interpolation of rainfall. J. Hydrol. 228, 113–129. doi: 10.1016/S0022-1694(00)00144-X
Guttman, N. B., and Quayle, R. G. (1996). A historical perspective of U.S. climate divisions. Bull. Am. Meteorol. Soc. 77, 293–304. doi: 10.1175/1520-0477(1996)077<0293:AHPOUC>2.0.CO;2
Haghtalab, N., Moore, N., Heerspink, B. P., and Hyndman, D. W. (2020). Evaluating spatial patterns in precipitation trends across the Amazon basin driven by land cover and global scale forcings. Theor. Appl. Climatol. 140, 411–427. doi: 10.1007/s00704-019-03085-3
Han, H., Hou, J., Jiang, R., Gong, J., Bai, G., Kang, Y., et al. (2021). Spatial and temporal variation of precipitation characteristics in the semiarid region of Xi'an, northwest China. J. Water Clim. Change 12, 2697–2715. doi: 10.2166/wcc.2021.048
Henderson, K. G. (2000). Autumn precipitation trends in the Northeast United States. Middle States Geogr. 33, 74–81.
Hirsch, R. M., Slack, J. R., and Smith, R. A. (1982). Techniques of trend analysis for monthly water quality data. Water Resour. Res. 18, 107–121. doi: 10.1029/WR018i001p00107
Hoerling, M., Eischeid, J., Perlwitz, J., Quan, X.-W., Wolter, K., and Cheng, L. (2016). Characterizing recent trends in U.S. heavy precipitation. J. Clim. 29, 2313–2332. doi: 10.1175/JCLI-D-15-0441.1
Howarth, M. E., Thorncroft, C. D., and Bosart, L. F. (2019). Changes in extreme precipitation in the Northeast United States: 1979–2014. J. Hydrometeorol. 20, 673–689. doi: 10.1175/JHM-D-18-0155.1
Huang, H., Winter, J. M., Osterberg, E. C., Horton, R. M., and Beckage, B. (2017). Total and extreme precipitation changes over the Northeastern United States. J. Hydrometeorol. 18, 1783–1798. doi: 10.1175/JHM-D-16-0195.1
Kappel, B., Hultstrand, D., Rodel, J., Muhlestein, G., Steinhilber, K., McGlone, D., et al. (2015). Probable Maximum Precipitation Study for Virginia. Monument, CO: Applied Weather Associates, LLC.
Karl, T. R., and Knight, R. W. (1998). Secular trends of precipitation amount, frequency, and intensity in the United States. Bull. Am. Meteorol. Soc. 79, 231–241. doi: 10.1175/1520-0477(1998)079<0231:STOPAF>2.0.CO;2
Kidd, C. (2001). Satellite rainfall climatology: a review. Int. J. Climatol. 21, 1041–1066. doi: 10.1002/joc.635
Kim, Y.-H., Min, S.-K., Zhang, X., Sillmann, J., and Sandstad, M. (2020). Evaluation of the CMIP6 multi-model ensemble for climate extreme indices. Weather Clim. Extremes 29:100269. doi: 10.1016/j.wace.2020.100269
Knutson, T. R., Sirutis, J. J., Vecchi, G. A., Garner, S., Zhao, M., Kim, H.-S., et al. (2013). Dynamical downscaling projections of twenty-first-century atlantic hurricane activity: CMIP3 and CMIP5 model-based scenarios. J. Clim. 26, 6591–6617. doi: 10.1175/JCLI-D-12-00539.1
Kumar, S., Moglen, G. E., Godrej, A. N., Grizzard, T. J., and Post, H. E. (2018). Trends in water yield under climate change and urbanization in the US Mid-Atlantic Region. J. Water Resour. Plan. Manag. 144:05018009. doi: 10.1061/(ASCE)WR.1943-5452.0000937
Kunkel, K. E., Easterling, D. R., Kristovich, D. A. R., Gleason, B., Stoecker, L., and Smith, R. (2010). Recent increases in U.S. heavy precipitation associated with tropical cyclones. Geophys. Res. Lett. 37:L24706. doi: 10.1029/2010GL045164
Kunkel, K. E., Karl, T. R., Brooks, H., Kossin, J., Lawrimore, J. H., Arndt, D., et al. (2013). Monitoring and understanding trends in extreme storms: state of knowledge. Bull. Am. Meteorol. Soc. 94, 499–514. doi: 10.1175/BAMS-D-11-00262.1
Li, J., Qian, Y., Leung, L. R., and Feng, Z. (2021). Summer mean and extreme precipitation over the Mid-Atlantic region: Climatological characteristics and contributions from different precipitation types. J. Geophys. Res. Atmos. 126:e2021JD035045. doi: 10.1029/2021JD035045
Li, M., Zhang, F., Barnes, S., and Wang, X. (2020). Assessing storm surge impacts on coastal inundation due to climate change: case studies of Baltimore and Dorchester County in Maryland. Nat. Hazards 103, 2561–2588. doi: 10.1007/s11069-020-04096-4
Liberto, T. D. (2021). June 2021 U.S. Climate Outlook: Wetter- and Cooler-Than-Average Start to Summer for the Southeast and Gulf Coast. Available online at: https://www.climate.gov/news-features/understanding-climate/june-2021-us-climate-outlook-wetter-and-cooler-average-start (accessed October 2, 2021).
Liu, M., and Smith, J. A. (2016). Extreme rainfall from landfalling tropical cyclones in the Eastern United States: hurricane Irene (2011). J. Hydrometeorol. 17, 2883–2904. doi: 10.1175/JHM-D-16-0072.1
Lobligeois, F., Andréassian, V., Perrin, C., Tabary, P., and Loumagne, C. (2014). When does higher spatial resolution rainfall information improve streamflow simulation? An evaluation using 3620 flood events. Hydrol. Earth Syst. Sci. 18, 575–594. doi: 10.5194/hess-18-575-2014
Miller, J. S., O'Leary, A. A., Goldstein, H. D., Barkley, A. S., and Smith, B. D. (2016). How Might Virginia Age and Grow by 2040? [Report]. Available online at: www.VTRC.net
Myhre, G., Alterskjær, K., Stjern, C. W., Hodnebrog, Ø., Marelle, L., Samset, B. H., et al. (2019). Frequency of extreme precipitation increases extensively with event rareness under global warming. Sci. Rep. 9:16063. doi: 10.1038/s41598-019-52277-4
Pfahl, S., O'Gorman, P. A., and Fischer, E. M. (2017). Understanding the regional pattern of projected future changes in extreme precipitation. Nat. Clim. Change 7, 423–427. doi: 10.1038/nclimate3287
Pfeifroth, U., Mueller, R., and Ahrens, B. (2013). Evaluation of satellite-based and reanalysis precipitation data in the Tropical Pacific. J. Appl. Meteorol. Climatol. 52, 634–644. doi: 10.1175/JAMC-D-12-049.1
Pingale, S. M., Khare, D., Jat, M. K., and Adamowski, J. (2014). Spatial and temporal trends of mean and extreme rainfall and temperature for the 33 urban centers of the arid and semi-arid state of Rajasthan, India. Atmos. Res. 138, 73–90. doi: 10.1016/j.atmosres.2013.10.024
Prein, A. F., Rasmussen, R. M., Ikeda, K., Liu, C., Clark, M. P., and Holland, G. J. (2017). The future intensification of hourly precipitation extremes. Nat. Clim. Change 7, 48–52. doi: 10.1038/nclimate3168
Pujol, N., Neppel, L., and Sabatier, R. (2007). Regional tests for trend detection in maximum precipitation series in the French Mediterranean region. Hydrol. Sci. J. 52, 956–973. doi: 10.1623/hysj.52.5.956
Raymond, C., Horton, R. M., Zscheischler, J., Martius, O., AghaKouchak, A., Balch, J., et al. (2020). Understanding and managing connected extreme events. Nat. Clim. Change 10, 611–621. doi: 10.1038/s41558-020-0790-4
Sehler, R., Li, J., Reager, J., and Ye, H. (2019). Investigating relationship between soil moisture and precipitation globally using remote sensing observations. J. Contemp. Water Res. Educ. 168, 106–118. doi: 10.1111/j.1936-704X.2019.03324.x
Sen, P. K. (1968). Estimates of the regression coefficient based on Kendall's Tau. J. Am. Stat. Assoc. 63, 1379–1389. doi: 10.1080/01621459.1968.10480934
Shi, Y., and Song, L. (2015). Spatial downscaling of monthly TRMM precipitation based on EVI and other geospatial variables over the Tibetan Plateau From 2001 to 2012. Mt. Res. Dev. 35:180. doi: 10.1659/MRD-JOURNAL-D-14-00119.1
Sillmann, J., Kharin, V. V., Zhang, X., Zwiers, F. W., and Bronaugh, D. (2013). Climate extremes indices in the CMIP5 multimodel ensemble: Part 1. Model evaluation in the present climate. J. Geophys. Res. 118, 1716–1733. doi: 10.1002/jgrd.50203
Singh, D., Tsiang, M., Rajaratnam, B., and Diffenbaugh, N. S. (2013). Precipitation extremes over the continental United States in a transient, high-resolution, ensemble climate model experiment. J. Geophys. Res. 118, 7063–7086. doi: 10.1002/jgrd.50543
Slater, L. J., Anderson, B., Buechel, M., Dadson, S., Han, S., Harrigan, S., et al. (2021). Nonstationary weather and water extremes: a review of methods for their detection, attribution, and management. Hydrol. Earth Syst. Sci. 25, 3897–3935. doi: 10.5194/hess-25-3897-2021
Smirnov, D., Giovannettone, J., Lawler, S., Sreetharan, M., Plummer, J., and Workman, B. (2018). Analysis of Historical and Future Heavy Precipitation: City of Virginia Beach, Virginia (CIP 7-030, PWCN-15-0014, Work Order 9A). Available online at: https://trid.trb.org/view/1585276 (accessed October 21, 2021).
Smith, J. A., Baeck, M. L., Ntelekos, A. A., Villarini, G., and Steiner, M. (2011). Extreme rainfall and flooding from orographic thunderstorms in the central Appalachians: rainfall and flooding from orographic storms. Water Resour. Res. 47:W04514. doi: 10.1029/2010WR010190
Sokol Jurković, R., and Pasarić, Z. (2013). Spatial variability of annual precipitation using globally gridded data sets from 1951 to 2000: spatial variability of annual precipitation on globally gridded data. Int. J. Climatol. 33, 690–698. doi: 10.1002/joc.3462
Sridhar, V., Modi, P., Billah, M. M., Valayamkunnath, P., and Goodall, J. L. (2019). Precipitation extremes and flood frequency in a changing climate in Southeastern Virginia. JAWRA J. Am. Water Resour. Assoc. 55, 780–799. doi: 10.1111/1752-1688.12752
Stocker, T., and Intergovernmental Panel on Climate Change, and Working Group Science (2014). Climate Change 2013 the Physical Science Basis. Cambridge: Cambridge University Press.
Sun, Q., Miao, C., Duan, Q., Ashouri, H., Sorooshian, S., and Hsu, K. (2018). A review of global precipitation data sets: data sources, estimation, and intercomparisons. Rev. Geophys. 56, 79–107. doi: 10.1002/2017RG000574
Sun, Q., Zhang, X., Zwiers, F., Westra, S., and Alexander, L. V. (2021). A global, continental, and regional analysis of changes in extreme precipitation. J. Clim. 34, 243–258. doi: 10.1175/JCLI-D-19-0892.1
Tank, A. M. G. K., Zwiers, F. W., and Zhang, X. (2009). Guidelines on Analysis of Extremes in a Changing Climate in Support of Informed Decisions for Adaptation. 55.
Theil, H. (1950). A Rank-Invariant Method of Linear and Polynomial Regression Analysis, 1-2; Confidence Regions for the Parameters of Linear Regression Equations in Two, Three and More Variables. Amsterdam: Stichting Mathematisch Centrum. Available online at: https://ir.cwi.nl/pub/18445 (accessed October 21, 2021).
Thompson, D. B. (2012). Appalachian Lee Troughs and Their Association With Severe Convective Storms. Albany, NY: ProQuest Dissertations Publishing of State University of New York, 151.
Trenberth, K. E., Dai, A., Rasmussen, R. M., and Parsons, D. B. (2003). The changing character of precipitation. Bull. Am. Meteorol. Soc. 84, 1205–1218. doi: 10.1175/BAMS-84-9-1205
Wang, Y., Chen, J., and Yang, D. (2019). Bayesian assimilation of multiscale precipitation data and sparse ground gauge observations in mountainous areas. J. Hydrometeorol. 20, 1473–1494. doi: 10.1175/JHM-D-18-0218.1
Westra, S., Alexander, L. V., and Zwiers, F. W. (2013). Global increasing trends in annual maximum daily precipitation. J. Clim. 26, 3904–3918. doi: 10.1175/JCLI-D-12-00502.1
Wyard, C., and Fettweis, X. (2016). Decrease in Hydroclimatic Conditions Generating Floods in the Southeast of Belgium Over the Last 50 Years. Vienna: EGU General Assembly.
Xie, P., Rudolf, B., Schneider, U., and Arkin, P. A. (1996). Gauge-based monthly analysis of global land precipitation from 1971 to 1994. J. Geophys. Res. 101, 19023–19034. doi: 10.1029/96JD01553
Yang, Y., Tang, J., Xiong, Z., and Dong, X. (2017). Evaluation of high-resolution gridded precipitation data in arid and semiarid regions: Heihe River Basin, Northwest China. J. Hydrometeorol. 18, 3075–3101. doi: 10.1175/JHM-D-16-0252.1
Yin, H., and Sun, Y. (2018). Characteristics of extreme temperature and precipitation in China in 2017 based on ETCCDI indices. Adv. Clim. Change Res. 9, 218–226. doi: 10.1016/j.accre.2019.01.001
Zhang, X., Alexander, L., Hegerl, G. C., Jones, P., Tank, A. K., Peterson, T. C., et al. (2011). Indices for monitoring changes in extremes based on daily temperature and precipitation data. WIREs Clim. Change 2, 851–870. doi: 10.1002/wcc.147
Keywords: extreme precipitation, trends, non-parametric, significance level, seasonal
Citation: Dollan IJ, Maggioni V and Johnston J (2022) Investigating Temporal and Spatial Precipitation Patterns in the Southern Mid-Atlantic United States. Front. Clim. 3:799055. doi: 10.3389/fclim.2021.799055
Received: 21 October 2021; Accepted: 06 December 2021;
Published: 07 January 2022.
Edited by:
Victor Ongoma, Mohammed VI Polytechnic University, MoroccoReviewed by:
Hamida Ngoma, University of Connecticut, United StatesCopyright © 2022 Dollan, Maggioni and Johnston. This is an open-access article distributed under the terms of the Creative Commons Attribution License (CC BY). The use, distribution or reproduction in other forums is permitted, provided the original author(s) and the copyright owner(s) are credited and that the original publication in this journal is cited, in accordance with accepted academic practice. No use, distribution or reproduction is permitted which does not comply with these terms.
*Correspondence: Ishrat Jahan Dollan, aWRvbGxhbkBnbXUuZWR1
Disclaimer: All claims expressed in this article are solely those of the authors and do not necessarily represent those of their affiliated organizations, or those of the publisher, the editors and the reviewers. Any product that may be evaluated in this article or claim that may be made by its manufacturer is not guaranteed or endorsed by the publisher.
Research integrity at Frontiers
Learn more about the work of our research integrity team to safeguard the quality of each article we publish.