
94% of researchers rate our articles as excellent or good
Learn more about the work of our research integrity team to safeguard the quality of each article we publish.
Find out more
ORIGINAL RESEARCH article
Front. Clim., 20 December 2021
Sec. Predictions and Projections
Volume 3 - 2021 | https://doi.org/10.3389/fclim.2021.789869
This article is part of the Research TopicENSO Nonlinearity and Complexity: Features, Mechanisms, Impacts and PredictionView all 14 articles
 Sarah Ineson1*
 Nick J. Dunstone1
 Hong-Li Ren2Richard Renshaw1Malcolm J. Roberts1Adam A. Scaife1,3Kuniko Yamazaki1
Long climate simulations with the Met Office Hadley Centre General Circulation Model show weak El Niño-Southern Oscillation (ENSO) amplitude asymmetry between El Niño and La Niña phases compared with observations. This lack of asymmetry is explored through the framework of a perturbed parameter experiment. Two key hypotheses for the lack of asymmetry are tested. First, the possibility that westerly wind burst activity is biased is explored. It is found that the observed difference in wind burst activity during El Niño and La Niña tends to be underestimated by the model. Secondly, the warming due to subsurface non-linear advection is examined. While the model exhibits non-linear dynamic warming during both La Niña and El Niño, and thus a contribution to ENSO asymmetry, it is shown to be consistently underestimated in comparison with ocean reanalyses. The non-linear zonal advection term contributes most to the deficiency and the simulation of the anomalous zonal currents may be playing a key role in its underestimation. Compared with the ocean reanalyses, the anomalous zonal currents associated with ENSO are too weak in the vicinity of the equatorial undercurrent and the surface wind driven zonal currents extend too deep.
El Niño-Southern Oscillation (ENSO) is the strongest natural interannual climate signal in the tropics, with oscillations between warm El Niño and cold La Niña phases occurring every few years. ENSO events show considerable spatio-temporal complexity (Timmermann et al., 2018). In particular, the distribution of sea surface temperature (SST) variability in the Pacific is not Gaussian, in that the strongest El Niño events are stronger than the strongest La Niña events in the east Pacific (e.g., Burgers and Stephenson, 1999). This amplitude asymmetry in SSTs is associated with asymmetry of temperatures in the ocean subsurface (Jin et al., 2003; Zhang et al., 2009; Hayashi and Jin, 2017). There is also asymmetry in the duration of El Niño and La Niña events (Okumura and Deser, 2010), but here we focus on the amplitude asymmetry as it is an outstanding model error (Zhang and Sun, 2014).
ENSO amplitude asymmetry is generally underestimated in CMIP models (Sun et al., 2016; Hayashi et al., 2020; McKenna et al., 2020). Because the largest El Niño events are often associated with severe impacts (Hardiman et al., 2018; Anderson et al., 2019), this deficiency impacts on our ability to make long range predictions of the risk of extreme regional events. It has also been suggested that future mean SST change in the east tropical Pacific may depend on a change in the asymmetry between the magnitudes of El Niño and La Niña SST anomalies under climate change (Ham, 2017; Kohyama and Hartmann, 2017). Better simulation of asymmetry may therefore also potentially improve future climate projections of ENSO (Hayashi et al., 2020; Cai et al., 2021).
While the reasons for ENSO amplitude asymmetry remain uncertain, a number of hypotheses have been put forward. For example, the westward shift of zonal wind stress anomalies during La Niña relative to El Niño may lead to relatively weak SST anomalies during La Niña (Kang and Kug, 2002; Im et al., 2015). A number of studies have also suggested an important role for westerly wind burst (WWB) events (Kessler and Kleeman, 2000; Eisenman et al., 2005; Chen et al., 2015; Levine et al., 2016; Hayashi and Watanabe, 2017). Ocean non-linear dynamic warming either in the mixed layer (Jin et al., 2003; An, 2009; Su et al., 2010) or ocean subsurface (Hayashi et al., 2020; Chen et al., 2021) is also thought to contribute. Similarly, another source of asymmetric heat convergence into the cold tongue region is associated with ocean tropical instability waves which occur preferentially in La Niña phases (Vialard et al., 2001; An, 2008). There is also asymmetry in the shortwave surface heat flux feedback (Lloyd et al., 2012; Bayr et al., 2018). For a recent review of these hypotheses see An et al. (2020), and references therein.
Here, we use the framework of a perturbed parameter experiment (PPE) of climate simulations (Yamazaki et al., 2021) to explore the reasons for the weak asymmetry simulated in the Met Office Hadley Centre model, HadGEM-GC3.1 (Williams et al., 2018). ENSO amplitude and periodicity have been shown to be sensitive to, for example, the specification of convection entrainment rate (Watanabe et al., 2011; Lu and Ren, 2016), and ENSO stability can be sensitive to the mean state (Kim et al., 2014). The parameter combinations in each member of the PPE used in this study have been shown to yield a range of plausible yet diverse climate model behaviors (Sexton et al., 2021; Yamazaki et al., 2021). This paper focuses on two of the key hypotheses relating to ENSO asymmetry; the role of westerly wind bursts, and the model representation of subsurface ocean warming due to non-linear advection.
The ENSO amplitude asymmetry is typically measured by skewness, which is a measure of the extent to which a distribution differs from a normal distribution:
where mk is the kth moment,
where xi is the ith observation, the overbar denotes the mean, and N the number of observations.
Here, skewness is calculated from monthly data.
Where T, u, v, and w are temperature, zonal, meridional, and vertical velocities, respectively. The overbar and prime denote climatological mean and anomalies, respectively. The first bracket represents the linear terms, the second bracket is the nonlinear terms and the residual term, R, denotes thermodynamic and subgrid-scale contributions. The heat budget terms are estimated from monthly mean anomalies with respect to the long-term monthly climatology.
ENSO asymmetry is assessed in a number of long climate simulations of the Met Office Hadley Centre general circulation model HadGEM-GC3.1 (Williams et al., 2018) in three different resolutions: low (LL), medium (MM), and high (HH). LL and MM are CMIP6 preindustrial control simulations, at N96 (atmosphere midlatitude spacing of 135 km)/ORCA1 (1° ocean with enhanced meridional resolution near the equator) and N216 (60 km)/ORCA025 (1/4°) resolution, respectively (Menary et al., 2018). Each run length is 500 years. HH has a resolution of N512 (25 km)/ORCA12 (1/12°) and forcing representative of the year 1950 (Roberts et al., 2019). The run length is 150 years. All configurations have 85 levels in the atmosphere and 75 levels in the ocean. To investigate possible reasons for the weak asymmetry in these models, we use a PPE based on a similar model, HadGEM-GC3.05, at MM (N216/ORCA025) resolution. The objective of a PPE is to represent model uncertainty by perturbing model parameters within realistic ranges. There are 19 members, the “standard variant” (STD) unperturbed member (member 0) and 18 members with combinations of perturbations applied to atmosphere and land surface parameters. No perturbations are applied to the ocean. We use 200-year simulations with CMIP5 greenhouse gas and radiative forcing for the year 1900. Heat and fresh-water flux adjustments are derived for STD and applied to all PPE members. In addition, for the 18 perturbed members, a globally uniform, member specific, heat flux adjustment is applied (Yamazaki et al., 2021). The methodology behind the choice of the perturbed parameters and the values they take is described in detail by Sexton et al. (2021), and the identifier which links the ensemble members to the parameter perturbations is shown in brackets: 0 (00000), 1 (00090), 2 (00605), 3 (00834), 4 (01113), 5 (01554), 6 (01649), 7 (01843), 8 (01935), 9 (02089), 10 (02123), 11 (02242), 12 (02305), 13 (02335), 14 (02491), 15 (02753), 16 (02832), 17 (02868), 18 (02914).
WWBs are identified here as events where the daily 10 m zonal wind anomaly, averaged from 2.5°N-2.5°S, exceeds 3 ms−1 over a longitude range of at least 10° and lasts for at least 3 consecutive days in the equatorial Pacific (130°E-80°W). We define a WWB index as the sum of the maximum anomaly for each event over a given time period to give a measure of accumulated strength. In recent literature, a number of different criteria have been used for defining WWBs, leading to varying results in terms of numbers of WWBs identified (Santoso et al., 2017). The criteria used here gives an observed average WWB count of just over 12 per year which is within the range identified by other studies (e.g., Puy et al., 2016).
Model data are compared with monthly mean SST from HadISST1.1 for 1873 to 2020 (Rayner et al., 2003), monthly zonal wind stress from ERA5 for 1950 to 2020 (Hersbach et al., 2020), and monthly mean depth of the 20° isotherm estimated from the ocean temperature dataset, EN4, for 1950 to 2020 (Good et al., 2013). WWB activity is calculated using daily 10 m winds from the ERA-Interim reanalysis for 1980 to 2017 (Dee et al., 2011). Monthly mean ocean potential temperature and currents are from two products, the ocean reanalysis used in the GloSea5 seasonal forecast system (MacLachlan et al., 2015) and a recent ocean reanalysis based on the GO5 ocean model (Megann et al., 2014), both for the period 1993 to 2017. In the scatter diagrams, the time-period used for calculating HadISST skewness is chosen to be the same as that used for the corresponding reanalysis variable.
Assessment of ENSO characteristics for HadGEM-GC3.1 at MM resolution shows that this model performs favorably with observations across a range of performance metrics (Williams et al., 2018) and in historical simulations, the PPE shows a range of plausible ENSO variability (Yamazaki et al., 2021). In this study, standard deviation for Nino3.4 (170-120°W, 5°N-5°S) across the PPE ranges from 0.51°C to 0.97°C. El Niño and La Niña composite SST anomaly patterns in HadGEM-GC3.1 are also reasonably realistic and similar at MM and HH resolutions, although for LL the ENSO pattern extends somewhat too far west (Menary et al., 2018; Roberts et al., 2019). However, compared with the observations, these El Niño and La Niña patterns are too symmetrical, reflecting a lack of extreme El Niño events in the models.
Amplitude asymmetry, measured here by SST skewness is weaker than in observations in all our model simulations and versions, irrespective of resolution, as shown in Figure 1. Because skewness in the more commonly used Niño3 region (150-90°W, 5°N-5°S) is weak in the PPE, we focus on a region in the far east Pacific (FEP) (110-80°W, 5°N-5°S) that maximizes skewness in the observations (Su et al., 2010; Santoso et al., 2017).
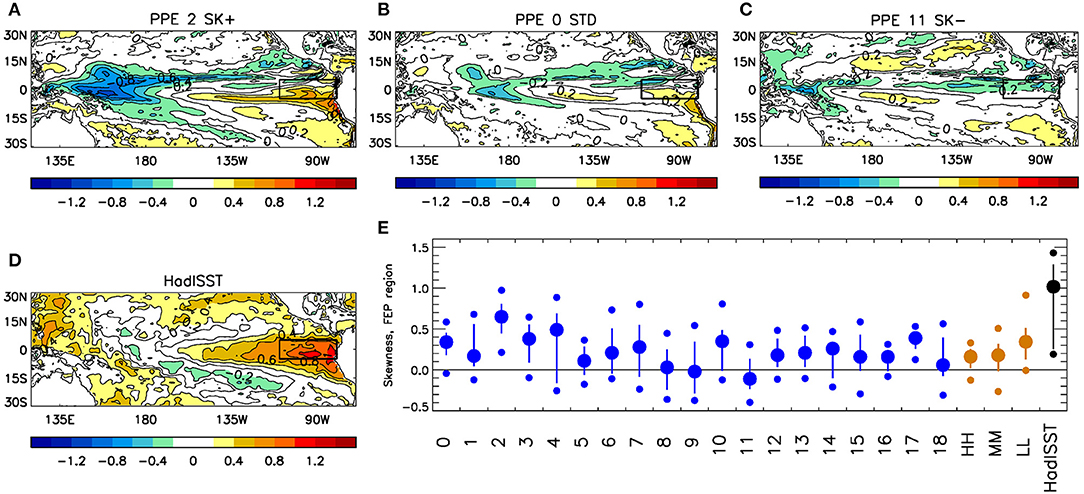
Figure 1. Comparison of skewness in Met Office Hadley Centre models. Skewness in 3 PPE members (A–C) and observations (HadISST, 1873-2020) (D). Rectangular box shows skewness in the far eastern Pacific region (FEP, 110-80°W, 5°N-5°S). Skewness in FEP for PPE members (blue), high, medium, and low resolution HadGEM-CG3.1 simulations (brown), and observations (black) (E). Large circles show skewness over the full period of each model simulation, vertical bars show the 16th and 84th percentiles (corresponding to 1 standard deviation from the mean) and small circles are the maximum and minimum of skewness for 50-year sliding windows.
The spatial pattern of SST skewness for the most positively skewed (SK+), standard variant (STD), and least positively skewed (SK–) members of the 19-member PPE (Figures 1A–C) can be compared with the observations (Figure 1D). STD shows a similar pattern of skewness but is much weaker than observed, with an FEP skewness of 0.34 compared with 1.02 for observations. SK- shows weakly negative skewness along the equator with an FEP skewness of −0.11. For SK+, our most skewed simulation, the westward extent of the region of positive skewness is similar to that observed but again the SK+ member skewness for the FEP region is much weaker than observed, 0.65 compared with 1.02, and the pattern is more equatorially confined.
Skewness for the FEP region for all PPE members shows diversity across the ensemble in the mean, and also a variety of multidecadal variability (Figure 1E). However, no member has a mean skewness as high as observed, or indeed a maximum skewness in any 50-year period as high as the observed mean. We also show model data from different resolution HadGEM-GC3.1 models with lower (LL), the same (MM), and higher (HH) ocean and atmosphere resolution as the PPE. These all show similar characteristics to STD and lie within the PPE range, suggesting that lack of ENSO asymmetry is insensitive to resolution in HadGEM-GC3.1
Observations are most strongly positively skewed in the far east Pacific, decreasing to become weakly negatively skewed in the region near the dateline and in a horseshoe-like pattern in the west Pacific and extending somewhat into the South Pacific Convergence zone and the Intertropical Convergence zone. We note that PPE member SK+ has unrealistically high negative skewness in these regions and that in the PPE there is a tendency for the more positively skewed members to also have unrealistically high negative skewness in the west Pacific.
In the tropical Pacific there is a close relationship between mean equatorial SST, zonal wind stress and thermocline depth in the mean state (Philander, 1990). As expected, the PPE reflects this, with significant correlations between these variables across individual member simulations.
The relationship between these key variables and skewness also shows significant correlations, with higher SST (r = 0.54, p < 0.02), weaker zonal wind stress (r = 0.57, p < 0.02) and shallower 20°C isotherm in the west pacific (r = −0.44, p < 0.1) all being related to higher skewness in the model (Figure 2). The PPE members with deeper thermocline in the western Pacific tend to have a somewhat shallower thermocline in the eastern Pacific (Figure 2E). Biases in the coupled model mean state can therefore clearly impact the model skewness and in principle could be responsible for the lack of ENSO asymmetry. However, as the observations lie well within the range of the modeled mean state for each of these assessed variables, the model mean state is not systematically biased in this respect. A realistic representation of these variables by the model does not in itself therefore necessarily lead to realistic asymmetry and we reject the hypothesis that these mean state errors are responsible for the lack of ENSO asymmetry.
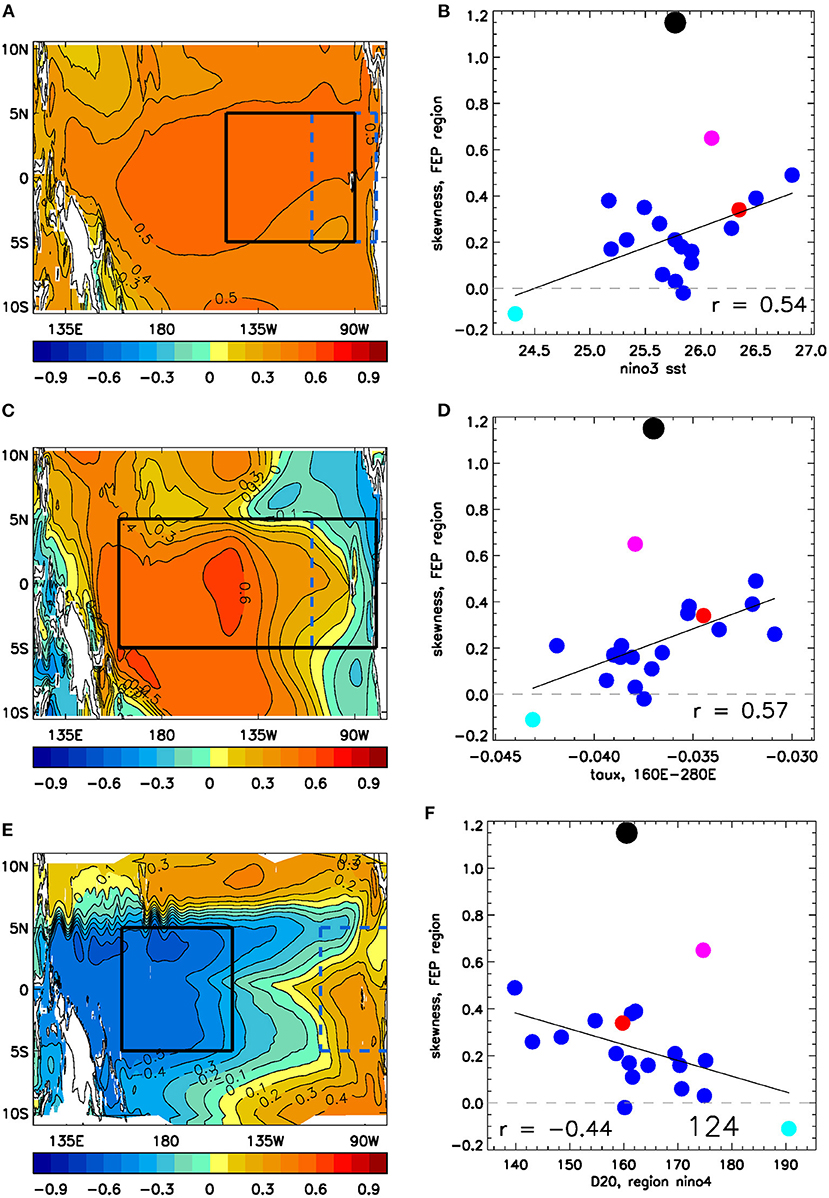
Figure 2. Relationship between skewness and equatorial Pacific annual mean state. Spatial plot of grid point correlation of SST (A) zonal wind stress (C) and depth of 20° isotherm (E) with FEP skewness. Scatter diagram of FEP skewness against annual mean Niño3 SST (B), central Pacific wind stress (D) and depth of 20° isotherm for region Niño4 (F) for PPE members (small blue circles, with SK+ magenta, STD red, SK- cyan) and reanalysis data (large black circle). Regions for FEP (110-80°W, 5°N-5°S), Niño3 (150-90°W, 5°N-5°S), central Pacific (160°E-80°W, 5°N-5°S) and Niño4 (160°E-150°W, 5N-5S) are shown by boxes in the left-hand panel.
The relationship between WWBs and skewness is examined using a simple index as a measure of accumulated wind burst activity (WWB index, see section Methods) The index is calculated from daily 10 m zonal winds that have previously been filtered to remove timescales longer than a season (90 days).
We find there are large differences in the annual mean WWB index across our model versions, ranging from an average of 18.3 to 108.8 ms−1 per year (Figure 3A). However, there is only a weak (not significant) positive correlation (r = 0.28) between FEP skewness and WWB activity. We also note that although the two members with largest skewness have relatively high levels of WWB activity, we see that this is not a prerequisite for the PPE skewness. Indeed, the member with the lowest WWB index has similar moderate skewness to the member with the highest WWB index. Finally, we note that the WWB index for the reanalysis lies well within the range of the PPE simulations, suggesting that the model versions are not systematically biased with respect to annual mean WWB activity.
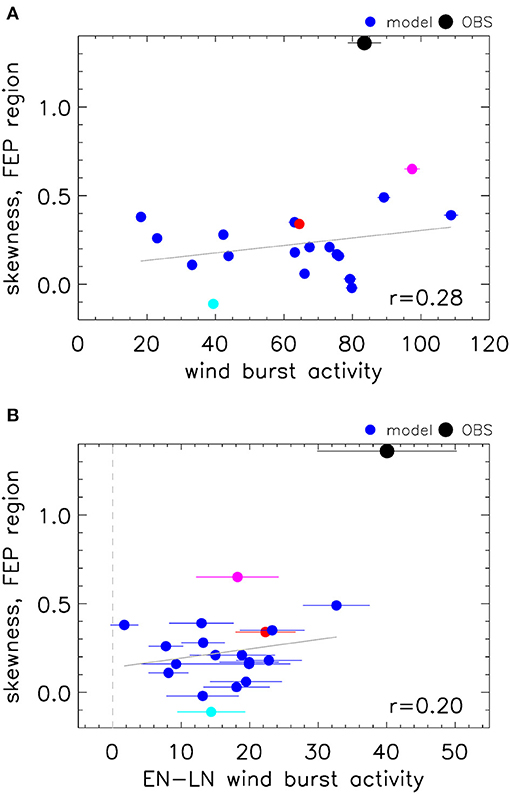
Figure 3. Relationship between skewness and westerly wind burst activity. Scatter diagram of FEP SST skewness against annual mean wind burst activity (A) and against the El Niño minus La Niña difference in wind burst activity during the January to November period prior to ENSO events (B) for PPE members (small blue circles, with SK+ magenta, STD red, SK– cyan) and reanalysis data (large black circle). Horizontal bars show the standard error.
To test the importance of the modulation of wind burst activity by SST in the PPE we look at the difference in WWB activity between El Niño and La Niña events in the January to November period prior to ENSO events (Figure 3B). El Niño/La Niña events are defined here as DJF Niño3.4 anomalies exceeding a threshold of +/- 0.8°C. As has been previously demonstrated (e.g., Puy et al., 2016) there is a significant modulation of WWBs by ENSO, with more WWBs during El Niño. However, the majority of PPE members show only a weak difference, significantly underestimating the observed modulation. We also look at this relationship for two separate periods, during boreal spring, early in the ENSO growth cycle, and in boreal summer-autumn, when SST anomalies are established and growing in magnitude. We find a similar relationship for both periods (not shown), suggesting that the rather weak difference in WWB activity in the PPE may result in very large initial El Niño growth in the PPE being less likely than observed, and also, in the second part of the year, that the model may be underestimating the observed dependence of WWBs on SST. However, because of the lack of extreme El Niño events in the PPE this latter result may also simply reflect this lack of model skewness. While there is no relationship (r = 0.2) across the PPE with skewness, the difference between the model and observations suggests possible model error in HadGEM-GC3.1 in this respect.
Equatorial non-linear advection for the combined ocean reanalysis product shows warming in the region of the thermocline and in the surface mixed layer, largely concentrated to the east of the dateline (Figure 4A). These features agree well with the analysis shown by Hayashi et al. (2020). Non-linear advection for the PPE, combined over all models, shows a similar pattern, but with muted warming in the ocean subsurface (Figure 4B).
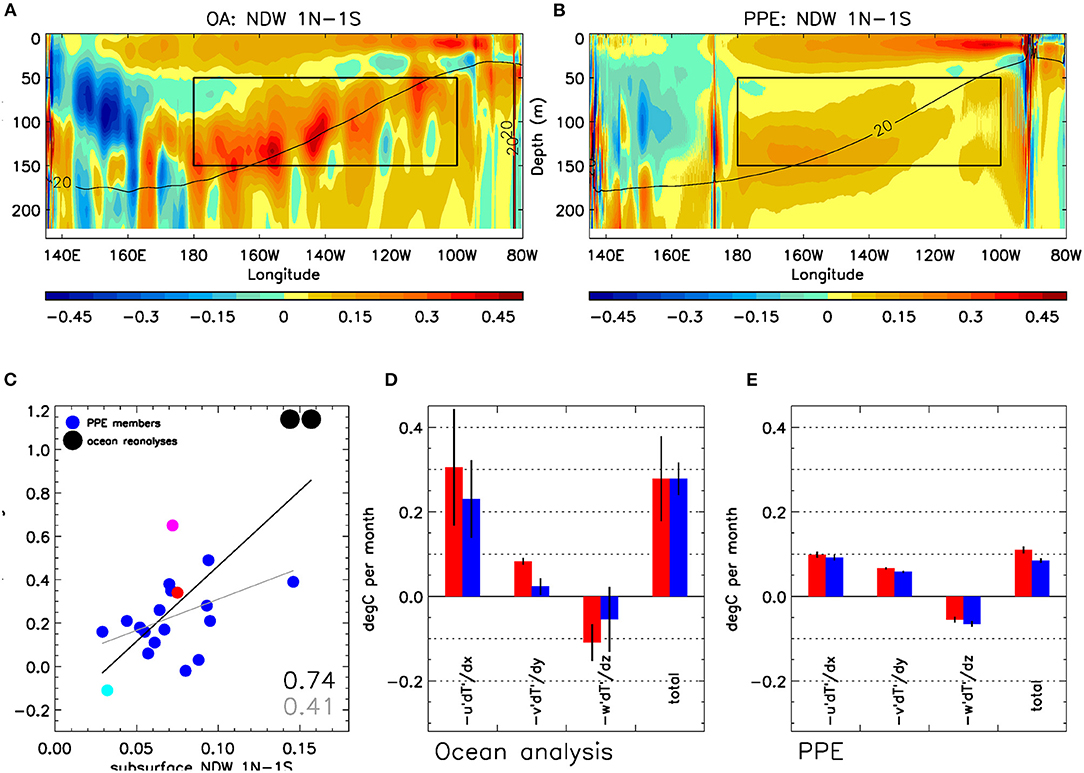
Figure 4. Warming due to non-linear advection. Non-linear advection (K month−1) for combined ocean analyses (A) and combined PPE members (B). Box shows the averaging region for the non-linear advection. Scatter diagram of FEP skewness against non-linear advection for PPE ensemble members (small blue circles, with SK+ magenta, STD red, SK– cyan) and ocean reanalyses (large black circles) (C). Non-linear advection terms during growth period of El Niño (red) and La Niña (blue) for combined ocean reanalyses (D) combined PPE (E). Combined results are the average over the respective datasets.The growth period is defined here as the average of months April to November prior to the event, with the DJF El Niño/La Niña events identified using a ±0.8°C threshold. Data in (C) are area-averages taken over the box shown in the upper panels (180°-100°W,1°S-1°N, 50–150 m). The combined ocean analysis data (A) have been smoothed. Vertical bars in (D,E) show the 95% confidence interval.
Following Hayashi et al. (2020), area averages are calculated for the region (180-100°W, 1°S-1°N, 50–150 m), encompassing the maximum subsurface non-linear dynamic warming (NDW) in the reanalysis. There is a significant relationship (r = 0.74, p < 0.001) between the FEP skewness and the NDW for the model simulations and ocean reanalyses (Figure 4C). The correlation over PPE members alone is also significant (r = 0.41, p < 0.1). Unlike our other hypothesized mechanisms for the underestimated ENSO asymmetry, there is a clear systematic model bias in the strength of the NDW and all of the PPE members underestimate the NDW relative to the ocean reanalysis. The NDW is therefore a strong candidate for the lack of asymmetry in the model, consistent with other studies on NDW (Hayashi et al., 2020; Chen et al., 2021).
To consider the contribution of NDW to the growth of ENSO, the NDW for the mean of April to November prior to the peak of ENSO is calculated for all El Niño and La Niña events. Overall, there is a positive contribution during both El Niño and La Niña for both the combined ocean reanalysis and the model members (Figures 4D,E) This acts to weaken cold (La Niña) events and strengthen warm (El Niño) events, contributing to amplitude asymmetry. However, the total warming in the reanalysis is over twice the magnitude of that in the model (see the right-hand bars in Figures 4D,E).
We now consider the three component terms of the NDW (Equation 2) to try to better understand the origin of the weak NDW in the model. The zonal non-linear warming term (-u'∂T'/∂x) and meridional term (-v'∂T'/∂y) both make a positive contribution to the warming, whereas the vertical (-w'∂T'/∂z) term is negative and acts to partially offset the horizontal terms. Comparing the PPE with the ocean analysis we see that it is the zonal component of non-linear advection which largely accounts for the difference in total magnitude (left hand bars in Figures 4D,E). It is noteworthy that there is also a significant relationship (r = 0.48, p < 0.05) between skewness and NDW for the zonal component across PPE members (not shown).
To further explore the reason for the difference in zonal NDW, we decomposed the zonal NDW for the observational reanalysis and the model (Figures 5A,B), into the zonal anomalous temperature gradient (Figures 5C,D) and anomalous zonal current (Figures 5E,F), although this separation is an approximation due to the correlation between the strength of T' and u' fluctuations. It can be seen that the anomalous eastward surface current anomalies extend too deep in the PPE compared with the reanalysis and in particular, that the anomalous westward currents in the region of the equatorial undercurrent are much weaker in the model (Figures 5E,F). This latter difference suggests that the ocean circulation response to ENSO is too weak in our model and provides a focus for future model development.
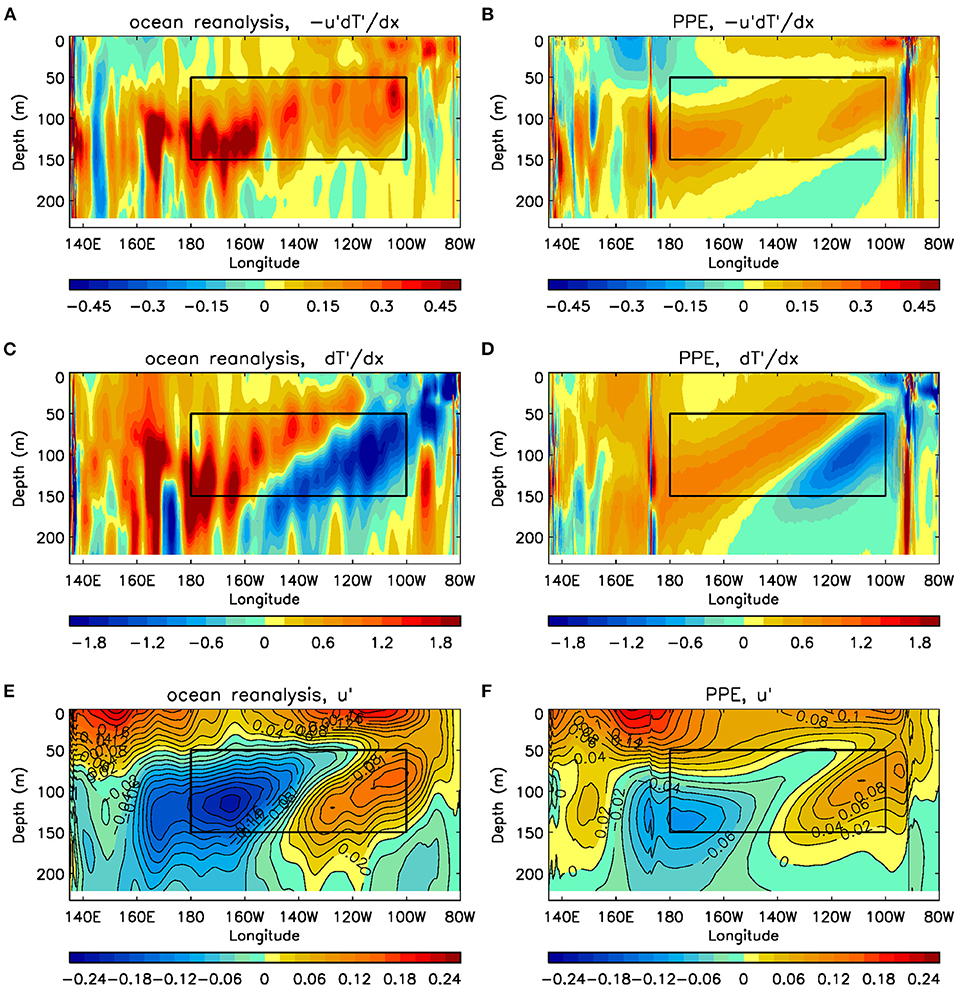
Figure 5. Decomposition of zonal component of non-linear advection. Zonal component of non-linear advection (K month−1) for combined ocean reanalysis (A) and combined PPE (B), zonal gradient of temperature anomaly (K m−1) for combined ocean reanalysis (C) and combined PPE (D), and zonal current anomaly (ms−1) for combined ocean reanalysis (E) and combined PPE (F). Sections are for 1°N-1°S, for the growth period of ENSO, El Niño plus La Niña for (A,B) and El Niño minus La Niña for (C–F). The combined ocean analysis data have been smoothed.
We have tested several hypotheses for the weak ENSO amplitude asymmetry in HadGEM-GC3.1, finding initially that mean state errors do not appear to be a factor limiting skewness in our model, at least in the large-scale areas examined here.
Overall, there is only a weak relationship between skewness and mean WWB activity and our model is not systematically biased in this respect. There is also no significant relationship between the state dependent WWB activity and skewness which is consistent with the recent study by Olson et al. (2021) who used an empirical stochastic model to suggest that state dependent noise does not play a role in El Niño asymmetry. However, in this case most of the PPE ensemble members do underestimate the difference in WWB activity between El Niño and La Niña, suggesting the likelihood of model error in this respect. This is consistent with Levine et al. (2016) who show that most CMIP5 models underestimate state-dependent noise forcing. Nevertheless, our simple diagnostic ignores the spatio-temporal diversity of westerly wind bursts (Hao et al., 2019) which could in principle affect the oceanic impact (Puy et al., 2016) and the SST response to WWBs may also depend on the oceanic background state, and hence be affected by ocean model bias (Puy et al., 2019) so a more sophisticated analysis would be worthwhile to confirm our results.
In contrast, variation in subsurface NDW is significantly related to skewness and it is also underestimated in our model compared with observational ocean reanalyses. Our analysis suggests model bias in the subsurface zonal NDW, and particularly in anomalous zonal ocean currents which are too weak. These findings are in agreement with other recent analyses of CMIP5 and CMIP6 models (Hayashi et al., 2020; Chen et al., 2021).
The reasons for the weak ENSO response in the equatorial undercurrent variability are not fully understood, especially as the mean undercurrent strength is reasonably represented in the 0.25° ocean model. It's possible there may be a number of contributing factors. First, the mean ENSO amplitude in the combined PPE is slightly lower (by about 10%) than in the ocean reanalysis period, which would suggest slightly weaker amplitude ocean variability in the PPE. Secondly, and in common with other climate models, the dynamic coupling, usually measured by the regression on Niño4 zonal stress onto Niño3 SST, is underestimated (Planton et al., 2021). In the PPE the regression coefficient is from 15 to 55% lower than observed, indicating that the ENSO related momentum transfer to the ocean is too weak. In addition, the anomalous upper ocean currents extend somewhat too deep compared with the reanalysis, perhaps indicating that there is too much mixing of momentum in the upper ocean.
The mechanisms tested here do not rule out other explanations. However, at the 0.25° ocean model resolution used in our simulations, heat convergence associated with tropical instability waves is in reasonably good agreement with observational estimates (Graham, 2014), suggesting that tropical instability waves are unlikely to be the factor limiting skewness in these models. In addition, we note that in our model there is no significant change in skewness across resolution. Other mechanisms have not been tested. We note that model members that have too cold mean SST in the east Pacific also tend to have lower skewness, which is consistent with Sun et al. (2016), who find that weak non-linear air–sea interaction due to cold tongue bias limits asymmetry. Similarly, Liang et al. (2017), find that the range of physical parameters for a system to fall into a regime with positive asymmetry may be rather narrow.
The Met Office Hadley Centre uses the same model in seasonal, decadal and climate prediction systems. While on seasonal timescales the initialized prediction realistically captures the amplitude of extreme El Niño events (Scaife et al., 2017), on longer timescales the predictions revert to the control behavior (Hermanson et al., 2018) with no asymmetry and too few, if any, extreme El Niño events. This may impact our ability to predict and evaluate the risk of extreme regional events associated with the most intense El Niños and highlights the importance of model assessment (e.g., Planton et al., 2021) and further analysis of this important model error, with a view to future improvement.
The original contributions presented in the study are included in the article/supplementary material, further inquiries can be directed to the corresponding author.
KY, MR, and RR gave advice on, the PPE, HH, and ocean reanalysis data, respectively. SI carried out the analysis. AS, ND, and H-LR contributed to discussing the results and writing the paper. All authors commented on the manuscript.
This work, and contributors SI, ND, and AS, were supported by the UK-China Research & Innovation Partnership Fund through the Met Office Climate Science for Service Partnership (CSSP) China as part of the Newton Fund. H-LR was supported by China National Science Foundation (Grant No. 41975094) and the National Key Research and Development Program of China (Grant No.2018YFC1506000). KY was supported by Department for Business, Energy and Industrial Strategy. MR was supported by, and the HH model was performed as part of, the Horizon 2020 program PRIMAVERA project (Grant No. 641727). This study has been conducted using E.U. Copernicus Marine Service Information.
The authors declare that the research was conducted in the absence of any commercial or financial relationships that could be construed as a potential conflict of interest.
All claims expressed in this article are solely those of the authors and do not necessarily represent those of their affiliated organizations, or those of the publisher, the editors and the reviewers. Any product that may be evaluated in this article, or claim that may be made by its manufacturer, is not guaranteed or endorsed by the publisher.
An, S.-I., Tziperman, E., Okumura, Y., and Li, T. (2020). ENSO irregularity and asymmetry. El Niño Southern Oscillation Chang. Clim. Geophys. Monogr. 252, 153–172. doi: 10.1002/9781119548164.ch7
An, S. I. (2008). Interannual variations of the tropical ocean instability wave and ENSO. J. Clim. 21, 3680–3686. doi: 10.1175/2008JCLI1701.1
An, S. I. (2009). A review of interdecadal changes in the nonlinearity of the El Nino-Southern Oscillation. Theor. Appl. Climatol. 97, 29–40. doi: 10.1007/s00704-008-0071-z
Anderson, W. B., Seager, R., Baethgen, W., Cane, M., and You, L. (2019). Synchronous crop failures and climate-forced production variability. Sci. Adv. 5:eaaw1976. doi: 10.1126/sciadv.aaw1976
Bayr, T., Latif, M., Dommenget, D., Wengel, C., Harla,ß, J., and Park, W. (2018). Mean-state dependence of ENSO atmospheric feedbacks in climate models. Clim. Dynam. 50, 3171–3194. doi: 10.1007/s00382-017-3799-2
Burgers, G., and Stephenson, D. B. (1999). The “normality” of El Niño. Geophys. Res. Lett. 26, 1027–1039. doi: 10.1029/1999GL900161
Cai, W., Santoso, A., Collins, M., Dewitte, B., Karamperidou, C., Kug, J. S., et al. (2021). Changing El Niño–Southern oscillation in a warming climate. Nat. Rev. Earth Environ. 2, 628–644. doi: 10.1038/s43017-021-00199-z
Chen, D., Lian, T., Fu, C., Cane, M. A., Tang, Y., Murtugudde, R., et al. (2015). Strong influence of westerly wind bursts on El Niño diversity. Nat. Geosci. 8, 339–345. doi: 10.1038/ngeo2399
Chen, H. C., Jin, F. F., Zhao, S., Wittenberg, A. T., and Xie, S. (2021). ENSO dynamics in the E3SM-1-0, CESM2, and GFDL-CM4 climate models. J. Clim. 34, 9365–9384. doi: 10.1175/JCLI-D-21-0355.1
Dee, D. P., Uppala, S. M., Simmons, A. J., Berrisford, P., Poli, P., Kobayashi, S., et al. (2011). The ERA-Interim reanalysis: configuration and performance of the data assimilation system. Q. J. R. Meteorol. Soc. 137, 553–597. doi: 10.1002/qj.828
Eisenman, I., Yu, L., and Tziperman, E. (2005). Westerly wind bursts: ENSO's tail rather than the dog? J. Clim. 18, 5224–5238. doi: 10.1175/JCLI3588.1
Good, S. A., Martin, M. J., and Rayner, N. A. (2013). EN4: quality controlled ocean temperature and salinity profiles and monthly objective analyses with uncertainty estimates. J. Geophys. Res. Oceans 118, 6704–6716. doi: 10.1002/2013JC009067
Graham, T. (2014). The importance of eddy permitting model resolution for simulation of the heat budget of tropical instability waves. Ocean Model. 79, 21–32. doi: 10.1016/j.ocemod.2014.04.005
Ham, Y.-G. (2017). A reduction in the asymmetry of ENSO amplitude due to global warming: the role of atmospheric feedback. Geophys. Res. Lett. 44, 8576–8584. doi: 10.1002/2017GL074842
Hao, X., Ren, H. L., Zhang, W., Liu, M., and Wei, Y. (2019). Diagnosing the spatiotemporal diversity of westerly wind events in the tropical Pacific. Dynam. Atm. Oceans 86, 90–103. doi: 10.1016/j.dynatmoce.2019.03.004
Hardiman, S. C., Dunstone, N. J., Scaife, A. A., Bett, P. E., Li, C., Lu, B., et al. (2018). The asymmetric response of Yangtze river basin summer rainfall to El Niño/La Niña. Environ. Res. Lett. 13:024015. doi: 10.1088/1748-9326/aaa172
Hayashi, M., and Jin, F.-F. (2017). Subsurface nonlinear dynamical heating and ENSO asymmetry. Geophys. Res. Lett. 44, 12427–12435. doi: 10.1002/2017GL075771
Hayashi, M., Jin, F. F., and Stuecker, M. F. (2020). Dynamics for El Niño-La Niña asymmetry constrain equatorial-Pacific warming pattern. Nat. Commun. 11, 1–10. doi: 10.1038/s41467-020-17983-y
Hayashi, M., and Watanabe, M. (2017). ENSO complexity induced by state dependence of westerly wind events. J. Clim. 30, 3401–3420. doi: 10.1175/JCLI-D-16-0406.1
Hermanson, L., Ren, H. L., Vellinga, M., Dunstone, N. D., Hyder, P., Ineson, S., et al. (2018). Different types of drifts in two seasonal forecast systems and their dependence on ENSO. Clim. Dynam. 51, 1411–1426. doi: 10.1007/s00382-017-3962-9
Hersbach, H., Bell, B., Berrisford, P., Hirahara, S., Horányi, A., Muñoz-Sabater, J., et al. (2020). The ERA5 global reanalysis. Q. J. R. Meteorol. Soc. 146, 1999–2049. doi: 10.1002/qj.3803
Im, S. H., An, S. I., Kim, S. T., and Jin, F. F. (2015). Feedback processes responsible for El Niño-La Niña amplitude asymmetry. Geophys. Res. Lett. 42, 5556–5563. doi: 10.1002/2015GL064853
Jin, F. F., An, S. I., Timmermann, A., and Zhao, J. (2003). Strong El Niño events and nonlinear dynamical heating. Geophys. Res. Lett. 30, 20–21. doi: 10.1029/2002GL016356
Kang, I. S., and Kug, J. S. (2002). El Niño and La Niña sea surface temperature anomalies: asymmetry characteristics associated with their wind stress anomalies. J. Geophys. Res. Atm. 107:ACL-1. doi: 10.1029/2001JD000393
Kessler, W. S., and Kleeman, R. (2000). Rectification of the Madden–Julian oscillation into the ENSO cycle. J. Clim. 13, 3560–3575. doi: 10.1175/1520-0442(2000)013<3560:ROTMJO>2.0.CO
Kim, S. T., Cai, W., Jin, F. F., and Yu, J. Y. (2014). ENSO stability in coupled climate models and its association with mean state. Clim. Dynam. 42, 3313–3321. doi: 10.1007/s00382-013-1833-6
Kohyama, T., and Hartmann, D. L. (2017). Nonlinear ENSO warming suppression (NEWS). J. Clim. 30, 4227–4251. doi: 10.1175/JCLI-D-16-0541.1
Levine, A., Jin, F. F., and McPhaden, M. J. (2016). Extreme noise–extreme El Niño: how state-dependent noise forcing creates El Niño–La Niña asymmetry. J. Clim. 29, 5483–5499. doi: 10.1175/JCLI-D-16-0091.1
Liang, J., Yang, X. Q., and Sun, D. Z. (2017). Factors determining the asymmetry of ENSO. J. Clim. 30, 6097–6106. doi: 10.1175/JCLI-D-16-0923.1
Lloyd, J., Guilyardi, E., and Weller, H. (2012). The role of atmosphere feedbacks during ENSO in the CMIP3 models. Part III: the shortwave flux feedback. J. Clim. 25, 4275–4293. doi: 10.1175/JCLI-D-11-00178.1
Lu, B., and Ren, H. L. (2016). Improving ENSO periodicity simulation by adjusting cumulus entrainment in BCC_CSMs. Dynam. Atm. Oceans 76, 127–140. doi: 10.1016/j.dynatmoce.2016.10.005
MacLachlan, C., Arribas, A., Peterson, K. A., Maidens, A., Fereday, D., Scaife, A. A., et al. (2015). Global Seasonal forecast system version 5 (GloSea5): a high-resolution seasonal forecast system. Q. J. R. Meteorol. Soc. 141, 1072–1084. doi: 10.1002/qj.2396
McKenna, S., Santoso, A., Gupta, A. S., Taschetto, A. S., and Cai, W. (2020). Indian ocean dipole in CMIP5 and CMIP6: characteristics, biases, and links to ENSO. Sci. Rep. 10, 1–13. doi: 10.1038/s41598-020-68268-9
Megann, A., Storkey, D., Aksenov, Y., Alderson, S., Calvert, D., Graham, T., et al. (2014). GO5. 0: the joint NERC–Met Office NEMO global ocean model for use in coupled and forced applications. Geosci. Model Dev. 7, 1069–1092. doi: 10.5194/gmd-7-1069-2014
Menary, M. B., Kuhlbrodt, T., Ridley, J., Andrews, M. B., Dimdore-Miles, O. B., Deshayes, J., et al. (2018). Preindustrial control simulations with HadGEM3-GC3. 1 for CMIP6. J. Adv. Model. Earth Syst. 10, 3049–3075. doi: 10.1029/2018MS001495
Okumura, Y. M., and Deser, C. (2010). Asymmetry in the duration of El Niño and La Niña. J. Clim. 23, 5826–5843. doi: 10.1175/2010JCLI3592.1
Olson, R., An, S. I., Kim, S. K., and Fan, Y. (2021). A novel approach for discovering stochastic models behind data applied to El Niño–Southern Oscillation. Sci. Rep. 11, 1–12. doi: 10.1038/s41598-021-81162-2
Philander, S. G. H. (1990). El Niño, La Niña, and the Southern Oscillation. 293 p. San Diego, CA: Academic.
Planton, Y. Y., Guilyardi, E., Wittenberg, A. T., Lee, J., Gleckler, P. J., Bayr, T., et al. (2021). Evaluating climate models with the CLIVAR 2020 ENSO metrics package. Bull. Am. Meteorol. Soc. 102, E193–E217. doi: 10.1175/BAMS-D-19-0337.1
Puy, M., Vialard, J., Lengaigne, M., and Guilyardi, E. (2016). Modulation of equatorial Pacific westerly/easterly wind events by the Madden–Julian oscillation and convectively-coupled Rossby waves. Clim. Dynam. 46, 2155–2178. doi: 10.1007/s00382-015-2695-x
Puy, M., Vialard, J., Lengaigne, M., Guilyardi, E., Voldoire, A., and Madec, G. (2019). Modulation of equatorial Pacific sea surface temperature response to westerly wind events by the oceanic background state. Clim. Dynam. 52, 7267–7291. doi: 10.1007/s00382-016-3480-1
Rayner, N. A. A., Parker, D. E., Horton, E. B., Folland, C. K., Alexander, L. V., Rowell, D. P., et al. (2003). Global analyses of sea surface temperature, sea ice, and night marine air temperature since the late nineteenth century. J. Geophys. Res. Atm. 108:4407. doi: 10.1029/2002JD002670
Roberts, M. J., Baker, A., Blockley, E. W., Calvert, D., Coward, A., Hewitt, H. T., et al. (2019). Description of the resolution hierarchy of the global coupled HadGEM3-GC3.1 model as used in CMIP6 HighResMIP experiments. Geosci. Model Dev. 12, 4999–5028. doi: 10.5194/gmd-12-4999-2019
Santoso, A., Mcphaden, M. J., and Cai, W. (2017). The defining characteristics of ENSO extremes and the strong 2015/2016 El Niño. Rev. Geophys. 55, 1079–1129. doi: 10.1002/2017RG000560
Scaife, A. A., Comer, R., Dunstone, N., Fereday, D., Folland, C., Good, E., et al. (2017). Predictability of European winter 2015/2016. Atmos. Sci. Lett. 18, 38–44. doi: 10.1002/asl.721
Sexton, D. M., McSweeney, C. F., Rostron, J. W., Yamazaki, K., Booth, B. B., Murphy, J. M., et al. (2021). A perturbed parameter ensemble of HadGEM3-GC3.05 coupled model projections: part 1: selecting the parameter combinations. Clim. Dynam. 56, 3395–3436. doi: 10.1007/s00382-021-05709-9
Su, J., Zhang, R., Li, T., Rong, X., Kug, J. S., and Hong, C. C. (2010). Causes of the El Niño and La Niña amplitude asymmetry in the equatorial eastern Pacific. J. Clim. 23, 605–617. doi: 10.1175/2009JCLI2894.1
Sun, Y., Wang, F., and Sun, D. Z. (2016). Weak ENSO asymmetry due to weak nonlinear air–sea interaction in CMIP5 climate models. Adv. Atm. Sci. 33, 352–364. doi: 10.1007/s00376-015-5018-6
Timmermann, A., An, S. I., Kug, J. S., Jin, F. F., Cai, W., Capotondi, A., et al. (2018). El Niño–southern oscillation complexity. Nature 559, 535–545. doi: 10.1038/s41586-018-0252-6
Vialard, J., Menkes, C., Boulanger, J. P., Delecluse, P., Guilyardi, E., McPhaden, M. J., et al. (2001). A model study of oceanic mechanisms affecting equatorial Pacific sea surface temperature during the 1997–98 El Niño. J. Phys. Oceanogr. 31, 1649–1675. doi: 10.1175/1520-0485(2001)031<1649:AMSOOM>2.0.CO
Watanabe, M., Chikira, M., Imada, Y., and Kimoto, M. (2011). Convective control of ENSO simulated in MIROC. J. Clim. 24, 543–562. doi: 10.1175/2010JCLI3878.1
Williams, K. D., Copsey, D., Blockley, E. W., Bodas-Salcedo, A., Calvert, D., Comer, R., et al. (2018). The Met Office global coupled model 3.0 and 3.1 (GC3. 0 and GC3. 1) configurations. J. Adv. Model. Earth Syst. 10, 357–380. doi: 10.1002/2017MS001115
Yamazaki, K., Sexton, D. M., Rostron, J. W., McSweeney, C. F., Murphy, J. M., and Harris, G. R. (2021). A perturbed parameter ensemble of HadGEM3-GC3.05 coupled model projections: part 2: global performance and future changes. Clim. Dynam. 56, 3437–3471. doi: 10.1007/s00382-020-05608-5
Zhang, T., and Sun, D. Z. (2014). ENSO asymmetry in CMIP5 models. J. Clim. 27, 4070–4093. doi: 10.1175/JCLI-D-13-00454.1
Keywords: El Niño-Southern Oscillation, asymmetry, non-linear dynamic warming, westerly wind burst, climate model
Citation: Ineson S, Dunstone NJ, Ren H-L, Renshaw R, Roberts MJ, Scaife AA and Yamazaki K (2021) ENSO Amplitude Asymmetry in Met Office Hadley Centre Climate Models. Front. Clim. 3:789869. doi: 10.3389/fclim.2021.789869
Received: 05 October 2021; Accepted: 29 November 2021;
Published: 20 December 2021.
Edited by:
Swadhin Kumar Behera, Japan Agency for Marine-Earth Science and Technology (JAMSTEC), JapanReviewed by:
Han-Ching Chen, University of Hawaii at Manoa, United StatesCopyright © 2021 Ineson, Dunstone, Ren, Renshaw, Roberts, Scaife and Yamazaki. This is an open-access article distributed under the terms of the Creative Commons Attribution License (CC BY). The use, distribution or reproduction in other forums is permitted, provided the original author(s) and the copyright owner(s) are credited and that the original publication in this journal is cited, in accordance with accepted academic practice. No use, distribution or reproduction is permitted which does not comply with these terms.
*Correspondence: Sarah Ineson, c2FyYWguaW5lc29uQG1ldG9mZmljZS5nb3YudWs=
Disclaimer: All claims expressed in this article are solely those of the authors and do not necessarily represent those of their affiliated organizations, or those of the publisher, the editors and the reviewers. Any product that may be evaluated in this article or claim that may be made by its manufacturer is not guaranteed or endorsed by the publisher.
Research integrity at Frontiers
Learn more about the work of our research integrity team to safeguard the quality of each article we publish.