 Tufa Dinku
 Rija Faniriantsoa
 Remi Cousin
 Igor Khomyakov
 James W. Hansen
 Amanda Grossi
94% of researchers rate our articles as excellent or good
Learn more about the work of our research integrity team to safeguard the quality of each article we publish.
Find out more
METHODS article
Front. Clim., 05 January 2022
Sec. Climate Services
Volume 3 - 2021 | https://doi.org/10.3389/fclim.2021.787683
This article is part of the Research TopicFrom Observations to Predictions and Projections: Opportunities and Challenges for Climate Risk Assessment and Management in Sub-Saharan AfricaView all 10 articles
Despite recent and mostly global efforts to promote climate services in developing countries, Africa still faces significant limitations in its institutional infrastructure and capacity to develop, access, and use decision-relevant climate data and information products at multiple levels of governance. The Enhancing National Climate Services (ENACTS) initiative, led by Columbia University's International Research Institute for Climate and Society (IRI), strives to overcome these challenges by co-developing tailored, actionable, and decision-relevant climate information with and for a wide variety of users at the local, regional, and national levels. This is accomplished through an approach emphasizing direct engagement with the National Meteorological and Hydrological Services (NMHS) and users of their products, and investments in both technological and human capacities for improving the availability, access, and use of quality climate data and information products at decision-relevant spatial and temporal scales. In doing so, the ENACTS approach has been shown to be an effective means of transforming decision-making surrounding vulnerabilities and risks at multiple scales, through implementation in over a dozen countries at national level as well as at the regional levels in both East and West Africa. Through the ENACTS approach, challenges to availability of climate data are alleviated by combining quality-controlled station observations with global proxies to generate spatially and temporally complete climate datasets. Access to climate information is enhanced by developing an online mapping service that provides a user-friendly interface for analyzing and visualizing climate information products. Use of the generated climate data and the derived information products is promoted through raising awareness in relevant communities, training users, and co-production processes.
Building resilience is vital if countries and communities are to cope with the challenges of climate variability and change. This is particularly important in those parts of the world, like Africa, which are the most affected by climatic changes but possess the least adaptive capacity to manage the associated risks (African Development Bank, 2019). As such, solutions to mitigate the negative effects of climate change and variability, and adapt to anticipated changes are in particular and dire need (Conway and Vincent, 2021).
Climate information is one such solution with an enormous role to play in improving resilience and decision-making in the face of increasingly erratic precipitation and temperature patterns. From shorter-term decisions such as planning for, managing, and responding to climate hazards such as droughts or floods associated with climate variability to longer-term decisions to inform strategic or policy planning around climate risk management and climate change, climate information is the bedrock of climate-smart decision-making for governments, organizations, communities, and individuals (Cooper et al., 2008; Hansen et al., 2011, 2019a,b; Sheffield et al., 2014; Vaughan and Dessai, 2014; Stern and Cooper, 2017).
This reality has been increasingly recognized by the international community, which has developed resources and materials to promote its use at multiple levels. The United Nations Framework Convention on Climate Change (UNFCCC) Least Developed Countries Expert Group (LEG), for example, has developed guidelines, which emphasize the need for using climate information in the design and implementation of adaptation to climate change (Burton et al., 2002). Similarly, in the academic and practitioner communities, there is a growing body of research on the need to support adaptation through the provision of climate information that is salient, accessible, legitimate, credible, equitable, and integrated (Hewitt et al., 2012; Hansen et al., 2014; Daron et al., 2015; Harold et al., 2016; Buontempo and Hewitt, 2018; Buontempo et al., 2018; Christel et al., 2018; Vaughan et al., 2018; Clifford et al., 2020). However, there are still major practical challenges to ensuring that climate information is actually useful, usable, and used by those who need it most, and climate services approaches aim to address them (Hansen et al., 2011, 2019a; Vaughan and Dessai, 2014).
The World Meteorological Organization (WMO) defines climate services as “the provision of one or more climate products or advice in such a way as to assist decision-making by individuals or organizations,” (WMO, 2014), while the Climate Services Partnership (CSP) describes climate services as “the production, translation, transfer, and use of climate knowledge and information in climate-informed decision making and climate-smart policy and planning,” (Climate Services Partnership, 2011). The common thread between these two definitions is that climate services involve the provision of specific climate information products or services for a specific decision-making process. In other words, it is not the mere presence of climate information, but how this information is developed, tailored, communicated, and used in climate-sensitive decisions that ultimately determines its efficacy toward its stated goals in supporting adaptation.
Before information, however, there is the data that underlies it. Climate data is the foundation for providing climate services. However, due to the limitations surrounding the availability of and access to climate data and information products in Africa, the use of climate information in plans to manage risks from current climate variability or adapting to climate change has been limited. While many reasons for this exist, most limitations are related to climatic infrastructure and investment. In many parts of Africa, weather stations are sparse and their number has been declining (Washington et al., 2006; Dinku et al., 2014; Dinku, 2019). Moreover, where weather stations do exist, their distribution is uneven, with most stations located in towns along major roads. Thus, useful climate information is often not available purely because of data constraints. And when data does exist, it is often inaccessible to those who need it most.
However, data constraints or even accessibility issues are not always at fault for climate information not being useful. Even when high-resolution data exist, the information derived from such data may not be at a scale—temporally or spatially—or presented in a format that is relevant for decision-makers. A map showing precipitation patterns and likely areas of malaria incidence for the health sector, for example, may prove meaningless for those in the agriculture sector who would prefer to have information relating to rain onset or amounts to inform planting and seed choice visualized, or even entirely unusable for farmers who can only receive such information via radio or text. A shared collection of climate information can be applicable to more than one sector and provide a robust system for managing risks and shocks (Goddard et al., 2020; Conway and Vincent, 2021), but it is not inevitable that this will come about.
To ensure usefulness, usability, and actual use of climate information, intentional investments need to be made in the translation of this information for a wide array of users and sectors, in communication systems and strategies for sharing this information for different audiences, and in capacity building approaches promoting awareness and understanding of the information itself (Christel et al., 2018; Vincent et al., 2020) And, perhaps most importantly, norms, policies, programs, and practices need to be established to ensure an ongoing, iterative dialogue—also known as “coproduction”—between those who ultimately produce climate information products and those whom it is intended to serve (Meadow et al., 2015; Kruk et al., 2017; Vincent et al., 2018, 2020; Conway and Vincent, 2021).
The accompaniment of efforts to improve data availability and quality with kinds of capacity building and investments just described is especially salient and needed in Africa, where there is limited manpower capacity and National Meteorological and Hydrological Services (NHMS) culture that tends to see its responsibility in the realm of information generation, rather than shepherds or stewards of its use as just described. In contrast to the holistic vision of climate services just laid forth, most NMHS were historically established and mandated with the purpose of simply providing weather forecasts for aviation and other similar activities. As such, they have very limited manpower and experience in climate services, which requires engagement with users in a co-production framework (Vincent et al., 2018; Bremer et al., 2019). And as a result, these NMHS have been slow to transition from issuing weather and climate forecast to providing the kind of climate services needed for climate risk management and climate change adaptation by a variety of sectors.
The Enhancing National Climate Services (ENACTS) initiative led by Columbia University's International Research Institute for Climate and Society (IRI) has been making efforts to alleviate the challenges described above (Dinku et al., 2014, 2018). Working closely with NMHS of various countries, particularly in Africa, this initiative aims to improve the availability and quality of climate data, facilitate access to data and derived climate information products, and promote the use of the data and climate information products for improved decision-making in different climate-sensitive sectors. Engagement with the NMHS has been critical to the ENACTS approach, as the NMHS are the nationally mandated organizations for the collection, management, and dissemination of meteorological observations. Enhancing National Climate Services improves the availability of climate data by blending the best available national meteorological observations with global climate and environmental products. Access to climate data and information products is enhanced by working with NMHS and climate services users in order to generate information products needed for climate resilient decision-making in key development sectors and then making those products freely available through a user-friendly dynamic web interface. This system enables the NMHS to generate and deliver targeted climate information products relevant to the needs of decision makers from local to national levels. The use of information products is facilitated by supporting the NMHS to engage their users at the different levels. The IRI is able to provide this support because the institution itself is comprised of a multidisciplinary team of climate scientists as well as sectoral specialists (e.g., agriculture, health, and water) that works at the nexus of science, development practice, and policy.
Enhancing National Climate Services was first launched in Ethiopia in 2012, and has now been implemented in about 16 countries at national level and at regional level in East and West Africa (Figure 1). This has been accomplished by fostering collaborations at national, regional, and global levels. The national level engagement with NMHS as well as experts from the climate-sensitive sectors such as agriculture has been instrumental in enhancing the national capacity to provide and use climate information. The engagement with Regional Climate Centers (RCC) has been critical in building ENACTS-related capacity in the region and making implementation of ENACTS sustainable and cost-erective. At the global level, ENACTS has been supported through funding by a number of organizations that include the United States Agency for International Development (USAID), the UK Department or International Development (DFID), the World Bank and the African Climate Policy Center (ACPC). It has also received input from relevant global institutions such as the WMO, and the Global Framework for Climate Services (GFCS), including some funding.

Figure 1. Countries and regions where ENACTS has been implemented or is in the process of being implemented. The brown color shows where ENACTS has been implemented at the regional level, while the green color shows where ENACTS has been implemented only at the national level. Countries in orange are those in which ENACTS has been implemented both at the regional and the national levels.
The general philosophy and approach of ENACTS has been discussed in detail by Dinku et al. (2018). The next sections will summarize the approach, and then focus on how ENACTS is actually implemented in practice, by presenting the main steps and activities.
The goal of the ENACTS initiative is to transform how decision makers make climate-sensitive decisions at the local, regional, and national levels. This is accomplished through the following three objectives (Dinku et al., 2018):
1. Improve the availability and quality of climate data and information products at the local, national, and regional levels.
2. Enhance access to climate data, information products, and services relevant to the needs of the public, national, and local practitioners in climate-sensitive sectors, as well as policy makers, those in the private sector, and researchers.
3. Promote the widespread use of climate information and services by pursuing effective stakeholder engagement and tapping into existing demand for climate information.
The following sections provide the details of these three objectives.
This objective involves assessing available climate observations, executing quality-control of all rainfall and temperature observations from any given country's meteorological network, and then combining the quality-controlled station observations with satellite estimates for rainfall. For temperature, the quality-controlled observations are combined with digital elevation models and climate reanalysis products. During this activity, station observations undergo a comprehensive quality check procedure. While this procedure for checking and, whenever possible, fixing erroneous observations and coordinates is challenging and time-consuming, it is essential to ensure the quality of the datasets.
In order to create temporally and spatially complete climate data sets, the quality-controlled ground observations are blended with satellite rainfall estimates and reanalysis proxies (for temperature). The strengths of the satellite rainfall estimate and climate model reanalysis temperature products include the following:
(i) complete spatial coverage over most of the globe;
(ii) available free of charge from many global centers; and
(iii) long time series, which is close to 40 years for satellite precipitation products and over 50 years of time series for reanalysis products.
The proixies also suffer from some weaknesses, the main one being low accuracy compared to station observations. The ENACTS approach thus strives to overcome the weaknesses of both station observations (limited coverage) and satellite and reanalysis products (accuracy) by combing the better spatial coverage of the proxies with the better accuracy of the ground observations. These blended datasets provide 40-year time series of rainfall and 50 years of temperature time series at high (4 or 5 km) spatial resolutions. These datasets represent a significant improvement over the station-only or proxy-only datasets, depending on the application.
Access to climate information products is made easier by developing and making available on online climate information portals (maprooms) with visualizations of this information (Nsengiyumva et al., 2021). The first step to accomplish this is the installation of the IRI Data Library (DL) at the NMHS. The DL is a very powerful platform for hosting, analyzing, visualizing, and disseminating multidisciplinary data and information products (Blumenthal et al., 2014). It supports Geographic Information System (GIS) capability, is highly interoperable across major data formats and protocols, and is portable to remote sites. The DL is then used to develop online climate information products called Maprooms. A Maproom is an online platform where a collection of select information products can be developed and presented for specific user audiences. Beyond Maprooms, the DL is used to develop and make available an array of other climate information products for different applications as well.
Availability of climate information products on the web may not automatically lead to understanding and uptake of these products. A number of efforts are needed to ensure the uptake and use of these products. To start with, potential users would need to know that these products exist. Then, users need to be trained on how to navigate, understand, and use the different climate information products. Above all, users need to be engaged, through a co-production process, so that generated information products respond to specific user needs. This co-design and co-production process, which requires constant dialogue and iterative interactions, is in line with the implementation of National Framework for Climate Services (NFCS) being led through the GFCS (WMO, 2014). Thus, ENACTS lays the foundation for the implementation of the NFCS.
The ENACTS approach incorporates several innovations to overcome the data and human capacity constraints of NMHS for providing climate information and services that are relevant to local user needs. These constraints are addressed by supporting NMHS with methods, tools, and training to: (a) spatially and temporally complete, gridded, historical climate datasets; (b) generate suites of derived decision-relevant climate information products; and (c) disseminate climate information products through an interactive online visualization platform (Maprooms). The ENACTS team visits each NMHS and works directly with NMHS staff in implementing the different components of ENACTS. While this support is costly, it is necessary for making use of all available climate data and ensuring ownership and sustainability. Nonetheless, there are ways to reduce the cost while still promoting sustainability.
The implementation of ENACTS is a well-structured process according to the three objectives described above and is thus straightforward, though it may need to be adapted to the specific needs of each target country. Implementation is initiated with the first visit of the ENACTS team member to the NMHS to discuss and agree on the plan of execution. The implementation of each component is described in more detail below.
This component involves four steps: (i) install the Climate Data Tool (CDT) and train NMHS staff to use it; (ii) organize and assess availability of station observations; (iii) assess and fixing the quality of station observations; and (iv) fill spatial and temporal gaps in the observations.
The CDT software is a free, open-source R package created specifically for NHMS in Africa, which generally do not have access to data organization and analytical tools for climate data. The CDT has been evolving for over 5 years and has become a powerful and easy to use tool. The main functionalities of CDT include:
• Organization of station and proxy data;
• Assessment of data availability;
• Assessment and correction of data quality;
• Combination of station observation with proxies (satellite rainfall and climate model reanalysis products) to fill temporal and spatial gaps in station observations;
• Evaluation of gridded products, including satellite, reanalysis, and combined data products;
• Extraction of data from gridded products, including satellite, reanalysis, and combined data products, at any point, for a selected box, and for any administrative boundary; and
• Analysis and visualization of station and gridded datasets.
The CDT training starts with theoretical basics covering quality control of station data, satellite rainfall estimation, climate model reanalysis products, combining station data with proxies, and evaluation of the generated products.
Rainfall and minimum and maximum temperature observations in the NMHS database are first organized and converted into a format that can be used in CDT. Then CDT is used to assess which data are available and which are missing. Climate Data Tool presents this assessment in tabular and graphic formats. Figures 2, 3 are examples of CDT outputs in graphics format. Figure 2 shows the number of stations that were reporting each year, while Figure 3 shows the percentage of data available from each station across the country. This was an eye-opening exercise for NMHS in many countries, as this was the first time they could visualize and analyze their data in this way.

Figure 2. Average number of stations that reported data for each month.
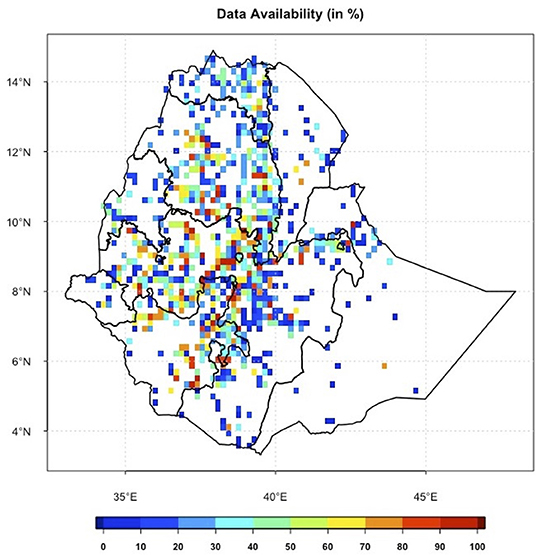
Figure 3. An example data availability assessment showing what percent of data is available for each station.
Data quality control is a critical component of ENACTS. Station observations undergo a comprehensive quality check procedure. The quality check process involves identifying, and whenever possible fixing, erroneous observations, and erroneous station locations (coordinates). This is the most time-consuming and challenging task in the process, but it is crucial for ensuring data quality. The CDT is used to perform this quality control task. Climate Data Tool checks for a multitude of station observation error types and presents the outputs in different formats (e.g., Figure 4). This helps the NMHS staff to easily identify the errors and fix or remove the data from their databases.
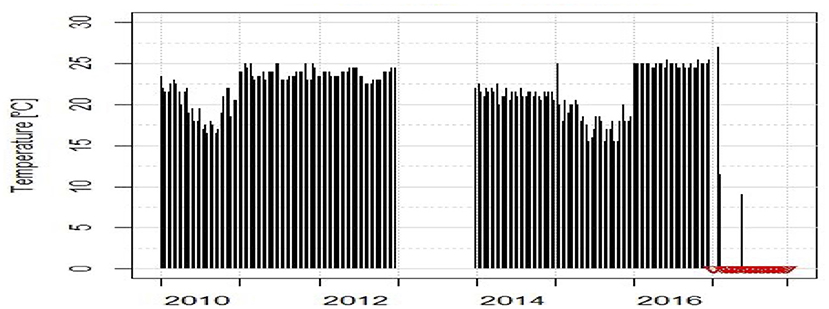
Figure 4. An output from the quality check procedure showing (in red) rainfall data mixed up with temperature measurements.
Spatial and temporal gaps in the historical climate datasets are filled by combining the quality-controlled station observations with satellite rainfall estimates or climate model reanalysis temperature products (Figure 5). Reanalysis products are climate data generated by systematically combining climate observations (analyses) with climate model forecasts using data assimilation schemes and climate models. For rainfall, the Climate Hazards Group Infrared Precipitation (CHIRP, Funk et al., 2015) or Tropical Applications of Meteorology using Satellite data (TAMSAT; Maidment et al., 2014) satellite rainfall estimates are used depending on the performance of those products relative to station observations over the particular country. These two satellite products have been chosen because of their long time series (starting from 1981/1983), high spatial resolution (about 5/4 km), and use of consistent satellite sensor (infrared) data throughout the time series. The Japanese 55-year climate model reanalysis (JRA55; Kobayashi et al., 2015) is used for temperature mainly because of its long time series (since 1958) and regular update. However, this product has a coarse spatial resolution of about 50 km. Thus, the reanalysis data are downscaled to 4 or 5 km spatial resolution using station observations and elevation maps (digital elevation model).
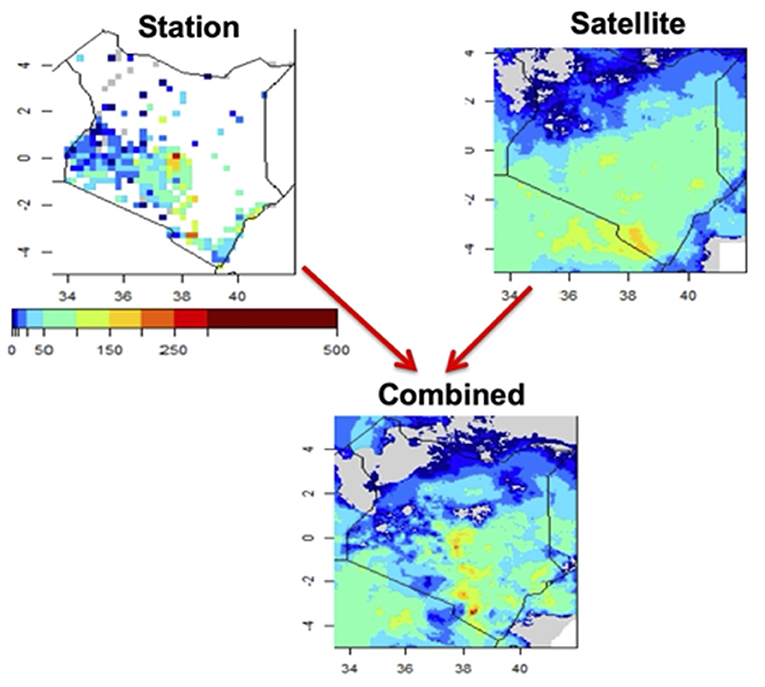
Figure 5. Ten-day total rainfall as observed by station (top left), estimated by satellite (top right), and the optimal combination of the two (bottom). The color bar shows rainfall amounts in mm.
The approach adopted for generating rainfall and temperature time series, performed using CDT, involves the following steps:
• Downscale proxy data (only reanalysis for temperature);
• Use historical station data to calculate climatological adjustments factors;
• Apply the adjustment factors to all proxy data;
• Merge the output from the previous step with available station data for each dekad (10-day period) or each day of each year.
One of the main strengths of ENACTS is that by working directly with NMHS, it is able to make use of all local observational data, which significantly enhances the quality of the generated data relative to similar globally produced products. Figure 6 compares three different station networks from Senegal. The data from the few synoptic station networks are shared with the world everyday through the WMO's Global Telecommunication System (GTS). These are the stations used in most of the global merged station-satellite products, which means they form the backbone of data available to decision makers. Some or all of the stations from the climate network are used in gridded products such as those from the Global Precipitation Climatology Center (GPCC, Becker et al., 2013). The ENACTS product uses all the stations in Figure 6, which are about 100.
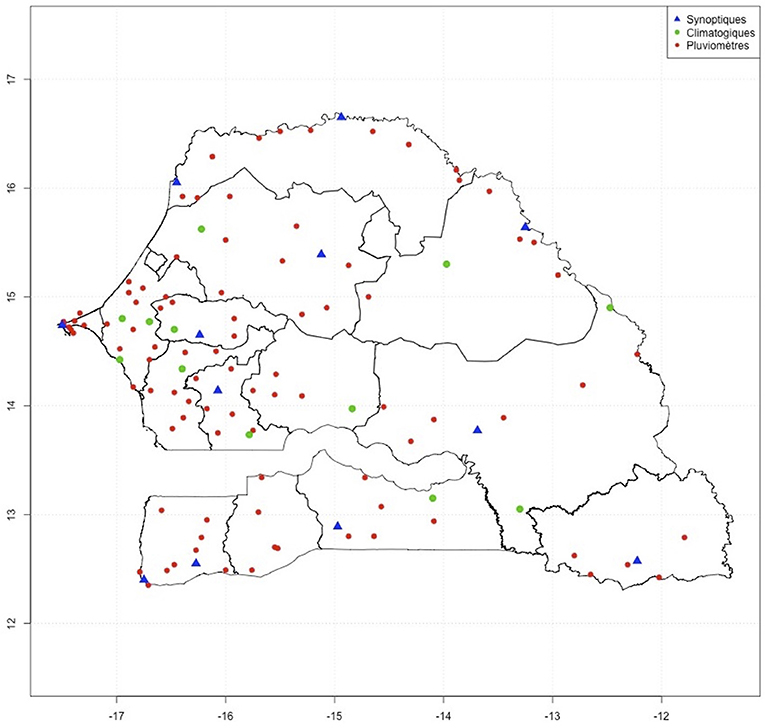
Figure 6. Different classes of meteorological stations over Senegal: synoptic (blue), climate (green), and raingauge only (red).
Enhancing access to climate data and information products involves developing online mapping services (Maprooms) that provide user-friendly tools for the analysis, visualization, and download of climate information products, as well as basic explanations of main climate phenomena (Nsengiyumva et al., 2021). This process starts with the customization and installation of the IRI DL tool at NMHS. The DL is a powerful tool that facilitates access to a number of climate datasets, and enables analyses, visualization, and download of data and results in a variety of commonly used data formats (Blumenthal et al., 2014). The climate data developed in Section Improve the Availability and Quality of Climate Data above and the DL are then used to create automated interactive tools for data analysis and display. These tools are called “Maprooms” because the main displays are maps; however, the visualizations also include different graphs and tables.
Critical for sustainability and scale-up, the NMHS are trained on installation and management of the DL, as well as development and maintenance of the Maprooms. The trainees are shown all the steps needed to install the DL while it is installed on their computers.
Maproom training requires two steps: The first step is to train NMHS staff on how to navigate the DL Internet interface. This training is given to potential users for simple navigation of the DL, but can also be scaled to include more advanced training which introduces users to the programming language, which affords them the ability to perform data analysis and disseminate the information generated by such analysis. The second stem would be to train NMHS staff on how to use the DL to develop climate information products (maprooms).
The current version of the Maproom includes three “generic” Climate Maprooms as well as three application-specific Maprooms (Figure 7). However, different countries may develop a different number of products depending on needs or availability of funds. The Climate Maprooms include Climate Analysis, Climate Monitoring, and Climate Forecast.
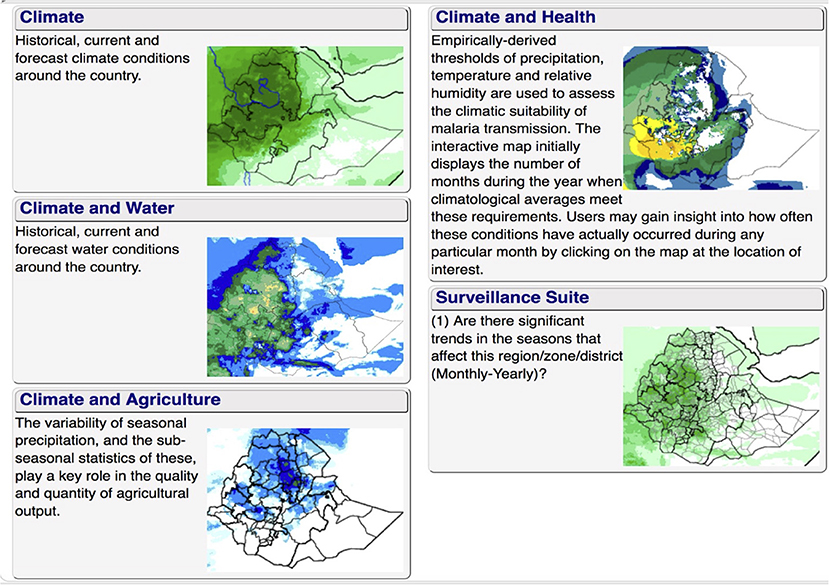
Figure 7. The current version of ENACTS maprooms for one of the advanced ENACTS countries.
The Climate Analysis Maproom (Figure 8) provides information on the past climate (in terms of rainfall and temperature) at any point or at national or sub-national levels. Products in this Maproom include the following:
- Daily statistics (mean intensity, number wet/dry dais, probability dry/wet spells, and more);
- Monthly climatology and seasonality,
- Seasonal climatology, trends, and probability of extremes;
- El Nino Southern Oscillation/Indian Ocean Dipole (ENSO/IOD) analysis.
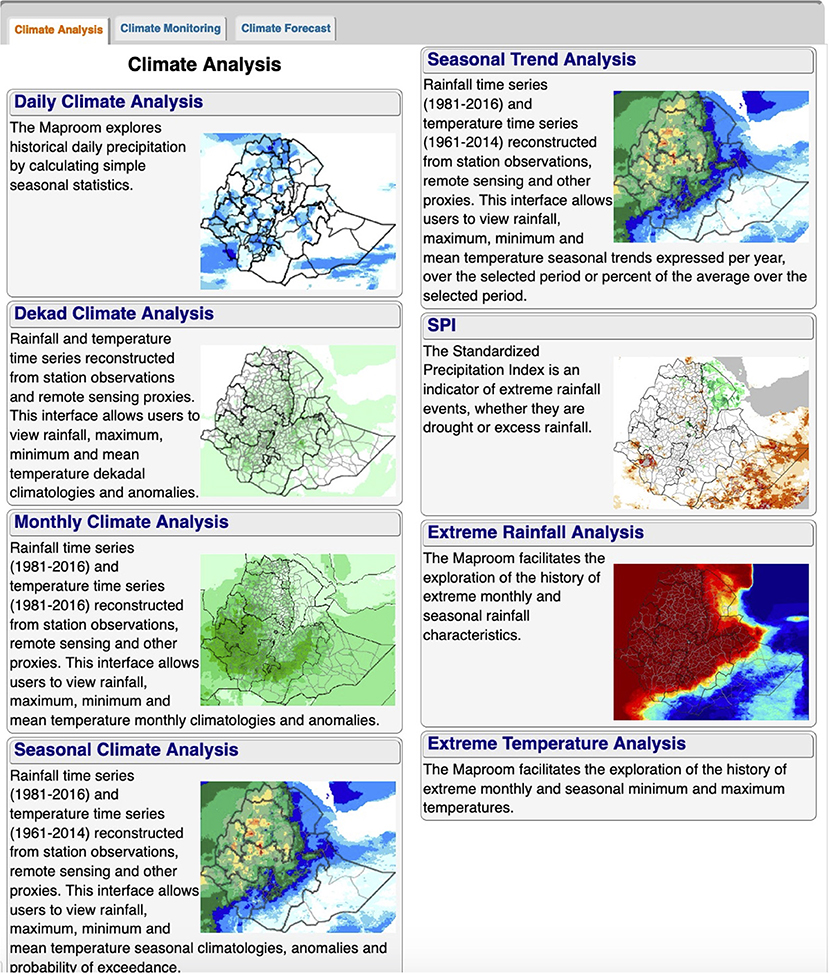
Figure 8. Different products in the Climate Analysis Maproom.
The ENSO and IOD product offers analysis of the impact that different ENSO and IOD phases would have over different parts of the country or region.
The Climate Monitoring Maproom enables monitoring of the current season. Different maps and graphs compare the current season with the expected or with recent years. This information can be extracted at any point or for any administrative boundary. The capability to extract and present summary information for any administrative level enables a user to focus on a specific area of interest.
The Climate Forecast Maproom translates the seasonal forecasts to flexible information that can be easily understood by users. It has thus been dubbed the “Flexible Seasonal Forecast Maproom.” Here it should be noted that this Maproom does not actually generate forecasts. It just presents forecasts generated by the country in a more decision-relevant format, The Flexible Forecast Maproom has transformed how seasonal rainfall forecasts are presented. Instead of the usual terciles (below normal, normal, above normal) presentation, the new forecast Maproom allows users to choose a threshold in which they are interested either as percentiles or rainfall amounts. For instance, one can explore the probability that the total rainfall for the coming season will be above or below a given amount (Figure 9). The forecasts are also provided at each 4 or 5 km grid, making the forecast locally relevant (Figure 10).
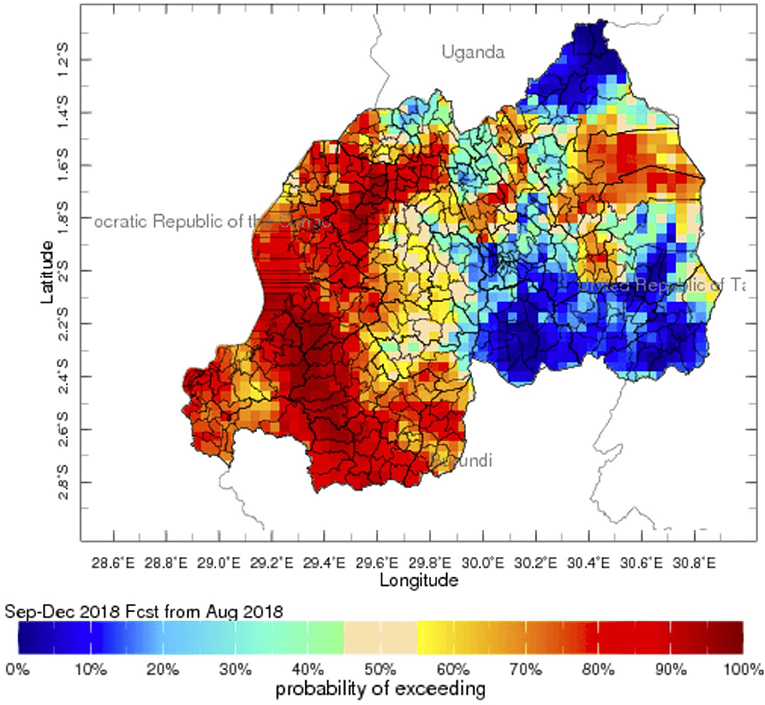
Figure 9. The Flexible Forecast Maproom showing the probability of receiving over 500 mm of rainfall during the forecasted season (Sep–Dec in this case).
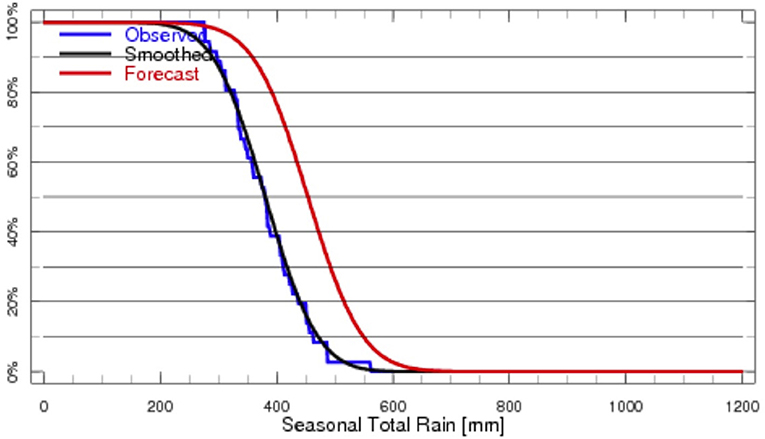
Figure 10. Drilling down to a specific location: the probability that next season's rainfall total will exceed a range of values (exceedance probability), comparing the forecasted (red) with what is normally expected for that location (blue).
The application-specific Maprooms currently include the Climate and Agriculture, Climate and Water, and Climate and Health Maprooms (Figure 7). These Maprooms have been developed/improved through a co-production process with sectoral experts at IRI as well as relevant in-country stakeholders.
The Climate and Agriculture Maproom provides climate information that is important for agricultural activities. This includes dry spell frequencies that influence the soil water balance, onset and duration of the growing season, and growing degree-days that influence the timing of crop maturity. The Climate and Water Maproom provides climate information (past, monitoring, and forecast) at the watershed and sub-watershed level. This would be very useful for water resources assessment, risk analysis, and monitoring. The current version of the Climate and Health Maproom enables one to analyze the impact of different climate variables on malaria occurrence. Empirically-derived thresholds of rainfall, temperature, and humidity are used to assess the climatic suitability of malaria transmission. The interactive map initially displays the number of months during the year when climatological averages meet these requirements. Users may gain insight into how often these conditions have actually occurred during any particular month by clicking on the map at the location of interest.
All of these aforementioned Maprooms are integrated directly into the NMHS web pages for each country. The “uptime” of these sites is monitored to help identify constraints to continuous delivery of climate information (most commonly down time is associated with interrupted energy supply to the server). An analytical capability has also been established at the NMHS so that they can better understand the traffic to their Maprooms, learn from their users and respond accordingly.
The above Maprooms are just a few examples of what can be done with the data and the DL tools. The main limitations to what could be generated are mastery of the tool and understanding what users need. Thus, there is much potential to develop additional products to help meet various user needs. Enhancing National Climate Services efforts include training the staff of the NMHS in the creation of Maprooms so they can develop further information products to satisfy user-specific needs.
While generating climate information products and making them available online makes it easier for people to access these information products, it may not necessarily lead to uptake and use. To bridge the gap between information access and use, potential users need to be made aware of these products, their value, and their applications. At a minimum, people (ranging from policymakers to technical experts, students, and members of the public) need to be aware of current ENACTS products and services and potential future services. Awareness is important for those who may positively (or negatively) influence the enabling environment for ENACTS uptake, funding, and institutional support. Awareness may also engage potential users of ENACTS products and services. In particular, widespread awareness may allow a broad community of “autonomous users” to be created at no additional cost to the NMHS in terms of time and resources, and ENACTS Maproom services have the potential to inform a very wide user base. Creating awareness of the work going on through the ENACTS initiatives will help the “word of mouth”-type dissemination, as well as build an identity and profile for the NMHS within a broad stakeholder community. In this respect, one component of ENACTS implementation is a 1-day “ENACTS launch” workshop to introduce the new ENACTS data and products to stakeholders, including policy and decision makers, experts from different sectors, academia, media, etc.
Users also need to be trained on how to navigate the products, understand them, and ultimately use them. There is a very high number of people with the potential to utilize the ENACTS data and information products. Thus, supporting the NMHS in various countries to train their users has been another important component of the ENACTS approach to date. This is usually done by holding workshops for the training of trainers (ToT), and then teaching them how to navigate and use the Maprooms so they may train others to do the same. However, this component has not been as strong as it should be because the trainings typically require significant time and resource commitments in institutional environments where NMHS manpower and funding is already spread thin.
It is also important to engage users in co-development of information products that would serve and be tailored to their specific needs. Enhancing National Climate Services promotes the use of climate information by encouraging, and sometimes supporting, the NMHS to engage and collaborate with users. This includes engaging with policy makers, humanitarians, or development practitioners to discuss climate impacts on their activities and building their capacity to understand basic climate science. It also requires identifying what information they need based on the constraints, needs, and limitations in their own field. It is important to maintain constant dialogue and iterative interactions with different user groups.
The ENACTS data and product are being used for enhancing climate services in the different countries. The level of use varies widely among the different countries. The reasons for these differences include availability of following up activities (projects) after first implementation, the strength of the NMHS and its understanding of ENACTS, awareness of sectoral users about ENACTS, and the relationship between NMHS and users. Two examples are presented here. The first is Rwanda with focus on a specific application, and the second is Ethiopia where ENACTS has been supporting climate more systematically.
In Rwanda, a USAID-funded Rwanda Climate Services for Agriculture project (https://ccafs.cgiar.org/research/projects/building-climate-services-capacity-rwanda) worked with the country's national agricultural extension service to scale up the delivery of climate services using the Participatory Integrated Climate Services (PICSA). Participatory Integrated Climate Service is an approach designed to help agricultural extensionists work with farmers to make climate-informed decisions in their agricultural planning with the use of participatory tools to aid their decision making (Walker Institute, 2018). This is accomplished by combining the use of timely location-specific historical climate information with participatory decision-making tools that help farmers make decisions that fit their local and individual contexts. Through the PICSA approach, agricultural extension staff, non-governmental development agents as well as other intermediaries in Rwanda were trained to integrate climate services into their ongoing work with farming communities across Rwanda's 30 districts (Clarkson et al., 2017; Hansen et al., 2019a; Birachi et al., 2020). This is made possible because ENACTS ensures availability of spatially complete (available 4 km across Rwanda) historical climate data, which enables implementation of PICSA at any location. Location-specific historical climate information produces (graphs) allow those in the agriculture sector to visualize things like frequency of wet and dry events as well as the onset and duration of the rainy season, while downscaled seasonal rainfall forecasts at high resolution also provide locally-relevant information to facilitate agricultural planning. On the other hand, the expanded suite of ENACTS Maproom products (Nsengiyumva et al., 2021) support PICSA requirements for providing climate information (as graphs) to farming communities The ENACTS Maprooms provide an efficient way for the trained intermediaries to access location-specific data and graphs as they work with farmers and other local decision makers within the PICSA process. The Rwanda Climate Services for Agriculture project was won the “Climate-Smart Agriculture Project of the Year Award 2018” (http://www.aidforum.org/Topics/health-and-wash/rwanda-climate-services-for-agriculture-wins-project-of-the-year-award/).
Ethiopia was the first country to implement ENACTS and it is also where ENACTS has been exploited the most. This has been accomplished through a number of following up projects that included engagement with the user community. One of these projects is ACToday (Adapting Agriculture to Climate Today for Tomorrow), which aims to develop climate service solutions through enhancement of the availability and effectiveness of climate information in national policy, planning, management, and other decision-making processes (Pattni and Ward, 2018; Goddard et al., 2020). This project, being implemented in Ethiopia and five other countries (IRI, 2020), has as a goal improving food security, nutrition, environmental sustainability, and economic outcomes. Adapting Agriculture to Climate Today for Tomorrow promotes the use of climate information and services to manage current climate risks while laying the grounds for adopting to the changing climatic conditions.
Adapting Agriculture to Climate Today for Tomorrow-Ethiopia works to strengthen the four pillars of climate services (Generation, Translation, Transfer, and Use; Goddard et al., 2020) by working with the most relevant institutions. The main institution for the “generation” of climate information is the National Meteorological Agency (NMA). Generation, Translation, Transfer has been strengthening NMA's capacity mainly around data and products and improving seasonal and sub-seasonal forecasts. The outputs from NMA are inputs into activities undertaken by the Ethiopian Institute Agricultural Research (EIAR), which plays the role of “translation” and “transfer.” Adapting Agriculture to Climate Today support to EIAR includes ENACTS maproom products, development decision support systems and of an agro-weather advisory system. Products and tools from EIAR will is used by the Ministry of Agriculture (MoA) at different levels (from the minister all the way to the farmers) for climate risk management. Disaster, mainly in the form of droughts, has been a major challenge to food security and development in Ethiopia. Thus, ACToday is also supporting disaster risk management by working with the relevant institutions, which include the National Disaster Risk Management Commission (NDRMC) with effective use of climate information for early warning and action, and working with the Word Food Program (WFP) on index insurance and Forecast-based Financing.
All these efforts would be in vain if users do not understand and use climate information. Thus, an important component of ACToday has been the development and piloting of a skilled-based modular training course on Climate Risk Management at different levels in collaboration with MoA, EIAR, and NMA. These curricula include graduate-certificate at university level, a semester course for students attending vocational training, 2-week professional development training for district agricultural experts and extension officers, and PICSA for extension officers and farmers. These capacity building activities are designed in such a way to strengthen and reinforce capacities, and maximize synergies amongst different decision-makers and institutions. Those trained in climate risk management at the university level, for example, may go on to work within the extension system as subject matter specialists guiding the development agents who work most closely with farmers at the local level.
Agriculture to Climate Today-Ethiopia has also been supporting the implementation of the NFCS in Ethiopia. This is an institutional mechanism to coordinate, facilitate, and strengthen collaboration among national institutions to improve the co-production, tailoring, delivery, and use of science-based climate predictions and services (WMO, 2018). This is accomplished by focusing on the five pillars of the GFCS (WMO, 2014). This would be a very important planform/process for developing strategies to foster the access and use of climate knowledge and services by national and/or international organizations. Supporting this process will ensure that the achievements of ENACTS and ACToday are sustainably embedded in national-level processes.
Enhancing National Climate Services has been demonstrated to be an effective approach to transforming national climate services. The ENACTS products have generated a great deal of interest in the meteorological, humanitarian, and development communities. However, there is still room for further improvement of the different components of ENACTS. This means a lot of work is still needed to strengthen ENACTS where it has already been implemented, as well as in future implementation countries. The countries in which it is currently implemented represent only a fraction of Africa. The initiative would thus need to expand to the rest of the continent, and beyond. Finally, there is also a need to ensure the sustainability of ENACTS. These three areas are further discussed below.
Strengthening ENACTS in the countries where it has already been implemented will entail:
• Increasing the number of climate variables used: Variables such as relative humidity, evapotranspiration, and sunshine hours are all important for applications such as agriculture, water resource management, and renewable energy. Integrating them into ENACTS would empower those seeking to improve yields while managing scarce resources.
• Developing more climate information products: The current Maprooms include both generic climate products, as well as some sector-specific products for the health, agriculture, water, and disaster risk management sectors. At climate product level, there have been request for analysis of climate change projections. Climate change projections have not been the focus ENACTS, but this will change going forward. There are already a couple of ENACTS Maprooms that include some climate change products, but these were not developed by IRI (see section Expanding ENACTS below) On the other hand, beyond contextualizing ENACTS on a sectoral level, users have been asking for more products relevant to the specific decisions they have to make. In addition, the health and water Maprooms have limited products. Thus, more work is needed to add more products. Some of these will require incorporating new climate variables such as those described above. There have also been requests from other sectors, such as aquaculture and energy for sectoral-specific products. Thus, in addition to developing more decision-relevant products, there is also a need to expand to other sectors.
• Creating decision support systems for specific decision-making processes: Creating specific decision support tools for decision-makers would allow for more efficient management of a number of processes, services, and programs, including hydropower dams, improved and expanded crop yield forecasting, malaria monitoring, and early warning systems.
• Promoting effective use of climate data and information products: The return on investment of ENACTS data and its products can only be realized through its effective use. Efforts are being made to promote the use of ENACTS. However, this is still the area most in need of further development within the ENACTS approach. Initial plans depended on the NMHS themselves promoting the use of ENACTS. However, it has become clear that many NHMS are not able to do so quickly enough. The main challenge has been the fact that the ENACTS approach is new to the NMHS themselves who are used to providing only limited climate information products such as weather and seasonal forecasts. Thus, the ENACTS approach must be reshaped to involve sectoral experts, as well as other relevant actors in its use and promotion. This has already started in some countries through the aforementioned ToT sessions, but it is still very limited. Implementation of the NFCS could be an opportunity for expanding the use of ENACTS products. The co-development of services with users (involvement of the different stakeholders in the development of the products) will contribute to the endorsement and wider use of ENACTS products.
• Targeting high-impact decision-makers with capacity building: While ENACTS Maprooms have been used as a climate tool by NMHS for many years, use of such Maprooms remains limited amongst development and humanitarian organizations, despite the high potential for impact amongst decision-makers in this space. In Ethiopia, for example, where ENACTS was first launched and the NMA has been implementing the approach for almost 9 years as it rippled across more than a dozen countries in Africa, use of the tool still remains limited. Especially in sectors related to disaster risk reduction and management (DRR/M) where there is a high potential for use of ENACTS tools and approaches (such as Maprooms) in saving lives, promoting food and nutrition security, and managing multi-hazard risks inclusive of climate, awareness of the initiative, and its services is low. Targeted capacity building and sensitization on the ENACTS approach is therefore necessary to realize its full potential.
Most African countries, if not all, will greatly benefit from the innovative approach of ENACTS. By its nature, ENACTS can lay the foundation for the NFCS, which some countries have already started implementing. However, so far only 16 countries have benefited from ENACTS at a national level (though there some more covered at regional level implementation). There is clearly still room for expansion. While the efforts of the IRI, NMHS, and development partners offer a strong practical example of climate services development in Africa, substantial funding and collaboration with national, regional, and global organizations will be needed to expand ENACTS across the continent. There are many potential opportunities for synergy among current initiatives including the NFCS process, RCC, African Meteorological Conference on Meteorology (AMCOMET), GFCS, UNDP, World Bank efforts, and others. All could benefit greatly from better basic information for their evidence-based priority setting and evaluation processes. Enhancing National Climate Services aligns tightly with AMCOMET objectives (AMCOMET, 2015), the five pillars of the GFCS (WMO, 2014), and World Bank and UNDP investments in strengthening NMHS.
The expansion could be made cost-effective and efficient by building technical capacity within the continent. An approach ENACTS has adapted to ensure cost-effectiveness is building ENACTS–related expertise at the RCC in Africa. This is accomplished by training and working with regional and continental climate institutions. This has already started at the IGAD Climate Prediction and Application Center (ICPAC) in East Africa and, and at the Agrometeorology, Hydrology and Meteorology (AGRHYMET) Regional Center in West Africa. IGAD Climate Prediction and Application Center has already started developing Maprooms, and providing training and technical support for ENACTS countries in the region. IGAD Climate Prediction and Application Center has even implemented ENACTS in some countries in the region with Maprooms that include climate change projections.
Enhancing National Climate Services is not a one-time project. It is an ongoing process that enhances climate services incrementally and continuously. The existing ENACTS countries need to be supported to make the best use of the existing ENACTS platforms as it expands to other countries. At the same time, ENACTS data and climate information products will keep improving and expanding based on user requirements. Thus, the NMHS may need sustained support to continue providing the ENACTS-generated products and also to add new ones and engage their users. This would be a daunting task for one institution alone and can only be achieved and sustained through broad partnership. As mentioned earlier, ENACTS attempts to ensure sustainability and cost-effectiveness by building ENACTS-related expertise at the RCC in Africa. The ultimate goal is to transfer all operational ENACTS activities to RCC and limit ENACTS team's role to technical support to the regional centers, developing and refining tools and products, supporting innovations, and facilitating engagements with users.
Building resilience against the negative effects of climate variability and change requires reliable climate data and information products. Climate services can provide climate information to help decision-makers, including those at the highest levels (such as policymakers or government officials) all the way down to those at the grassroots levels (such as farmers or pastoralists), manage current climate extremes, and adapt to the changing climate. Climate data is the foundation for any climate services. However, lack of available climate data and information products has posed serious challenges to the use of climate information and services in Africa and many other parts of the world. The ENACTS initiative is designed to alleviate these problems by enabling the integration of climate information in national and local decision-making processes through the improvements in the availability, access, and use of climate data and information products. The main strengths of ENACTS include the following:
• It creates high-resolution and reliable climate data by directly working with NMHS. Working with NMHS is critical because it provides access to climate observations that are not available elsewhere. This will also help in building trust and ensuring sustainability.
• Worked with sectoral experts to develop climate information products that are relevant to different sectors and make them available online. This has helped create a web portal (Maprooms) with rich and dynamic climate information products that are not available anywhere else.
• Build the capacity of NMHS staff to generate the required climate information products and the capacity of users to understand and apply those products.
The main weakness of ENACTS has been effective exploitation of the developed products.
While it was initially hoped that the NHMS would be able to lead on promotion of climate information products, in reality, progress has been slow due to inertia surrounding long-standing norm of NMHS only providing limited products such as weather and seasonal forecasts.
Though efforts have been made to train NMHS staff and sectoral experts on how to navigate, understand, and use the maprooms, it has been found not to be sufficient. The other challenge is that this component requires more resources and time. Addressing this challenge requires evolving the approach to involve more sectoral experts besides the NMHS in the promotion of ENACTS. This will broaden the conversation and support national and international dialogue and momentum for the incorporation of effective climate services in all corners and sectors affected by climate.
Since its launch in Ethiopia in 2012, ENACTS has been implemented at the national level in 16 countries, as well as at the broader regional level in East and West Africa. Over that time, ENACTS has proven to be effective in strengthening climate services at the national level. However, more work is needed to strengthen ENACTS where it has already been implemented, expand it to other countries in Africa and elsewhere. Strengthening ENACTS will involve expanding several different aspects of the initiative, including adding g more climate variables, such as humidity and daily hours of sunshine. Finally, the area most in need of development is the expansion of ENACTS data and information products into new geographies and sectors. While the efforts of the IRI, NMHS, and development partners offer a strong practical example of climate services development in Africa, substantial funding and collaboration with national, regional, and global organizations will be needed to expand ENACTS across Africa, and beyond. The strengthening and expansion can be made cost effective and more sustainable by building technical capacity within the continent. This has already started at the IGAD ICPAC in East Africa and at the AGRHYMET Regional Center in West Africa.
The original contributions presented in the study are included in the article/supplementary material, further inquiries can be directed to the corresponding author.
TD: lead the team. RF: CDT development and training. RC and AV: Maproom development and training. IK: data library installation and training. JH: Maproom development and user engagement advisor. AG: coordinator and manuscript editor. All authors contributed to the article and approved the submitted version.
The authors declare that the research was conducted in the absence of any commercial or financial relationships that could be construed as a potential conflict of interest.
All claims expressed in this article are solely those of the authors and do not necessarily represent those of their affiliated organizations, or those of the publisher, the editors and the reviewers. Any product that may be evaluated in this article, or claim that may be made by its manufacturer, is not guaranteed or endorsed by the publisher.
This work is undertaken as part of the Columbia World Project, ACToday, Columbia University in the City of New York. We would also like to thank the reviewers for their valuable contribution towards the improvement of the manuscript.
African Development Bank. (2019). “Climate change in Africa,” in African Development Bank - Building Today, A Better Africa Tomorrow. African Development Bank Group. Available online at: https://www.afdb.org/en/cop25/climate-change-africa (accessed December 7, 2021).
AMCOMET. (2015). Integrated African Strategy on Meteorology. Geneva: World Meteorological Organization.
Becker, A., Finger, P., Meyer-Christoffer, A., Rudolf, B., Schamm, K., Schneider, U., et al. (2013). A description of the global land-surface precipitation data products of the Global Precipitation Climatology Centre with sample applications including centennial (trend) analysis from 1901–present. Earth Syst. Sci. Data 5, 71–99. doi: 10.5194/essd-5-71-2013
Birachi, E., Hansen, J., Radeny, M., Mutua, M., Mbugua, M. W., Munyangeri, Y., et al. (2020). Rwanda Climate Services for Agriculture: Evaluation of Farmers' Awareness, Use and Impacts. CCAFS Working Paper no. 304. Wageningen: CGIAR Research Program on Climate Change, Agriculture and Food Security (CCAFS). Available online at: https://ccafs.cgiar.org/resources/publications/rwanda-climate-services-agriculture-evaluation-farmers-awareness-use (accessed November 24, 2021).
Blumenthal, M. B., Bell, M., Del Corral, J., Cousin, R., and Khomyakov, I. (2014). IRI data library: enhancing accessibility of climate knowledge: the International Research Institute for Climate and Society: shaping the landscape of climate services. Earth Perspect. 1, 19. doi: 10.1186/2194-6434-1-19
Bremer, S., Wardekker, A., Dessai, S., Sobolowski, S., Saattelid, R., and Sluijs, J. (2019). Toward a multi-faceted conception of co-production of climate services. Clim. Serv. 13, 42–50. doi: 10.1016/j.cliser.2019.01.003
Buontempo, C., Hanlon, H. M., Bruno Soares, M., Christel, I., Soubeyroux, J.-M., Viel, C., et al. (2018). What have we learnt from EUPORIAS climate service prototypes? Clim. Serv. 9, 21–32. doi: 10.1016/j.cliser.2017.06.003
Buontempo, C., and Hewitt, C. (2018). EUPORIAS and the development of climate services. Clim. Serv. 9, 1–4. doi: 10.1016/j.cliser.2017.06.011
Burton, I., Huq, S., Lim, B., Pilifosova, O., and Schipper, E. L. (2002). From impacts assessment to adaptation priorities: the shaping of adaptation policy. Clim. Policy 2, 145–159. doi: 10.1016/S1469-3062(02)00038-4
Christel, I., Hemment, D., Bojovic, D., Cucchietti, F., Calvo, L., Stefaner, M., et al. (2018). Introducing design in the development of effective climate services. Clim. Serv. 9, 111–121. doi: 10.1016/j.cliser.2017.06.002
Clarkson, G., Dorward, P., Kagobo, D., Nsengiyumva, G., Kagabo, D. M., Nsengiyumva, G., et al. (2017). Climate Services for Agriculture in Rwanda Initial Findings From PICSA Monitoring and Evaluation. CCAFS Info Note. Wageningen: CCAFS. Available online at: https://hdl.handle.net/10568/89122 (accessed November 21, 2021).
Clifford, K. R., Travis, W. R., and Nordgren, L. T. (2020). A climate knowledges approach to climate services. Clim. Serv. 18, 100155. doi: 10.1016/j.cliser.2020.100155
Climate Services Partnership. (2011). What are Climate Services? http://www.climate-services.org/about-us/what-are-climate-services/ (accessed September 17, 2021).
Conway, D., and Vincent, K. (2021). Climate Risk in Africa: Adaptation and Resilience. Cham: Springer Nature.
Cooper, P. J. M., Dimes, J., Rao, K. P. C., Shapiro, B., Shiferaw, B., and Twomlo, S. (2008). Coping better with current climatic variability in the rain-fed farming systems of sub-Saharan Africa: an essential first step in adapting to future climate change? Agric. Ecosyst. Environ. 126, 24–35. doi: 10.1016/j.agee.2008.01.007
Daron, J. D., Lorenz, S., Wolski, P., Blamey, R. C., and Jack, C. (2015). Interpreting climate data visualisations to inform adaptation decisions. Clim. Risk Manage. 10, 17–26. doi: 10.1016/j.crm.2015.06.007
Dinku, T.. (2019). “Challenges with availability and quality of climate data in Africa,” in Extreme Hydrology and Climate Variability, eds A. M. Mellese, W. Abtew, and G. Senay, 429. (London, Newyork: Springer).
Dinku, T., Block, B., Sharoff, J., and Thmoson, M. (2014). Bridging critical gaps in climate services and applications in Africa. Earth Perspect. 1, 15. doi: 10.1186/2194-6434-1-15
Dinku, T., Thomson, M. C., Cousin, R., del Corral, J., Ceccato, P., Hansen, J., et al. (2018). Enhancing National Climate Services (ENACTS) for development in Africa. Clim. Dev. 10, 664–672. doi: 10.1080/17565529.2017.1405784
Funk, C., Peterson, P., Landsfeld, M., Pedreros, D., Verdin, J., Shukla, S., et al. (2015). The climate hazards group infrared precipitation with stations - a new environmental record for monitoring extremes. Sci. Data 2, 150066. doi: 10.1038/sdata.2015.66
Goddard, L., Romero, C. G., Muñoz, A. G., Acharya, N., Ahmed, S., Baethgen, W., et al. (2020). Climate services ecosystems in times of COVID-19. World Meteorol. Organ. Bull. 69, 39–46.
Hansen, J., Furlow, J., Goddard, L., Nissan, H., Vaughan, C., Rose, A., et al. (2019b). Scaling Climate Services to Enable Effective Adaptation Action. Rotterdam; Washington, DC. Available online at: www.gca.org
Hansen, J. W., Mason, S. J., Sun, L., and Tall, A. (2011). Review of seasonal climate forecasting for agriculture in sub-Saharan Africa. Exp. Agric. 47, 205–240. doi: 10.1017/S0014479710000876
Hansen, J. W., Vaughan, C., Kagabo, D. M., Dinku, T., Carr, E. R., Körner, J., et al. (2019a). Climate services can support African farmers' context-specific adaptation needs at scale. Front. Sustain. Food Syst. 3, 21. doi: 10.3389/fsufs.2019.00021
Hansen, J. W., Zebiak, S., and Coffey, K. (2014). Shaping global agendas on climate risk management and climate services: an IRI perspective. Earth Perspect. 1, 13. doi: 10.1186/2194-6434-1-13
Harold, J., Lorenzoni, I., Shipley, T. F., and Coventry, K. R. (2016). Cognitive and psychological science insights to improve climate change data visualization. Nat. Clim. Change 6, 1080–1089. doi: 10.1038/nclimate3162
Hewitt, C., Mason, S., and Walland, D. (2012). The Global Framework For Climate Services. Nat. Clim. Change 2, 831–832. doi: 10.1038/nclimate1745
IRI (2020). Adapting Agriculture to Climate Today, for Tomorrow (ACToday). Available online at: https://iri.columbia.edu/actoday/ (accessed November 24, 2021).
Kobayashi, S., Ota, Y., Harda, Y., Ebita, A., Moriya, M., Onda, H., et al. (2015). The JRA-55 reanalysis: general specifications and basic characteristics. J. Met. Soc. Jap. 93, 5–48. doi: 10.2151/jmsj.2015-001
Kruk, M. C., Parker, B., Marra, J. J., Werner, K., Heim, R., Vose, R., et al. (2017). Engaging with users of climate information and the coproduction of knowledge. Weather Clim. Soc. 9, 839–849. doi: 10.1175/WCAS-D-16-0127.1
Maidment, R. I., Grimes, D. I. F., Allan, R. O., Tarnavsky, E., Stringer, M., Hewison, T., et al. (2014). The 30 year TAMSAT African Rainfall Climatology and Time series (TARCAT) dataset. J. Geophys. Res. 119, 619–10, 644. doi: 10.1002/2014JD021927
Meadow, A. M., Ferguson, D. B., Guido, Z., Horangic, A., Owen, G., and Wall, T. (2015). Moving toward the deliberate coproduction of climate science knowledge. Weather Clim. Soc. 7, 179–191. doi: 10.1175/WCAS-D-14-00050.1
Nsengiyumva, G., Dinku, T., Cousin, R., Khomyakov, I., Vadillo, A., and Faniriantsoa, R. (2021). Transforming access to and use of climate information products derived from remote sensing and in situ observations. Remote Sens. 13, 4721. doi: 10.3390/rs13224721
Pattni, R., and Ward, K. (2018). Adapting Agriculture to Climate Today, for Tomorrow (ACToday) - Ethiopia. CCAFS Info Note. Wageningen: CGIAR Research Program on Climate Change, Agriculture and Food Security (CCAFS). Available online at: https://ccafs.cgiar.org/resources/publications/adapting-agriculture-climate-today-tomorrow-actoday-ethiopia (accessed November 24, 2021).
Sheffield, J., Wood, E. F., Chaney, N., Guan, K., Sadri, S., Yuan, X., et al. (2014). A drought monitoring and forecasting system for sub-saharan african water resources and food security. Bull. Am. Meteorol. Soc. 95, 861–888. doi: 10.1175/BAMS-D-12-00124.1
Stern, B. R. D., and Cooper, P. J. M. (2017). Assessing climate risks and climate change using rainfall data—a case study from Zambia. Exp. Agric. 47, 241–266. doi: 10.1017/S0014479711000081
Vaughan, C., and Dessai, S. (2014). Climate services for society: Origins, institutional arrangements, and design elements for an evaluation framework. WIREs Clim. Change 5, 587–603. doi: 10.1002/wcc.290
Vaughan, C., Dessai, S., and Hewitt, C. (2018). Surveying climate services: what can we learn from a bird's-eye view? Weather Clim. Soc. 10, 373–395. doi: 10.1175/WCAS-D-17-0030.1
Vincent, K., Archer, E., Henriksson, R., Pardoe, J., and Mittal, N. (2020). Reflections on a key component of co-producing climate services: defining climate metrics from user needs. Clim. Serv. 20, 100204. doi: 10.1016/j.cliser.2020.100204
Vincent, K., Daly, M., Scannell, C., and Leathes, B. (2018). What can climate services learn from theory and practice of co-production? Clim. Serv. 12, 48–58. doi: 10.1016/j.cliser.2018.11.001
Walker Institute. (2018). The Participatory Integrated Climate Services (PICSA). Available online at: http://www.walker.ac.uk/projects/participatory-integrated-climate-services-for-agriculture-picsa/ (accessed November 23, 2021).
Washington, R., Harrison, M., Conway, D., Black, E., Challinor, A., Grames, D., et al. (2006). Africa climate change: taking the short route. Bull. Am. Meteorol. Soc. 87, 1355–1366. doi: 10.1175/BAMS-87-10-1355
WMO (2018). Step-by-Step Guidelines for Establishing a National Framework for Climate Services. WMO No. 1206. World Meteorological Organization. Available online at: https://library.wmo.int/index.php?lvl=notice_displayandid=20216 (accessed Novemebr 24, 2021).
Keywords: ENACTS, climate services, climate data, data gaps, data quality, Africa, coproduction
Citation: Dinku T, Faniriantsoa R, Cousin R, Khomyakov I, Vadillo A, Hansen JW and Grossi A (2022) ENACTS: Advancing Climate Services Across Africa. Front. Clim. 3:787683. doi: 10.3389/fclim.2021.787683
Received: 01 October 2021; Accepted: 30 November 2021;
Published: 05 January 2022.
Edited by:
Joerg Helmschrot, Stellenbosch University, South AfricaReviewed by:
Gaby Sophie Langendijk, Climate Service Center Germany (GERICS), GermanyCopyright © 2022 Dinku, Faniriantsoa, Cousin, Khomyakov, Vadillo, Hansen and Grossi. This is an open-access article distributed under the terms of the Creative Commons Attribution License (CC BY). The use, distribution or reproduction in other forums is permitted, provided the original author(s) and the copyright owner(s) are credited and that the original publication in this journal is cited, in accordance with accepted academic practice. No use, distribution or reproduction is permitted which does not comply with these terms.
*Correspondence: Tufa Dinku, dHVmYUBpcmkuY29sdW1iaWEuZWR1
Disclaimer: All claims expressed in this article are solely those of the authors and do not necessarily represent those of their affiliated organizations, or those of the publisher, the editors and the reviewers. Any product that may be evaluated in this article or claim that may be made by its manufacturer is not guaranteed or endorsed by the publisher.
Research integrity at Frontiers
Learn more about the work of our research integrity team to safeguard the quality of each article we publish.