
94% of researchers rate our articles as excellent or good
Learn more about the work of our research integrity team to safeguard the quality of each article we publish.
Find out more
ORIGINAL RESEARCH article
Front. Clim. , 08 December 2021
Sec. Climate Services
Volume 3 - 2021 | https://doi.org/10.3389/fclim.2021.780879
This article is part of the Research Topic A Quest to Fully Understand Precipitation: Novel Methods to Characterize, Model, and Detect Precipitation Processes View all 6 articles
 Allison Goodwell*
 Ritzwi Chapagain
Both spatial and temporal information sources contribute to the predictability of precipitation occurrence at a given location. These sources, and the level of predictability they provide, are relevant to forecasting and understanding precipitation processes at different time scales. We use information theory-based measures to construct connected “chains of influence” of spatial extents and timescales of precipitation occurrence predictability across the continental U.S, based on gridded daily precipitation data. These regions can also be thought of as “footprints” or regions where precipitation states tend to be most synchronized. We compute these chains of precipitation influence for grid cells in the continental US, and study metrics regarding their lengths, extents, and curvature for different seasons. We find distinct geographic and seasonal patterns, particularly longer chain lengths during the summer that are indicative of larger spatial extents for storms. While synchronous, or instantaneous, relationships are strongest for grid cells in the same region, lagged relationships arise as chains reach areas farther from the original cell. While this study focuses on precipitation occurrence predictability given only information about precipitation, it could be extended to study spatial and temporal properties of other driving factors.
The generation and movement of precipitation across the continental U.S. varies seasonally and between individual events. Particularly, the same event never occurs twice when magnitudes, directions, spatial extents, and durations are considered. However, there is persistence, or patterns, in terms of typical timescales of storm events and directions of movement. This leads to an average predictability of precipitation at any location, based on some defined subset of driving factors. These driving factors range widely in timescales from long, such as decadal or longer climatic indices (Ting and Wang, 1997; Barlow et al., 2001; Carvalho, 2020), to short, such as moisture advection and precipitation recycling (Dominguez et al., 2006, 2008), or storm movement on sub-daily timescales (Hurrell and Deser, 2010; Seo et al., 2012; Gao and Fang, 2018). In this paper, we focus on the predictability of daily precipitation occurrence at a certain location, given information about precipitation occurrence at increasingly distant locations.
Historically, precipitation occurrence at a location has been modeled as a Markov chain or similar random process model (Gabriel and Neumann, 1961; Chin, 1977). These models capture the predictability of precipitation given the knowledge of past precipitation, either from a single day lag (first order) to multiple time lagged histories (higher order). More recent studies have studied precipitation occurrence or extremes from various perspectives involving spatial synchronization (Boers et al., 2014), predictability given lagged states (Goodwell and Kumar, 2019; Goodwell, 2020), spatial extents and directions of events (Mondal et al., 2020; Najibi et al., 2020), and durations of wet and dry periods (Roque-Malo and Kumar, 2017). Recently from a spatial perspective, Mondal et al. (2020) uses graph theory to study the directionality and structure of extreme summer precipitation events, and uses several directed network measures to determine spatial extents of instantaneous and lagged synchronization of events. Meanwhile, Najibi et al. (2020) uses measures of synchronization to explore the central locations, extents, and orientations of heavy rainfall events for different seasons across the continental U.S.
Instead of focusing on the actual spatial extent of a storm event, we consider the area from which precipitation predictability can generally be derived. We take an iterative approach, where we seek to characterize a typical region or path of influence for the precipitation state at a given “central” location. Specifically, we use information theory measures to determine a “maximally informative neighbor” for precipitation state at the central location, and use dominant neighboring relationships to define a directed and connected chain of grid cells. Our hypothesis is described by the following poem:
When it rains in one spot
it's more likely than not
that it's raining next door
during, after or before.
A chain with its links
shows the sources and sinks
of where information flows
or precipitation goes.
In other words, a precipitation “chain” or “footprint” for a given starting point will show the primary pathway from which predictability can be derived. This is not necessarily the pathway by which precipitation arrives at that point, or even the region most highly synchronized with that point, but should be similar as far as the knowledge of lagged precipitation is informative to current precipitation at a nearby location. This type of chain can be contrasted with precipitation recycling model frameworks (Dominguez et al., 2006, 2008), where paths of atmospheric moisture are traced from their entry into a study region to the location of precipitation using a Lagrangian approach. Instead of tracing individual moisture packets forward to a precipitation target cell, we start from a target cell, and consider a “typical” path from which precipitation at that grid cell is most predictable. Other key differences include the consideration of a “typical” or average path instead of a trajectory for any single event, and our focus on information flow rather than a physical flow of moisture. Relative to studies that attribute precipitation events to different causes or study multiple precipitation-related processes (Kunkel et al., 2012), we use a much more limited dataset that only consists of precipitation occurrence to make similar inferences about extents and directionalities of precipitation.
In this paper, we extend upon Goodwell and Kumar (2019), which evaluated precipitation persistence, or temporal patterns, using multivariate and conditional information measures. This study identified trends over time in both the probability of precipitation and the temporal ordering of precipitation, which diverged across the continental US. Goodwell (2020) studied the predictability of precipitation based on the knowledge of a combination of lagged neighboring states. Here we found dominant directions of precipitation predictability that generally corresponded with our current understanding of precipitation generation mechanisms and weather patterns. As in these studies, here we consider both large and small precipitation magnitudes together, and additionally consider all time points rather than only time points for which precipitation occurs. Therefore, this study can be thought of as looking at the predictability of both precipitation occurrence and non-occurrence.
To construct a precipitation predictability chain, we use information theory measures, which relate to uncertainties and reductions in uncertainties of random variables. Particularly, we use mutual information measures to detect instantaneous and lagged relationships between precipitation occurrence at neighboring and distant locations. We apply information theory measures to daily CPC gridded gauge-based precipitation data set (Xie et al., 2007; Chen et al., 2008) for the period from 1950 to 2019. While Goodwell and Kumar (2019) and Goodwell (2020) used similar measures to characterize precipitation persistence and predictability from the same data, here we employ an iterative approach to study precipitation relationships between increasingly distant geographic locations while minimizing the computational complexity that arises with an expanding search radius.
This study is organized as follows. In section 2, we describe the information theory methods and application to the dataset. In section 3, we present results over the continental U.S, including examples of individual chains and seasonal and geographic patterns in chain properties. In section 4, we provide a discussion in the context of existing studies, and discuss limitations and possible extensions of this approach.
Information theory (Shannon, 1948; Cover and Thomas, 2006) is based on Shannon Entropy, H(Xc,t) = −∑p(xc,t)log2p(xc,t), where Xc,t is a random variable, p indicates a probability distribution function, and the summation is over all possible states of xc,t. Here, the t index indicates a temporal aspect, particularly the current state, and c indicates a spatial index for the “central” cell. H(X) indicates the uncertainty of X, or the amount of information in bits that would be needed for a full prediction. Here, we consider X to be a time-series of binary daily precipitation occurrence at a given grid cell. For a grid cell where is it nearly always raining, or hardly ever raining, the entropy is very low. In other words, the state of precipitation occurrence on any given day is fairly “certain.” Maximum H(X) occurs for a sequence for which the probability of precipitation is 0.5. However, H(X) does not depend on the ordering of precipitation over time. In this paper, we focus on reductions in uncertainty of precipitation given the knowledge of instantaneous or lagged precipitation at neighboring grid cells. Previous studies have used information theory measures to study a range of lag times and multivariate dependencies to understand the persistence of precipitation, or the dominant direction of precipitation predictability when surrounding neighbors are considered. Meanwhile, here we characterize the spatial region of precipitation predictability by constructing a connected chain of grid cells that most significantly reduce the uncertainty in a chosen central cell.
We begin with precipitation occurrence at a selected central grid cell, or reference cell, Xc,1,t and identify its eight surrounding neighbors, as dset (Figure 1A). We then compute the mutual information between precipitation at the central cell and each of the eight neighboring cells as follows for a given Xd:
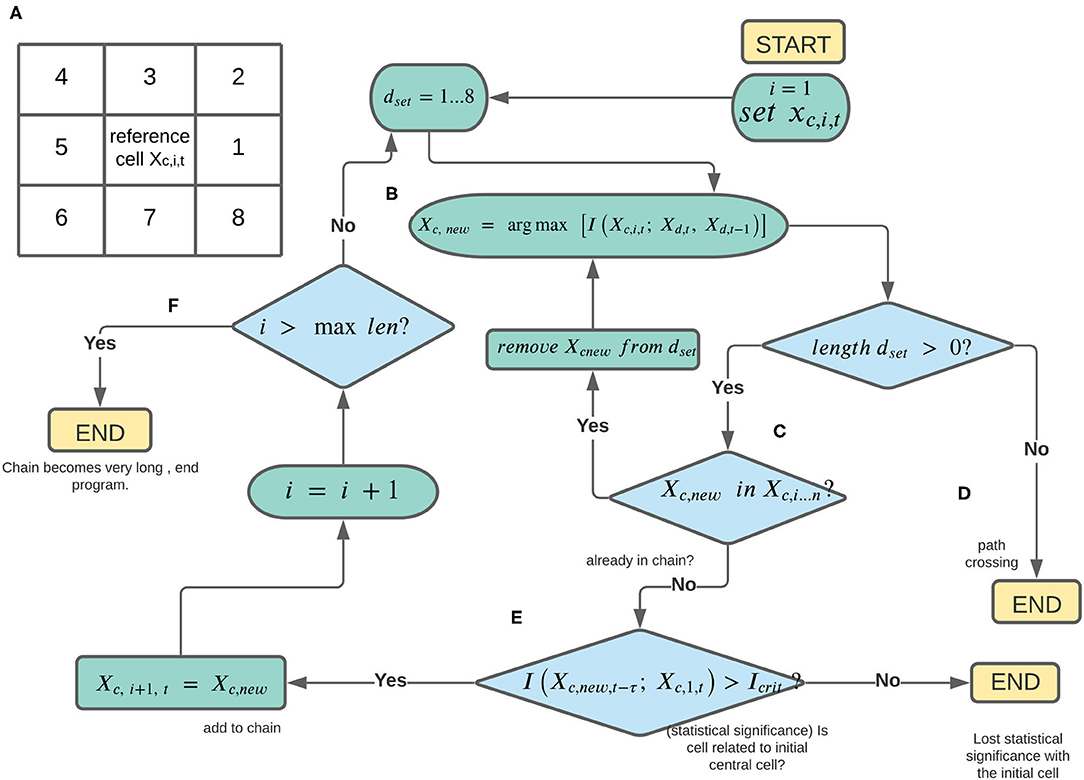
Figure 1. Diagram illustrating development of a precipitation chain of influence for a chosen reference grid cell. These steps (A–F) are further enumerated in the main text, section 2.
This is the total information from the current and lag-1 histories of each neighboring cell, and represents the information that the knowledge of both the current and lagged states of a neighboring cell provide about precipitation occurrence at the central cell (i = 1 for the original central cell). We pick the neighboring cell that leads to the maximum value of this term, and tentatively set it as the “new” central grid cell, adding it as the next link in the chain (Figure 1B) as follows:
Initially, dset = 1…8, indicating the possible neighboring cells relative to the central cell, c. The index i indicates the length of the chain in number of grid cells, which starts as i = 1, such that Xc,1,t is the “original” central cell. In general, we add Xc,new to the chain as the updated central grid cell (Xc,i+1,t), and determine which of its eight neighbors is most informative regarding its precipitation state, and so on. However, as the chain grows longer, there are several considerations, illustrated in the flowchart in Figure 1 and described below.
First, we do not want the chain to loop around to itself, resulting in an infinite loop. If the newly selected central grid cell leads to a path crossing such as this, we instead go back to the previous central cell and re-compute (Equation 2) with the other neighboring cells (Figure 1C). In other words, for a chain longer than one grid cell, if the determined Xd that defines Xc,new is already part of the chain, d is removed from dset and Equation 2 is re-evaluated in order to pick the next location d where precipitation occurrence is informative of the central cell. If dset becomes an empty set, this indicates that all surrounding grid cells for a central cell are already part of the chain, and the algorithm exits (Figure 1D). Otherwise, we iterate through the remaining neighboring cells until an Xc,new is determined that does not cause an overlap in the existing path.
The next checkpoint determines whether the newly added link provides statistically significant information to the original central grid cell. We test whether the mutual information between Xc,new and Xc,1,t is statistically significant at a time lag between 0 and 3 days as follows:
where τ = 0…3 days, and Icrit is a critical value of mutual information based on a shuffled surrogates method (Ruddell and Kumar, 2009), in which the source variables are shuffled in time to destroy correlations. In other words, we define a given information theory measure as statistically significant by comparing it to the distribution of measures based on randomized data. We do this 100 times to compute a distribution of shuffled information values, with a mean of Ishuff,mean and standard deviation of Ishuff,stdev. Icrit is then computed as follows:
If a given measure is not statistically significant at any time lag, in that the mutual information is less than the critical value, the chain is curtailed due to the lack of a clear relationship with the central cell. If it is statistically significant at any time lag, then Xc,new is added to the chain and set as the updated “central” cell (Figure 1E) and the number of links in the chain, i, is incremented.
Finally, if there is no path crossing and a statistically significant relationship between precipitation occurrences at the last link added and the central cell, we check whether the chain has attained some maximum length. We choose this length as 200 grid cells, which is nearly the gridded length (in longitude values) of the continental U.S. However, we find few cases were a precipitation chain moves in a single direction, as instead paths tend to curve around and fill the grid cells in a region closer to the original central cell. If a chain reaches 200 grid cells in length before losing statistical significance or hitting a “dead end,” the algorithm is curtailed (Figure 1F). In this setup, if the chain reaches a coastline or border, it is forced to move along the border or is cut off if there are no adjacent precipitation grid cells that have not already been added to the chain.
We apply this algorithm to the CPC gridded gauge-based precipitation data set (Xie et al., 2007; Chen et al., 2008) for the period from 1950 to 2019, for all grid cells in the continental U.S. that have at least 5 land neighbors. We exclude most coastal grid cells as their chains tend to be very short and the predictability of precipitation is largely influenced by a water body. We also find that grid cells in very dry areas, such as the Southwest, tend to have unresolved chains since the entropy of precipitation is very low and neighboring grid cells provide non-statistically significant information. We convert the precipitation magnitudes into precipitation occurrence using a 1 mm threshold to distinguish between “precipitation at time t” and “no precipitation at time t.” In other words, we convert the precipitation data into a binary dataset with p0 = 1 − p1, such that H(X) = −p0logp0 − p1logp1. While the threshold for precipitation could be increased to capture only heavier precipitation events, this generally leads to lower entropies as the number of “X = 1” days greatly decreases for a given location.
We calculate information theory measures for each season (DJF, MAM, JJA, SON) separately based on all the daily time points within a given season. For lagged measures, we cut off any lagged points that span from one year to the next. For example, we do not compare June 1 precipitation with that from the end of the previous August, but omit those points in our estimates of lagged probability distribution functions.
We summarize a precipitation chain emanating from a central location with several metrics. First the length of the chain in terms of the number of links, N, measures the extent of the area that is most highly predictive of precipitation at a given cell. For example, some chains may be curtailed after only a few links are added for reasons detailed in the previous subsection, mainly the loss of statistically significant relationships or a chain wrapping around itself or returning to the central location. Meanwhile, other chains contain up to 200 grid cells, which is our imposed limit on length. However, N does not provide any details regarding the distance covered by a chain. For this, we consider the coordinates of the central grid cell and the last location in the chain, and determine the distance between them in units of kilometers, D. Finally, we consider the relationship between N and D, particularly their ratio as a measure of curvature. The ratio of is small for a case where the chain is very “curvy” or overlaps such that there are many links but not a long distance between the starting and end points. Meanwhile, C is large for cases where the chain is more linear. In terms of precipitation occurrence, this differentiates between regions where precipitation is synchronous over a large area or comes from a variety of directions such that predictability is diffuse, vs. regions where storms tend to come from a single direction and predictability is more linear.
We compute these measures of N, D, and C separately for each season and each grid cell, and also compare dominant time lags of influence between grid cells in the chain and the original central cell. We find that for most cases, the 1-day lag and the current state are most informative for a central grid cell, but the influence from longer time lagged histories increases as the chain moves farther away from the original central cell.
Figure 2 shows the seasonal averages for chain distance from start to end point (D, km) and number of total links (N) for all grid cells. We find that on average, chains are longer in terms of both D and N in the summer (JJA) relative to other months. This behavior of longer precipitation chains in the summer indicates that in this season, precipitation occurrence at a location is more predictable at a larger distance. In other words, precipitation tends to be more synchronized at large spatial scales during the summer. However, the variability in lengths and distances is high in every season. While spring (MAM) shows the shortest chains in terms of D, this is not the case for N, indicating there are locations with more chain links but shorter distance from start to end in the spring, or a more curly average chain. Average distances are between 600 and 800 km, and average numbers of links are between 70 and 90 grid cells.
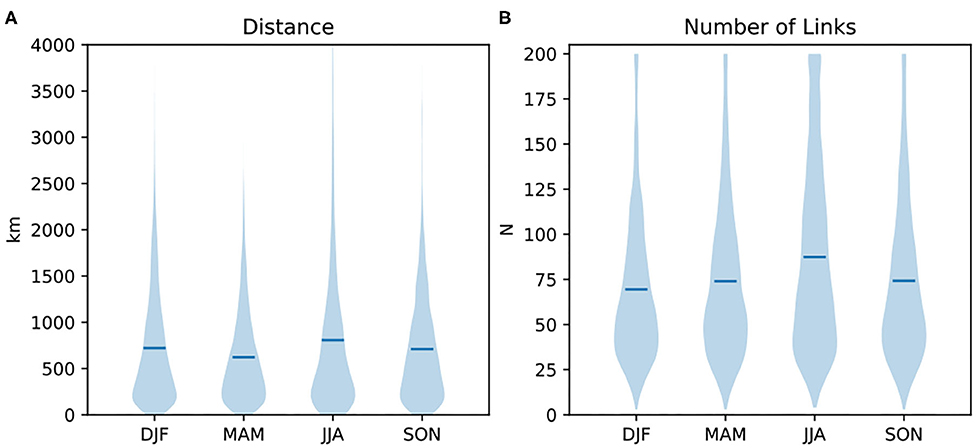
Figure 2. Distribution of precipitation chain properties for different seasons. Both (A) average distance (km) and (B) average chain length in grid cells are longest in summer. Horizontal lines indicate mean values.
Figure 3 illustrates several of the longest, shortest, and most curly (lowest C) precipitation chains for different seasons. In general, a chain that has a high N is not necessarily associated with high D, but these tend to be correlated. Particularly, we note that maximum N and D chains always have lengths of 200, which is the maximum we set for the search, but some are relatively straight and others curve significantly in multiple directions. For example, one of the longest chains in the winter (DJF) curls around to encompass most of southern Florida and then into the Gulf states (Figure 3A). Meanwhile, chains associated with maximum D have more straight shapes (Figure 3B). We note that chains with maximum N for each season originate in the southeast, corresponding to predominant west to east wind patterns in the continental U.S.
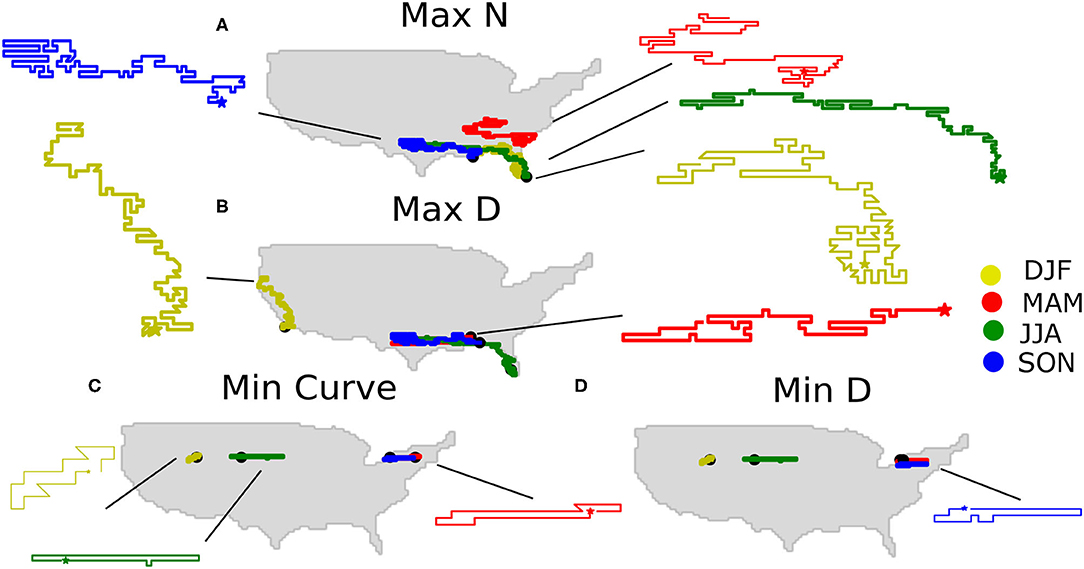
Figure 3. Examples of maximum and minimum precipitation chain properties. (A) Maximum length in grid cells, N, (B) maximum distance, D, from start (indicated by stars) to end point in km, (C) minimum C, where C is defined as , and (D) minimum D.
While maximum N and D cases are relatively similar and consist of chains with many links, minimum D cases behave similarly to minimum C cases. When we search for these extremes, we find chains that wrap around to their beginning “central” points, such that the total distance D is only the length of a single grid cell, but there are a significant number of links such that is very small. Meanwhile, minimum N cases are those for which few links are detected before the algorithm terminates.
Figure 4 shows the information theory metrics (Equation 3) associated with several examples of the longest chains in terms of both N and D. In general for all chains, the instantaneous precipitation occurrence state is more highly informative than lagged states for grid cells along the chain that are closer to the central cell. However, for the longest chains, there is a distance at which the shared information from the 1-day lagged state becomes larger (Figure 4). We also see that if a chain wraps around, the lag 0 shared information tends to increase as it gets closer to the central cell. This illustrates that our algorithm is not just searching a large area around a central grid cell to find the most informative, or matched, locations, but moving from grid cell to grid cell along a pathway. For example, there may be grid cells that are not along the constructed chain that are individually more informative to the central cell, but they are not directly connected via highly informative neighbors. Meanwhile, we see that the 2-day lagged mutual information tends to be very low, regardless of distance. This indicates that at large distances, the knowledge of precipitation occurrence 2 or more days ago is not highly informative of precipitation state. While an analysis of an individual storm track may show otherwise, this shows that on average, storms assume many different paths such that there is no single “typical” pathway for precipitation predictability. However, the high values of instantaneous mutual information, and relatively high values of 1-day lagged values, indicate a large degree of spatial synchronicity for some areas. This can be compared to studies of extreme precipitation synchronicity, where lagged relationships are dominant on a relatively short timescale even over large regions such as South America (Boers et al., 2013). While lagged dependencies in precipitation occurrence longer than 10 days have been found to be statistically significant for data from a single location (Goodwell and Kumar, 2019), these are typically much weaker relative to the more immediate lagged histories, and indicate average durations between precipitation events.
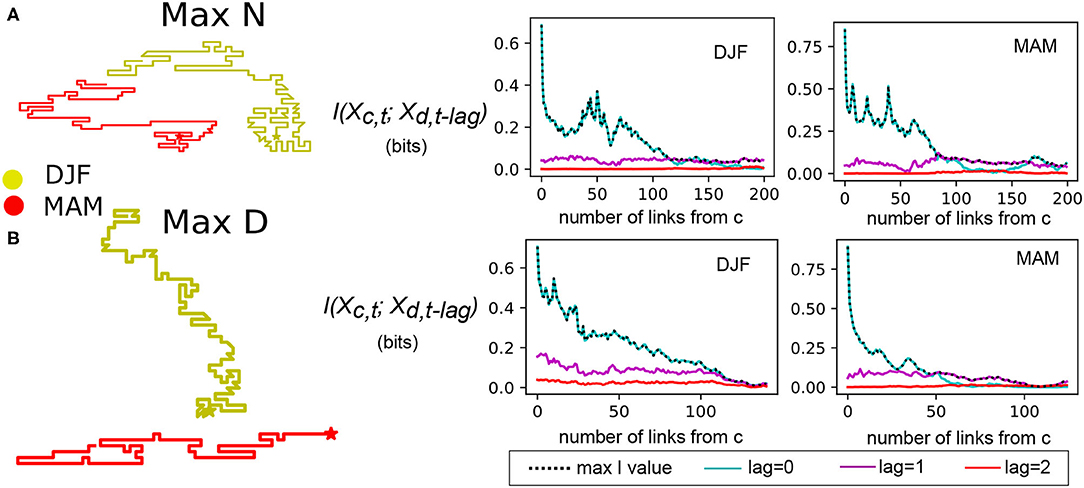
Figure 4. Mutual information values associated with maximum N and maximum D example cases from Figure 3. (A) Instantaneous (lag 0), 1 day lag, and 2 day lag mutual information between each grid cell along chain and the original center location for winter and spring locations associated with maximum number of links. (B) Same as (A) for locations associated with maximum geographic distance between central point and end point.
We next consider spatial and seasonal differences in terms of chain characteristics of N, D, and C (Figures 5–7). For the number of total links in the chain, we see more regions with longer chains in the summer, particularly in the north and central parts of the continental U.S (Figure 5C). This matches the overall finding of this behavior in the summer (Figure 2) and shows that this pattern exists over a wide spatial extent. This corresponds to the season with the most extreme rainfall events for most of the central part of the country (Kunkel et al., 2012). While this analysis focuses on precipitation occurrence rather than extremes, this shows that seasons with higher precipitation in general are associated with larger spatial extents of connectivity. In the summer, we also see longer chains [higher N] in northern California (Figure 5C). This could be related to North American Monsoon (NAM) events that are more dominant in the summer for California region Kunkel et al. (2012) that extend from south to north. In other seasons, extra-tropical cyclones dominate extreme precipitation events, and would lead to shorter detected chains since the pathway of lagged predictability would likely terminate upon reaching a coastline. In the winter (Figure 5A), we find long chains in terms of N in the central plains, in a region extending from northern Mississippi to eastern Colorado. Meanwhile in the spring (Figure 5B), regions of higher N exist in eastern Colorado and Wyoming and in part of the Midwestern U.S. In the fall (Figure 5D), we see higher N along the central part of the east coast relative to other seasons. One region that has relatively low chain lengths throughout the year is the Pacific Northwest. This region is relatively stable through different seasons, with average chain lengths between 50 and 100 links. While this is a region with high precipitation frequency [high H(X)], this indicates that events tend to be relatively local to this region.
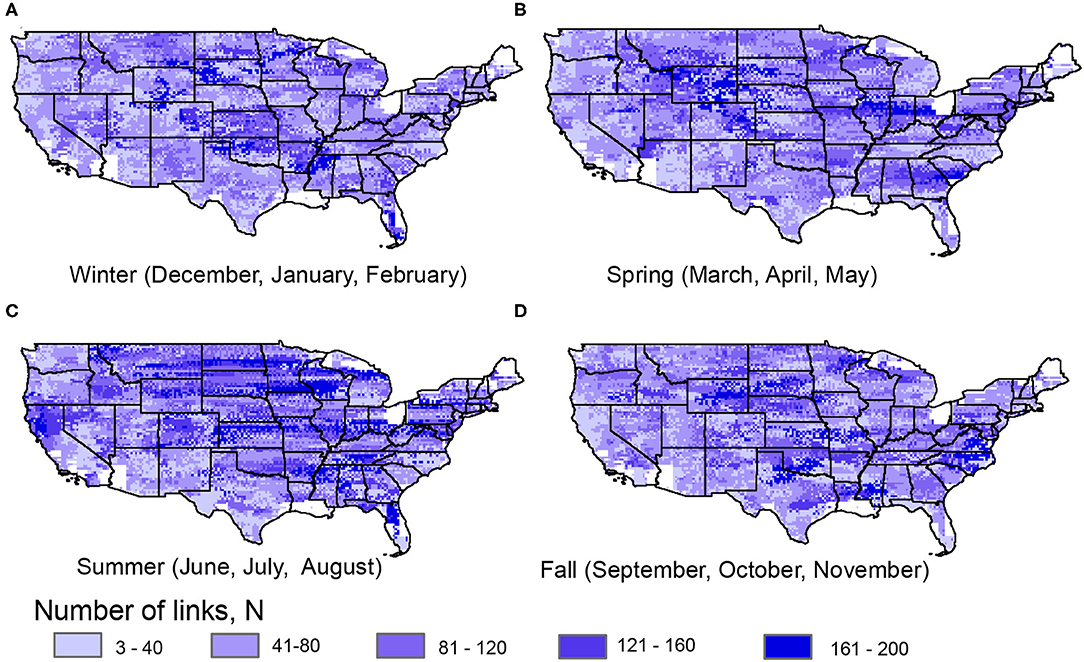
Figure 5. Number of links (N) for precipitation chains for (A) winter, (B) spring, (C) summer, and (D) fall. White areas indicate regions where no precipitation chain was constructed, either due to neighboring coastal or water grid cells, a lack of statistically significant relationships with neighbors.
While D is somewhat similar to N in terms of geographic and seasonal patterns (Figure 6), we do see regions where these metrics are less correlated. Particularly in the summer when a large area in the center of the country shows higher than average N, we see the highest distances D only in the Southeast and northern California (Figure 6C). Meanwhile, the northern central plains region in summer exhibit relatively low D. The Pacific Northwest, which did not show many seasonal differences in N, shows more seasonal patterns in D, particularly higher D in the spring (Figure 6B). In the winter and somewhat in the spring, we see consistent differences between the mountainous west and the plains, where chains are longer in terms of both N and D in the plains relative to the mountains (Figures 6A,B). This is related to the difference in weather patterns due to the topography in the region, and specifically shows that precipitation in the plains tends to be more spatially synchronized with larger extents. In other words, precipitation predictability is high given information sources from longer distances in the plains relative to the mountains. During the summer, the higher D in the Southeast corresponds to the greatest frequency of tropical cyclones, for which precipitation originating in the ocean can have a significant influence far inland.
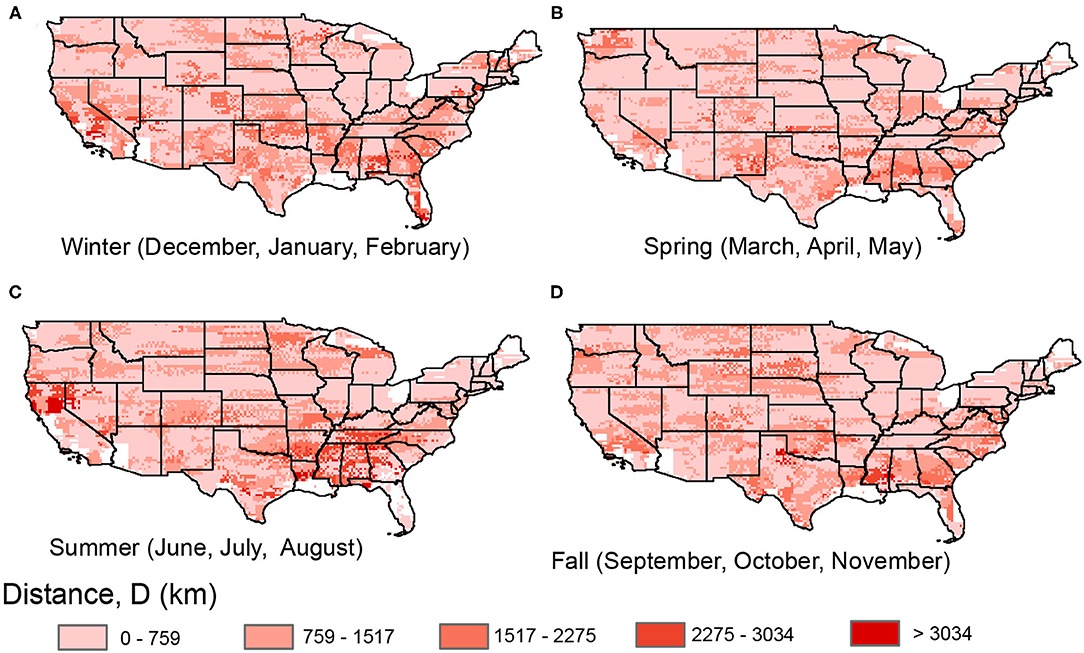
Figure 6. Distance from central to end point (D, km) for precipitation chains for (A) winter, (B) spring, (C) summer, and (D) fall.
Finally, C combines the influence of both number of links and the geographic distance to obtain a measure of curvature of a given chain (Figure 7). We see fewer spatial differences in C relative to N or D, since N and D tend to be positively correlated. However, seasonal maps of C do show some regions where the ratio of spatial extent (N) and straight line distance (D) vary. For example, we see relatively high C during the spring in the Pacific Northwest region. This indicates that in the spring, chains do not span more areal extent but “straighten out” in terms of a more defined elongated path. We also note relatively high C in the winter and summer on both the Pacific and Atlantic coasts, indicating more straight typical pathways relative to other seasons. In general, the more direct or frequent a specific storm path, the more clearly a straight path will appear in these chains. For regions where storms come from many different directions and with different speeds, or for spatially extensive storms, there is less of a clear spatial pathway of precipitation predictability. In the north central part of the U.S. in the summer (Figure 7C), we see the lowest C, associated with very high N (Figure 5C). This indicates that while precipitation state is very synchronized over many grid cells in this region and season, the constructed chain loops around to encompass an area rather than a straight line. This corresponds to the large spatial extents of storms in this season, such that events are likely synchronized over a large area rather than along a single path.
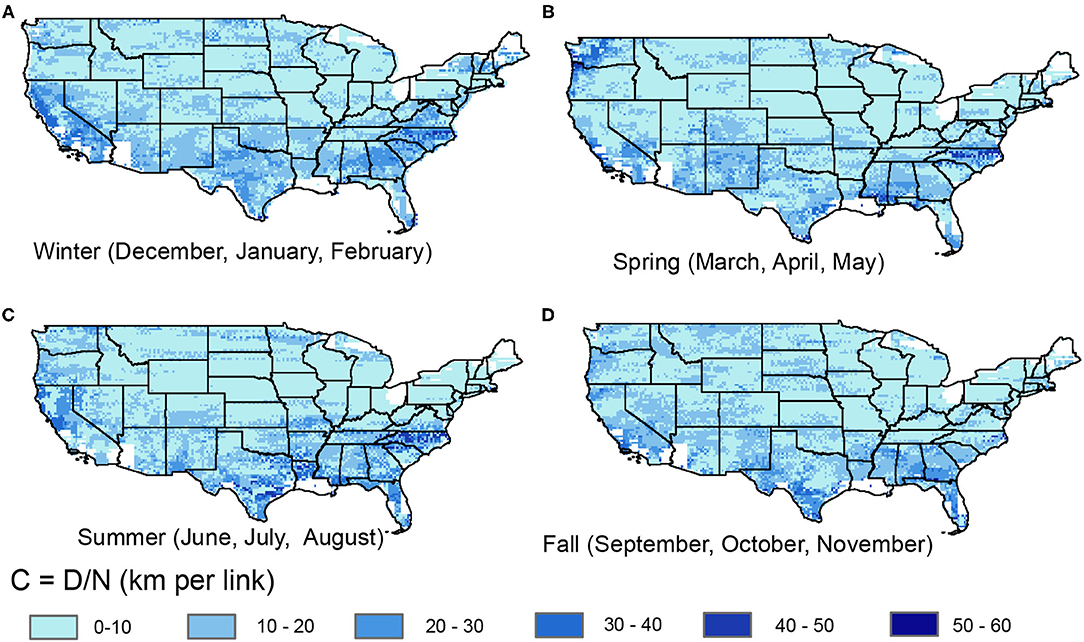
Figure 7. Curvature (, km per link) for precipitation chains for (A) winter, (B) spring, (C) summer, and (D) fall.
In this section, we first discuss several key findings, followed by advantages and limitations of our approach to constructing precipitation predictability chains.
The average distances of precipitation chains of 600–800 km are similar to or greater than previously detected synchronization distances determined from clustering algorithms (Mondal et al., 2020). This could be related to our consideration of precipitation occurrence as a binary variable, and our inclusion of all precipitation events rather than only extremes. For example, a study that only considers extreme events would omit surrounding areas with lower precipitation magnitudes. On average, we also see similar west-to-east behavior that has been detected in other ways (Najibi et al., 2020), reflecting the average wind directions across the continental U.S. Our findings of longer average chains, in terms of both links and geographic distance, in summer (JJA), also matches with previous findings of events with larger aerial extents in this season (Najibi et al., 2020). In general, we can compare this framework for precipitation chains with other complex network measures of precipitation synchronicity. For example, a high geographical distance (D) from starting to ending point, relative to a shorter distance or a more curved chain with the same number of links, could indicate a higher “long ranged directedness” (Boers et al., 2013) in precipitation. In other words, precipitation tends to follow a long transport route over a narrow pathway. Meanwhile, a chain with a lot of curvature is a case where precipitation is largely regionally synchronous and occur over a wide area. Here, we see that interior states tend to have lower C (higher ) relative to coastal regions, indicating the prevalence of more precipitation events that span large regions and may come from multiple directions.
We found that the lag-0, or instantaneous, mutual information was generally stronger than lagged values, even as the chain gets farther from its original central grid cell. This reflects the synchronicity and size of precipitation (or non-precipitation) events, in that even if a storm is moving across the region at a given pace, the concurrent state at a distant grid cell is still more highly predictive than the lagged state that could be associated with the speed of the event.
We do not fully address directionality in this study, but note that most precipitation chains have an east-west orientation, matching the typical wind patterns across the continental U.S. However, we see several behaviors along coastlines that do not reflect the movement of storms in that direction, but the synchronicity of precipitation along those coasts. For example, some of the longest chains in either distance or number of links originate in southern Florida and move along the Gulf Coast, or move up the Pacific Coast from southern California. A more detailed analysis could determine the average directionality associated with precipitation predictability, and extend upon Goodwell (2020) which focused on directionality based on only neighboring grid cells. In general, this study shows that precipitation occurrence predictability can be very far ranging, beyond those nearest grid cells, and in some cases the knowledge of more distant locations can most strongly inform a precipitation state at a certain location.
The information theory based algorithm employed here has several advantages and limitations relative to other types of analysis techniques. One advantage is the context of information, or reductions in uncertainty, as these are directly related to the level of predictability of a random variable whether it is from a linear or nonlinear type of relationship. Information theory also enables detection of lagged and multivariate relationships. Another advantage of this particular “chain” construction algorithm is that it is computationally inexpensive relative to searching for dependencies for a widening radius around a central grid cell. For example, to search all possible connections within a 50 grid cell radius for a central grid cell would require a square with edge length of 100, for a total perimeter of 400 grid cells and an area encompassing 10,000 grid cells, nearly the entire extent of the continental U.S. based on the gridded dataset used here. Meanwhile, we perform 8 or fewer computations of mutual information to determine each added link to the chain, so a chain of 50 grid cells in length would require a maximum search of 400 grid cell time-series which would be compared to each other and the central cell. Even our longest chains with lengths of 200 grid cells required computations between 1,600 or fewer other cells. However, this method, in defining a “chain” of grid cells that are maximally connected by mutual information, potentially misses defining a “region” or “footprint” of the actual influence to the central grid cell. Potentially, this could be improved by allowing for multiple chains to emanate from central grid cell, such that instead of a chain we could have obtained a “precipitation predictability network” that may span primary and secondary directions of typical moving precipitation events. In general, this study introduces an information theory based method to construct a pathway, or chain, of influence from one location to another, and could be applied or extended to study predictability in various types of temporal and spatial data sets.
The original Python codes presented in the study are publicly available. These codes can be found here: https://github.com/allisongoodwell/RainingBitsSpatial. In addition, CPC US Unified Precipitation data were provided by the NOAA/OAR/ESRL PSD. This data can be found here: https://www.esrl.noaa.gov/psd/.
AG conceptualized the study, performed the analysis, and wrote the manuscript. RC developed figures and supplementary codes.
AG was supported by NSF Grant EAR #2012850 for the Critical Interface Network for Intensively Managed Landscapes (CINet) and NASA New Investigator Grant 80NSSC21K0934.
The authors declare that the research was conducted in the absence of any commercial or financial relationships that could be construed as a potential conflict of interest.
All claims expressed in this article are solely those of the authors and do not necessarily represent those of their affiliated organizations, or those of the publisher, the editors and the reviewers. Any product that may be evaluated in this article, or claim that may be made by its manufacturer, is not guaranteed or endorsed by the publisher.
Barlow, M., Nigam, S., and Berbery, E. H. (2001). ENSO, Pacific decadal variability, and U.S. summertime precipitation, drought, and stream flow. J. Clim. 14, 2105–2128. doi: 10.1175/1520-0442(2001)014<2105:EPDVAU>2.0.CO;2
Boers, N., Bookhagen, B., Marwan, N., Kurths, J., and Marengo, J. (2013). Complex networks identify spatial patterns of extreme rainfall events of the South American Monsoon System. Geophys. Res. Lett. 40, 4386–4392. doi: 10.1002/grl.50681
Boers, N., Rheinwalt, A., Bookhagen, B., Barbosa, H. M. J., Marwan, N., Marengo, J., et al. (2014). The South American rainfall dipole: a complex network analysis of extreme events. Geophys. Res. Lett. 41, 7397–7405. doi: 10.1002/2014GL061829
Carvalho, L. M. (2020). Assessing precipitation trends in the Americas with historical data: A review. Wiley Interdiscipl. Rev. Clim. Change 11, 1–21. doi: 10.1002/wcc.627
Chen, M., Shi, W., Xie, P., Silva, V. B., Kousky, V. E., Higgins, R. W., et al. (2008). Assessing objective techniques for gauge-based analyses of global daily precipitation. J. Geophys. Res. Atmos. 113, 1–13. doi: 10.1029/2007JD009132
Chin, E. H. (1977). Modeling Daily Precipitation Occurrence Process with Markov Chain. Water Resour. Res. 13:10. doi: 10.1029/WR013i006p00949
Cover, T., and Thomas, J. (2006). Elements of Information Theory, 2nd Edn, Vol. 2. Hoboken, New Jersey: Wiley.
Dominguez, F., Kumar, P., Liang, X. Z., and Ting, M. (2006). Impact of atmospheric moisture storage on precipitation recycling. J. Clim. 19, 1513–1530. doi: 10.1175/JCLI3691.1
Dominguez, F., Kumar, P., and Vivoni, E. R. (2008). Precipitation recycling variability and ecoclimatological stability–A study using NARR Data. Part II: North American Monsoon Region. J. Clim. 21, 5187–5203. doi: 10.1175/2008JCLI1760.1
Gabriel, K., and Neumann, J. (1961). A Markov chain model for daily rainfall occurrence at Tel Aviv. Q. J. R. Meteorol. Soc. 88, 90–95. doi: 10.1002/qj.49708837511
Gao, S., and Fang, Z. (2018). Using storm transposition to investigate the relationships between hydrologic responses and spatial moments of catchment rainfall. Nat. Hazards Rev. 19, 1–13. doi: 10.1061/(ASCE)NH.1527-6996.0000304
Goodwell, A. E. (2020). “It's Raining Bits”: patterns in directional precipitation persistence across the United States. J. Hydrometeorol. 21, 2907–2921. doi: 10.1175/JHM-D-20-0134.1
Goodwell, A. E., and Kumar, P. (2019). A changing climatology of precipitation persistence across the united states using information-based measures. J. Hydrometeorol. 20, 1649–1666. doi: 10.1175/JHM-D-19-0013.1
Hurrell, J. W., and Deser, C. (2010). North Atlantic climate variability: the role of the North Atlantic Oscillation. J. Mar. Syst. 79, 231–244. doi: 10.1016/j.jmarsys.2009.11.002
Kunkel, K. E., Easterling, D. R., Kristovich, D. A. R., Gleason, B., Stoecker, L., and Smith, R. (2012). Meteorological causes of the secular variations in observed extreme precipitation events for the conterminous United States. J. Hydrometeorol. 13, 1131–1141. doi: 10.1175/JHM-D-11-0108.1
Mondal, S., Mishra, A. K., and Leung, L. R. (2020). Spatiotemporal characteristics and propagation of summer extreme precipitation events over United States: a complex network analysis. Geophys. Res. Lett. 47, 1–11. doi: 10.1029/2020GL088185
Najibi, N., Mazor, A., Devineni, N., Mossel, C., and Booth, J. F. (2020). Understanding the spatial organization of simultaneous heavy precipitation events over the conterminous United States. J. Geophys. Res. Atmos. 125, 1–33. doi: 10.1029/2020JD033036
Roque-Malo, S., and Kumar, P. (2017). Patterns of change in high frequency precipitation variability over North America. Nat. Sci. Rep. 7:10853. doi: 10.1038/s41598-017-10827-8
Ruddell, B. L., and Kumar, P. (2009). Ecohydrologic process networks: 1. identification. Water Resour. Res. 45, 1–22. doi: 10.1029/2008WR007279
Seo, Y., Schmidt, A. R., and Sivapalan, M. (2012). Effect of storm movement on flood peaks: analysis framework based on characteristic timescales. Water Resour. Res. 48, 1–12. doi: 10.1029/2011WR011761
Shannon, C. (1948). A mathematical theory of communication. Bell Syst. Techn. J. 27, 379–423. doi: 10.1002/j.1538-7305.1948.tb01338.x
Ting, M., and Wang, H. (1997). Summertime U.S. precipitation variability and its relation to Pacific sea surface temperature. J. Clim. 10, 1853–1873. doi: 10.1175/1520-0442(1997)010<1853:SUSPVA>2.0.CO;2
Keywords: precipitation, information theory, predictability, uncertainty, footprint
Citation: Goodwell A and Chapagain R (2021) Chains of Spatial and Temporal Precipitation Occurrence Predictability Across the Continental U.S.. Front. Clim. 3:780879. doi: 10.3389/fclim.2021.780879
Received: 21 September 2021; Accepted: 12 November 2021;
Published: 08 December 2021.
Edited by:
Veljko Petkovic, University of Maryland, College Park, United StatesReviewed by:
Malarvizhi Arulraj, University of Maryland, College Park, United StatesCopyright © 2021 Goodwell and Chapagain. This is an open-access article distributed under the terms of the Creative Commons Attribution License (CC BY). The use, distribution or reproduction in other forums is permitted, provided the original author(s) and the copyright owner(s) are credited and that the original publication in this journal is cited, in accordance with accepted academic practice. No use, distribution or reproduction is permitted which does not comply with these terms.
*Correspondence: Allison Goodwell, YWxsaXNvbi5nb29kd2VsbEB1Y2RlbnZlci5lZHU=
Disclaimer: All claims expressed in this article are solely those of the authors and do not necessarily represent those of their affiliated organizations, or those of the publisher, the editors and the reviewers. Any product that may be evaluated in this article or claim that may be made by its manufacturer is not guaranteed or endorsed by the publisher.
Research integrity at Frontiers
Learn more about the work of our research integrity team to safeguard the quality of each article we publish.