 Feng Chen
94% of researchers rate our articles as excellent or good
Learn more about the work of our research integrity team to safeguard the quality of each article we publish.
Find out more
ORIGINAL RESEARCH article
Front. Clim., 14 February 2022
Sec. Climate Services
Volume 3 - 2021 | https://doi.org/10.3389/fclim.2021.771441
This article is part of the Research TopicClimate Change, Aerosol Pollution and Public Health Risk in an Urban ContextView all 5 articles
For urban weather finescale forecasting, obtaining accurate and up-to-date urban canopy parameters (UCPs) is necessary and still a challenge. In this study, a high-resolution dataset of UCPs was developed by using vector-format building information and then applied in the WRF/urban system with the single-layer urban canopy model (SLUCM)/building effect parameterization (BEP) model to improve the urban finescale forecasting of a typical heat wave event during summer 2016 in Hangzhou. A series of sensitivity experiments were conducted, and the results showed that the high-resolution UCP data improved the model skill in simulating the spatial distributions and diurnal variations of 2-m temperature, 2-m relative humidity, and 10-m wind speed in the urban areas of Hangzhou, especially for the BEP model. Better results were produced when refining the computation domain due to more realistic urban morphological characteristics were adopted. The sensitive experiments suggest that the high-resolution UCPs played a significant role in representing the UHI effect though changing the surface thermodynamic parameters (e.g., roughness length), hereafter increasing the sensible heat and surface heat flux, and finally resulting a notable urban heat island (UHI) effect.
Continuous and rapid urbanization across the world has drawn a great deal of attention to urban climate studies in the past decades (Arnfield, 2003; Grimmond, 2007; Seto and Shepherd, 2009; Stewart, 2011; Janković, 2013; Wang and Yan, 2016; Luo and Lau, 2018, 2021; Masson et al., 2020b). Currently, there is a pressing need for urban weather and climate services (Baklanov et al., 2018), as local weather conditions in cities have important implications for air quality (Baklanov et al., 2016), energy consumption of buildings (Santamouris et al., 2015), and human health (Tan et al., 2010; Heaviside et al., 2017). In order to mitigate the urban climatic and environmental issues, regional climate models coupled with urban modeling system play an important role in accurate urban weather forecasts and experiments on the complex interactions of urban surfaces and the atmosphere (Chen et al., 2011; Kwok and Ng, 2021).
Nowadays, the “quiet revolution” in numerical weather prediction leads to a great progress in weather forecast, which is beneficial to the development of the physical model and the usage of new data (Bauer et al., 2015). The Weather Research and Forecasting (WRF) model is a state-of-the-art mesoscale atmospheric modeling system designed for both meteorological research and numerical weather prediction (https://www2.mmm.ucar.edu/wrf/users/). The community Noah land surface model (Chen et al., 1996) is coupled with the WRF model to calculate the land surface heat and moisture fluxes (Skamarock et al., 2005). For urban applications, a bulk urban parameterization was included in early version of WRF/Noah model to represent zero-order effects of urban surface by using some specified physical parameters (Liu et al., 2006). In order to represent the impacts of the complex urban geometry, two urban canopy schemes with different degrees of freedom to parameterize urban surface processes were coupled to WRF/Noah model. The single-layer urban canopy model (SLUCM) takes into account the three-dimensional nature of urban surfaces by assuming infinitely long street canyons (Kusaka et al., 2001; Kusaka and Kimura, 2004). The building effect parameterization (BEP) model, a more sophisticated multilayer urban canopy schemes, explicitly considers the effects of vertical (walls) and horizontal (roofs and streets) urban surfaces on momentum, potential temperature, and turbulent kinetic energy (TKE) fluxes passed to the planetary boundary layer (PBL) (Martilli et al., 2002). Since the internal temperature of buildings is kept constant in BEP, Salamanca et al. (2010) developed a simple building energy model (BEM) to improve the estimation of energy exchanges between internal buildings and outdoor atmosphere. These progresses represent the most recent updates to mesoscale urban parameterizations.
Besides the improved representation of physical processes in urban canopy, there is a growing awareness about the important role of urban surface morphology determined by urban canopy parameters (UCPs) for urban weather and climate simulations (Otte et al., 2004; Miao et al., 2009; Salamanca et al., 2011; Li et al., 2013; Monaghan et al., 2014; He et al., 2019; Shen et al., 2019; Masson et al., 2020a; Sun et al., 2021). To represent the complex urban building morphological features in urban canopy models (UCMs), dozens of UCPs (e.g., imperviousness, building height, building width, street width, street direction, frontal area density, etc.) are needed to calculate the key thermodynamic variables (e.g., canyon roughness length, zero plane displacement, drag coefficient, etc.) in urban areas (Kusaka et al., 2001; Martilli et al., 2002; Chen et al., 2011). Availability of high-resolution datasets of UCPs is regionally dependent; therefore, the WRF/urban modeling system specified default UCPs in a look-up table for three urban land use categories (low-intensity residential, high-intensity residential, and commercial), which significantly underestimate the complexity and heterogeneity of urban morphology (He et al., 2019). Generating a database that contains urban morphological parameters to reflect the unique conditions in each urban center is of great significance to improve the simulation ability of the WRF/urban modeling system in urban areas (Sun et al., 2021). For this purpose, the National Urban Database and Assess Portal Tool (NUDAPT) (Ching et al., 2009) and World Urban Database and Access Portal Tool (WUDAPT) (Ching et al., 2018) were initiated to generate a comprehensive continental and global database on high-resolution urban canopy information to facilitate urban weather, climate, and air quality modeling. Compared with WRF simulations using the default UCPs, high-resolution UCPs enhanced the performance of WRF (He et al., 2019; Shen et al., 2019; Wong et al., 2019). Unfortunately, such high-resolution datasets of UCPs are rarely available for Chinese cities. Recently, using vector-format building information, the datasets of three-dimensional (3-D) UCPs were developed and applied in the WRF/urban modeling system for Beijing (He et al., 2019) and Guangzhou (Shen et al., 2019). Based on vector-format building floor number data of 60 main cities, Sun et al. (2021) developed a high-resolution urban morphological parameter dataset for the main cities in China. However, finescale WRF/urban modeling at subkilometer scale using high resolution UCPs is still lacking, especially for cities in East China.
Therefore, this study focuses on Hangzhou, the second largest metropolis in the Yangtze River Delta region in east China. As the host of the 2016 G20 Summit and 2022 Asian Games, Hangzhou became one of the most prosperous international metropolises in China. During the rapid urbanization process, Hangzhou experienced significant environmental changes and faced major urban weather, climate, and environment-related challenges, such as extreme weather events and air pollution. The mitigation of these adverse effects relies on accurate urban finescale weather forecasts for preparing effective early warnings (Ronda et al., 2017). Using vector-format building data from Hangzhou Surveying and Mapping Bureau, Yu et al. (2018) developed a detailed dataset of UCPs for surface wind field simulations, which were used to design multilevel urban ventilation corridors in Hangzhou. In this study, the new dataset of three-dimensional UCPs were applied in the WRF/urban modeling system, and its impacts on urban finescale forecasting were investigated. The development of UCP data are presented in section Research Domain and Its Urban Canopy Parameters. The methodology, including research domain, synoptic background, model configuration, and numerical experiment design, is clarified in the section Methodology. The results of the numerical experiment are presented in the section Results. The conclusion and discussion are provided in the final section.
The metropolitan region of Hangzhou (30◦7′N−30◦24′N, 120◦2′E−120◦22′E) is located at the south of the Yangtze River Delta (see Figure 1a), covering a surface area of 1,600 km2 with an urbanization rate of 78.5% at the end of 2019. The landscape in this region is quite complex, which comprises the world-famous West Lake at the center of the region, the Qiantang River across the region from west to east, the urban area of downtown Hangzhou on the east and north side of West Lake and the subcenter of the city (Bingjiang and Xiaoshan) on the south side of the Qiantang River, the forest area of the west-lake scenic area on the southwest side of the West Lake, the Xixi wetland in the west of the region, and the Qiaosi farmland in the east of the region (see Figure 1b).
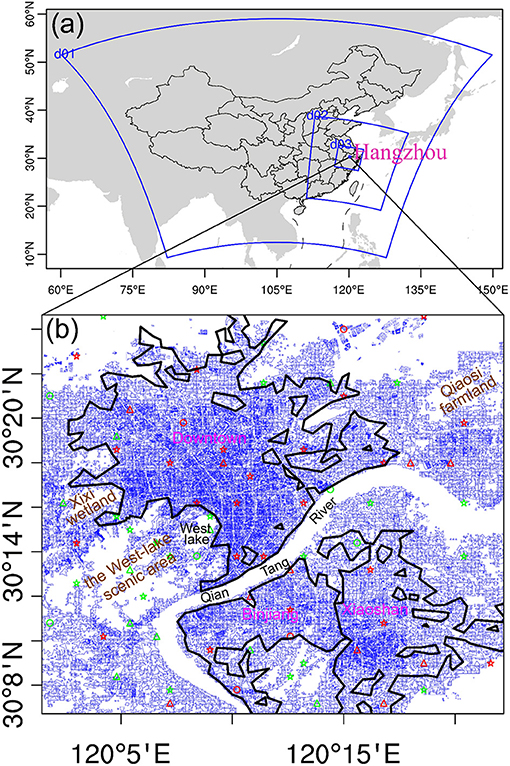
Figure 1. (a) Location of Hangzhou and the configuration of one-way quadruple nested domain for Weather Research and Forecasting (WRF) simulations. (b) Schematic map of the vector-format building data (blue) with urban Automatic Weather Stations (AWS) sites (red) and rural AWS sites (green). The five-pointed star represents an AWS site with temperature, relative humidity, and wind observations; the triangle represents an AWS site with temperature and wind observations; while the circle represents an AWS site only with temperature observations. The area enclosed by the black line represents the downtown of Hangzhou and two subcenters (Binjiang and Xiaoshan), in which the impervious fraction is larger than 0.5.
The default land use data (MODIS 20-category) with one urban land category (Figure 2A) used in WRF were obtained in 2004, which is outdated and cannot represent the inhomogeneity in urban areas of Hangzhou (Chen et al., 2014). In this study, the urban and rural settlement data from the Global Urban Footprint (GUF) project (https://www.dlr.de/eoc/en/desktopdefault.aspx/tabid-11725/20508_read-47944/) were used to generate urban land use data of 100-m resolution (Figure 2B). The population density data at 100-m spatial resolution (Ye et al., 2019) were utilized to specify detailed urban land use categories (low-intensity residential with population density <10 people/ha, high-intensity residential with population density between 10 and 100 people/ha, and commercial with population density larger than 100 people/ha).
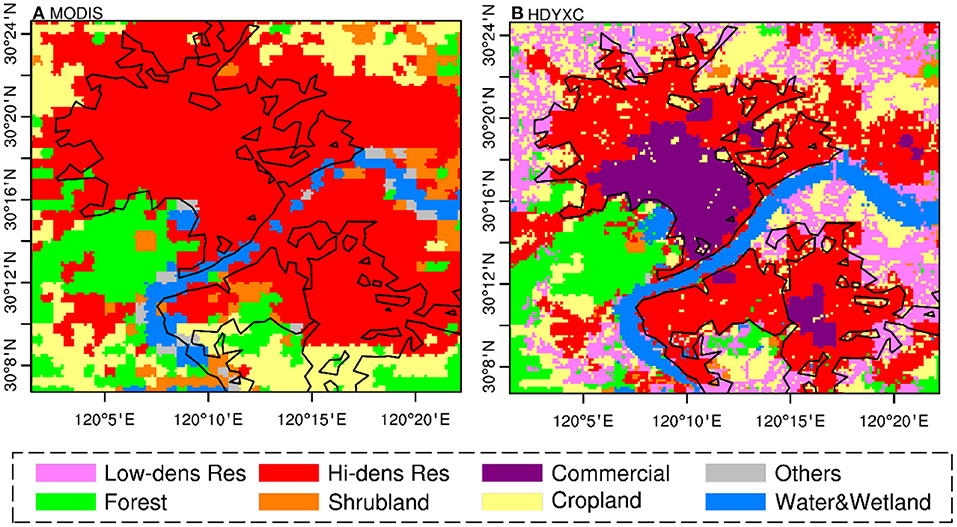
Figure 2. (A) The WRF default land use data from MODIS. (B) The new land use data derived from GUF (Global Urban Footprint) and gridded population data.
The UCPs are calculated based on vector-format building data obtained from Hangzhou Surveying and Mapping Bureau, which is a vector-format data containing polygon feature classes existing in a geodatabase (Figure 1b). The high-intensity residential and commercial are mainly distributed in the downtown Hangzhou on the east side of West Lake and the Binjiang/Xiaoshan District on the south bank of the Qiantang River. The basic geographic information of buildings can be derived from a series of attributes (e.g., the floors and footprint outline of the building, the area and the perimeter of the building base, etc.) of these polygon feature classes. The UCPs are then calculated according to building information and used in WRF/urban modeling system to represent the geometrical characteristics of urban morphology.
The gridded (resolution at 100 m and 1 km) UCPs are derived by using the ArcGIS-embedded algorithms (Yu et al., 2018), and seven parameters are actually used to calculate WRF/urban morphology: (1) mean building height, (2) distribution of building heights, (3) area weighted mean building height, (4) standard deviation of building height, (5) plan area fraction, (6) building surface to plan area ratio, and (7) frontal area index. The calculation of these parameters is listed in Table 1, and the results are shown in Figure 3. Based on these parameters, the geometrical urban canyon parameters were estimated following the formulations in Macdonald et al. (1998). Previous studies suggested that the incorporation of gridded anthropogenic heat release (AHR) data can improve the modeling skill of WRF/urban system in Hangzhou (Chen et al., 2016; Yang et al., 2019). In this study, a newly developed gridded AHR data from Chen et al. (2020) were used.
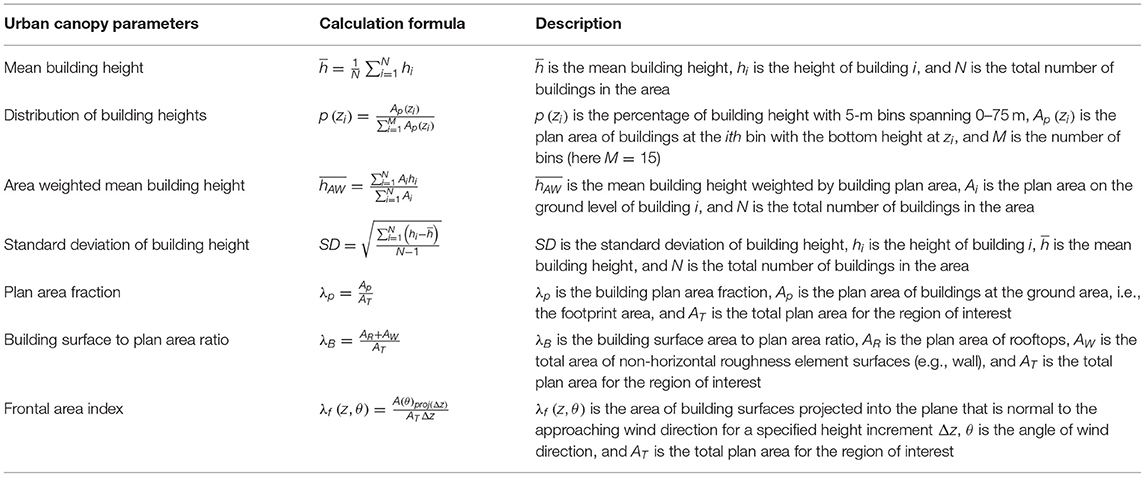
Table 1. The calculation of urban canopy parameters.

Figure 3. Gridded urban canopy parameters: (A) impervious fraction (unitless); (B) area weighted mean building height (m); (C) standard deviation of building height (m); (D) building surface area to plan area ratio (unitless); (E) southeasterly wind frontal area density (unitless); (F) northerly wind frontal area density (unitless); (G) northeasterly wind frontal area density (unitless); (H) easterly wind frontal area density (unitless).
The Weather Forecast and Research urban model version 4.0.2 (Chen et al., 2011; Skamarock et al., 2019) is used in this study, and the forecasts are produced on four one-way nested computational domains (Figure 1a) with the grid spacing (grid numbers) of 9 km (580 × 637), 3 km (637 × 577), 1 km (502 × 502), 200 m (211 × 211), respectively. The coarsest domain (d01) comprises a major part of Asia, while the most inner domain (d04) covers the metropolitan region of Hangzhou. The model employs 51 vertical terrain-following hybrid sigma-pressure layers from the surface up to a pressure level of 50 hPa. The RRTMG shortwave/longwave radiation scheme (Iacono et al., 2008), the Kain–Fritsch cumulus scheme (only used in d01) (Kain and Kain, 2004), the WSM6 microphysics scheme (Lim and Hong, 2010), the Bougeault and Lacarrere (1989) TKE PBL scheme, the Revised MM5 Monin–Obukhov surface-layer scheme (Jiménez et al., 2012), and the Noah-MP land-surface scheme (Niu et al., 2011) coupled with SLUCM/BEP are used in this study. Several configurations are made for the adaptation of the urban finescale forecasting, including initializing the inner temperature of the buildings from the observation site (307 K in this case), choosing the Smagorinsky first-order closure (3D) option in the finescale grids (d03 and d04), and the horizontal Smagorinsky first-order closure option in coarse grids (d01 and d02). With this methodology, the largest (flux carrying) eddies are expected to be resolved by the modeling system in the finescale grids (Talbot et al., 2012), and the vertical turbulent diffusion is parameterized according the PBL scheme in the coarse grids. The initial and boundary condition were derived from the ERA-Interim reanalysis data at a horizontal resolution about 79 km (Dee et al., 2011).
A typical heat wave with all-sky clear days from 0000 UTC July 21 to 0000 UTC July 25, 2016 was selected for this study. This heat wave was caused by the large-scale synoptic condition of the strong west Pacific subtropical high system over Hangzhou (Xu et al., 2009; Peng, 2014). Under the control of such a strong subtropical high, a calm weather with low wind speeds and humidity, as well as limited cloud and no precipitation, are long time continued, which led to a heat wave event in Hangzhou (Lin et al., 2013; Quan and He, 2016).
As show in Table 2, seven numerical experiments were conducted and divided into two groups. Group I contains four runs. The SDNN and BDNN runs with the default MODIS 20-category data are called the “default” cases, while the SNUA and BNUA runs with the updated land use data and high-resolution UCPs is called the “new” cases. The contrast of the “new” cases and the “default” cases were conducted to investigate the improvements of urban finescale forecasting by using high-resolution UCPs. The other five experiments (SDNN, SNNN, SNNA, SNUN, and SNUA runs) in Group 2 with different settings of land use datasets, UCPs, and AHR were compared to investigate the mechanism of these factors on the forecasting of this heat wave event. All these experiments were conducted from 0000 UTC July 21 to 0000 UTC July 25, 2016, and the last 3 days were used to evaluate the performance of the integrated WRF/urban modeling system.
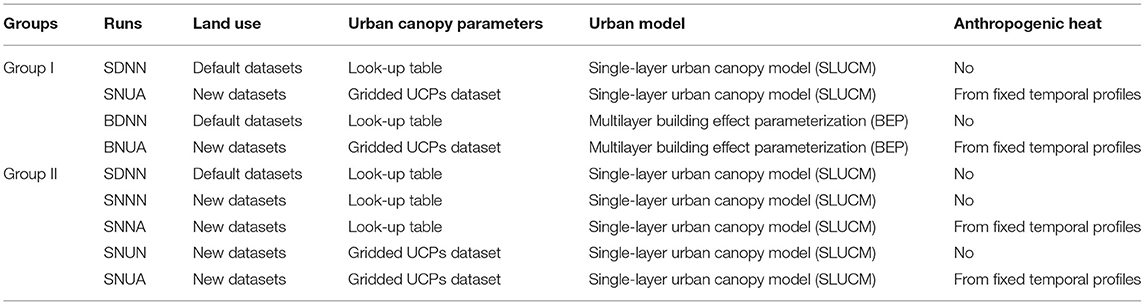
Table 2. Overview of the simulation cases with difference configurations.
To evaluate the improvement of the WRF/urban finescale forecasting system, in two category results of simulations with (“new” cases)/without (“default” cases), the high-resolution UCPs were compared against the observations in Table 3. The observational data are from the Automatic Weather Stations (AWS) maintained by Zhejiang Meteorological Bureau of China Meteorological Administration, including hourly 2-m temperature, 2-m relative humidity, and 10-m wind speed during the heat wave event. Overall, the “new” cases (SNUA and BNUA) yield better results than the “default” cases (SDNN and BDNN) (Table 3). Either the SLUCM or the BEP model with the high-resolution UCPs produced smaller BIAS and RMSE than that without the high-resolution UCPs, especially in the urban area.
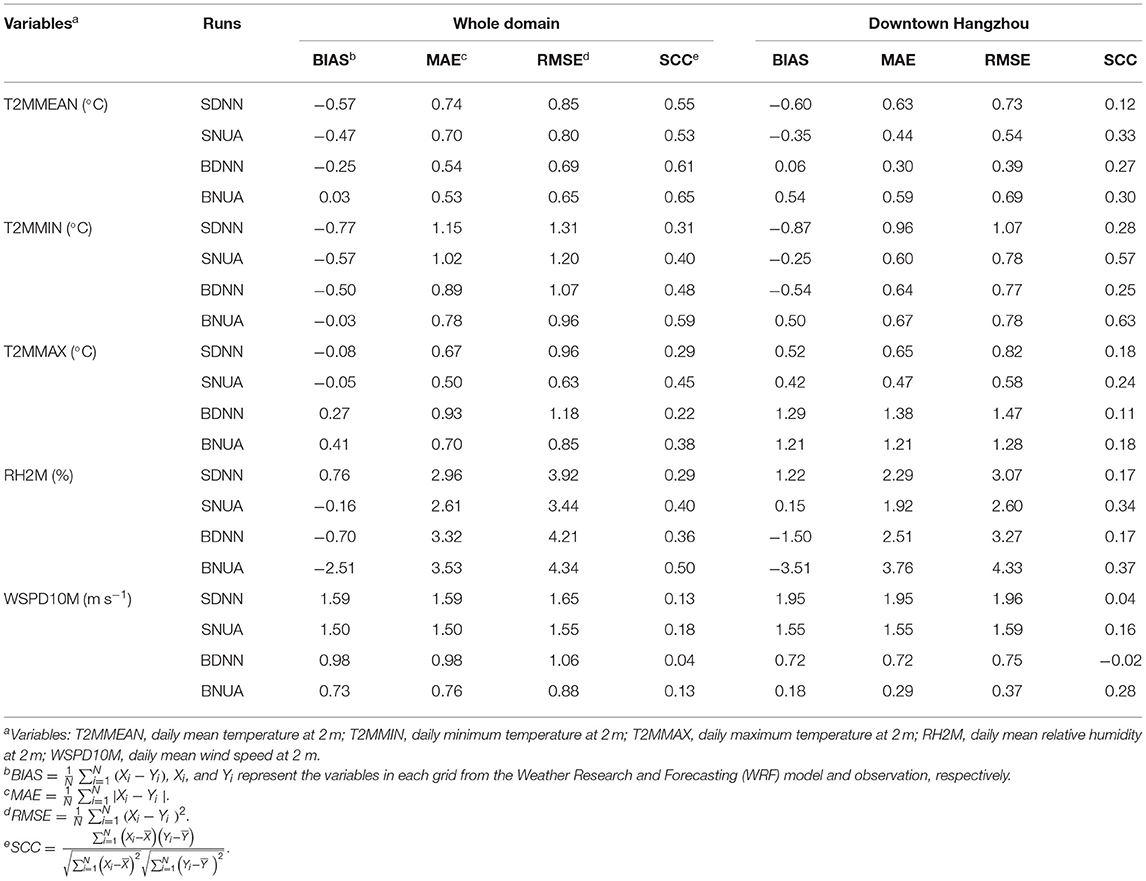
Table 3. Evaluation of temperature at 2 m, relative humidity at 2 m, and wind speed at 10 m over the whole domain and the downtown Hangzhou.
Figure 4 shows the comparison of the averaged daily mean temperature at 2 m in the metropolitan region of Hangzhou during 0000 UTC July 22, 2016 to 0000 UTC July 25, 2016. The observed temperature was well consistent with the urban area illustrated in Figures 1b, 2B, which shows the development of UHI effect in downtown Hangzhou, Bingjiang, and Xiaoshan District (Figure 4E). It is shown that the “default” cases underestimated the near-surface temperature and with the position slightly northeastward in Figures 4A,C for the SLUCM and BEP models, respectively. These underestimation and position shift were reduced when the updated land use data and UCPs were adopted in SLUCM and BEP models, which reproduced the UHI center located in a similar region as observed (Figures 4B,D). Further statistical analysis also shows that the SLUCM/BEP model with the default land use data underestimates the near-surface temperature with the RMSE of 0.85/0.69, 1.31/1.07, and 0.96/1.18◦C for the daily mean, minimum, and maximum temperatures, respectively, and these RMSEs reduced to 0.80/0.65, 1.20/0.96, and 0.63/0.85◦C when using the high-resolution UCPs. The spatial correlation coefficients were also improved, especially in downtown Hangzhou.
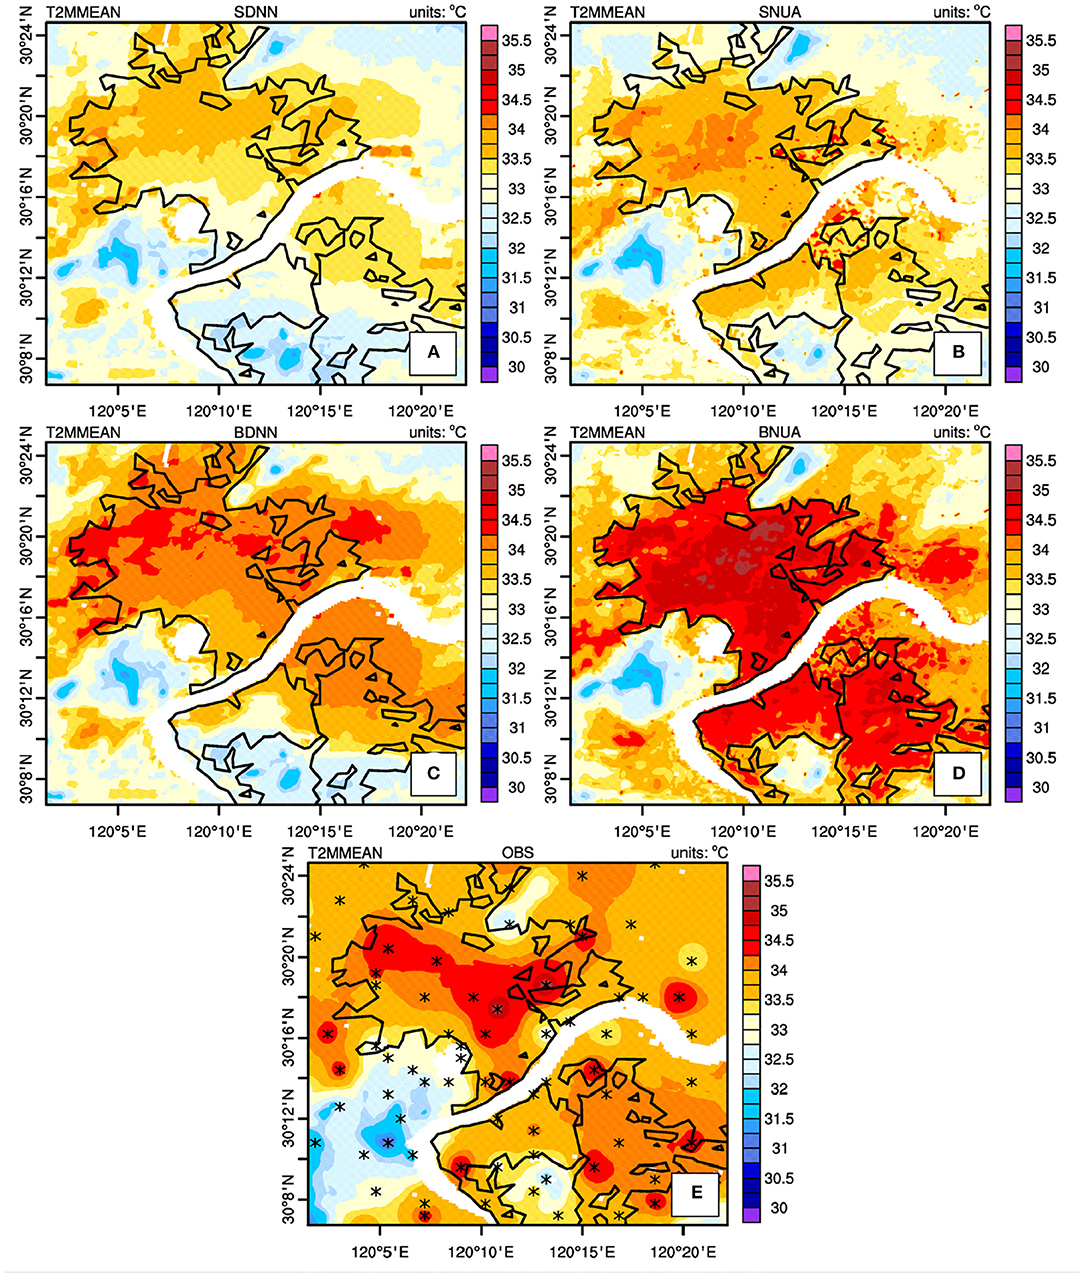
Figure 4. Averaged daily mean temperature at 2 m in Hangzhou during 0000 UTC July 22, 2016 to 0000 UTC July 25, 2016: (A) SDNN run; (B) SNUA run; (C) BDNN run; (D) BNUA run; and (E) AWS observations. Black stars refer to AWS sites.
The simulated and observed daily mean relative humidity at 2 m are compared in Figure 5. The observed “dry island” appears mainly in the downtown Hangzhou (Figure 5E), which is also reported in cities in East China in previous studies (Hao et al., 2018; Luo and Lau, 2019). Similar to the 2-m temperature, the relative humidity at 2 m simulated by the “default” cases (SDNN and BDNN runs) had a northeastward shift against the observation, which was corrected in the “new” cases (SNUA and BNUA runs). The underestimate of the “dry island” in the “default” cases were also reduced in the “new” cases, especially by the BEP model.
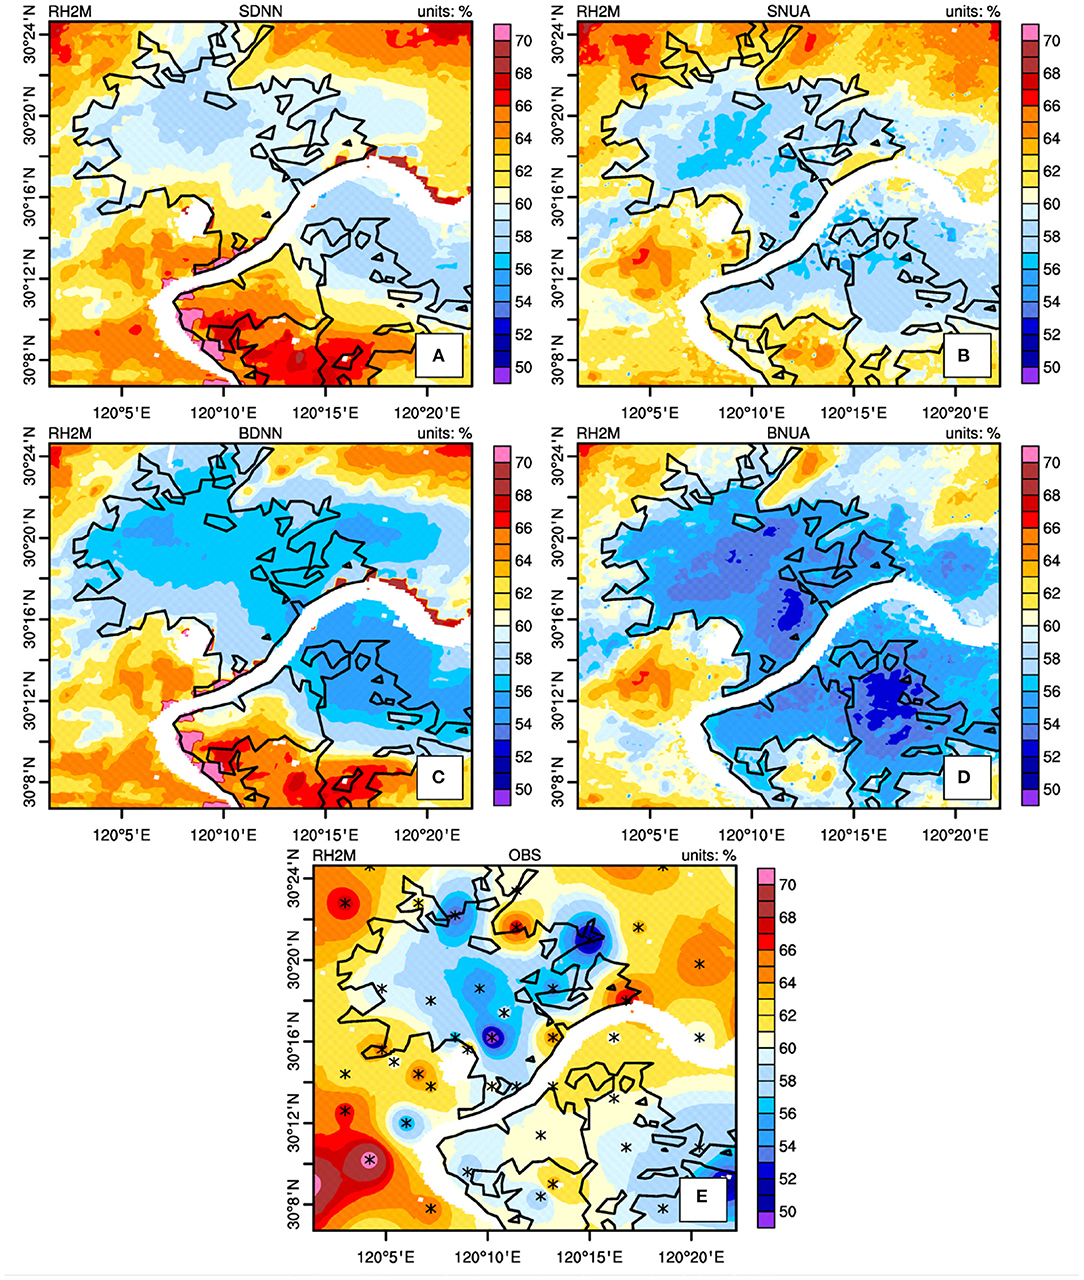
Figure 5. The same as Figure 4, but for daily mean relative humidity at 2 m.
Under the low wind speed condition, all the cases overestimated the wind speed (Figure 6), especially by the SLUCM model (i.e., SDNN and SNUA runs), which cannot reproduce the slowing of wind speeds in urban areas due to building barrier effects (Kristovich et al., 2019). The “new” cases with the high-resolution UCPs reduced these overestimations markedly. For BNUA vs. BDNN run, the BIAS/RMSE of 10-m wind speed significantly decreased from 0.98/1.06 to 0.73/0.88 m s−1, and the correlation coefficient between simulation and observations increased from 0.04 to 0.13.
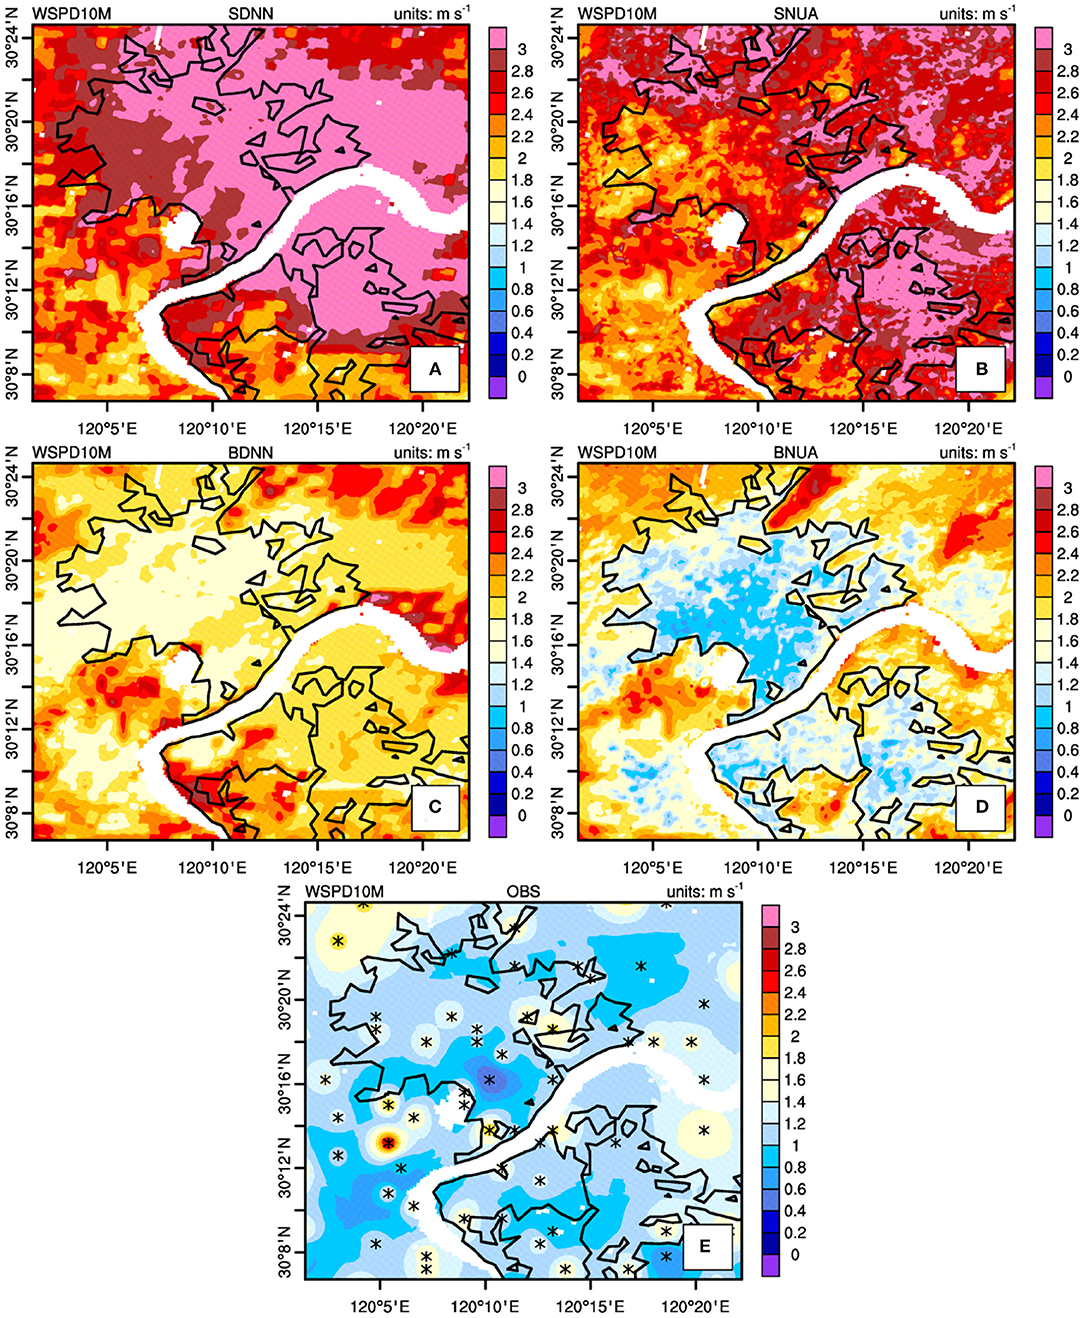
Figure 6. The same as Figure 4, but for daily mean wind speed at 10 m.
To comprehensively evaluate the improvements of the urban finescale forecasting by using the high-resolution UCPs, the BIAS, RMSE, and spatial correlation coefficient for the simulations in the whole domain and each urban center were painted in the Taylor diagrams (Figure 7). It can be found that the correlation coefficients and the RMSE for the “new” cases (blue for SNUA and black for BNUA) improved markedly when compared with the “default” cases (red for SDNN and green for BDNN). For the daily mean temperature at 2 m, the blue/black points were located closer to the x-axis and the zero point than the red/green points, which means better performance for the “new” cases.
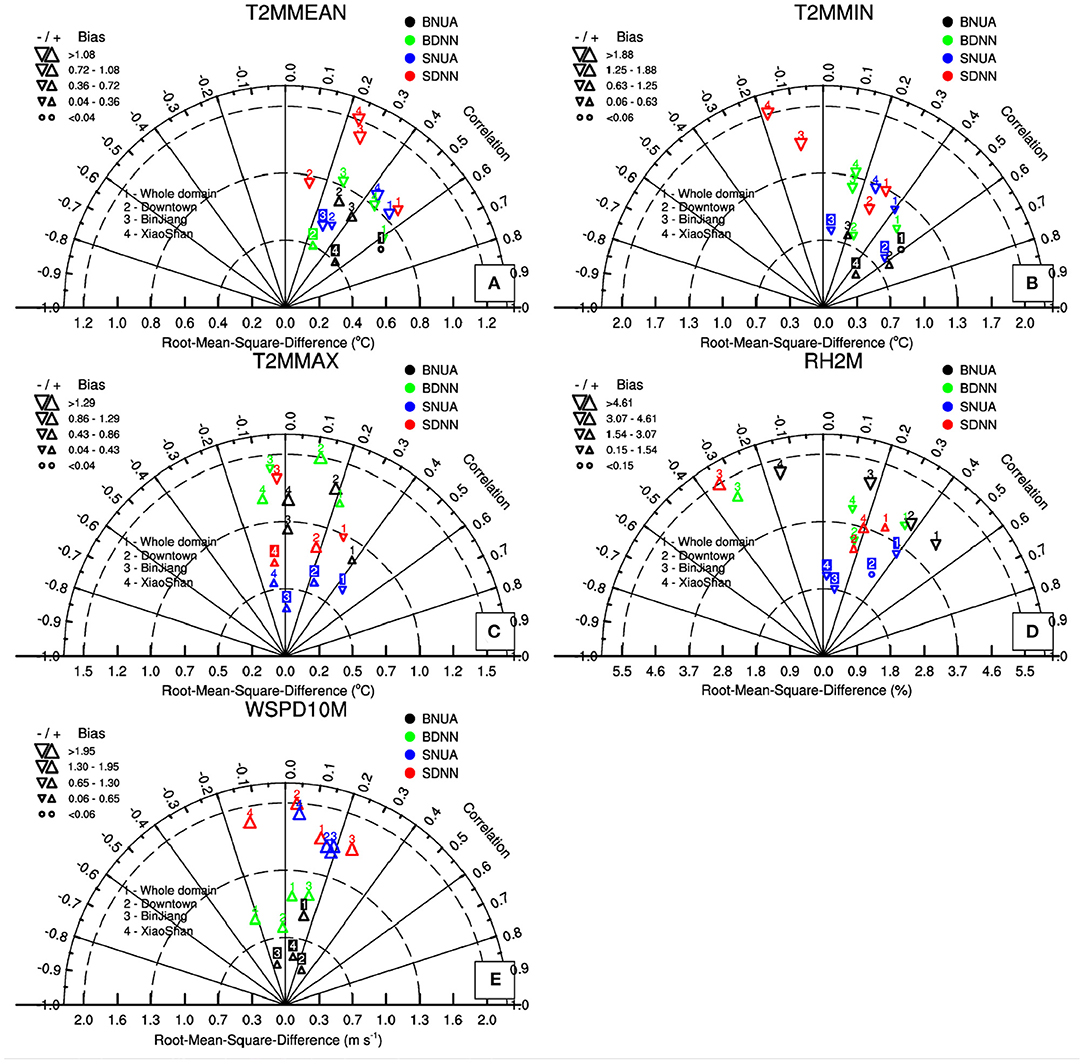
Figure 7. Verifying the WRF forecasts against the AWS observations. The diagrams presenting the bias (size of the triangle, upward/downward refers to positive/negative), the root-mean-square difference (distance from origin) and the spatial correlation coefficient (azimuthal scale) between any forecast and the observations for (A) daily mean temperature at 2 m; (B) daily minimum temperature at 2 m; (C) daily maximum temperature at 2 m; (D) daily mean relative humidity at 2 m; (E) daily mean wind speed at 10 m.
Figure 8 shows the simulated and observed diurnal variation of the 2-m temperature, 2-m relative humidity, and 10-m wind speed. During daytime (from 0700 BJT to 1700 BJT), all the simulations overestimated the near-surface temperature, especially for the BEP model. During nighttime (from 1800 BJT to 0500 BJT), the BNUA case shows the best performance, while the other three cases underestimated the 2-m temperature. In general, compared with the “default” cases, the “new” cases show improvement in simulating near-surface temperature during nighttime, which may benefit from better representation of nighttime UHI due to the application of high-resolution UCPs in the UCM models. Due to the complex building environment, the urban surface traps more shortwave radiation, which is kept in the urban canopy in the daytime, and releases more heat to the overlayer air at night, which caused more obvious UHI effect. Accompanied by the more obvious UHI effect, the lower 2-m relative humidity was derived from the “new” cases, which are closer to the observations than those from the “default” cases, especially at night (Figure 8B). As show in Figure 8C, there is no obvious diurnal change in the observed wind speed. The “default” cases overestimated the wind speed, especially by the SLUCM model in SDNN run. The “new” cases reduced this error markedly, which is probably associated with the better description of the windward coefficient in the urban area by using the frontal area density parameters, especially for BEP model.
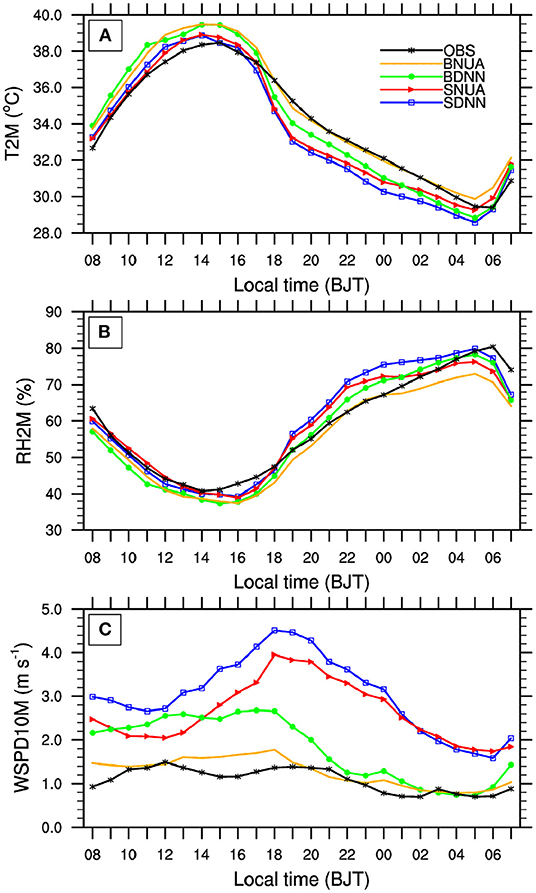
Figure 8. The diurnal variation of (A) temperature at 2 m, (B) relative humidity at 2 m, (C) wind speed at 10 m from 0000 UTC July 22, 2016 to 0000 UTC July 25, 2016 in downtown Hangzhou.
The RMSE of WRF forecasts derived from SNUA run at different resolutions are compared in Figure 9. It is worth noting that the RMSE decreased when refining the computation domain, particularly for the finest domains with grid sizes of 200 m. At such a fine resolution, the detail of the buildings can almost be solved by the model, which represents the geometrical characteristics of urban morphology well by the given UCPs and achieves better results.

Figure 9. Comparison of the root-mean-square error of WRF forecasts derived from SNUA run at different resolutions.
Five different urbanization scenarios were designed to estimate the relative effects of updating the land use using the high-resolution UCPs and considering the AHR on the UHI intensity. The SNUA run reproduced the UHI in the downtown Hangzhou with the maximum intensity at about 1.2◦C, which matched the observation quite well (Figures 10A,B). The difference between the SNUA and SNUN runs indicate the effect of considering the AHR on the UHI intensity (Figure 10C). The difference between the SNUA and SNNA runs represent the effect of using the UCPs on the UHI intensity (Figure 10D). The combined effects of considering the UCPs and AHR could be obtained from the difference between the SNUA and SNNN runs (Figure 10E). The differences between SNUA and SDNN runs could be attributable to the composite effect of updating the land use using the high-resolution UCPs and considering the AHR on the UHI intensity (Figure 10F). The simulations suggested that the contribution of considering the AHR, using the high-resolution UCPs, and their combination to the UHI intensity average in the downtown Hangzhou was about 0.01, 0.3, and 0.5◦C, respectively, while another 0.5◦C is contributed from the updating of land use data. These numbers indicated that the land use change has the largest impact, but using UCPs is a non-negligible factor in mesoscale simulations of urban climate.
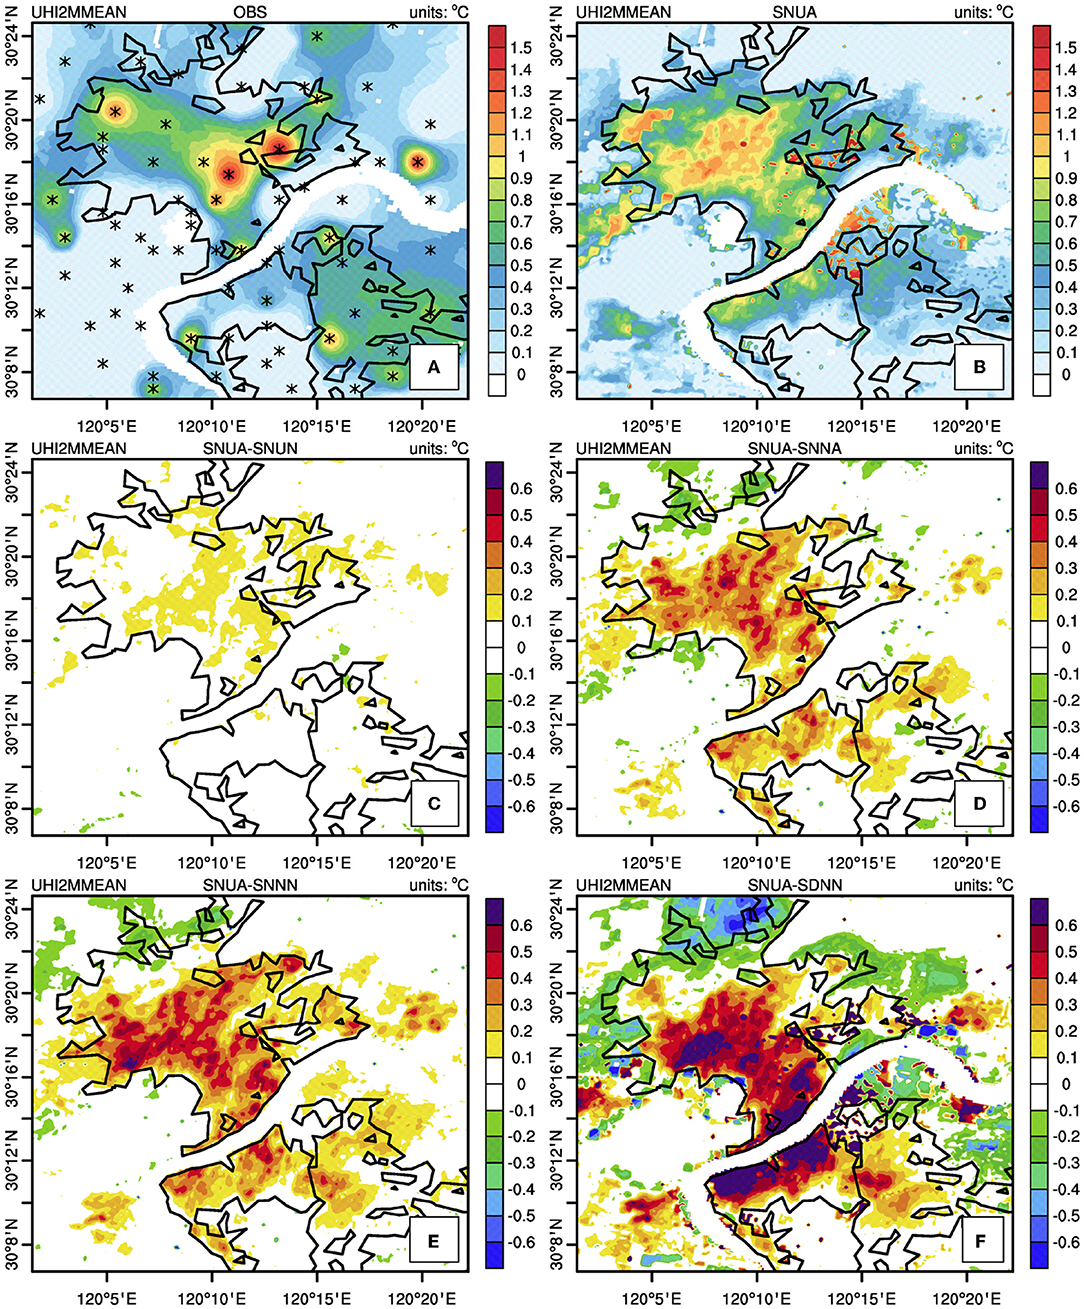
Figure 10. The (A) observed and simulated urban heat island (UHI) derived from (B) SNUA run and the difference of UHI between SNUA run and (C) SNUN, (D) SNNA, (E) SNNN, and (F) SDNN runs.
Figure 11 shows the differences of impervious fraction, zero plane displacement height, and roughness length above canyon between the SNUA run and the SNNA/SDNN run. It can be found that the real impervious fraction from the new updating land use data was not so large as the corresponding values in the look-up tables (Figures 9A,B). Moreover, the roughness length and zero plane displacement height increased notably when using the UCPs in the simulation. This can be explained by the complex building data that represents more reality urban environment, which produced larger roughness than the homogeneous surface in the simulations without the UCPs.
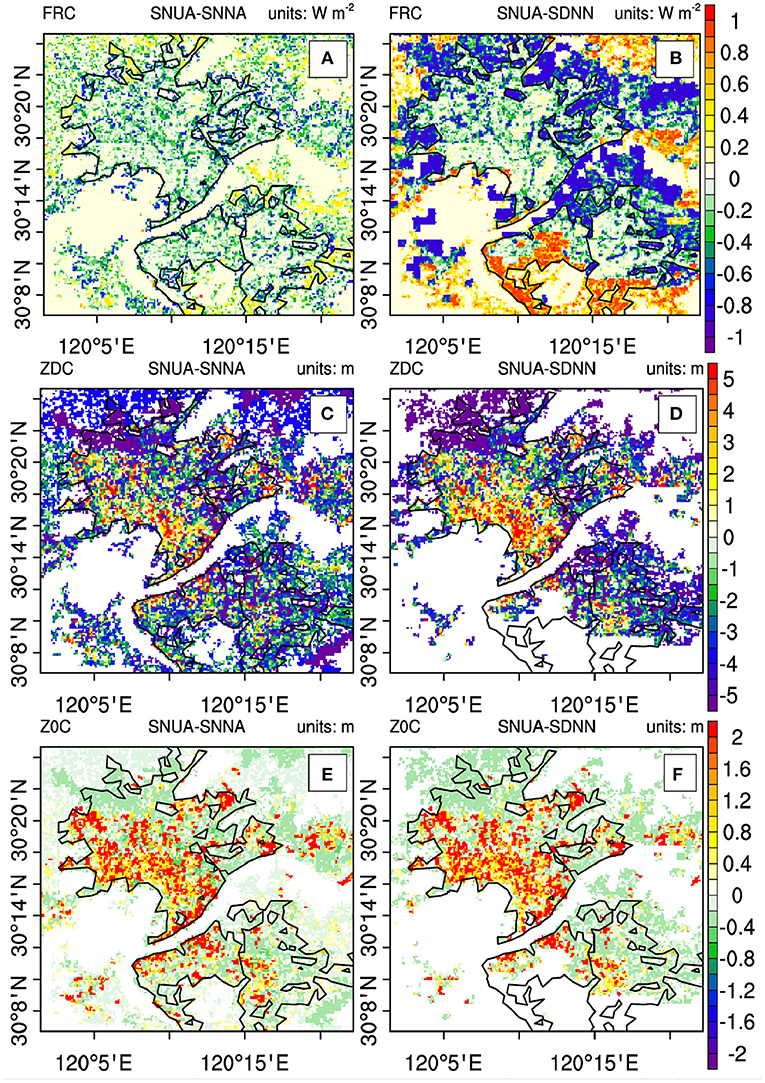
Figure 11. The difference in (A,B) impervious fraction (unitless), (C,D) zero plane displacement height (m), (E,F) roughness length above canyon (m) between SNUA run and SNNA (A,C,E) and SNUA run and SDNN run (B,D,F).
Accompanied by the increase in roughness, more shortwave radiation was trapped by the urban canopy and the ground in the daytime, and the surface skin temperature (TSK) increased clearly in the urban area (Figures 12A1–D1). At night, although the latent heat flux did not change much (Figures 12A3–D3), the sensible heat flux increased obviously (Figures 12A2-D2), and more heat flux was received from the ground in the urban area (Figures 12A4–D4). These additional energies are heating the near surface and, thus, resulting in a notable UHI effect (Figures 12A5–D5). These additional energies are heating the near surface and, thus, resulting in a notable UHI effect (Figures 12A4–D4). It is notable that the high-resolution UCPs played a significant role in affecting the UHI effect than the AHR, and it can be comparable with the effect of land use change.

Figure 12. Difference in (A1–D1) surface temperature(◦C), (A2–D2) sensible heat flux (W m−2), (A3–D3) latent heat flux (W m−2), (A4–D4) ground heat flux (W m−2), (A5–D5) temperature at 2m (◦C) at night between SNUA run to SNUN run (A1–A5), SNNA run (B1–B5), SNNN run (C1–C5), SDNN run (D1–D5).
As cities become larger, hotter, and more polluted, there is a pressing need to improve urban finescale forecasting to better prepare for weather, climate, and environment-related challenges. Moreover, to create a better urban microclimate, it is necessary to understand the role of urban morphology in the urban canopy layer in shaping urban microclimate. Based on vector-format building information, the gridded high-resolution (100 m/1 km) UCP datasets were derived and incorporated into the integrated WRF/urban modeling system with the SLUCM/BEP model to improve the urban finescale forecasting during a typical heat wave event in Hangzhou. The impacts of high-resolution UCPs on the WRF simulations were evaluated by a series of sensitivity experiments compared with observations. Two “default” cases (SDNN and BDNN runs) by the SLUCM and BEP models with the default MODIS-20-category land use data were conducted as the base runs. Two “new” cases (SNUA and BNUA runs) with the updated land use data and UCPs and a series of sensitive runs (SNNN, SNNA, and SNUN) were also performed to compare with the base runs.
The comparison of the “new” cases to the “default” cases shows that the high-resolution UCP data improves the model skill in simulating the spatial distributions and diurnal variations of 2-m temperature, 2-m relative humidity, and 10-m wind speed in the metropolitan region of Hangzhou, especially in the urban area. The underestimate of the UHI and “dry island” effects and the blocking effect on wind speed were reduced when the high-resolution UCP data were applied in the SLUCM/BEP models. More realistic urban morphological characteristics were adopted when refining the computation domain, which produced best results than the coarser domains. The sensitive experiments suggest that using UCPs played a significant role in affecting the UHI effect though changing the surface thermodynamic parameters (e.g., roughness length), hereafter increasing the sensible heat and surface heat flux, and finally resulting in a notable UHI effect.
Due to the large disparity and uncertainty in data for the WRF modeling grid, obtaining an accurate and up-to-date high-resolution UCP dataset is still a challenge in the urban finescale forecasting (Ching et al., 2009; Chen et al., 2011). The development of a comprehensive UCP dataset from the vector-format building data is an effective way in China, since this data can be well constructed and updated by the government such as the Surveying and Mapping Bureau. Although the improved forecasts for temperature, humidity, and wind speed were found in this study, more works still need to carry on this subject. Improvement on some parameterization used in the finescale forecasting is still needed, such as the underrepresentation of horizontal scalar fluxes in the Smagorinsky first-order closure scheme (Wyngaard, 2004), the development of a seamless turbulence scheme in PBL scheme (Boutle et al., 2014), etc. In addition, an obvious next step would be to evaluate the forecast system at a long-time scale, which should give a robust result.
The original contributions presented in the study are included in the article/supplementary material, further inquiries can be directed to the corresponding author/s.
FC and XY contributed to conception and design of the study and wrote the first draft of the manuscript. BY organized the database. MW performed the statistical analysis. All authors contributed to manuscript revision, read, and approved the submitted version.
This study was supported by the National Natural Science Foundation of China (Grants 42030610 and 41971019), Science and Technology Project of Zhejiang Province (LGF20D050001 and LGF21D050001), and Meteorological Science and Technology Project of Zhejiang Meteorological Bureau (2019ZD11 and 2021YYZX06).
The authors declare that the research was conducted in the absence of any commercial or financial relationships that could be construed as a potential conflict of interest.
All claims expressed in this article are solely those of the authors and do not necessarily represent those of their affiliated organizations, or those of the publisher, the editors and the reviewers. Any product that may be evaluated in this article, or claim that may be made by its manufacturer, is not guaranteed or endorsed by the publisher.
Arnfield, A. J (2003). Two decades of urban climate research: a review of turbulence, exchanges of energy and water, and the urban heat island. Int. J. Climatol. 23, 1–26. doi: 10.1002/joc.859
Baklanov, A., Grimmond, C. S. B., Carlson, D., Terblanche, D., Tang, X., Bouchet, V., et al. (2018). From urban meteorology, climate and environment research to integrated city services. Urban Clim. 23, 330–341. doi: 10.1016/j.uclim.2017.05.004
Baklanov, A., Molina, L. T., and Gauss, M. (2016). Megacities, air quality and climate. Atmos. Environ. 126, 235–249. doi: 10.1016/j.atmosenv.2015.11.059
Bauer, P., Thorpe, A., and Brunet, G. (2015). The quiet revolution of numerical weather prediction. Nature 525, 47–55. doi: 10.1038/nature14956
Bougeault, P., and Lacarrere, P. (1989). Parameterization of orography-induced turbulence in a mesobeta–scale model. Monthly Weather Review, 117, 1872-1890. doi: 10.1175/1520-0493(1989)117<1872:POOITI>2.0.CO;2
Boutle, I. A., Eyre, J. E. J., and Lock, A. P. (2014). Seamless stratocumulus simulation across the turbulent gray zone. Monthly Weather Rev. 142, 1655–1668. doi: 10.1175/MWR-D-13-00229.1
Chen, F., Kusaka, H., Bornstein, R., Ching, J., Grimmond, C. S. B., Grossman-Clarke, S., et al. (2011). The integrated WRF/urban modelling system: development, evaluation, and applications to urban environmental problems. Int. J. Climatol. 31, 273–288. doi: 10.1002/joc.2158
Chen, F., Mitchell, K., Schaake, J., Xue, Y., Pan, H.-L., Koren, V., et al. (1996). Modeling of land-surface evaporation by four schemes and comparison With FIFE observations. J. Geophys. Res. D Atmos. 101, 7251–7268. doi: 10.1029/95JD02165
Chen, F., Yang, X., and Wu, J. (2016). Simulation of the urban climate in a Chinese megacity with spatially heterogeneous anthropogenic heat data. J. Geophys. Res. Atmos. 121, 5193–5212. doi: 10.1002/2015JD024642
Chen, F., Yang, X., and Zhu, W. (2014). WRF simulations of urban heat island under hot-weather synoptic conditions: the case study of Hangzhou City, China. Atmos. Res. 138, 364–377. doi: 10.1016/j.atmosres.2013.12.005
Chen, Q., Yang, X., Ouyang, Z., Zhao, N., Jiang, Q., Ye, T., et al. (2020). Estimation of anthropogenic heat emissions in China using Cubist with points-of-interest and multisource remote sensing data. Environ. Pollut. 266, 115183. doi: 10.1016/j.envpol.2020.115183
Ching, J., Brown, M., McPherson, T., Burian, S., Chen, F., Cionco, R., et al. (2009). National urban database and access portal tool. Bull. Am. Meteorol. Soc. 90, 1157–1168. doi: 10.1175/2009BAMS2675.1
Ching, J., Mills, G., Bechtel, B., See, L., Feddema, J., Wang, X., et al. (2018). WUDAPT: an urban weather, climate, and environmental modeling infrastructure for the anthropocene. Bull. Am. Meteorol. Soc. 99, 1907–1924. doi: 10.1175/BAMS-D-16-0236.1
Dee, D. P., Uppala, S. M., Simmons, A. J., Berrisford, P., Poli, P., Kobayashi, S., et al. (2011). The ERA-Interim reanalysis: configuration and performance of the data assimilation system. Q. J. R. Meteorol. Soc. 137, 553–597. doi: 10.1002/qj.828
Grimmond, S (2007). Urbanization and global environmental change: local effects of urban warming. Geogr. J. 173, 83–88. doi: 10.1111/j.1475-4959.2007.232_3.x
Hao, L., Huang, X., Qin, M., Liu, Y., Li, W., and Sun, G. (2018). Ecohydrological processes explain urban dry island effects in a wet region, Southern China. Water Resour. Res. 54, 6757–6771. doi: 10.1029/2018WR023002
He, X., Li, Y., Wang, X., Chen, L., Yu, B., Zhang, Y., et al. (2019). High-resolution dataset of urban canopy parameters for Beijing and its application to the integrated WRF/Urban modelling system. J. Clean. Prod. 208, 373–383. doi: 10.1016/j.jclepro.2018.10.086
Heaviside, C., Macintyre, H., and Vardoulakis, S. (2017). The urban heat island: implications for health in a changing environment. Curr. Environ. Health Rep. 4, 296–305. doi: 10.1007/s40572-017-0150-3
Iacono, M. J., Delamere, J. S., Mlawer, E. J., Shephard, M. W., Clough, S. A., and Collins, W. D. (2008). Radiative forcing by long-lived greenhouse gases: calculations with the AER radiative transfer models. J. Geophys. Res. Atmos. 113:D13103. doi: 10.1029/2008JD009944
Janković, V (2013). A historical review of urban climatology and the atmospheres of the industrialized world. Wiley Interdiscip. Rev. Clim. Change 4, 539–553. doi: 10.1002/wcc.244
Jiménez, P. A., Dudhia, J., González-Rouco, J. F., Navarro, J., Montávez, J. P., and García-Bustamante, E. (2012). A revised scheme for the WRF surface layer formulation. Monthly Weather Rev. 140, 898–918. doi: 10.1175/MWR-D-11-00056.1
Kain, J. S., and Kain, J. (2004). The Kain - Fritsch convective parameterization: an update. J. Appl. Meteorol. 43, 170–181. doi: 10.1175/1520-0450(2004)043<0170:TKCPAU>2.0.CO;2
Kristovich, D. A. R., Takle, E., Young, G. S., and Sharma, A. (2019). 100 years of progress in mesoscale planetary boundary layer meteorological research. Meteorol. Monogr. 59, 19.11–19.41. doi: 10.1175/AMSMONOGRAPHS-D-18-0023.1
Kusaka, H., and Kimura, F. (2004). Coupling a single-layer urban canopy model with a simple atmospheric model: Impact on urban heat island simulation for an idealized case. J. Meteorol. Soc. Jpn. 82, 67–80. doi: 10.2151/jmsj.82.67
Kusaka, H., Kondo, H., Kikegawa, Y., and Kimura, F. (2001). A simple single-layer urban canopy model for atmospheric models: comparison with multi-layer and slab models. Boundary Layer Meteorol. 101, 329–358. doi: 10.1023/A:1019207923078
Kwok, Y. T., and Ng, E. Y. Y. (2021). Trends, topics, and lessons learnt from real case studies using mesoscale atmospheric models for urban climate applications in 2000–2019. Urban Clim. 36, 100785. doi: 10.1016/j.uclim.2021.100785
Li, D., Bou-Zeid, E., Baeck, M. L., Jessup, S., and Smith, J. A. (2013). Modeling land surface processes and heavy rainfall in urban environments: sensitivity to urban surface representations. J. Hydrometeorol. 14, 1098–1118. doi: 10.1175/JHM-D-12-0154.1
Lim, K.-S., and Hong, S.-Y. (2010). Development of an effective double-moment cloud microphysics scheme with prognostic cloud condensation nuclei (CCN) for weather and climate models. Monthly Weather Rev. 138, 1587–1612. doi: 10.1175/2009MWR2968.1
Lin, Y., Xu, J., and Zhang, F. (2013). Analysis of the July 2013 atmospheric circulation and weather. Meteor Mon 39, 1379–1384. doi: 10.7519/j.issn.1000-0526.2013.10.018
Liu, Y., Chen, F., Warner, T., and Basara, J. (2006). Verification of a mesoscale data-assimilation and forecasting system for the Oklahoma City area during the joint urban 2003 field project. J. Appl. Meteorol. Climatol. 45, 912–929. doi: 10.1175/JAM2383.1
Luo, M., and Lau, N.-C. (2018). Increasing heat stress in urban areas of Eastern China: acceleration by urbanization. Geophys. Res. Lett. 45, 13060–13069. doi: 10.1029/2018GL080306
Luo, M., and Lau, N.-C. (2019). Urban expansion and drying climate in an urban agglomeration of East China. Geophys. Res. Lett. 46, 6868–6877. doi: 10.1029/2019GL082736
Luo, M., and Lau, N.-C. (2021). Increasing human-perceived heat stress risks exacerbated by urbanization in China: a comparative study based on multiple metrics. Earths Future 9, e2020EF001848. doi: 10.1029/2020EF001848
Macdonald, R. W., Griffiths, R. F., and Hall, D. J. (1998). An improved method for the estimation of surface roughness of obstacle arrays. Atmos. Environ. 32, 1857–1864. doi: 10.1016/S1352-2310(97)00403-2
Martilli, A., Clappier, A., and Rotach, M. W. (2002). An urban surface exchange parameterisation for mesoscale models. Boundary Layer Meteorol. 104, 261–304. doi: 10.1023/A:1016099921195
Masson, V., Heldens, W., Bocher, E., Bonhomme, M., Bucher, B., Burmeister, C., et al. (2020a). City-descriptive input data for urban climate models: model requirements, data sources and challenges. Urban Clim. 31, 100536. doi: 10.1016/j.uclim.2019.100536
Masson, V., Lemonsu, A., Hidalgo, J., and Voogt, J. (2020b). Urban climates and climate change. Annu. Rev. Environ. Resour. 45, 411–444. doi: 10.1146/annurev-environ-012320-083623
Miao, S., Chen, F., LeMone, M. A., Tewari, M., Li, Q., and Wang, Y. (2009). An observational and modeling study of characteristics of urban heat island and boundary layer structures in Beijing. J. Appl. Meteorol. Climatol. 48, 484–501. doi: 10.1175/2008JAMC1909.1
Monaghan, A. J., Hu, L., Brunsell, N. A., Barlage, M., and Wilhelmi, O. V. (2014). Evaluating the impact of urban morphology configurations on the accuracy of urban canopy model temperature simulations with MODIS. J. Geophys. Res. Atmos. 119, 2013JD021227. doi: 10.1002/2013JD021227
Niu, G.-Y., Yang, Z.-L., Mitchell, K. E., Chen, F., Ek, M. B., Barlage, M., et al. (2011). The community Noah land surface model with multiparameterization options (Noah-MP): 1. Model description and evaluation with local-scale measurements. J. Geophys. Res. Atmos. 116:D12109. doi: 10.1029/2010JD015139
Otte, T. L., Lacser, A., Dupont, S., and Ching, J. K. S. (2004). Implementation of an urban canopy parameterization in a mesoscale meteorological model. J. Appl. Meteorol. 43, 1648–1665. doi: 10.1175/JAM2164.1
Peng, J (2014). An investigation of the formation of the heat wave in southern China in Summer 2013 and the relevant abnormal subtropical high activities. Atmos. Oceanic Sci. Lett. 7, 286–290. doi: 10.1080/16742834.2014.11447177
Quan, W., and He, L. (2016). Analysis of the July 2016 atmospheric circulation and weather. Meteor Mon. 42, 1283–1288. doi: 10.7519/j.issn.1000-0526.2016.10.014
Ronda, R. J., Steeneveld, G. J., Heusinkveld, B. G., Attema, J. J., and Holtslag, A. A. M. (2017). Urban finescale forecasting reveals weather conditions with unprecedented detail. Bull. Am. Meteorol. Soc. 98, 2675–2688. doi: 10.1175/BAMS-D-16-0297.1
Salamanca, F., Krpo, A., Martilli, A., and Clappier, A. (2010). A new building energy model coupled with an urban canopy parameterization for urban climate simulations-part I. formulation, verification, and sensitivity analysis of the model. Theor. Appl. Climatol. 99, 331–344. doi: 10.1007/s00704-009-0142-9
Salamanca, F., Martilli, A., Tewari, M., and Chen, F. (2011). A study of the urban boundary layer using different urban parameterizations and high-resolution urban canopy parameters with WRF. J. Appl. Meteorol. Climatol. 50, 1107–1128. doi: 10.1175/2010JAMC2538.1
Santamouris, M., Cartalis, C., Synnefa, A., and Kolokotsa, D. (2015). On the impact of urban heat island and global warming on the power demand and electricity consumption of buildings—A review. Energy Build. 98, 119–124. doi: 10.1016/j.enbuild.2014.09.052
Seto, K. C., and Shepherd, J. M. (2009). Global urban land-use trends and climate impacts. Curr. Opin. Environ. Sustain. 1, 89–95. doi: 10.1016/j.cosust.2009.07.012
Shen, C., Chen, X., Dai, W., Li, X., Wu, J., Fan, Q., et al. (2019). Impacts of high-resolution urban canopy parameters within the WRF model on dynamical and thermal fields over Guangzhou, China. J. Appl. Meteorol. Climatol. 58, 1155–1176. doi: 10.1175/JAMC-D-18-0114.1
Skamarock, W. C.J. B , Klemp, J., Dudhia, D. O., Gill, D. M., Barker, W., et al. (2005). A description of the Advanced Research WRF Version 2. (No. NCAR/TN-468+STR). Boulder, CO: NCAR Technical Note.
Skamarock, W. C., Klemp, J. B., Dudhia, J., Gill, D. O., Liu, Z., Berner, J., et al. (2019). A Description of the Advanced Research WRF Model Version 4 (No. NCAR/TN-556+STR).
Stewart, I. D (2011). A systematic review and scientific critique of methodology in modern urban heat island literature. Int. J. Climatol. 31, 200–217. doi: 10.1002/joc.2141
Sun, Y., Zhang, N., Miao, S., Kong, F., Zhang, Y., and Li, N. (2021). Urban morphological parameters of the main cities in china and their application in the WRF model. J. Adv. Model. Earth Syst. 13, e2020MS002382. doi: 10.1029/2020MS002382
Talbot, C., Bou-Zeid, E., and Smith, J. (2012). Nested mesoscale large-eddy simulations with WRF: performance in real test cases. J. Hydrometeorol. 13, 1421–1441. doi: 10.1175/JHM-D-11-048.1
Tan, J., Zheng, Y., Tang, X., Guo, C., Li, L., Song, G., et al. (2010). The urban heat island and its impact on heat waves and human health in Shanghai. Int. J. Biometeorol. 54, 75–84. doi: 10.1007/s00484-009-0256-x
Wang, J., and Yan, Z.-W. (2016). Urbanization-related warming in local temperature records: a review. Atmos. Oceanic Sci. Lett. 9, 129–138. doi: 10.1080/16742834.2016.1141658
Wong, M. M. F., Fung, J. C. H., Ching, J., Yeung, P. P. S., Tse, J. W. P., Ren, C., et al. (2019). Evaluation of uWRF performance and modeling guidance based on WUDAPT and NUDAPT UCP datasets for Hong Kong. Urban Clim. 28, 100460. doi: 10.1016/j.uclim.2019.100460
Wyngaard, J. C (2004). Toward numerical modeling in the “terra incognita”. J. Atmos. Sci. 61, 1816–1826. doi: 10.1175/1520-0469(2004)061<1816:TNMITT>2.0.CO;2
Xu, J., Deng, Z., and Chen, M. (2009). A summary of studying on characteristics of high temperature and heat wave damage in China. J. Arid Meteorol. 27, 163–167.
Yang, B., Yang, X., Leung, L. R., Zhong, S., Qian, Y., Zhao, C., et al. (2019). Modeling the impacts of urbanization on summer thermal comfort: the role of urban land use and anthropogenic heat. J. Geophys. Res. Atmos. 124, 6681–6697. doi: 10.1029/2018JD029829
Ye, T., Zhao, N., Yang, X., Ouyang, Z., Liu, X., Chen, Q., et al. (2019). Improved population mapping for China using remotely sensed and points-of-interest data within a random forests model. Sci. Total Environ. 658, 936–946. doi: 10.1016/j.scitotenv.2018.12.276
Keywords: urban canopy parameters, finescale forecasting, WRF/urban modeling system, urban heat island, Hangzhou
Citation: Chen F, Yu B, Wu M and Yang X (2022) Improved Urban Finescale Forecasting During a Heat Wave by Using High-Resolution Urban Canopy Parameters. Front. Clim. 3:771441. doi: 10.3389/fclim.2021.771441
Received: 06 September 2021; Accepted: 21 December 2021;
Published: 14 February 2022.
Edited by:
Umberto Berardi, Ryerson University, CanadaReviewed by:
Guicai Ning, The Chinese University of Hong Kong, ChinaCopyright © 2022 Chen, Yu, Wu and Yang. This is an open-access article distributed under the terms of the Creative Commons Attribution License (CC BY). The use, distribution or reproduction in other forums is permitted, provided the original author(s) and the copyright owner(s) are credited and that the original publication in this journal is cited, in accordance with accepted academic practice. No use, distribution or reproduction is permitted which does not comply with these terms.
*Correspondence: Xuchao Yang, eWFuZ3h1Y2hhb0B6anUuZWR1LmNu
Disclaimer: All claims expressed in this article are solely those of the authors and do not necessarily represent those of their affiliated organizations, or those of the publisher, the editors and the reviewers. Any product that may be evaluated in this article or claim that may be made by its manufacturer is not guaranteed or endorsed by the publisher.
Research integrity at Frontiers
Learn more about the work of our research integrity team to safeguard the quality of each article we publish.