
95% of researchers rate our articles as excellent or good
Learn more about the work of our research integrity team to safeguard the quality of each article we publish.
Find out more
ORIGINAL RESEARCH article
Front. Clim. , 29 November 2021
Sec. Predictions and Projections
Volume 3 - 2021 | https://doi.org/10.3389/fclim.2021.770785
This article is part of the Research Topic Multi-Scale Air-Sea Variability and its Application in Indo-Pacific Regions View all 8 articles
 Tomomichi Ogata*
 Yuya Baba
In this study, we examine the tropical cyclone (TC) activity over the western North Pacific (WNP) in 2018–2020 and its relationship with planetary scale convection and circulation anomalies, which play an important role for TC genesis. To determine the sea surface temperature (SST)-forced atmospheric variability, atmospheric general circulation model (AGCM) ensemble simulations are executed along with the observed SST. For AGCM experiments, we use two different convection schemes to examine uncertainty in convective parameterization and robustness of simulated atmospheric response. The observed TC activity and genesis potential demonstrated consistent features. In our AGCM ensemble simulations, the updated convection scheme improves the simulation ability of observed genesis potential as well as planetary scale convection and circulation features, e.g., in September–October–November (SON), a considerable increase in the genesis potential index over the WNP in SON 2018, WNP in SON 2019, and South China Sea (SCS) in SON 2020, which were not captured in the Emanuel scheme, have been simulated in the updated convection scheme.
Tropical cyclones (TCs) are important extreme weather events that has a socioeconomic impact on populated areas through strong winds and heavy precipitation. In particular, over East Asia and North America, TCs commonly cause socioeconomic damage in regions where they make landfall. For example, Typhoon Haiyan in 2013 made landfall in The Philippines as an extreme TC with a wind speed of >80 m/s; >7,000 people were estimated as either dead or missing. In 2019, Typhoon Hagibis caused an anomalous rainfall of >1,000 mm between 10 and 13 October in Japan, leading to the death of ~100 people and the loss of $US 5 billion by flooding. In the autumn of 2020, frequent TC activity caused considerable flooding over Vietnam, thus leaving ~200 people dead and resulting in the loss of $US 1.5 billion. Therefore, to improve their prediction, an accurate understanding of the regional features of TC activity is required (Li and Zhou, 2018; Roberts et al., 2018).
Recent variations in TC activity over the western North Pacific (WNP) are listed below. In 2018, boreal summer had high TC activity because of high convective activity over the WNP (18 TCs; climatological value during 1959–2019 is 11.4 from https://www.metoc.navy.mil/jtwc/products/atcr/2019atcr.pdf); however, the TC activity decreased during the fall season because of suppressed convection (8 TCs; climatological value is 11.3). In 2019, TC activity during the boreal summer was almost neutral (10 TCs) but it became active during boreal fall (16 TCs). In 2020, TC activity was slightly low during boreal summer (9 TCs); however, it became neutral during boreal fall (12 TCs).
Recently, studies reported various types of tropical climate modes such as El Niño and Indian Ocean Dipole (IOD) modes (Saji et al., 1999), and El Niño Modoki (Ashok et al., 2007). These climate modes influence both TC genesis and interannual TC activity variation over the tropical Pacific (Chen and Tam, 2010; Kim et al., 2011). For example, the canonical El Niño events (SST warming over the eastern equatorial Pacific; Niño 3 index is conventionally used as area average of 5°S−5°N, 90–150°W) contribute to an east–west shift in the TC frequency (TCF), which captures TC genesis and subsequent development. However, the El Niño Modoki events led to a basin-wide increase in TCF over the WNP in observations (Kim et al., 2011). Furthermore, the contribution of the Pacific meridional mode (PMM: Chiang and Vimont, 2004) has been investigated (Zhang et al., 2016; Gao et al., 2018; Qian et al., 2019; Takaya, 2019).
To examine the atmospheric response to the sea surface temperature (SST) anomaly, the atmospheric general circulation model (AGCM) experiment is a useful tool (Gates et al., 1999). However, most AGCMs have large uncertainty for convective parameterizations (Baba, 2019). Therefore, recent studies attempted to improve AGCM cloud parameterizations (Baba, 2019, 2021). Moreover, most previous studies focused on boreal summer and fall together (June through November; JJASON); thus, the detailed seasonality of interannual TC activity is not completely understood. The seasonal migration of Asian monsoon may cause some shift in the relationship between TC activity and large-scale environmental fields, e.g., the delayed Indian Ocean warming after strong winter El Niño events causes the TCF to decrease during the following summer (Du et al., 2011; Takaya et al., 2017) and increase over the South China Sea during fall (Ueda et al., 2018). The seasonality of the Asian monsoon may affect the simulation skill of AGCMs because the relationship between SST and the Asian monsoon is expected to be controlled by seasonality.
In this study, to focus how AGCM simulation captures recent extreme climate variability over the East Asia, we examined the TC activity over the WNP in 2018–2020 and its relationship with planetary scale convection and circulation anomalies, which play an important role in TC genesis. To extract impacts of climate modes (El Niño, IOD, and El Niño Modoki) on the SST-forced atmospheric variability, ensemble AGCM simulations forced with the observed SST are conducted. In AGCM experiments, we used two different convection schemes to examine the uncertainty of convective parameterization and robustness of the simulated atmospheric response.
In this study, we use the seasonal climatology of TCF, which is defined as the number of TC tracks (segment of the TC trajectory) that fall within 5 × 5° bins in a season, computed from observations made available by the Japan Meteorological Agency (JMA; data can be found at https://www.jma.go.jp/jma/jma-eng/jma-center/rsmc-hp-pub-eg/besttrack.html). For comparison with simulated climatological and year-to-year environmental fields, we use the NCEP/NCAR Reanalysis 1 dataset (Kalnay et al., 1996).
Moreover, we analyze the AMIP-like (AMIP; Atmospheric Model Intercomparison Project; Gates et al., 1999) 5-member ensemble simulations performed by AGCM for the Earth Simulator (AFES; Ohfuchi et al., 2004; Kuwano-Yoshida et al., 2010; and references therein) for the 1982–2020 period. In AFES, the Emanuel convection scheme (Emanuel, 1991; Emanuel and Živković-Rothman, 1999; Peng et al., 2004) and stratiform cloud schemes based on the updated planetary boundary layer scheme (Kuwano-Yoshida et al., 2010) are used. This AFES version is configured at a horizontal resolution of T42 (~280 km) with 48 vertical levels extending from the surface up to ~3 hPa. Each ensemble simulation is driven using randomly different initial conditions from spin-up AGCM experiment (monthly climatological SST/ICE condition) but under the same observed SST and sea-ice forcing from the monthly Optimally Interpolated Sea Surface Temperature (OISST) analysis (Reynolds et al., 2007).
Using AFES, recent studies by Baba (2019, 2021) demonstrated that the updated convection scheme (spectral cumulus parameterization, spectral scheme hereafter) improves the excessive TC genesis bias by reducing the temperature and humidity bias from the lower to upper troposphere. Therefore, to compare with the Emanuel convection scheme (that has been traditionally adopted in AFES), this updated spectral convection scheme was used.
Figure 1 shows the observed TCF anomaly during 2018–2020 over the WNP during boreal summer (June–July–August (JJA) in the left panels) and autumn (September–October–November (SON) in the right panels). In JJA, a significant positive TCF anomaly can be seen in the WNP in 2018 (Figure 1A). The spatial distribution of the positive TCF anomaly area in Figure 1A shows that the frequent TC genesis over the southeast quadrant of the WNP (~5–20°N, 140–160°E) affects the significant increase in TCF over the northwest quadrant (20–35°N, 120–140°E). In 2019, the observed TCF anomaly over the WNP shows an almost neutral state (Figure 1B). In 2020, a weak but significantly negative TCF anomaly appears over the WNP (Figure 1C). To summarize, as mentioned in the Introduction, these observed TCF anomalies during the 2018–2020 summer JJA seem consistent with the year-to-year TC activities over the WNP.
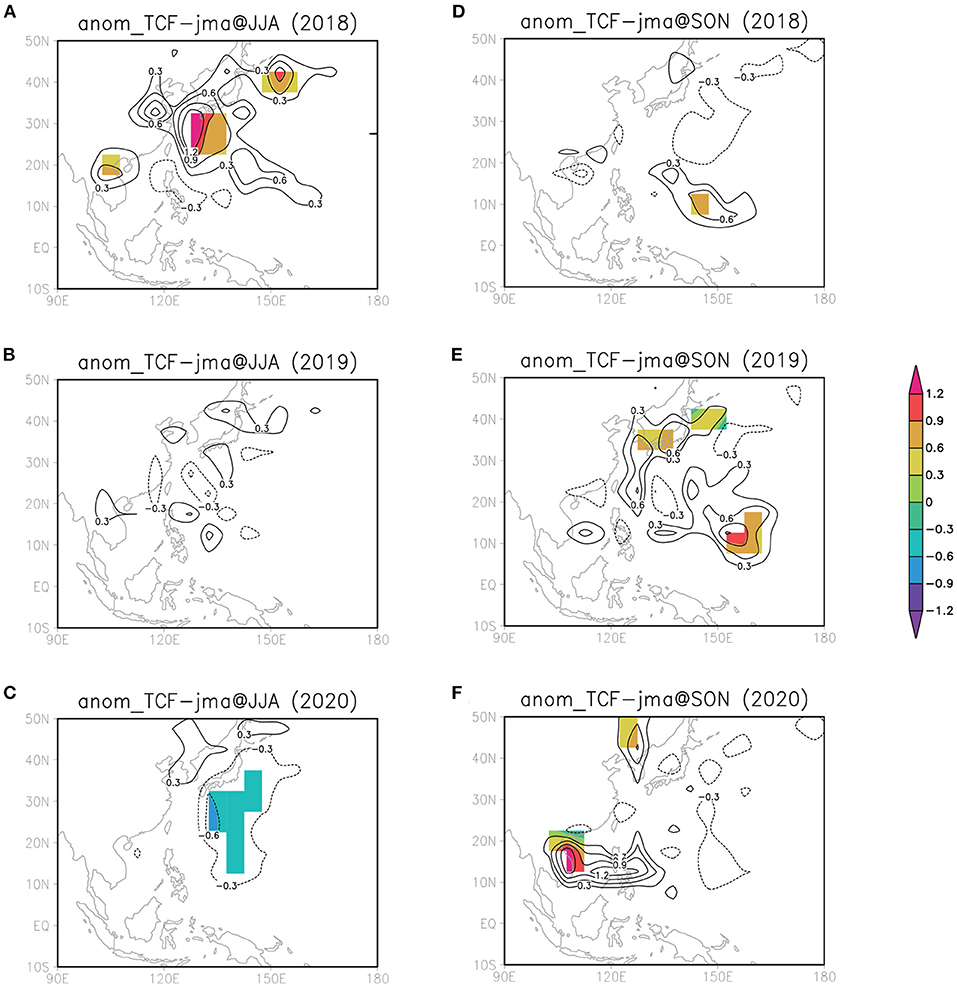
Figure 1. Observed TCF anomaly (defined as occurrence in 5 × 5° bins, units are TCs per season) during 2018–2020 over the WNP during (A–C) boreal summer [June–July–August (JJA)] and (D–F) autumn [September–October–November (SON) in the right panels]. Regions with exceeding ±1σ are shaded.
With seasonal migration from summer (JJA) to autumn (SON), the TCF anomaly distribution features changed. In 2018, a positive TCF signal appeared over the WNP; however, it seems less significant compared with JJA (Figure 1D). In Figure 1D, the positive TCF area is limited only to the southeast quadrant of the WNP. In 2019, a significant TCF increase can be observed in the southeast quadrant (Figure 1E). Furthermore, frequent TC activity can be observed over Japan. According to the JMA report, 10 TCs approached Japan in SON 2019. This number is significantly high compared with the climatological value (~5.5 TCs). In 2020, the TCF anomaly is almost neutral over the WNP (Figure 1F); however, there is a significant positive TCF anomaly over the South China Sea (SCS). As reported in the Introduction, such frequent TC activity over the SCS caused severe flooding in Vietnam.
Previous studies reported that TC distribution is controlled by mean atmospheric conditions (Emanuel and Nolan, 2004), e.g., the weak vertical wind shear and cyclonic vorticity in the lower troposphere and high relative humidity in the mid-troposphere are all favorable for TC genesis (Gray, 1975). For TC intensity, the maximum potential intensity (MPI) based on the SST and convective available potential energy has been defined (Emanuel, 1995; Bister and Emanuel, 2002). For TC genesis, the genesis potential index (GPI) was proposed using four parameters (Emanuel and Nolan, 2004): the relative humidity at 600 hPa, the relative vorticity at 850 hPa (from which the TCF contribution is removed), the MPI, and the vertical wind shear. We used this Emanuel and Nolan (2004) GPI.
To examine whether the mean atmospheric condition is favorable to TC genesis, Figure 2 shows the observed and AFES-simulated GPI anomaly during 2018–2020 over the WNP during boreal summer (JJA). In JJA, a significant positive GPI anomaly can be observed in the WNP in 2018 (Figure 2A). The spatial distribution of the positive GPI anomaly area in Figure 2A suggests an increased TC genesis frequency over the east of The Philippines (10–25°N, 120–150°E), and this is consistent with the TCF increase (Figure 1A). In 2019, the observed GPI anomaly over the WNP has not been clear, thus showing almost neutral state (Figure 2B). In 2020, a significant negative GPI anomaly appears over the WNP (Figure 2C). To summarize, as shown in Figure 1, this observed GPI anomaly during the 2018–2020 summer (JJA) seems consistent with the year-to-year TC activities over the WNP.
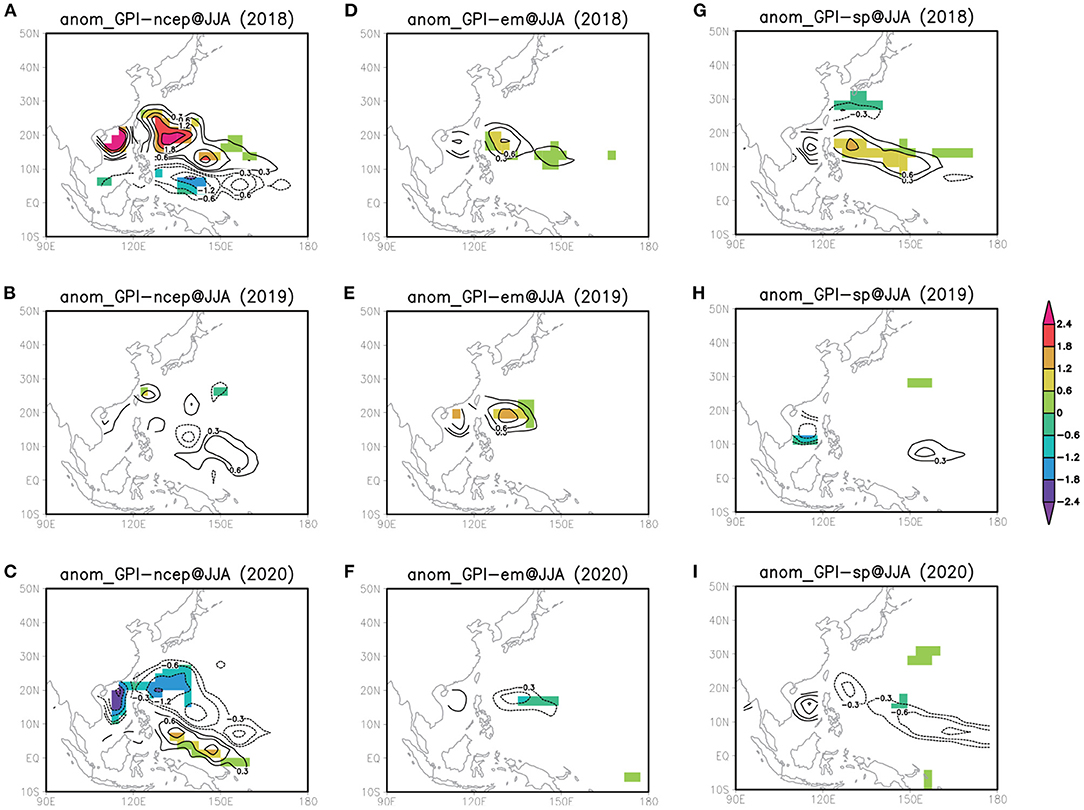
Figure 2. (A–C) Observed (NCEP reanalysis), (D–F) Emanuel scheme AFES, and (G–I) spectral scheme (Baba, 2019, 2021) AFES simulated genesis potential index (GPI) anomaly during 2018–2020 over the WNP during boreal summer (JJA). Regions with exceeding ±1σ are shaded.
The observed GPI anomalies follow the features of the TC activity (Figure 1). In the next step, we examine the SST-forced atmospheric variability using AGCM simulations. Figures 2D–F shows a simulated GPI anomaly during 2018–2020 over the WNP in the Emanuel scheme AFES. In JJA, a weak but significant, positive GPI anomaly can be observed in the WNP in 2018 (Figure 2D). In 2019, a simulated GPI anomaly over the WNP shows significant positivity (Figure 2E), which is different from the observation showing almost a neutral state (Figure 2B). In 2020, a weak but significantly negative GPI anomaly appears over the WNP (Figure 2F).
As reported in section Model and Data, for comparison with the Emanuel convection scheme (that has been traditionally adopted in AFES; results of Figures 2D–F), the spectral scheme (Baba, 2019, 2021) was used. Figures 2G–I show a simulated GPI anomaly between 2018 and 2020 over the WNP in spectral scheme AFES. In JJA, a weak but significantly positive GPI anomaly can be seen in the WNP in 2018 (Figure 2G). This anomaly agrees with the observation (Figure 2A) and Emanuel scheme AFES (Figure 2D). In 2019, a simulated GPI anomaly over the WNP is almost neutral (Figure 2H), which is similar to our observation (Figure 2B). In 2020, a negative GPI anomaly appears over the WNP (Figure 2I). Although the signal appears more equatorward, this signal is qualitatively consistent with this observation (Figure 2C) and the Emanuel scheme AFES simulation (Figure 2F).
Similar to the TCF case (Figure 1), GPI anomaly distribution features changed from JJA to SON. Figure 3 shows observed and simulated GPI anomalies in SON. In 2018, a positive GPI signal appears over the WNP, which seems less significant compared with JJA (Figure 3A). In Figure 3A, the positive GPI area is shifted to the southeast quadrant of the WNP. In 2019, a significant GPI increase can be seen in the southeast quadrant (Figure 3B). Furthermore, another positive GPI area can be observed over the north of Philippines. In 2020, the GPI anomaly is almost neutral over the WNP (Figure 3C); however, there is a significant positive GPI anomaly over the SCS. Similar to the JJA case, GPI distribution and year-to-year variability seem consistent with the TCF variability in Figure 1.
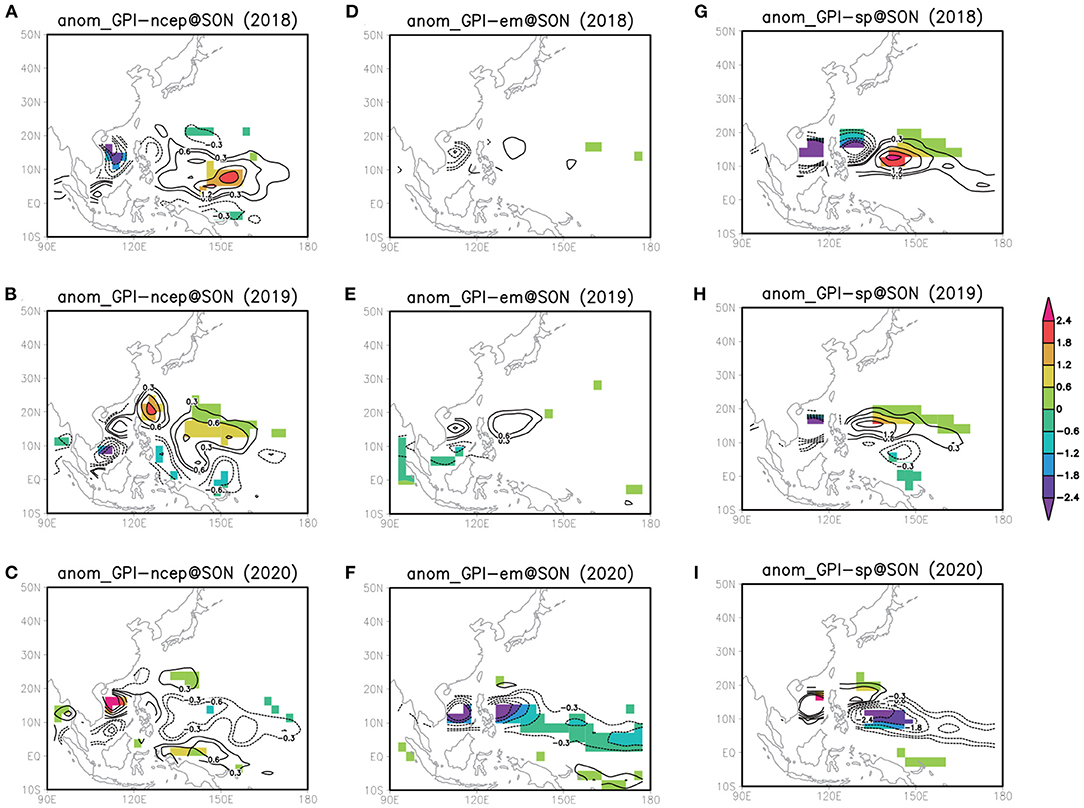
Figure 3. Same as Figure 2, except for the GPI anomaly during boreal fall (SON).
In the Emanuel scheme AFES (Figures 3D–F), the positive GPI signal disappears over the WNP in 2018 (Figure 3D). Compared with the observation (Figure 3A), there is no significant GPI area over the WNP. In 2019, a GPI increase can be observed in the east of Philippines despite insignificant (Figure 3E). In 2020, a strong and significant negative GPI anomaly covers over the WNP and SCS (Figure 3F). This is unlike the observation (Figure 3C) that the GPI anomaly is significantly positive (neutral) over the SCS (WNP).
In the spectral scheme AFES (Figures 3G–I), the positive GPI signal appears over the southeast quadrant of the WNP in 2018 (Figure 3G). This feature agrees with the observation in Figure 2D. In 2019, a GPI increase can be observed in the east of Philippines (Figure 3H). Compared with the Emanuel scheme AFES (Figure 3E), the GPI pattern seems improved, i.e., significantly positive. In 2020, a strong and significant negative GPI anomaly covers the WNP (Figure 3I). It is similar to the Emanuel scheme AFES (Figure 3F). However, a strong (despite being insignificant), positive GPI anomaly can be seen over the SCS (Figure 3I). This anomaly agrees with the observation in Figure 3C.
To examine the large-scale atmospheric conditions associated with TCF variability over WNP, we examine the seasonal mean (JJA and SON) 850 hPa wind and convective anomalies. The left panels of Figure 4 show spatial patterns of the observed 850 hPa wind and outgoing longwave radiation (OLR) anomalies in JJA. In 2018, negative OLR and a cyclonic anomaly can be observed over SCS and WNP (~10–25°N, 100–150°E) in the observation (Figure 4A). Toward the north of the cyclonic/convective anomaly, a positive OLR and an anticyclonic anomaly can be observed in East Asia and North Pacific (~30–45°N, 100–150°E). Around the central Pacific, negative (positive) OLR anomaly appears over the north (south) of the equator. In 2019, there is no significant OLR and circulation anomaly over the North Pacific area (Figure 4B). In 2020, positive OLR and an anticyclonic anomaly can be seen over the WNP (~10–30°N, 120–180°E) in the observation (Figure 4C). Around the equator, positive OLR and an easterly anomaly appear over the central Pacific.
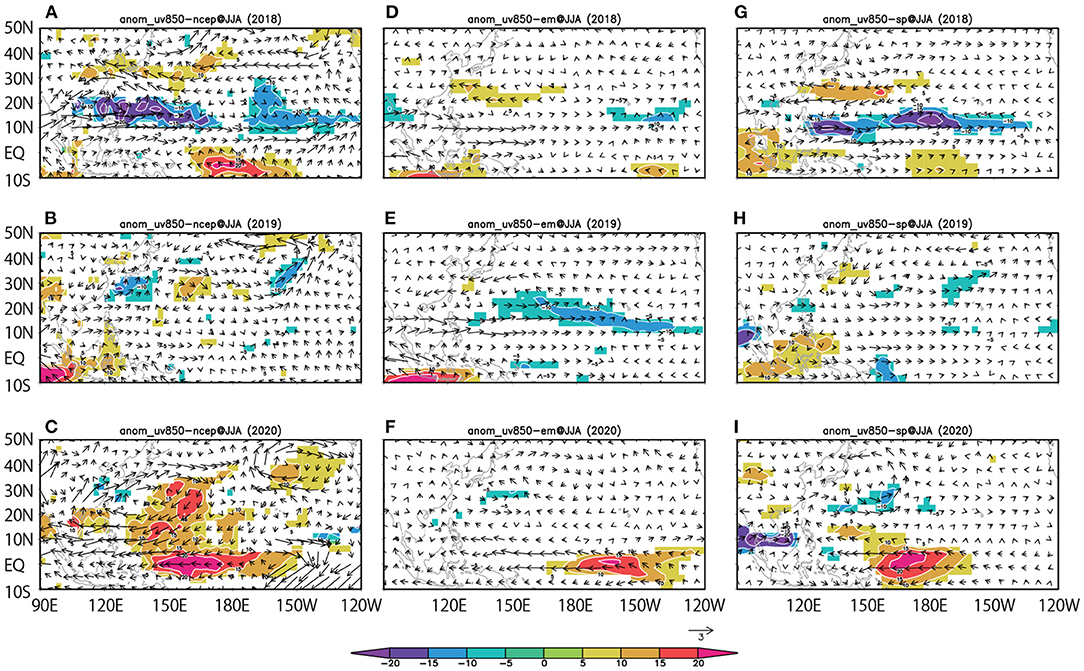
Figure 4. Spatial patterns of the observed 850 hPa wind (units; m/s) and outgoing longwave radiation (OLR) (units; W/m2) anomalies in JJA. (A–C) is observation (NCEP reanalysis), (D–F) is the Emanuel scheme AFES, and (G–I) is the spectral scheme AFES. OLR regions with exceeding ±1σ are shaded.
In the Emanuel scheme AFES (middle column panels of Figure 4), the SST-forced response is weak; however, the cyclonic response over the WNP and the meridional dipole OLR pattern in the central Pacific are simulated in 2018 (Figure 4D). Around the central Pacific, a negative (positive) OLR anomaly is simulated over the north (south) of the equator. In 2019, there is significantly negative OLR and a cyclonic anomaly over the western/central North Pacific area in the AFES simulation (~10–30°N, 120–180°E; Figure 4E), which is different from the observation (Figure 5B). In 2020, over the WNP, a positive OLR and an anticyclonic anomalies are not simulated (~10–30°N, 120–180°E); the AFES simulation demonstrates almost a neutral condition (Figure 4F). However, a positive OLR and an easterly anomaly are simulated over the central Pacific on the equator.
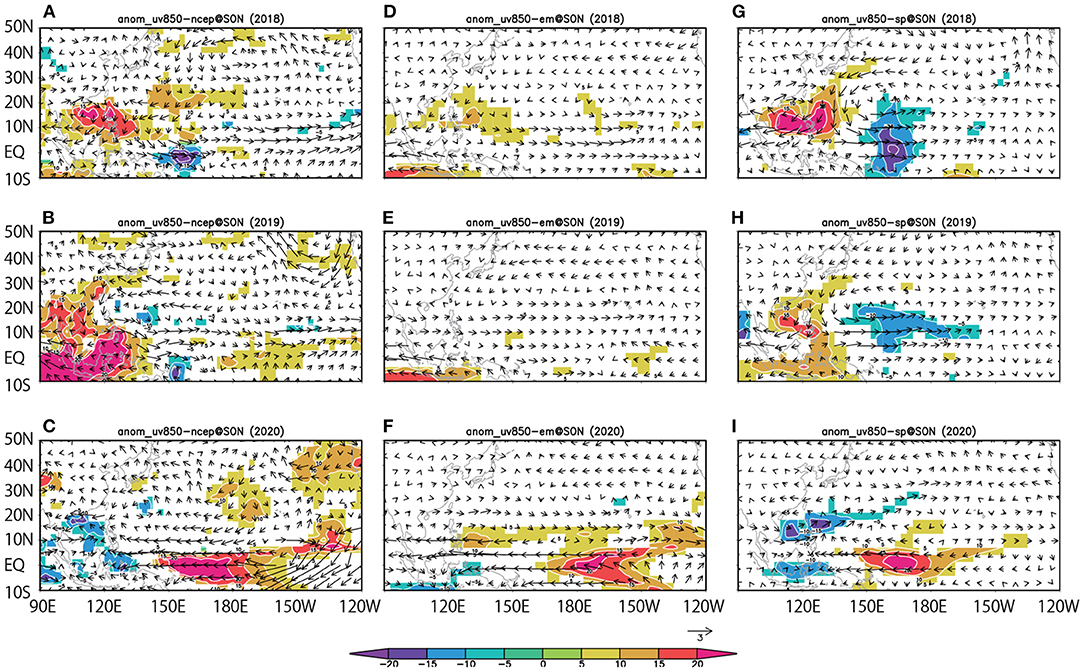
Figure 5. Same as Figure 4 but for SON.
In the spectral scheme AFES (right column panels of Figure 4), compared with the Emanuel scheme AFES, the SST-forced response seems improved with the cyclonic/anticyclonic meridional dipole pattern over the WNP (~100–150°E) and a meridional dipole OLR pattern in the central Pacific in 2018 (Figure 4G). In 2019, there are no significant OLR and circulation anomaly over the North Pacific area (Figure 4H). In 2020, a positive OLR and an anticyclonic anomalies are not simulated over the WNP (~10–30°N, 120–180°E), and the AFES simulation shows rather the opposite (Figure 4I). However, positive OLR and an easterly anomaly are simulated over the central Pacific on the equator.
The left panels of Figure 5 show the observed spatial patterns of the observed 850 hPa wind and OLR anomalies in SON. In 2018 (Figure 5A), positive (negative) OLR anomaly appears around the SCS (equatorial Pacific ~150°E). The equatorial westerly anomaly can be observed in the Pacific. In 2019, there is a cyclonic anomaly over the North Pacific area (Figure 5B). Over the Maritime Continents, there is a significant positive OLR anomaly. In 2020, negative OLR and a cyclonic anomaly can be observed over the SCS in observation (Figure 5C). Around the equator, similar to JJA (Figure 4C), positive OLR and easterly anomaly appears over the central Pacific.
In the Emanuel scheme AFES (middle column panels of Figure 5), the SST-forced response is an equatorial westerly anomaly in the Pacific; however, the observed dipole OLR pattern between the SCS and central Pacific is not simulated in 2018 (Figure 5D). In 2019, there is no significant OLR anomaly over the North Pacific area (Figure 5E). In 2020, negative OLR and a cyclonic anomaly are not simulated over the SCS, and the AFES simulation shows almost neutral conditions (Figure 5F). However, positive OLR and an easterly anomaly are simulated over the central Pacific on the equator; the easterly anomaly intrudes in the SCS area.
In the spectral scheme AFES (right panels of Figure 5), compared with the Emanuel AFES, the SST-forced response seems improved with the negative/positive OLR dipole pattern over the WNP and SCS in 2018 (Figure 5G). In 2019, there is significant negative OLR and a cyclonic anomaly over the North Pacific area (Figure 5H). Over the Maritime Continents, this AFES simulation captures a significant positive OLR anomaly. In 2020, negative OLR and a cyclonic anomaly are simulated over the SCS, although the AFES simulation shows an extension bias to the WNP (Figure 5I). Moreover, positive OLR and an easterly anomaly are simulated over the central Pacific on the equator.
To examine the global SST patterns associated with observed and simulated atmospheric/GPI variability, Figure 6 shows the spatial patterns of the SST anomalies in JJA (left panels) and SON (right panels).
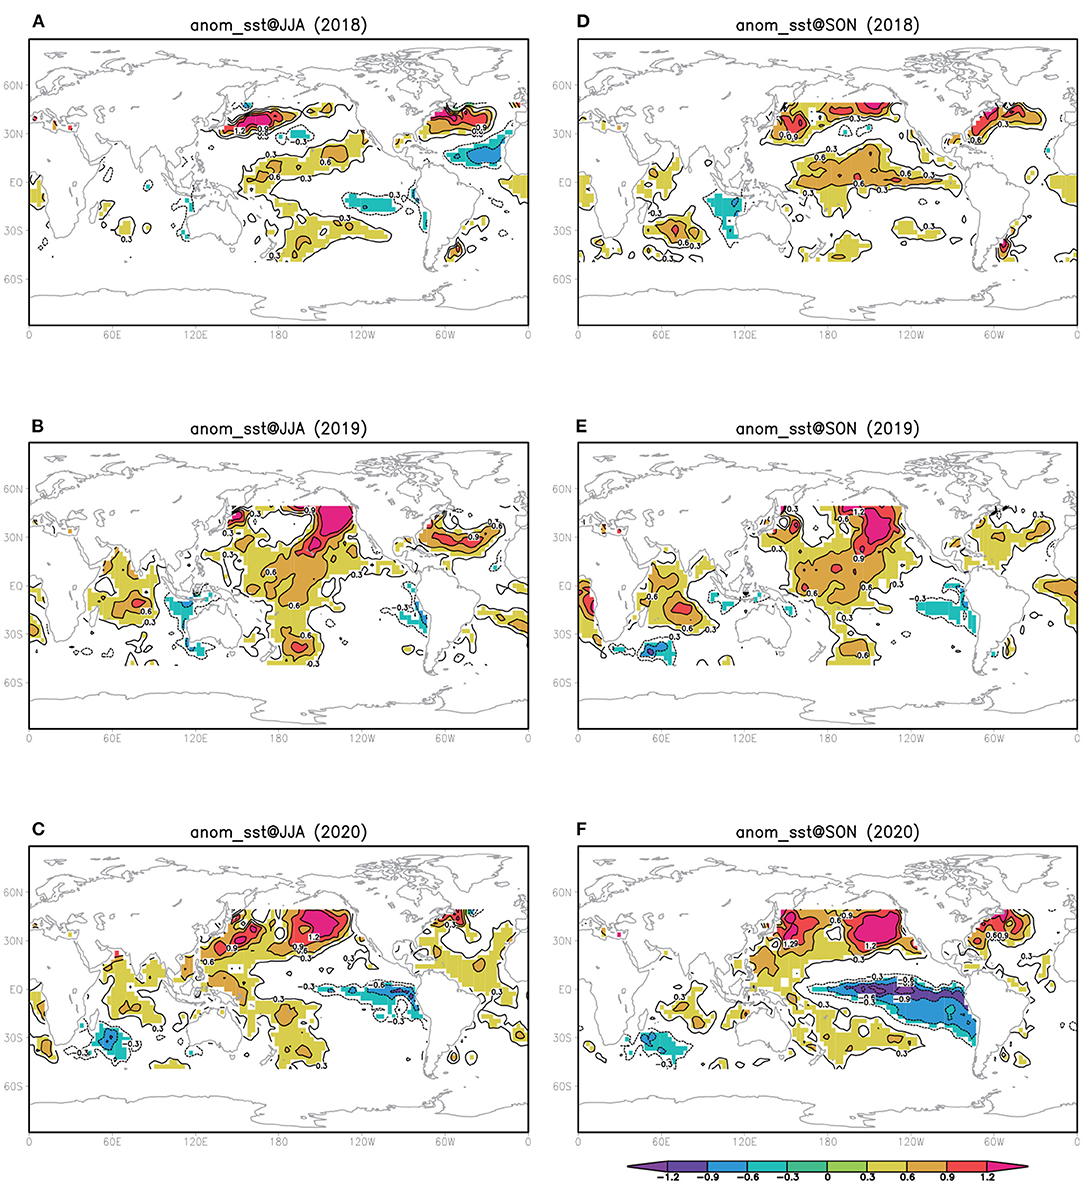
Figure 6. Spatial patterns of the observed SST (units; °C) anomalies in (A–C) JJA and (D–F) SON. Regions exceeding ±0.3°C are shaded.
The SST anomaly in SON 2018 shows a positive anomaly over the central Pacific (Figure 6D). The SST pattern shows El Niño Modoki or the Central Pacific (CP) El Niño in the tropics (Kao and Yu, 2009) with a precursory extratropical signature of warm SST anomalies in the northeastern subtropical Pacific (120–180°W, 10–30°N) in JJA 2018 (Figure 6A), reminiscent of the PMM (Chiang and Vimont, 2004; Ogata et al., 2019). The associated TCF pattern in JJA 2018 (Figure 1A) demonstrates a positive anomaly approximately over the WNP. The results in Figures 1–5 show that the observed TCF increase over the WNP during JJA 2018 is significantly related (simulated as an SST-forced response) to the central equatorial and subtropical warm Pacific SST anomalies via a GPI increase by the cyclonic vorticity. The relationship between TCF/GPI increase and warm SST seems to have continued in SON 2018. TCF increases over the WNP with equatorial and subtropical SST warming (i.e., El Niño Modoki and PMM) agrees with the previous studies (Kim et al., 2011; Zhang et al., 2016; Qian et al., 2019).
Equatorial/subtropical SST warming over the central Pacific continued in 2019; however, the eastern Pacific is a weak cold anomaly (Figures 6B,E) while warm anomaly over the CP is persisting. In the tropical Indian Ocean, particularly in JJA, basin-wide warming is a noticeable feature (SST anomaly averaged over 20°S−20°N, 50–100°E is 0.44°C in JJA, and 0.24°C in SON). From JJA to SON 2019, IOD is developing. The results in Figures 1–5 suggest that the observed TCF increase over the WNP during SON 2019 is significantly related (simulated as SST-forced response) to the central equatorial and subtropical warm Pacific SST anomalies via the GPI increase using cyclonic vorticity. However, JJA 2019 is not significant in the TCF/GPI change per the observation in Figures 1–3. The Indian Ocean basin warming causes an anticyclonic anomaly over the WNP (Xie et al., 2009; Du et al., 2011); therefore, the cyclonic response to the Pacific forcing and anticyclonic response to the Indian Ocean forcing may cancel each other over WNP in JJA 2019.
In 2020, opposite to 2018, the La Niña condition is developing (Figures 6C,F). The observed TCF decrease over the WNP during JJA 2020 is significantly related (simulated as SST-forced response) to the central equatorial cold Pacific SST anomalies (Figure 6C) using the GPI decrease by the anticyclonic vorticity. However, in both AFES simulations, the anticyclonic circulation observed over the WNP (Figure 4C) was not simulated, which indicates the underestimation of the atmospheric response to basin warming over the Indian Ocean (Xie et al., 2009; Du et al., 2011). Over the SCS, the anticyclonic response decay by the Indian Ocean basin warming in SON (e.g., Ueda et al., 2018) may help the favorable TC genesis in SON 2020.
In this study, we examined the TC activity over the WNP in 2018–2020 and its relationship with planetary scale convection and circulation anomalies, both of which play an important role in TC genesis. To extract the impacts of climate modes (El Niño, IOD, and El Niño Modoki) on the SST-forced atmospheric variability, ensemble AGCM simulations forced with the observed SST are executed. In AGCM experiments, we investigate the uncertainty of convective parameterization and robustness of simulated atmospheric response using two different convection schemes. Between 2018 and 2020, the observed TCF (Figure 1) and GPI (Figures 2, 3) demonstrated consistent features. In the AFES simulation, the updated convection scheme (spectral scheme) improves the simulation ability of the observed GPI (Figures 2, 3) and the planetary scale convection and circulation (Figures 4, 5) features. For example, a significant GPI increase over the WNP in SON 2018 and SCS in SON 2020, which were not captured using the Emanuel scheme AFES, have been simulated in the spectral scheme AFES (Figures 2, 3).
Ogata et al. (2021) demonstrated that using the Emanuel scheme AFES, TCF variability is simulated in JJA but not in SON. They concluded that this difference is attributed to the internal atmospheric variability. However, in this study, the spectral scheme (Baba, 2019, 2021) may improve the SON skill. The higher resolution (T239, 50-km in horizontal) AFES experiments having the updated convection scheme will be required for additional investigation of sensitivity to convective parameterization.
As reported in section Comparison of Observed and AFES-Simulated GPI, GPI can be expressed using four environmental variables. To investigate important factors for the GPI anomaly formation, GPI anomaly is decomposed in each environmental variables' contribution (Figure 7). Most GPI anomalies (blue bars in Figure 7) over the WNP can be explained by relative vorticity anomalies (orange bars in Figure 7), except the observed JJA case (Figure 7A). In the observed JJA case, other factors (relative humidity in 2018 and MPI in 2019) seem important. Note that the observed JJA (spectral scheme AFES simulated SON) anomaly may underestimate the variability because of the opposite signal in the south (west) of averaged area (5–20°N, 120–180°E).
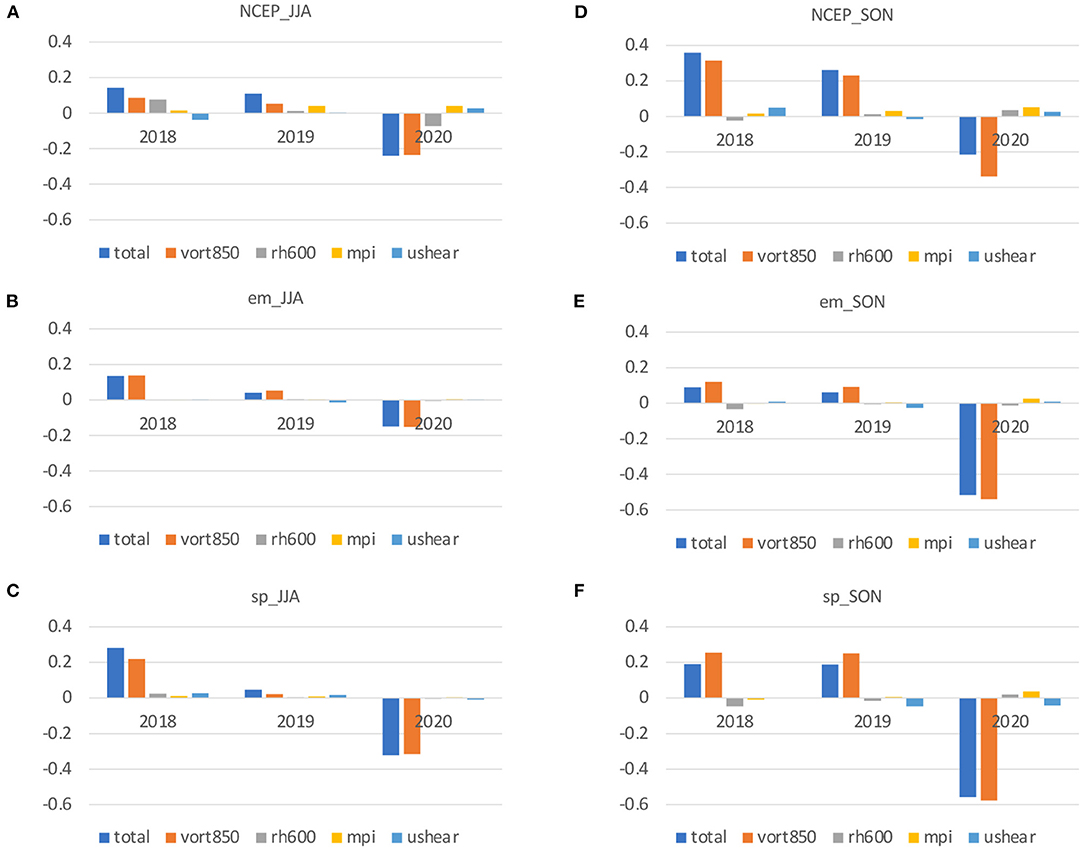
Figure 7. Decomposed GPI contribution in each environmental variable during JJA (left) and SON (right) over the WNP (averaged over 5.20.N, 120.180.E). Total (blue bars), vorticity (orange), humidity (gray), MPI (yellow), and wind shear (aqua) contributions are shown. (A,D) is observation (NCEP reanalysis), (B,E) is the Emanuel scheme AFES, and (C,F) is the spectral scheme AFES.
Recently, studies demonstrated that to simulate the realistic TC development, high-resolution, cloud-resolving (5-km or finer) models are desirable (Kanada and Wada, 2017), although at the expense of a high computational cost. To examine the long-term (multidecadal) TC variability, however, 50-km resolution AGCMs are adequate (Yoshida et al., 2017) despite a significant uncertainty because of the convective parameterizations used in AGCMs. Therefore, efforts should be made toward improving AGCM cloud parameterizations (Baba, 2019, 2021). Furthermore, studies reported that air–sea coupling is important to improve seasonal or longer time-scale TCF forecasts by considering the impact of the active entrainment of subsurface water on the SST and extreme TC activity predictions (Vincent et al., 2012; Ogata et al., 2015, 2016; Ma et al., 2018), which is not considered in this study as it requires the use of an AGCM. Thus, as a next step, we plan to examine this topic using coupled GCMs.
The raw data supporting the conclusions of this article will be made available by the authors, without undue reservation.
TO and YB wrote the paper. About AGCM experiments, YB provided comments and technical supports. TO executed AGCM experiments. Both authors contributed to the article and approved the submitted version.
This work was supported in part by the Japan Society for the Promotion of Science (JSPS) through a Grant-in-Aid for Scientific Research 19K03969. AGCM simulations have been performed on the Data Analyzer (DA) system under the support of JAMSTEC.
The authors declare that the research was conducted in the absence of any commercial or financial relationships that could be construed as a potential conflict of interest.
All claims expressed in this article are solely those of the authors and do not necessarily represent those of their affiliated organizations, or those of the publisher, the editors and the reviewers. Any product that may be evaluated in this article, or claim that may be made by its manufacturer, is not guaranteed or endorsed by the publisher.
Ashok, K., Behera, S. K., Rao, S. A., Weng, H., and Yamagata, T. (2007). El Niño Modoki and its possible teleconnection. J. Geophys. Res. 112:3798. doi: 10.1029/2006JC003798
Baba, Y. (2019). Spectral cumulus parameterization based on cloud-resolving model. Clim. Dyn. 52, 309–334. doi: 10.1007/s00382-018-4137-z
Baba, Y. (2021). Influence of a spectral cumulus parameterization on simulating global tropical cyclone activity in an AGCM. Q. J. Royal Meteorol. Soc. 147, 1170–1188. doi: 10.1002/qj.3965
Bister, M., and Emanuel, K. A. (2002). Low frequency variability of tropical cyclone potential intensity 1. Interannual to interdecadal variability. J. Geophys. Res. 107:776. doi: 10.1029/2001JD000776
Chen, G., and Tam, C. Y. (2010). Different impacts of two kinds of Pacific Ocean warming on tropical cyclone frequency over the western North Pacific. Geophys. Res. Lett. 37:41708. doi: 10.1029/2009GL041708
Chiang, J. C. H., and Vimont, D. J. (2004). Analogous Pacific and Atlantic meridional modes of tropical atmosphere–ocean variability. J. Clim. 17, 4143–4158. doi: 10.1175/JCLI4953.1
Du, Y., Yang, L., and Xie, S. P. (2011). Tropical Indian Ocean influence on northwest Pacific tropical cyclones in summer following strong El Niño. J. Clim. 24, 315–322. doi: 10.1175/2010JCLI3890.1
Emanuel, K., and Nolan, D. S. (2004). “Tropical cyclone activity and the global climate system,” in 26th Conference on Hurricanes and Tropical Meteorology, 240–241.
Emanuel, K. A. (1991). A scheme for representing cumulus convection in large-scale models. J. Atmos. Sci. 48, 2313–2329. doi: 10.1175/1520-0469(1991)048<2313:ASFRCC>2.0.CO;2
Emanuel, K. A. (1995). Sensitivity of tropical cyclones to surface exchange coefficients and a revised steady-state model incorporating eye dynamics. J. Atmos. Sci. 52, 3969–3976. doi: 10.1175/1520-0469(1995)052<3969:SOTCTS>2.0.CO;2
Emanuel, K. A., and Živković-Rothman, M. (1999). Development and evaluation of a convection scheme for use in climate models. J. Atmos. Sci. 56, 1766–1782. doi: 10.1175/1520-0469(1999)056<1766:DAEOAC>2.0.CO;2
Gao, S., Zhu, L., Zhang, W., and Chen, Z. (2018). Strong modulation of the Pacific Meridional Mode on the occurrence of intense tropical cyclones over the western North Pacific. J. Clim. 31, 7739–7749. doi: 10.1175/JCLI-D-17-0833.1
Gates, W. L., Boyle, J. S., Covey, C., Dease, C. G., Doutriaux, C. M., Drach, R. S., et al. (1999). An overview of the results of the Atmospheric Model Intercomparison Project (AMIP I). Bull. Am. Meteorol. Soc. 80, 29–55. doi: 10.1175/1520-0477(1999)080<0029:AOOTRO>2.0.CO;2
Kalnay, E., Kanamitsu, M., Kistler, R., Collins, W., Deaven, D., Gandin, L., et al. (1996). The NCEP/NCAR 40-year reanalysis project. Bull. Am. Meteorol. Soc. 77, 437–471. doi: 10.1175/1520-0477(1996)077<0437:TNYRP>2.0.CO;2
Kanada, S., and Wada, A. (2017). Different climatological characteristics, inner-core structures, and intensification processes of simulated intense tropical cyclones between 20-km global and 5-km regional models. J. Clim. 30, 1583–1603. doi: 10.1175/JCLI-D-16-0093.1
Kao, H. Y., and Yu, J. Y. (2009). Contrasting eastern-Pacific and central-Pacific types of ENSO. J. Clim. 22, 615–632. doi: 10.1175/2008JCLI2309.1
Kim, H. M., Webster, P. J., and Curry, J. A. (2011). Modulation of North Pacific tropical cyclone activity by three phases of ENSO. J. Clim. 24, 1839–1849. doi: 10.1175/2010JCLI3939.1
Kuwano-Yoshida, A., Enomoto, T., and Ohfuchi, W. (2010). An improved PDF cloud scheme for climate simulations. Q. J. R. Meteorol. Soc. 136, 1583–1597. doi: 10.1002/qj.660
Li, R. C. Y., and Zhou, W. (2018). Revisiting the intraseasonal, interannual and interdecadal variability of tropical cyclones in the western North Pacific. Atmos. Oceanic Sci. Lett. 11, 198–208. doi: 10.1080/16742834.2018.1459460
Ma, Z., Fei, J., Huang, X., and Cheng, X. (2018). Modulating effects of mesoscale oceanic eddies on sea surface temperature response to tropical cyclones over the western North Pacific. J. Geophys. Res. 123, 367–379. doi: 10.1002/2017JD027806
Ogata, T., Doi, T., Morioka, Y., and Behera, S. (2019). Mid-latitude source of the ENSO-spread in SINTEX-F ensemble predictions. Clim. Dyn. 52, 2613–2630. doi: 10.1007/s00382-018-4280-6
Ogata, T., Mizuta, R., Adachi, Y., Murakami, H., and Ose, T. (2015). Effect of air-sea coupling on the frequency distribution of intense tropical cyclones over the northwestern Pacific. Geophys. Res. Lett. 42, 10–415. doi: 10.1002/2015GL066774
Ogata, T., Mizuta, R., Adachi, Y., Murakami, H., and Ose, T. (2016). Atmosphere-ocean coupling effect on intense tropical cyclone distribution and its future change with 60 km-AOGCM. Sci. Rep. 6:29800. doi: 10.1038/srep29800
Ogata, T., Taguchi, B., Yamamoto, A., and Nonaka, M. (2021). Potential predictability of the tropical cyclone frequency over the western North Pacific with 50-km AGCM ensemble experiments. J. Geophys. Res. Atmos. 126:e2020JD034206. doi: 10.1029/2020JD034206
Ohfuchi, W., Nakamura, H., Yoshioka, M. K., Enomoto, T., Takaya, K., Peng, X., et al. (2004). 10-km mesh mesoscale resolving simulations of the global atmosphere on the Earth Simulator: preliminary outcomes of AFES (AGCM for the Earth Simulator). J. Earth Simul. 1, 8–34.
Peng, M. S., Ridout, J. A., and Hogan, T. F. (2004). Recent modifications of the Emanuel convective scheme in the Navy operational global atmospheric prediction system. Monthly Weather Rev. 132, 1254–1268. doi: 10.1175/1520-0493(2004)132<1254:RMOTEC>2.0.CO;2
Qian, Y., Murakami, H., Nakano, M., Hsu, P. -C., Delworth, T. L., Kapnick, S. B., et al. (2019). On the mechanisms of the active 2018 tropical cyclone season in the North Pacific. Geophys. Res. Lett. 46, 12293–12302. doi: 10.1029/2019GL084566
Reynolds, R. W., Smith, T. M., Liu, C., Chelton, D. B., Casey, K. S., and Schlax, M. G. (2007). Daily high-resolution-blended analyses for sea surface temperature. J. Clim. 20, 5473–5496. doi: 10.1175/2007JCLI1824.1
Roberts, M. J., Vidale, P. L., Senior, C., Hewitt, H. T., Bates, C., Berthou, S., et al. (2018). The benefits of global high resolution for climate simulation: process understanding and the enabling of stakeholder decisions at the regional scale. Bull. Am. Meteorol. Soc. 99, 2341–2359. doi: 10.1175/BAMS-D-15-00320.1
Saji, N. H., Goswami, B. N., Vinayachandran, P. N., and Yamagata, T. (1999). A dipole mode in the tropical Indian Ocean. Nature 401, 360–363. doi: 10.1038/43854
Takaya, Y. (2019). Positive phase of Pacific meridional mode enhanced western North Pacific tropical cyclone activity in summer 2018. Sola 15A, 55–59. doi: 10.2151/sola.15A-010
Takaya, Y., Kubo, Y., Maeda, S., and Hirahara, S. (2017). Prediction and attribution of quiescent tropical cyclone activity in the early summer of 2016: case study of lingering effects by preceding strong El Niño events. Atmos. Sci. Lett. 18, 330–335. doi: 10.1002/asl.760
Ueda, H., Miwa, K., and Kamae, Y. (2018). Seasonal modulation of tropical cyclone occurrence associated with coherent Indo-Pacific variability during decaying phase of el Niño. J. Meteorol. Soc. Japan 96, 381–390. doi: 10.2151/jmsj.2018-044
Vincent, E. M., Lengaigne, M., Madec, G., Vialard, J., Samson, G., Jourdain, N. C., et al. (2012). Processes setting the characteristics of sea surface cooling induced by tropical cyclones. J. Geophys. Res. 117:7396. doi: 10.1029/2011JC007396
Xie, S. P., Hu, K., Hafner, J., Tokinaga, H., Du, Y., Huang, G., et al. (2009). Indian Ocean capacitor effect on Indo–western Pacific climate during the summer following El Niño. J. Clim. 22, 730–747. doi: 10.1175/2008JCLI2544.1
Yoshida, K., Sugi, M., Mizuta, R., Murakami, H., and Ishii, M. (2017). Future changes in tropical cyclone activity in high-resolution large-ensemble simulations. Geophys. Res. Lett. 44, 9910–9917. doi: 10.1002/2017GL075058
Keywords: tropical cyclone (TC), AGCM experiment, ENSO (El Niño/Southern Oscillation), North Western Pacific, East Asia
Citation: Ogata T and Baba Y (2021) Variability of Tropical Cyclone Frequency Over the Western North Pacific in 2018–2020. Front. Clim. 3:770785. doi: 10.3389/fclim.2021.770785
Received: 04 September 2021; Accepted: 03 November 2021;
Published: 29 November 2021.
Edited by:
Hari Prasad Dasari, King Abdullah University of Science and Technology, Saudi ArabiaReviewed by:
Kazuaki Nishii, Mie University, JapanCopyright © 2021 Ogata and Baba. This is an open-access article distributed under the terms of the Creative Commons Attribution License (CC BY). The use, distribution or reproduction in other forums is permitted, provided the original author(s) and the copyright owner(s) are credited and that the original publication in this journal is cited, in accordance with accepted academic practice. No use, distribution or reproduction is permitted which does not comply with these terms.
*Correspondence: Tomomichi Ogata, b2dhdGF0b21AamFtc3RlYy5nby5qcA==
Disclaimer: All claims expressed in this article are solely those of the authors and do not necessarily represent those of their affiliated organizations, or those of the publisher, the editors and the reviewers. Any product that may be evaluated in this article or claim that may be made by its manufacturer is not guaranteed or endorsed by the publisher.
Research integrity at Frontiers

Learn more about the work of our research integrity team to safeguard the quality of each article we publish.