 Shuangyi Luo
 Zhihong Jiang
 Jieming Chou
 Gang Tu
 Shuyu Wang
- 1School of Atmospheric Sciences, Nanjing University of Information Science and Technology, Nanjing, China
- 2State Key Laboratory of Earth Surface Processes and Resource Ecology, Beijing Normal University, Beijing, China
- 3Jilin Provincial Key Laboratory of Changbai Mountain Meteorology & Climate Change, Institute of Meteorological Sciences of Jilin Province, Changchun, China
- 4School of Atmospheric Sciences, Nanjing University, Nanjing, China
Rice is the basic food for about 50% of the global population, and feeds two-thirds of the Chinese population. Under the influence of global change, extreme weather, and climate events increase in frequency, duration, and intensity, which affect food production substantially. In the medium-to-long term in the future, the impacts of climate change on food availability are likely to grow. In this work, we first define the rice damage indices and then use surface observation and regional climate downscaling results from the variable resolution model LMDZ4 driven by the six Coupled Model Intercomparison Project phase 5 (CMIP5) global climate models (GCMs) to describe the temporal-spatial characteristics and the future changes of the temperature-related rice damages in Northeast China and Central and East China, the major commercial rice production regions in China. Compared with the observation, LMDZ4 demonstrates its ability to reproduce the regional characteristics of both heat and chilling rice damages. Based on the future regional projections under the RCP8.5 pathway, future changes of rice damage under four temperature-rising categories of 1.5, 2, 3, and 4°C are estimated. In the two rice production regions, the future extent of heat-related damage for Northeast China is mostly limited to the western area, and the occurrence of heat damage generally increases with global warming levels, particularly when it is higher than 2°C. For Central and East China, the heat-related rice damage increases in both coverage and intensity. The region is also likely to have a faster increasing rate of heat damage than in Northeast China. When global warming reaches 3 and 4°C, the median heat-related damage spreads over almost the whole region of Central and East China. Moreover, the probability of regional-scale heavy level heat damage would be over 50% by the end of twenty-first century. On the other hand, the disastrous impact of a cold event affecting rice yield is reduced in both coverage and duration although the model projections over Northeast China show larger intermodel variability and uncertainty.
Introduction
Rice is the basic food for about 50% of the global population, providing 20% of global food energy. In Asia, more than 2 billion people depend on rice for more than 60–70% of their daily diet (FAO, 2017; Sekhar, 2018). Economically, rice cultivation is the main source of income for approximately 300 million people globally and an important contribution to national GDP in Asian agricultural countries. Rice production in Asia accounts for more than 90% of the global rice yield and about 70% of global exports. The largest Asian rice-producing countries are China, India, Indonesia, Bangladesh, Vietnam, and Thailand, and 40% of the harvested area is from rain-fed lowland, deep water/intertidal wetland, and some highland. Consequently, the Asian rice industry is fragile to water demand and regional hydrological cycles, which are associated strongly with the accelerated warming climate and related natural disasters, including storms, floods, and droughts.
Due to the combined effects of natural variability of the Asian monsoon system and anthropogenic forcings, the observed changes in the Asian regional climate for the past few decades are evident and significant. Studies demonstrate that the regional warming trend continues in China and other Asian countries, and the extreme climate events have increased in intensity, frequency, and duration (IPCC, 2013; CMA Climate Change Centre, 2019). At the regional level, the impacts of multiple factors, such as rising temperature, higher evaporation, and changing rainfall variability, show substantial impact on water resources and affect the regional food production and national GDP (IFPRI, 2016). The natural variability of the hydrological cycle, the exuberant human consumption, and increased intensity of agricultural water management put further stress on the already scarce water resources in some Asian agriculture regions, and consequently, the increasing water shortage damaged the major important food crops, including rice, corn, and wheat, in many parts of Asia (Wijeratne, 1996; Aggarwal et al., 2000; Fischer et al., 2002; Tao et al., 2003, 2004).
Temperature is one of the main environmental factors that affects the growth and development of crops. Studies indicate that current temperature change has a negative impact on global and regional crop yields. Without taking the effects of CO2 fertilization, effective adaptation measurement, and genetic improvement of plants into consideration, the major global food yields will suffer a reduction of 6.0% for wheat, 3.2% for rice, 7.4% for maize, and 3.1% for soybean per 1°C global warming (Zhao et al., 2017). The rice yield and quality are also constrained by the temperature. When the temperature exceeds or falls below the critical value that favors rice growth, it damages the growth and development of rice, resulting in a decline in yield or poor quality. Therefore, the temperature-related agri-meteorological disasters can be divided into two categories: high temperature heat damage and low temperature chilling damage of rice.
Rice is extremely sensitive to temperature. For rice production, the high-temperature hazard occurring in the booting-flowering and grain-filling stages is one of the major factors that limits the crop yield and quality (Yang et al., 2020). It is agreed by observational analysis and future climate projection that, with global warming, high temperature stress occurs more frequently. Regionally, the occurrence of rice heat damage in East China is consistent with the temporal evolution of the surface air temperature, and consequently, global warming is a major factor that caused the reduction of rice yield (Bao et al., 2012).
In the meantime, a low-temperature event that damaged rice production in the high latitude region of Northeast China was observed in the 1960s and 1970s, and chilling damage can lead to a yield loss of more than 10%—up to 20% if the damages are serious ones. However, the frequency and intensity of large-scale sterile-type rice chilling damage have decreased due to intensified warming in recent years. Even so, the obstacle-type chilling damage tended to be more frequent, affecting the rice growth especially in northern Heilongjiang and eastern Northeast China.
Regional climate projection shows that the magnitude of warming in Asia is likely to be higher than the global average, and the annual precipitation increases in high latitudes and decreases in subtropical latitudes, leading to the continuation of the current dry pattern in some areas (Bates et al., 2008; Huang et al., 2013; Hui et al., 2018a,b). Compared to 1960–1990 averages, the temperatures are projected to increase by up to 4.5°C in the north and west and by up to around 3°C in the southeast by 2100. In the medium term, annual mean temperature is likely to increase by 1.5–2.4°C from 2031 to 2040 and by 2.3–3.0°C from 2051 to 2060. These findings are comparable to those reported in the IPCC's AR5. The effect of climate change on crops varies with the crop and land types (IFPRI, 2016). For example, with the higher variability of rainfall pattern at the regional level, global warming would damage the rainfed farms while benefiting irrigated cropland (Wang et al., 2010). The wide application of agriculture irrigation and water management systems further implicates assessing the climate change impact on food production.
Rice is the leading cereal in Chinese food consumption, and it is mainly produced in Central and East China, South and Southwest China, and Northeast China (Mei et al., 1988; Li et al., 2015). In China, food production was greatly affected by regional climate change. According to the 2019 Blue Book on Climate Change in China (CMA Climate Change Centre, 2019), the increase of the national averaged surface air temperature warming rate of China is significantly higher than the global average. With the warming conditions during the past 50 years, the frequency of extreme high temperature events demonstrated a clear interdecadal variability, and the frequency of extreme daily precipitation events showed an increasing tendency. Since the late 1990s, extreme weather and climate events, such as drought, heavy rainfall, floods, and heatwaves have been widely observed and show extensive socioeconomic impacts. Climate change in China shows a negative impact on agriculture and food production as it affects the major crops, livestock, and fisheries production adversely (Bates et al., 2008; IPCC, 2013). In the near to far future, the negative impacts of regional climate change on food security in China are expected to grow with time.
As hydrological factors are major constraints of China food production (Tao et al., 2003), higher temperature-related heat hazards also damage the growth and maturation of various crops. Study shows that the global rice yield decreases by 3.2% on average for every 1°C increases in global average temperature (Yang et al., 2020). The regional response of rice heat damage to different and higher global warming levels over the Chinese rice production region were evaluated in previous work (Xiong et al., 2016; Wang et al., 2020). However, the uncertainty in chilling/hot rice damage from climate models are not well-addressed. Meanwhile, though the high-latitude region, such as northeastern China, has experienced the most significant warming during a few decades in the past, low temperature events and chilling damage occur from time to time (Ma et al., 2011; Shi et al., 2020). Under such circumstances, the accurate projection and evaluation of occurrence of future low- and high-temperature events as well as the heat and cold rice damage will contribute to the regional effective adaptation and to prevention of the rice yield loss.
In this paper, we use a high-resolution observation data set over China (CN05.1) and simulations of the regional climate model LMDZ4 driven by six Coupled Model Intercomparison Project phase 5 (CMIP5) models to study the changes in frequency and intensity of future rice-related heat and chilling damages in the near and far future under different warming levels. The regional temperature changes that threaten the already fragile carrying capacity of rice fields was assessed.
The paper is organized as follows: the observational data, model, and definition of extreme temperature-related rice damage indexes are introduced in section Data and Methods. In section Results, the projected changes of the above indexes under various global warming levels in China are presented, and section Conclusion gives a summary of the main conclusions of this study.
Data and Methods
Model Information and Data
The dynamic downscaling in this study is performed with LMDZ4, a variable resolution stretched grid atmospheric general circulation model developed at the Laboratoire de Météorologie Dynamique (Li, 1999; Frédéric et al.,2006). In this study, LMDZ4 was used as a limited area model and integrated with enhanced and fine resolution of 60 km over East Asia, covering the region of 5.52–54.87 N in latitude, 85.98–134.53 E in longitude. In vertical, there are 19 sigma-pressure hybrid layers. The LMDZ4 model physics and parameterization schemes can be found described in Frédéric et al. (2006) and Dufresne et al. (2013) for more details.
Driven by six CMIP5 global models in the lateral and lower boundaries (Table 1), LMDZ4 was integrated from 1961 to 2005. We selected 1986 to 2005 as the reference climate, and 2006–2100 for future climate under RCP8.5 emission scenario. The equal-weighted ensemble average of six downscaling results, referred to as LMDZ MME in the following text, was used for extreme temperature and rice disaster analysis for both reference and future climate.
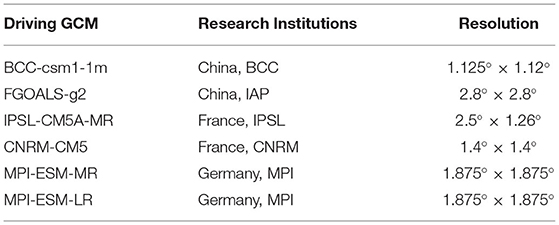
Table 1. Basic information of models.
The analysis region is centered at 30°N/110°E, covering 5°–55°N in latitude and 85°–135°E in longitude. The region is further divided into northeast China and Central and East China, according to rice cultivation in China (Figure 1, Mei et al., 1988).
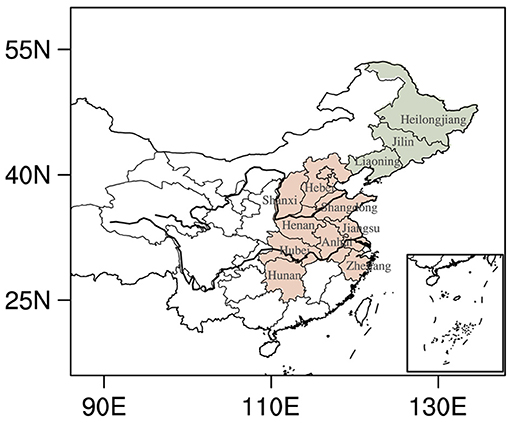
Figure 1. The research domain. The region with green color denotes the northeast China, and the region with red color is Central and East China.
LMDZ4 can generally well-simulate the regional climate of East Asia (Yang et al., 2016; Gao et al., 2017; Guo et al., 2018). Yang et al. (2016) compare differences between model simulation results before and after downscaling by LMDZ, showing that LMDZ can evidently improve depiction of regional terrain. Gao et al. (2017) suggest that LMDZ4 can reproduce the spatial pattern of extreme temperature in Central and East China better compared with forcing global climate models (GCMs). Guo et al. (2018) project the response of three extreme temperature indices to 1.5 and 2°C global warming in Central and East China by a corrected LMDZ daily temperature data set under RCP4.5 scenario.
For the purposes of model assessment, the 0.25°× 0.25° resolution data sets, CN05.1, which are based on the interpolation form more than 2,400 observing stations in China, are used as observations (Wu and Gao, 2013). We further interpolate model data to the same resolution of observation by Earth System Modeling Framework (ESMF) software, a regridding function incorporated into NCL.
Time Windows of Reaching 1.5, 2, 3, and 4°C Global Warming Threshold
To evaluate the impacts of various warming levels to rice production in China, we choose 1986–2005 as the reference time period, during which the climate is 0.61°C warmer than the preindustrial level of 1850–1900 (IPCC, 2013; Chen et al., 2017). According to the method of Chen et al. (2017), the ensemble mean of driving GCMs reach the 1.5, 2, 3, and 4°C global warming levels above the preindustrial period by the time windows of 2019–2039, 2033–2053, 2055–2075, and 2076–2096, respectively. Here, the time series of global mean temperature were smoothed by the 21-year moving average first, and the time window of reaching the warming threshold was defined as the first year when temperature reaching the corresponding threshold with 10 years before and after it. Correspondingly, the warming in the individual time windows are 0.89, 1.39, 2.39, and 3.39°C above mean temperature of 1986–2005.
Definitions of Heat and Chilling Damage Indices
In this study, we mainly consider the changes of extreme high and low temperatures and their impacts to rice during the key time periods of grain-filling and heading periods. Therefore, for the heat damage that affects Northeast China, a time slice of July 15–August 31 is selected, and for Central and East China, a time slice of August 1–September 10 is selected. Correspondingly, the low temperature events damage the physiological function of the rice during its booting and heading periods, forming empty grains and reducing yield. The heat and chilling damage indices to rice used in this study are generated with the ensemble mean of LMDZ downscaled daily maximum and minimal temperatures.
To describe the damage quantitatively, we define several indices (Table 2). Their calculations are based on the Chinese National Standards for Grade of Chilling damage for rice and maize (People Republic of China Meteorological Industry Standard, 2009) and Meteorological grades of heat damage to rice (People Republic of China National Standard, 2020).
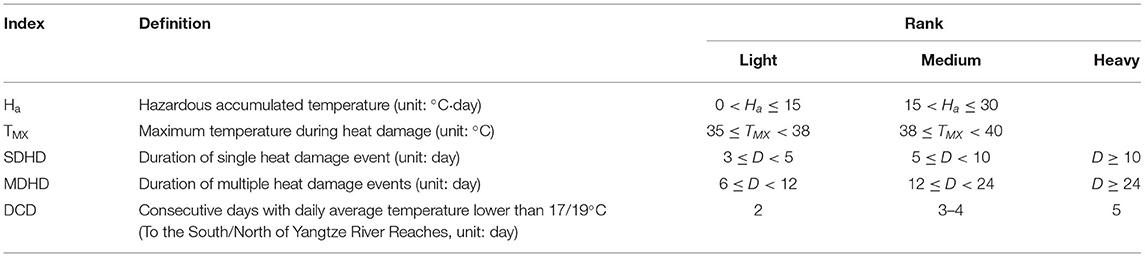
Table 2. Definitions of heat and chilling damage indices.
For heat damage, we firstly identify the days with daily maximum temperature higher than 35°C (referred to as heatday in the following figure and text) and then calculate the index of Ha to describe the heat damage to rice:
(1) Ha: Hazardous accumulated temperature. When consecutive heatdays with daily maximum temperature Tmax higher than 35°C are 3 days or longer, Ha is calculated as the accumulation of difference between daily maximum temperature Tmax to 35°C. Ha is then used to calculate the single point heat damage intensity HDI.
(2) TMX: Maximum temperature during heat damage.
In addition to the magnitude of heat damage, we also consider the length of heat damage to rice by calculating following indices:
1. Duration of high temperature during heat damage (DHD): Here, high temperature event are divided into two types: single and multiple events. The former is for the case when only one heat damage occurs during the entire growing season of rice for a particular year, recording its duration as DHD. Duration of multiple events is the accumulation amount of days when more than one heat damage event happens in 1 year;
2. Duration of low temperature event (DCD): For the chilling damage index, we only consider damages that affect the rice productivity, that is, the low temperature events during the rice reproductive period that physiologically destroy the rice plant and cause empty grains. The chilling damage is estimated by the duration of low temperature event (DCD) and can be categorized into three levels, that is, light damage with DCD equaling 2 days, middle damage with DCD lasting for 3–4 days, and heavy damage with DCD longer than 5 days.
The threshold to define DCD varies with regions. For the area to the south of the Yangtze River, daily temperatures lower than 17°C are considered to cause chilling damage to rice production and used to calculate DCD, and for the region to the south of the Yangtze River, the threshold of daily temperature lower than 19°C is used to calculate the DCD.
(3) The regional impact of heat/cold events to rice production is estimated by defining SH/SC index:
We then use SHi and SCi to estimate the regional coverage of heat and cold events with different intensity. Here, i stands for the intensity levels.
Results
Evaluation of Model's Ability to Simulate Current Temperature Related Damages
Heat Damage
As a major single-cropping rice production region of China, Northeast China experiences little heat-related damages in observation (figure not shown) with the observed heat days <1 day, Ha smaller than 4°C·day, and TMX no more than 36°C. There are no multiple heat events, and the single heat event is limited to the small area of northern Heilongjiang province. The LMDZ MME well-reproduce the observed distributions of Ha, TMX, SDHD, and MDHD, suggesting that LMDZ has the ability to describe the intensity and duration of heat damage in Northeast China.
In contrast to Northeast China, the rice production region in the lower latitude of Central and East China is greatly affected by heat damage represented by TMX, Ha, SDHD, and MDHD. In observation, the Ha and TMX show south–north gradients with higher Ha of more than 12°C·day in eastern Hunan and north Zhejiang provinces. Most of Hunan, Hubei, Henan, Anhui, and Zhejiang observe TMX over 36°C during the filling and heading seasons. The LMDZ MME is unable to reproduce the south–north gradients of Ha and TMX. Instead, the high Ha is limited to the narrow band across the center of Henan and Hubei, and TMX is evidently underestimated, especially for the area south of 30 N. Consequently, the index for a single heat event SDHD ranges between 5 and 10 days. The index for multiple events MDHD lasts between 6 and 12 days in most parts of Central and East China, but Zhejiang province has enduring multiple events with MDHD of 24 days. LMDZ MME can reasonably produce the distributions of the heat damage of Henan, Anhui, and Shandong provinces, but it greatly underestimates the magnitude of all indices for the area lower than 32 N and shows overestimation for the area higher than 34 N. For example, LMDZ MME has a negative bias for Hunan, Zhejiang, Anhui, and the southern part of Jiangsu provinces. The model's cold bias in maximum temperature in Zhejiang and Hunan provinces induces large underestimation in both SDHD and MDHD in Zhejiang and Hunan provinces by 5 and 6–20 days, respectively. On the other hand, LMDZ MME has overestimation of SDHD due to its overestimation of maximum temperature at southern Hebei and northern Henan provinces. The LMDZ MME also overestimates SDHD for Anhui by almost 5 days (Figure 2).
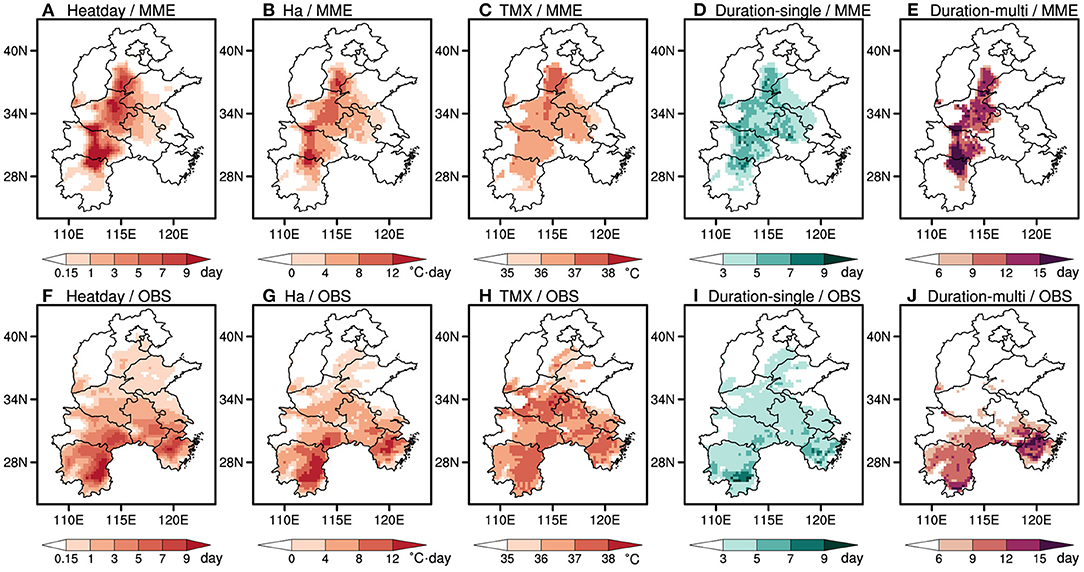
Figure 2. Spatial distributions of observed and multimodel averaged heat damage indexes in Central and East China during 1986–2005. (A,F) The number of high-temperature days (unit: day), (B,G) hazardous heat accumulation temperature (unit: °C·day), (C,H) maximum temperature in the process of heat damage (unit: °C), (D,I) single-process duration of heat damage (unit: day), and (E,J) multiple-process duration of heat damage process (unit: day).
Chilling Damage
Compared with the heat damage, Northeast China experiences frequent chilling damage during 1986–2005 (Figure 3B) with the least damage of 2 days. The heaviest damage that lasts longer than days mainly happens along the range of the Xiaoxing'an and Changbai Mountains, displaying the possible impact of terrain. Damage with medium intensity that lasts for 3–4 days distributes on both sides of the mountain range, located in the Sanjiang and Songnen plains. The southern part of northeast China has the relatively small-scale light damage of 2 days. The rice production area of Northeast China is mainly in the plains, such as the Sanjiang and Songnen plains around the south slope of the Xiaoxing'an Mountains and is definitely affected by chilling damage with various intensity.
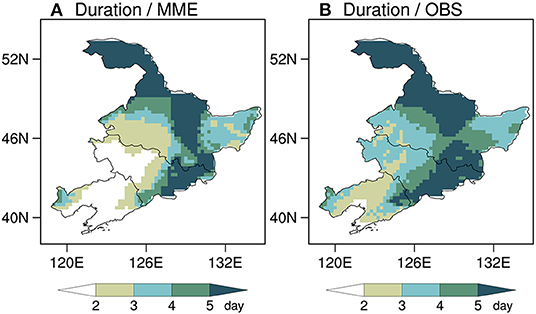
Figure 3. Spatial patterns of chilling damage duration (unit: day) for (A) LMDZ-MME and (B) observation in Northeast China during 1986–2005.
Compared with the observation, LMDZ reproduces well the pattern of chilling damage (Figure 3A). The simulated heaviest chilling damage is along the mountains, which well-agrees with the observation. However, LMDZ shows a warm bias in the west of the mountain range and reduces the length of regional chilling damage by 1 day. The extent of damage with medium intensity decreases largely and location of light damage shifts to north of the Songnen plain. Similarly, in LMDZ simulations, the southern and central part of Northeast China has chilling damage <2 days in the historical period due to the model's warm bias.
Chilling damage in Central and East China is mainly observed in northern and part of the western area (figure not shown). Shandong, Anhui, Hunan, and Zhejiang provinces also have scattered distributions. The damage of the highest intensity in Central and East China distributes along the mountainous terrain, i.e., the Yanshan and Taihang Mountains, similar to the case in Northeast China. A medium-level event spreads around the mountains and in the western part of Central China. The extent of the damage with light intensity is slightly larger than that of the medium level. The main rice production area of Central and East China is in the lower latitude provinces of Anhui, Jiangsu, Hunan, southern Hubei, and Zhejiang. Scattered rice fields are located on the south bank of the Yellow River and northern provinces of Shanxi and Hebei. Therefore, though north of Hebei, Shanxi provinces and the west part of Henan, Hubei provinces have light-to-heavy cold events, the overall loss of rice from chilling damage in Central and East China is manageable.
LMDZ can basically represent the characteristic of the heaviest chilling damage, but large bias exists for damage with medium and light intensities as the model's cold event concentrates along the mountain range and surrounding areas.
Above all, LMDZ is able to reproduce the pattern of chilling damage in the rice production region of China; it especially well-represents the distribution of the heaviest chilling damage in Northeast China.
Future Projection of Extreme Temperature-Related Damage to Rice Under Different Warming Levels
Heat Damage
Spatial Distribution
As shown in Figure 4, in Northeast China, the maximum temperature TMX, the accumulated hazardous Ha, and the duration of both single and multiple events increases in magnitudes with increasing warming levels. Meanwhile, they all spatially spread eastward and reach 120E. If the warming limited to 1.5°C, the Ha, TMX, and SDHD is confined to the west corner of Jilin province, and a multiple heat event would not happen as that of the reference time period. When the warming level reaches more than 3°C, both intensity and duration of heat damage in the east part of Northeast China are intensified (Figure 4). Compared with the reference time, the SDHD and MDHD can increase by more than 20 and 18 days at most, and the heat damage could spread eastward and cover northwest Liaoning, western Jilin, and southwest Heilongjiang. The intensity indices share the similar distributions to those of duration indices, and the magnitudes of TMX and Ha increase with warming levels until reaching more than 38 and 12°C day when 4°C warming occurs. Both tensity (i.e., Ha and TMX) and duration heat damage (e.g., Heatday, SDHD and MDHD) indices show increasing trends with time (Figure 5). The trend from the temporal evolution of MDHD shows that it increases by 0.91 d/10a, and for the duration of single event by 0.19 d/10a (Figure 5D).
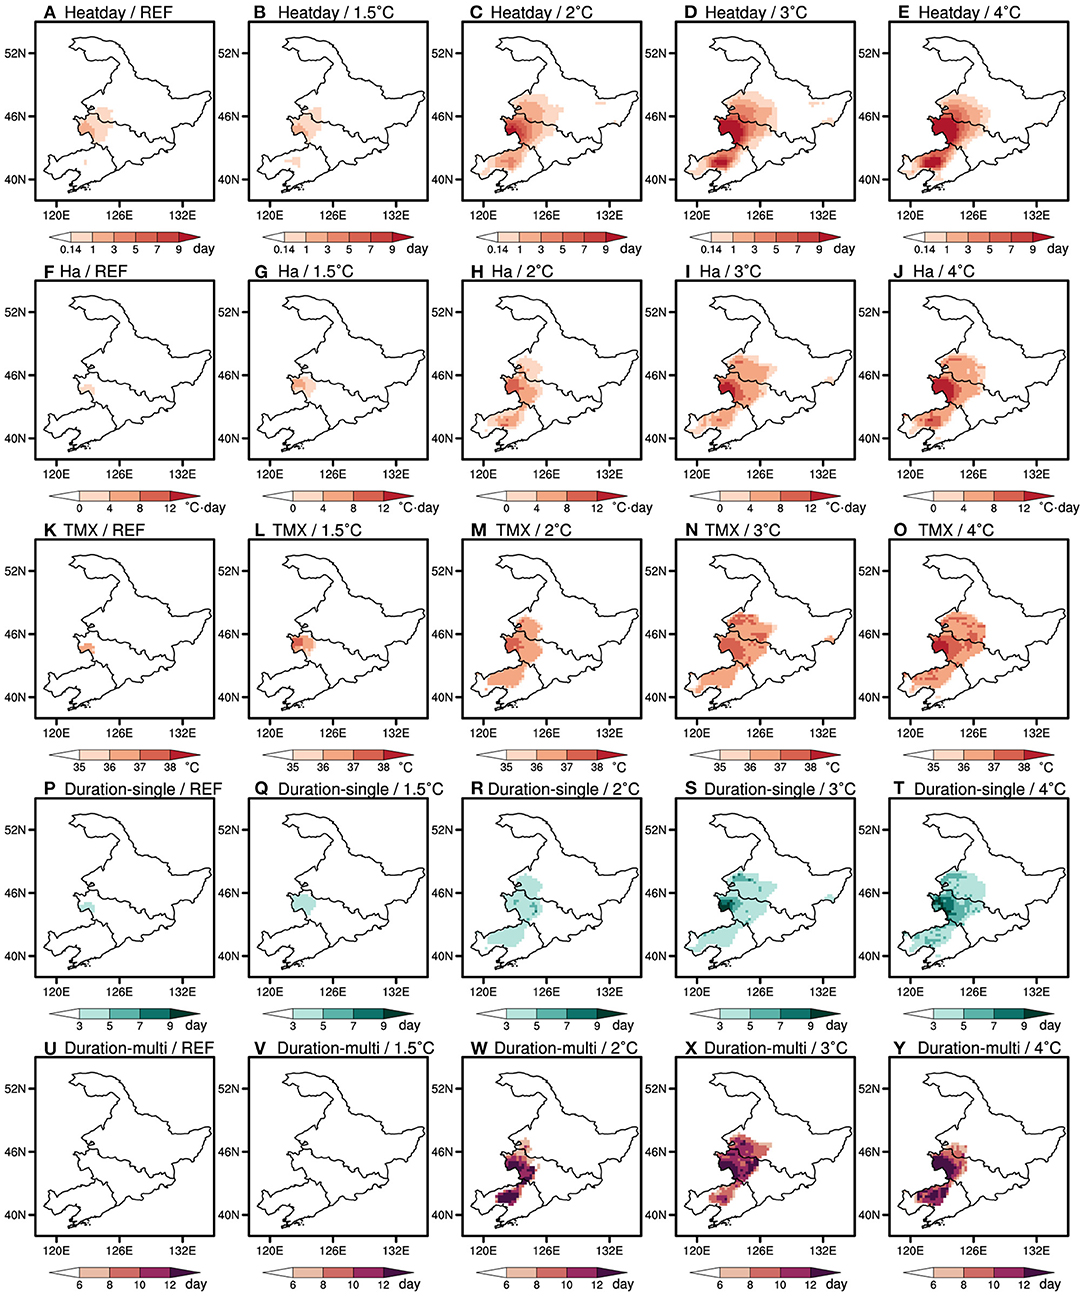
Figure 4. Spatial distribution of (A–E) the number of high-temperature days (unit: day), (F–J) hazardous heat accumulation temperature (unit: °C·day), (K–O) maximum temperature in the process of heat damage (unit: °C), (P–T) single-process duration of heat damage (unit: day), and (U–Y) multiple-process duration of heat damage (unit: day) simulated (the first column) and projected by LMDZ-MME (the second to fifth columns) in Northeast China. The reference time period is 1986–2005. For future projection, the warming levels of 1.5, 2, 3, and 4°C are presented under the emission pathway of RCP8.5.
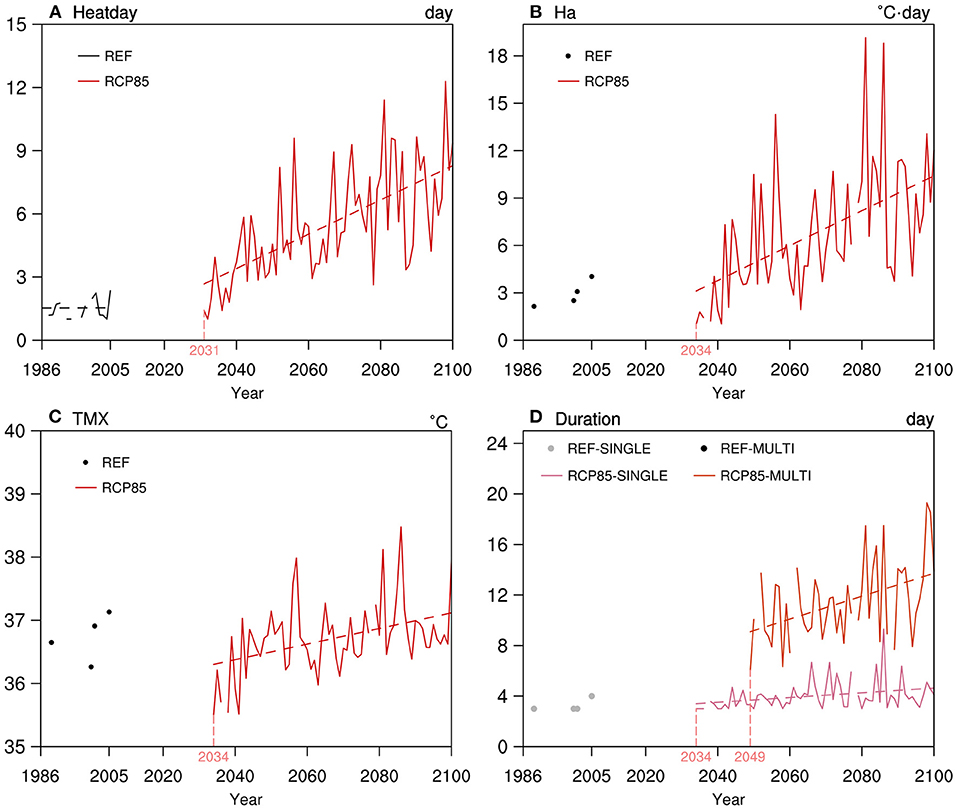
Figure 5. Time series of (A) the number of high-temperature days (unit: day), (B) hazardous heat accumulation temperature (unit: °C·day), (C) maximum temperature in the process of heat damage (unit: °C), (D) single- and multiple process durations of heat damage (unit: day) simulated and projected by LMDZ-MME averaged over Northeast China. The reference time period is 1986–2005, and for future projection, the time period of 2006–2100 is taken under the emission pathway of RCP8.5. The black and gray dots, and gray dotted line denote the historical simulation results. The red and magenta solid lines denote the multimodel projections under RCP8.5 pathway. In the plot, all the long dashed lines are for the linear regressions of different indexes with the vertical magenta short lines and corresponding years indicating the first occurrence times of individual hot extreme indexes.
In Central and East China, which produces more than 45% of rice yield in the last 20 years, higher warming levels are inevitably accompanied by the wider spread of heat damage from the center of the rice-production region to the whole center-east China (Figure 6). For the reference time, the highest TM is 38.1°C located at 37.75 N, 116.25 E (boundary region of Hubei and Hunan provinces). Associated with strengthening warming, the TMX increase from 38.9°C at 1.5°C to 41.5°C at 4°C warming. The high TMX area with value higher than 38°C extends southward from southern Hebei province to cover most of Hebei, Hubei, and Hunan provinces, and regional averaged TMX for the whole rice production region can be more than 35°C for 4°C warming. The hazardous accumulation temperature Ha is projected to have similar spatial distributions to that of TMX for different warming levels. Comparing the distributions under 2°C warming, it can be seen that Ha is reduced by about 20°C·day in Hebei, Hubei, and Hunan provinces under the 1.5°C warming scenario, greatly lowering the dangers of heat damage to the rice.
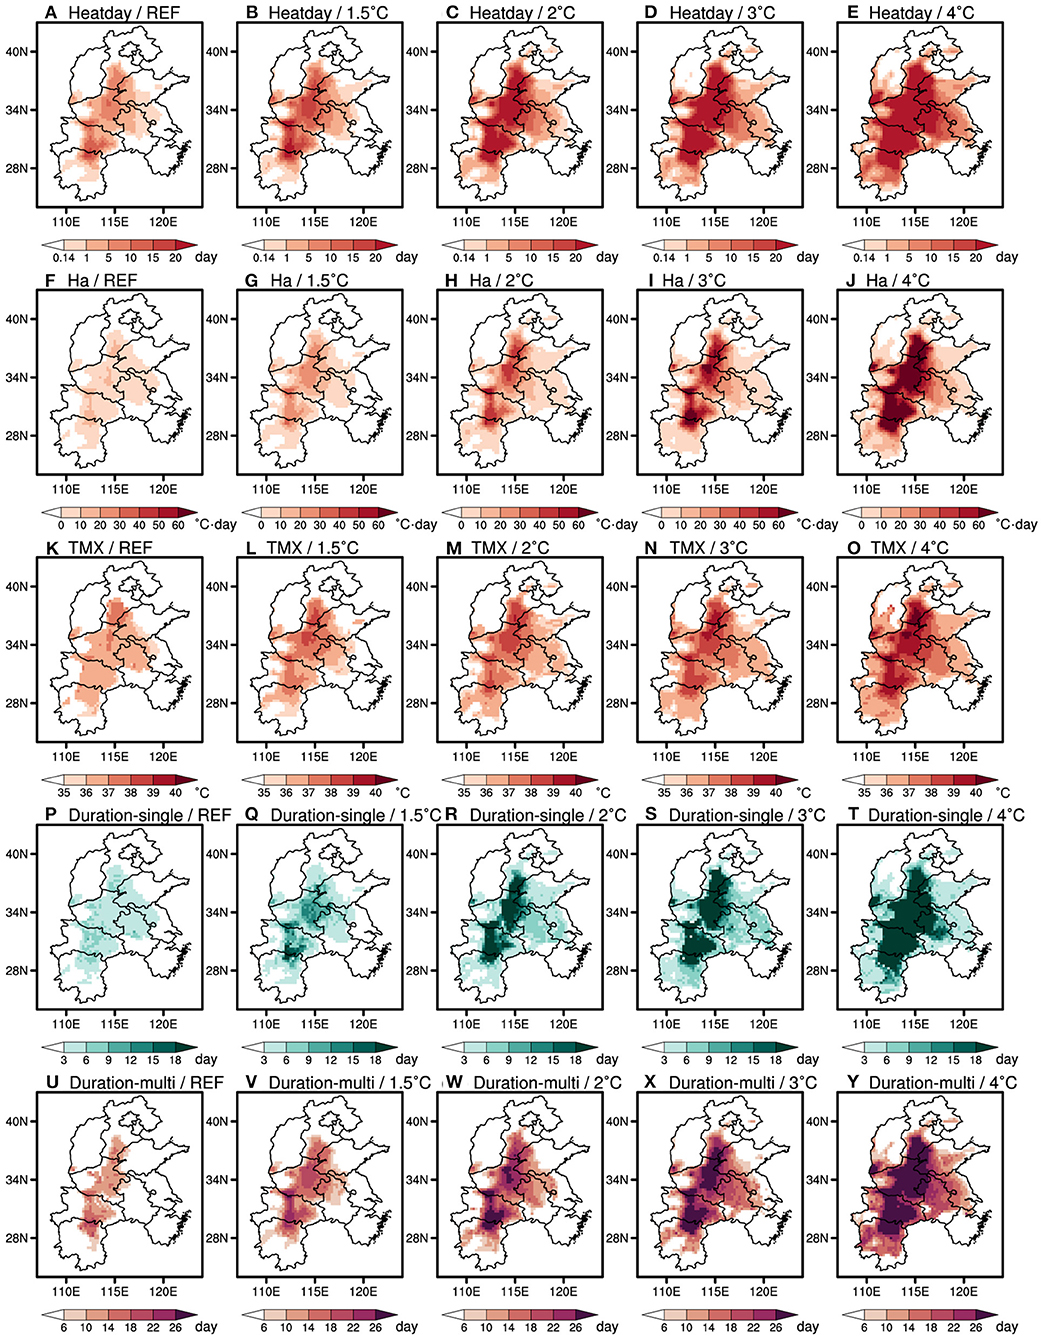
Figure 6. Same as Figure 4 but for Central and East China.
For each individual warming level, the duration indices of heat damage, SDHD and MDHD, in Central and East China have the similar spatial distributions (Figure 6), that is, the most hit area from heat damage gradually enlarges southwestward until it finally covers the whole region below 36 N. Compared with the reference time, the regional average of single heat event duration increases by 2.06, 4.25, 7.05, and 11.05 days for 1.5, 2, 3, and 4°C warming; and for multiple events, the changes will be 2.02, 4.46, 6.09, and 8.95 days. If the 4°C warming occurs, even if the yearly heat damage comes from a single event, it is likely to last for more than 15 days regionally in the whole 41-day grain-filling periods. Moreover, it is likely that more than 90% of the Central and East China's rice production region will be hit by either single or multiple heat events, and the total lasting time of such heat damage will be longer than 35 days, which accounts for more than half of the grain-filling season. Combining the damage intensity and duration, we can see that the severest heat-related disaster coincides with the major rice production area of Henan, Hubei, and Anhui provinces and leads to massive rice production cuts.
The temporal evolution of intensity and duration of heat damage in Central and East China is shown in Figure 7. Under the RCP8.5 emission scenario, the heat damage would endure as indicators of heat duration of SDHD increased by 1.68 d/10a, and MDHD by 1.89d/10a. Meanwhile, the TMX increases by the rate of 0.22°C/10a. All the above changes are statically significant and pass the 95% confidence level.
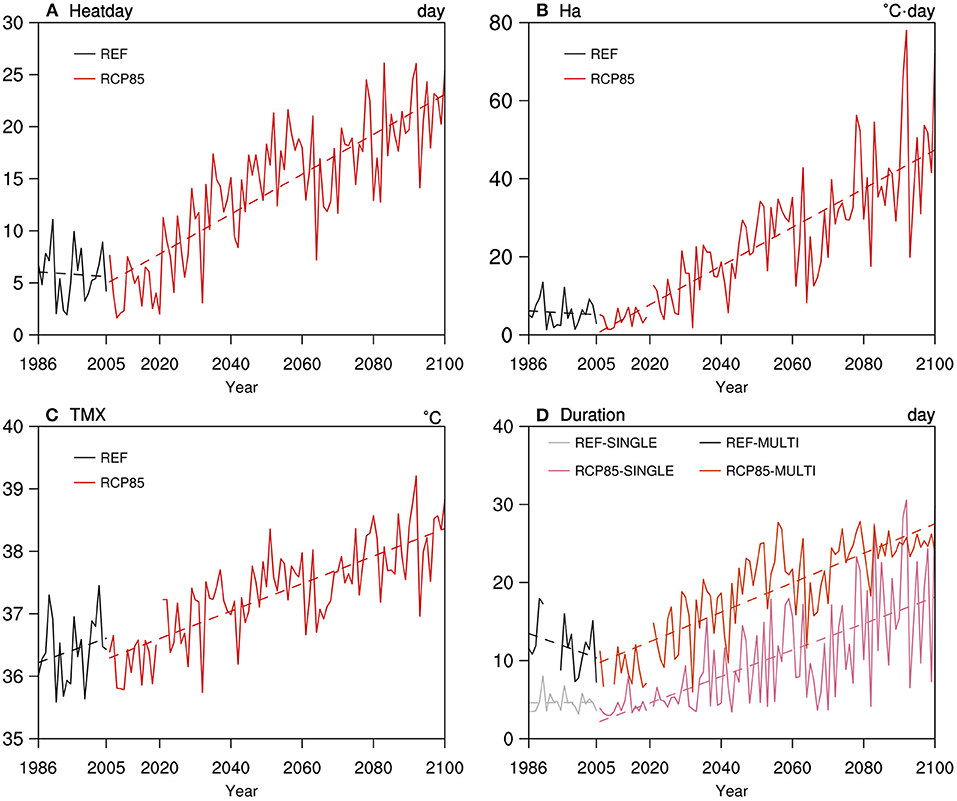
Figure 7. Same as Figure 5 but averaged over Central and East China.
Changes of Intensity, Duration, Danger Level, and Coverage
The danger level of rice heat damage grows with increasing global warming levels in both intensity and duration. It is evident that the uncertainty ranges of projected indices that are induced by various driving GCMs enlarge with warming level, especially for Ha and MDHD (Figure 8). We further divide TMX and Ha into three categories to describe the risk level of heat damage to better describe the severity of potential risk. As shown in Figure 8A, rice-producing Northeast China is a region that is seldom troubled by heat-related damage in the current climate. In the future, the intense heat damage affecting the rice production can be avoided in Northeast China with global warming limited below 3°C; otherwise, the region will have “light” level heat damage with Ha increasing up to 6°C·day. On the other hand, the risk level measured by TMX is categorized as light for all four warming levels (Figure 8A). To identify risk arising from an enduring heat event, the indices of MDHD and SDHD are categorized into “short,” “medium,” and “long” according to their lasting days. Over Northeast China, the impact level from the single heat event remains short for all four warming levels. In Northeast China, the occurrence of multiple heat events increases with the warming levels. In the last 40 years of the twenty-first century, all enduring heat events can be categorized as multiple type. In conclusion, the risk of having multiple heat events cannot be avoided if the warming is over 1.5°C, and Northeast China will have short multiple heat events under 2, 3, and 4°C warming.
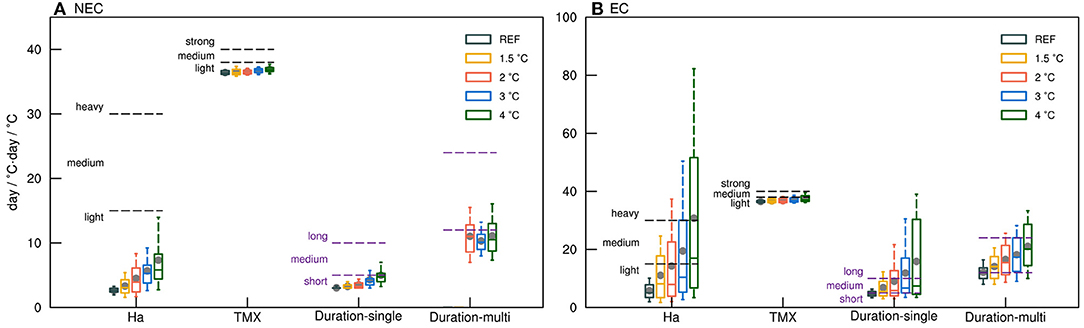
Figure 8. Boxplots of the number of high-temperature days (unit: day), hazardous heat accumulation temperature (unit: °C·day), maximum temperature in the process of heat damage (unit: °C), durations of single- and multiple-process of heat damage (unit: day) of control (1986–2005), and projected climate (2006–2100) by LMDZ-MME averaged over the (A) Northeast China and (B) Central and East China. For future climate projection, warming levels of 1.5, 2, 3, and 4°C under emission pathway of RCP8.5 are considered. The top and bottom whiskers are the 10th and 90th percentiles. The black and purple dotted lines indicate the corresponding rank of each event.
For Central and East China, the risk level for intensified heat is measured by the variation of the TMX, and the damage level is below light when warming is <3°C and strong when it is 4°C warming. Ha can also be used to describe the severity of heat damage from intensified high temperature. From variation of Ha, it can be seen that the HDI would keep being light with the global warming below 2°C. With the warming reaching 4°C globally, the HDI in Central and East China would develop into the stage of heavy with Ha up to 37°C by LMDZ MME (Figure 8B). Examining the endangerment of enduring high temperatures to rice production, the danger level for a single heat event is medium for 1.5 and 2°C in Central and East China, but extends to long when the warming level is 3°C and above. Meanwhile, the risk level of multiple heat events varies between short and medium levels according to the variations of MDHD under different warming levels.
During the 20-year reference time, the percentages of area affected by hot weather are <3% in Northeast China. Global warming increases the risks of heat damage as the highest percentage of area that suffered from heat damage reaches 25% with the linear tendency of 1.57%/10a during 2034–2100 (Figure 9A). In contrast to the reference time when there are no medium and heavy types of heat damage, Northeast China has a large chance to witness a drastic increase in light-type heat events with the percentage of the affected area more than 50% for year of 2040–2100. Scattered cases of heavy heat damage are projected for Northeast China though the affected area may be <10–20%. The area affected by medium type events ranges from 5 to 40% (Figure 9B). As shown in Figure 9C, the overall coverage of the heat-damaged area, indicated by the index of SH, in Central and East China has a clear annual variability for reference time periods and a linear increasing tendency by 5.35%/10a for warming future. By the time of 2090–2100, the area hit by heat damage would be five times the reference value of 5% during 1986–2005. Examining the three risk levels of severity from heat damage, the heavy type shows the most conspicuous increasing tendency, whereas the medium type shows slight increasing during 2006–2100, and the light type decreases drastically by −11.5%/10a (Figure 9D).
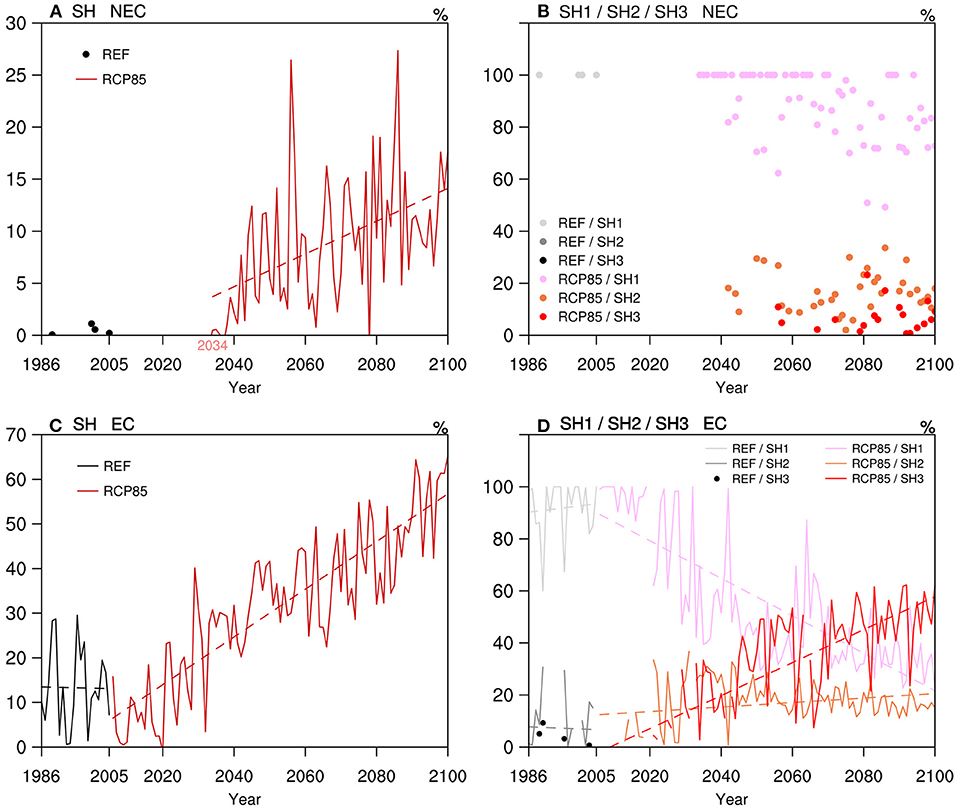
Figure 9. Time series of indexes of regional impact of heat damage (SH, unit: %) and regional coverage of heat damage with different intensity (SH1/SH2/SH3, unit: %) for reference (years 1986–2005) and projected (years 2006–2100 under the RCP8.5 pathway) climate by LMDZ-MME. (A,B) are for regional average of Northeast China, and (C,D) for Central and East China. The light gray, dark gray, and black solid lines denote the historical temporal variations of indexes and magenta, orange, and red solid lines for projection results under RCP8.5 scenario. The corresponding long dashed lines indicate the linear trends of individual index.
Chilling Damage
Spatial Distribution
Under the emission scenario of RCP8.5, both intensity and extent of chilling damage in Northeast China decrease gradually (Figure 10). Pattern of DCD under 1.5°C global warming is similar with that in reference period except extent of light damage narrows northward slightly. When global warming reaches 2°C, the range of the heaviest chilling damage in the Xiaoxing'an Mountains decreases rapidly and almost diminishes in the Changbai Mountains. The area that might be hit with medium-intensity damage (3–4 days) shrinks further toward the north mountains. A light event with duration of 2 days widely spreads in the east Songnen plain. When global warming continues to rise to 3°C, the heaviest chilling damage remains largely the same in the area to the north 50 N, but coverage of the two other levels of DCD contracts and is limited in the plains between the Xing'anling and Changbai mountains. For 4°C global warming, the extent of light chilling damage further decreases, and there would be no more chilling damage in the Changbai Mountains.
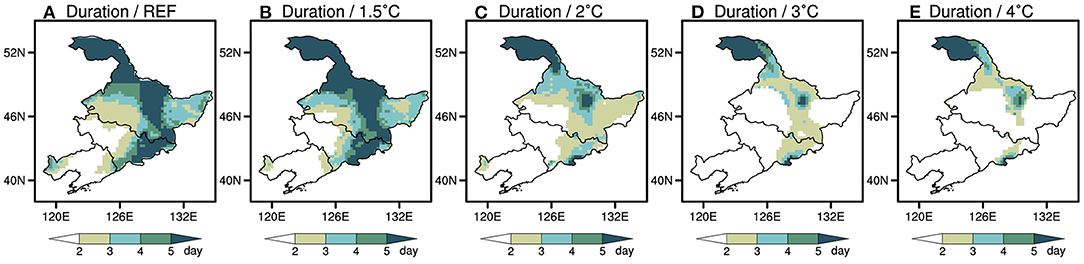
Figure 10. Spatial distributions of chilling damage duration (unit: day) for (A) reference (1986–2005) and (B–E) future projection by LMDZ-MME in Northeast China.
The temporal variation of chilling damage of Northeast China during reference and projection time periods is shown in Figure 11A. During the reference time, the duration decreases at a rate of −0.20 d/10a, and the longest one exceeds 9 days. For 2006–2100, the duration of cold days decreases significantly at a rate of −0.39 d/10a with a significance level of 0.05. In addition, projected DCD shows a decadal variability, as Northeast China has longer low temperature days during 2006–2030 than the current climate by about 1.3 days. With regard to the effects of chilling damage on rice, both the extent and duration of a cold event in Northeast China decrease significantly with time, which indicates that rice is unlikely to be affected by severe chilling damage under the RCP8.5 emission scenario.
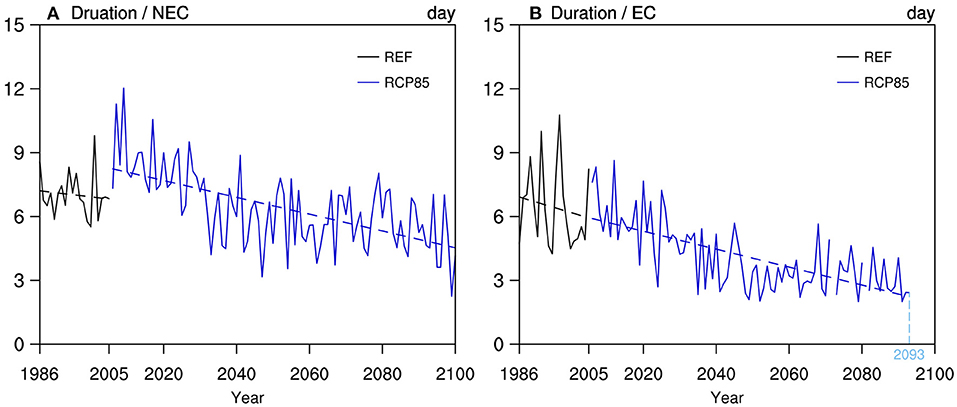
Figure 11. Time series of chilling damage duration (unit: day) for reference (1986–2005) and future projection (2006–2100) by LMDZ-MME averaged over (A) Northeast China and (B) Central and East China. The black solid line indicates the historical simulation, and the blue solid line indicates the projection results under the RCP8.5 scenario; the dotted line indicates the linear regressions. The vertical light blue line and corresponding year represents the last time of event occurrence.
With global warming intensifying, a decrease of DCD also occurs in Central and East China (figure not shown). Similar to the pattern in the reference period, chilling damage mainly concentrates in the mountainous area under 1.5°C global warming. The heaviest damage in the Taihang Mountains reduces slightly, and two other level events basically maintain. With global warming reaching 2°C, the range of the heaviest chilling damage further reduces. If the global average warming reaches 3°C, cold events with duration longer than 5 days would not exist in Central and East China. Meanwhile, the extent of medium and light damage decreases gradually. With the global warming reaching 4°C, only the moderate and light chilling damage can be detected in Hebei and Shanxi provinces. Similar to those in Northeast China, chilling damage would greatly reduce in coverage, scattering over a few rice-producing areas in the north of Central and East China.
The DCD in Central and East China also has a decreasing tendency during both historical and projection time periods (Figure 11B). During the reference period, the duration has large interannual variability and linearly decreases with time at a rate of −0.52 d/10a. For 2006–2100, the DCD decreases at a rate of −0.42 d/10a with a significant level of 0.05. Notably, few chilling damages exist in Central and East China after 2093 under RCP8.5.
Changes of Impact Intensity and Coverage
As shown in Figure 12, DCD decreases gradually in both Northeast China and Central and East China though the discrepancies among different global warming thresholds are evident.
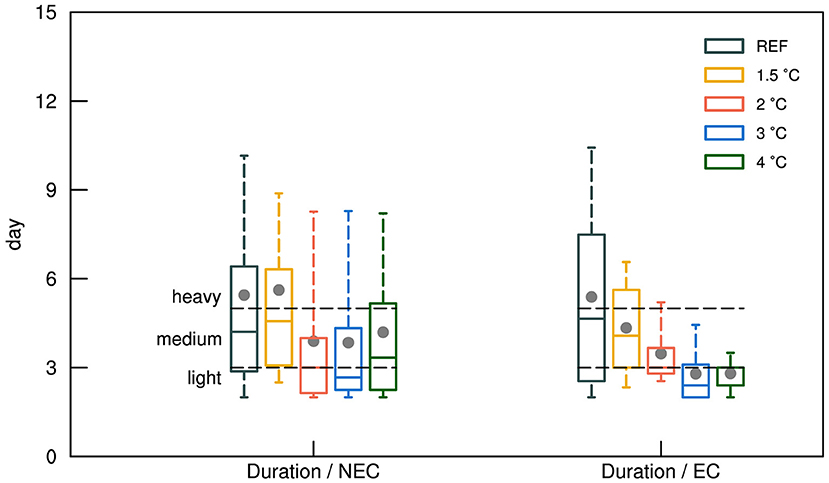
Figure 12. Boxplots of chilling damage duration (unit: day) during the reference time period (1986–2005) and for 1.5, 2, 3, and 4°C warming levels in the future by LMDZ-MME over Northeast China and Central and East China. The top and bottom whiskers are the 10th and 90th percentiles. The black dotted lines indicate the corresponding rank of durations.
For Northeast China, light level chilling damage occurs over 25% of the area during the reference period. Under 1.5°C global warming, the median and mean are even greater than that in the reference period although the range of duration between 10th and 90th percentiles decreases by comparison. When global warming reaches 2°C, the median and mean reduces rapidly from 4.57 to 3.00 and 5.62 to 3.89 days, respectively (the former is the corresponding value under 1.5°C warming). Projection under 2°C warming associates with a much smaller interquartile model spread compared with that under 1.5°C warming, showing a larger proportion of light cold events and smaller of the heaviest one among cold events. However, a range between the 10th and 90th percentiles reduces slightly, which indicates that there is larger uncertainty in model projection under the warmer case. The response of DCD to 3°C global warming is similar to that of 2°C warming with a little bit lower median (2.67 days) and close mean (3.84 days). With the global warming rising to 4°C, the median, mean, and interquartile spread increase again. Proportion of medium-level chilling damage becomes greater.
Compared with Northeast China, the spread and intermodel variability of DCD differ among four global warming thresholds more obviously in Central and East China. During the reference period, although the heaviest chilling damage exists only at the north of Hebei and Shanxi province, it takes nearly half of the extent of cold events when a medium level event takes another. Under 1.5°C global warming, the range of duration decreases rapidly, particularly the 90th percentile end. The median and mean values reduce from 4.65 to 4.08 days and 5.39 to 4.34 days, respectively. When global warming is 2°C, the interquartile model spread further reduces evidently with median and mean decreasing by nearly 1 day. Medium chilling damage predominates the area. After global warming reaching 3 and 4°C, significantly, there is hardly any existence of the heaviest chilling damage. Light-intensity events become the main trend of damage.
To examine the response of regional coverage of cold events from various severity to different warming levels, we define SC and SCi (i stands for the intensity levels) indices to focus on this part through investigating their temporal variation (Figure 13).
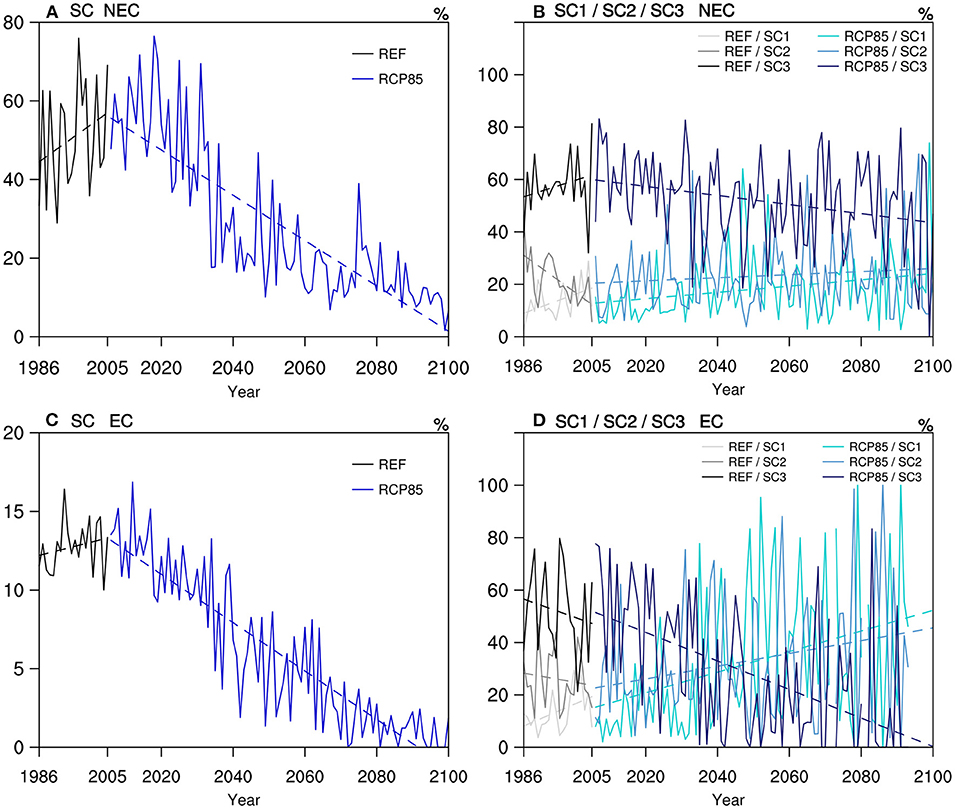
Figure 13. Time series of control and projected indexes of regional impact of chilling damage (SC, unit: %) and of regional coverage of chilling damage with different intensity (SC1/SC2/SC3, unit: %) averaged over the (A,B) Northeast China and (C,D) Central and East China during 1986–2100. The light gray, dark gray, and black solid lines are for the historical simulation, and the light, bright, and dark blue lines represent the projection results under RCP8.5 scenario. The corresponding dotted lines indicate the linear regressions.
In Northeast China, the range of cold events (SC) increases at a rate of 6.55%/10a with a maximum percentage close to 80% during the reference period (Figure 13A). Among these events, the proportion of the heaviest (SC1) and light (SC3) damage continue to increase with time at rate of 5.05% and 4.39% per decade, respectively. Instead, the percentage of damage with medium intensity (SC2) decreases at rate of −9.89%/10a, and the trend passes the significant test at the 0.05 significance level.
However, SC decreases sharply at a significant rate of −5.76%/10a in 2006–2100 under the RCP8.5 scenario, especially after 2040s. By the end of the twenty-first century, the extent of occurrence of chilling damage is almost zero. On the other hand, different from the simulation, projected SC1 and SC2 both show the slow rise tendency at rate of 1.20 and 0.59% per decade with the former passing the significant test. On the contrary, projected SC3 declines at a significant rate of −1.73%/10a, which is faster than two other level events. These results indicate that, in the warming future, the range and intensity of chilling damage in Northeast China decrease constantly.
Events in Central and East China are similar to those in Northeast China with much slower trends at a rate of 0.58%/10a (Figure 13C). Because of wider domains and lower latitude, SC of Central and East China has a smaller value and the maximum is about 16%. Considering the different intensity level of the event, both SC2 and SC3 reduce at a rate of −2.43 and −4.89% per decade. SC1 has the opposite trend and increases at a significant rate of 5.89%/10a. What is more, in common with events in Northeast China, SC declines rapidly at a rate of −1.54%/10a under RCP8.5 scenario. Particularly, the range of chilling damage reaches zero first around the 2070s. Besides this, SCi in Central and East China has the same tendency as in Northeast China, i.e., SC1 and SC2 increase at rate of 3.93% and 2.43% per decade, and SC3 declines at a rate of −5.44%/10a. All tendencies in Central and East China under the RCP8.5 scenario pass the significance test at the 0.05 significance level. Note that the amplitude of SCi in Central and East China is much larger that in Northeast China, SC1 even varying from 0 to 100% in the late twenty-first century.
In summary, chilling damage in Northeast China and Central and East China have similar characteristics of variation under global warming; that is, the spatial scale and duration of chilling damage reduces continuously with time. Events in Central and East China change at faster and more dramatic rates in comparison. The rice production area affected by cold events is also reducing gradually with global warming, particularly for areas in Northeast China.
Conclusion
Most of the rice yield of China is produced in the east, northeast, and central parts of the country, where the regional climate is dominated by the large-scale atmospheric circulations, such as the East Asia summer monsoon as well as regional scale climate processes. The regional climate change, including the occurrence of high temperatures and heavy rainfall events, can greatly affect regional crop production under future warming scenarios. Globally, the potential crop reduction in the future warming and increased extreme climate would enlarge the undernourished population and obscure the opportunities to fight poverty. Therefore, accurate evaluation of changes in rice-production related climate extremes can reduce the uncertainty in estimation of global food yields, improving the strategies and actions to secure regional food availability, guaranteeing the future sustainable agricultural development. In this study, we apply a stretch grid global model LMDZ4 to downscale six CMIP5 GCMs for historical and future regional climate under the emission pathway of RCP8.5. The temperature-related rice damage indexes were then generated using an ensemble average of six LMDZ4 downscaling runs (LMDZ MME). Our analysis shows that LMDZ can well-reproduce the spatial characteristics of both heat and chilling damage in Northeast China and Central and East China, especially in terms of presenting the heaviest chilling damage. LMDZ MME underestimates the magnitude of heat damage indexes for the area south of 32N when it shows an overestimation for the area north of 34N.
As temperatures are rising under the RCP8.5 emission pathway globally, significant changes in heat damage in the future are projected. For Northeast China, the extent of heat events continuously spread eastward with rapid increasing intensity, particularly under the 2°C threshold of global warming and above. For Central and East China, the rice heat damage spreads from a narrow band in Central China to the surrounding areas. When global warming reaches 4°C, almost the whole region is under the influence of a rice heat event of various intensities.
In the next 95 years, all of the heat indexes increase at a significant rate. Among the indices, Ha has the fastest increasing rate, followed by SDHD and MDHD, and finally TMX in both regions. In terms of coverage of heat damage, the proportion of medium and heavy events gradually increases and light events decrease dramatically with the whole damage extent spreading, especially in Central and East China. Meanwhile, DCD and its spatial range in Northeast China and Central and East China both decrease with time for different global warming thresholds. It can be concluded that the rice production in the future will be less affected by the chilling events. Regionally, the chilling damage in Central and East China drops faster in coverage, whereas in Northeast China, relatively larger uncertainty is observed in model projected chilling events.
Chou et al. (2021) also show that Ha in North and Central China increased by 3.4–4.3°C/day and low-temperature damage decreased steadily in Northeast China when the global temperature rises from 1.5 to 2°C under SSP245 scenario. Similar results here confirm that Northeast China and Central and East China will experience a significant rise in risk of extreme heat disasters, significantly increasing the negative impact on rice production. With the growing population, unbalanced geographic distribution of wealth and resources, meeting the requirement/need for basic food and nutrition is a task in many regions and countries. At the same time, the urbanization in the major rice production countries of East and South Asia continues to expand, accelerating the transfer of precious paddy fields and other cropland into urban areas. In the future, the shortage of land and intensified natural disasters related to warmer climates would damage the already fragile rice production, adding an extra dimension of challenges and uncertainties in assessing the future food security. This paper is committed to estimate the responses of extreme temperature and related rice disasters to various warming thresholds in a major rice production area of China. So far, the influence of rice varieties, prices, planting techniques, and other socioeconomic factors is not considered in our study though we believe they all play important roles on rice security at various spatial and temporal scales. In the future, by applying the Earth System Model that contains the socioeconomic module, more thorough assessment can be performed.
Data Availability Statement
The original contributions presented in the study are included in the article/supplementary material, further inquiries can be directed to the corresponding author/s.
Author Contributions
SL was responsible for data analysis, plotting, and drafting the manuscript. SW and GT contributed to the experimental design, providing analysis plan, and drafting the manuscript. ZJ and JC contributed to this work by providing data, related references, information, and proofreading of the manuscript. All authors contributed to the article and approved the submitted version.
Funding
This research was supported by the National Key Research Development Program of China (2017YFA0603803) and Science and Technology Development Plan in Jilin Province of China (Grant 20180101016JC).
Conflict of Interest
The authors declare that the research was conducted in the absence of any commercial or financial relationships that could be construed as a potential conflict of interest.
Publisher's Note
All claims expressed in this article are solely those of the authors and do not necessarily represent those of their affiliated organizations, or those of the publisher, the editors and the reviewers. Any product that may be evaluated in this article, or claim that may be made by its manufacturer, is not guaranteed or endorsed by the publisher.
References
Aggarwal, P. K., Bandyopadhyay, S. K., Pathak, H., Kalra, N., Chander, S., and Kumar, S. (2000). Analysis of yield trends of the rice-wheat system in north-western India. Outlook Agric. 29, 259–268. doi: 10.5367/000000000101293329
Bao, Y.-X., Liu, W., Gao, P., and Shen, S.-H. (2012). Study on characteristics of rice heat damages in Jiangsu province under the background of climate warming and its influence on the rice yield. Chin. J. Agrometeorol. 33, 289–296. doi: 10.3969/j.issn.1000-6362.2012.02.022
Bates, B.C., Kundzewicz, Z. W., Wu, S., and Palutikof, J. P., (eds.). (2008). Climate Change and Water. Technical Paper of the Intergovernmental Panel on Climate Change. Geneva: IPCC Secretariat. p. 210.
Chen, J., Gao, C., Zeng, X., Xiong, M., Wang, Y., Jing, C., et al. (2017). Assessing changes of river discharge under global warming of 1.5 °C and 2 °C in the upper reaches of the Yangtze River Basin: approach by using multiple- GCMs and hydrological models. Quat. Int. 453, 63–73. doi: 10.1016/j.quaint.2017.01.017
Chou, J., Zhao, W., Li, J., Xu, Y., Yang, F., Sun, M., et al. (2021). Changes in extreme climate events in rice-growing regions under different warming scenarios in China. Front. Earth Sci. 9, 655128. doi: 10.3389/feart.2021.655128
Dufresne, J. L., Foujols, M. A., Denvil, S., Caubel, A., Marti, O., Aumont, O., et al. (2013). Climate change projections using the IPSL-CM5 earth system model: from CMIP3 to CMIP5. Clim. Dyn. 40, 2123–2165. doi: 10.1007/s00382-012-1636-1
Fischer, G., Shah, M., and van Velthuizen, H. (2002). Climate Change and Agriculture Vulnerability. Special Report as Contribution to the World Summit on Sustainable Development, Johannesburg 2002. Laxenburg: International Institute for Applied Systems Analysis. p. 150–152.
Frédéric, H., Ionela, M., Sandrine, B., Pascale, B., Francis, C., and Jean-Louis, D. (2006). The LMDZ4 general circulation model: climate performance and sensitivity to parametrized physics with emphasis on tropical convection. Clim. Dyn. 27, 787–813. doi: 10.1007/s00382-006-0158-0
Gao, Q., Jiang, Z., and Li, Z. (2017). Simulation and evaluation of multi-model dynamical downscaling of temperature extreme indices over the Middle and East China. Acta Meteorol. Sin. 75, 917–933. doi: 10.11676/qxxb2017.067
Guo, L., Gao, Q., Jiang, Z., and Laurent, L. (2018). Bias correction and projection of surface air temperature in LMDZ multiple simulation over central and eastern China. Adv. Clim. Change Res. 9, 81–92. doi: 10.1016/j.accre.2018.02.003
Huang, J., Ji, M., Liu, Y., Zhang, L., and Gong, D. (2013). An overview of arid and semi-arid climate change. Adv. Clim. Change Res. 9, 9–14. doi: 10.3969/j.issn.1673-1719.2013.01.002
Hui, P., Tang, J., Wang, S., Niu, X., Zong, P., and Dong, X. (2018a). Climate change projections over China using regional climate models forced by two CMIP5 global models. Part I: evaluation of historical simulations. Int. J. Climatol. 38, e57–e77. doi: 10.1002/joc.5351
Hui, P., Tang, J., Wang, S., Niu, X., Zong, P., and Dong, X. (2018b). Climate change projections over China using regional climate models forced by two CMIP5 global models. Part II: projections of future climate. Int. J. Climatol. 38, e78–e94. doi: 10.1002/joc.5409
IFPRI (2016). 2016 Global Food Policy Report. Washington, DC: International Food Policy Research Institute.
IPCC (2013). Climate Change 2013: The Physical Science Basis. Contribution of Working Group I to the Fifth Assessment Report of the Intergovernmental Panel on Climate Change. [Stocker, T.F., Qin, D., Plattner, G.-K., Tignor, M., Allen, S.K., Boschung, J., Nauels, A., Xia, Y., Bex, V., and Midgley, P. M., (eds.)]. Cambridge, UK; New York, NY: Cambridge University Press. p. 1535.
Li, Z. (1999). Ensemble atmospheric GCM simulation of climate interannual variability from 1979 to 1994. J. Clim. 12, 986–1001. doi: 10.1175/1520-0442(1999)012<0986:EAGSOC>2.0.CO;2
Li, Z., Liu, Z., Anderson, W., Yang, P., Wu, W., Tang, H., et al. (2015). Chinese rice production area adaptations to climate changes, 1949–2010. Environ. Sci. Technol. 49, 2032–2037. doi: 10.1021/es505624x
Ma, S., Wang, Q., Wang, C., and Huo, Z. (2011). Climate risk and economy vulnerability of rice chilling damage and division in Northeast China. Geograph. Res. 30, 931–938. doi: 10.11821/yj2011050017
Mei, F. Q., Wu, X. Z., Yao, C. X., Li, L. P., Wang, L., and Chen, Q. Y. (1988). Rice cropping regionalization in China. Chin. Rice Sci. J. 2, 97–110. doi: 10.16819/j.1001-7216.1988.03.001
People Republic of China Meteorological Industry Standard (2009). Grade of Chilling damage for rice and maize, the People Republic of China Meteorological Industry Standard QX/T 101-2009. Available online at: www.csres.com/ (accessed Jan, 18, 2022).
People Republic of China National Standard (2020). Meteorological Grades of Hot Damage to Rice, the People Republic of China National Standard GB/T 37744-2019. Available online at: www.cma.gov.cn (accessed Jan, 18, 2022).
Sekhar, C.S. C. (2018). Climate Change and Rice Economy in Asia: Implications for Trade Policy. Rome: FAO. p. 62.
Shi, Y., Guo, E., Zhang, Z., Zhu, X., and Yang, X. (2020). Spatial-temporal characteristics of agricultural climate resources and sterile-type chilling injury in rice growing season in three provinces of Northeast China. Chin. J. Appl. Ecol. 31, 1625–1635. doi: 10.13287/j.1001-9332.202005.030
Tao, F., Yokozawa, M., Hayashi, Y., and Lin, E. (2003). Changes in agricultural water demands and soil moisture in China over the last half-century and their effects on agricultural production. Agric. For. Meteorol. 118, 251–261. doi: 10.1016/S0168-1923(03)00107-2
Tao, F., Yokozawa, M., Zhang, Z., Hayashi, Y., Grassl, H., and Fu, C. (2004). Variability in climatology and agriculture production in China in association with the East Asian summer monsoon and El Nino Southern Oscillation. Clim. Res. 28, 23–30. doi: 10.3354/cr028023
Wang, J., Huang, J., and Rozelle, S. (2010). Climate Change and China's Agricultural Sector: An Overview of Impacts, Adaptation and Mitigation, ICTSD–IPC Platform on Climate Change, Agriculture and Trade, Issue Brief No.5. International Centre for Trade and Sustainable Development. Geneva, Switzerland and International Food and Agricultural Trade Policy Council, Washington DC, USA.
Wang, P., Wei, X., Zhang, Z., Chen, Y., Song, X., Shi, P., et al. (2020). A review of cold injury and heat damage to rice growth under global warming. Resour. Sci. 36, 2316–2326.
Wijeratne, M. A. (1996). Vulnerability of Sri Lanka tea production to global climate change. Water Air Soil Pollut. 92, 87–94. doi: 10.1007/978-94-017-1053-4_8
Wu, J., and Gao, X. (2013). A gridded daily observation dataset over China region and comparison with the other datasets. Chin. Geophys. J. 56, 1102–1111. doi: 10.6038/cjg20130406
Xiong, W., Feng, L., Ju, H., and Yang, D. (2016). Possible impacts of high temperatures on China's rice yield under climate change. Adv. Earth Sci. 31, 515–528. doi: 10.11867/j.issn.1001-8166.2016.05.0515
Yang, H., Jiang, Z., and Laurent, L. (2016). Biases and improvements in three dynamical downscaling climate simulations over China. Clim. Dyn. 47, 3235–3251. doi: 10.1007/s00382-016-3023-9
Yang, J., Zhang, Y. Z., He, H. H., Li, Y. C., Chen, X. R., Bian, J. M., et al. (2020). Current status and research advances of high-temperature hazards in rice. Ying Yong Sheng Tai Xue Bao. 31, 2817–2830. doi: 10.13287/j.1001-9332.202008.027
Keywords: heat and chilling damage, damage index, global warming, regional climate, rice production
Citation: Luo S, Jiang Z, Chou J, Tu G and Wang S (2022) Response of Temperature-Related Rice Disaster to Different Warming Levels Under an RCP8.5 Emission Scenario in a Major Rice Production Region of China. Front. Clim. 3:736459. doi: 10.3389/fclim.2021.736459
Received: 05 July 2021; Accepted: 17 December 2021;
Published: 15 February 2022.
Edited by:
Bai-Lian Li, University of California, Riverside, United StatesReviewed by:
Chujie Gao, Hohai University, ChinaXiong Zhe, Institute of Atmospheric Physics (CAS), China
Laurent Li, UMR8539 Laboratoire de Météorologie Dynamique (LMD), France
Copyright © 2022 Luo, Jiang, Chou, Tu and Wang. This is an open-access article distributed under the terms of the Creative Commons Attribution License (CC BY). The use, distribution or reproduction in other forums is permitted, provided the original author(s) and the copyright owner(s) are credited and that the original publication in this journal is cited, in accordance with accepted academic practice. No use, distribution or reproduction is permitted which does not comply with these terms.
*Correspondence: Gang Tu, c2hlbnhpbnR1QGFsaXl1bi5jb20=; Shuyu Wang, d3N5QG5qdS5lZHUuY24=