
94% of researchers rate our articles as excellent or good
Learn more about the work of our research integrity team to safeguard the quality of each article we publish.
Find out more
PERSPECTIVE article
Front. Clim., 20 December 2021
Sec. Climate Services
Volume 3 - 2021 | https://doi.org/10.3389/fclim.2021.732174
This article is part of the Research TopicDemocratizing Data: Environmental Data Access and its FutureView all 10 articles
 Aaron D. Sweeney1,2*
We demonstrate that data abstraction via a timeline visualization is highly effective at allowing one to discover patterns in the underlying data. We describe the rapid identification of data gaps in the archival time-series records of deep-ocean pressure and coastal water level observations collected to support the NOAA Tsunami Program and successful measures taken to rescue these data. These data gaps had persisted for years prior to the development of timeline visualizations to represent when data were collected. This approach can be easily extended to all types of time-series data and the author recommends this type of temporal visualization become a routine part of data management, whether one collects data or archives data.
Timelines are an effective way of visualizing data inventory, leading to the improvement of both data curation and exploration (Kräutli, 2016; Shneiderman et al., 2017). They offer a two-dimensional, graphical representation of history, often with important events annotated. The NOAA National Centers for Environmental Information (NCEI) is the long-term archive (hereafter, referred to as the Archive) for ocean-bottom pressure data (National Oceanic and Atmospheric Administration, 2005) and coastal tide gauge data (Center for Operational Oceanographic Products Services, 2007) collected in support of the NOAA Tsunami Program. The Archive also provides quality control and tidal analysis of these data and maintains authoritative information regarding past tsunamis (including sources) in the NCEI and the collocated World Data Service for Geophysics (WDS) Global Historical Tsunami Database (National Geophysical Data Center/World Data Service, 2018). Roughly speaking, the pressure goes up one atmosphere for every 10 meters of water (Fofonoff and Millard, 1983). When we first started working at what was then the NOAA National Geophysical Data Center in Boulder, CO, we wanted to understand the extent of water level data we were managing. One had access to archive tape listings, maps, and spreadsheets, but one could not make sense of the when and where of the data and any underlying patterns. Inspired by the data visualization work of Robert Aspinall at the NOAA Center for Operational Oceanographic Products and Services (CO-OPS, https://tidesandcurrents.noaa.gov/inventory.html?id=9410230) and our own experience with web development, we began to play with a number of open-source, Javascript libraries to display information about the data. Vis.js (http://visjs.org/) had the best functionality out-of-the-box, had good documentation, and is free and dual-licensed under Apache-2.0 and MIT. The construction of the timeline was much easier once we converted all the data, archived as a mix of tabular data and hierarchical XML, to a common standard, array-based format (netCDF) meeting the interoperable goal of the FAIR Data Principles (Findable, Accessible, Interoperable, and Re-usable) (Wilkinson et al., 2016). The construction of time-series netCDF files followed the guidance provided by NCEI at https://www.ncei.noaa.gov/data/oceans/ncei/formats/netcdf/v2.0/index.html. We could then more easily extract and add the temporal bounds of the data—start and end times as well as data gaps—to the timeline. In an era of big data, visualizing and interacting with information about the data, before diving into the details, can leverage the power of human perception and insight (Shneiderman et al., 2017). Visualization reduces the need to formulate, in advance, specific questions about the data. Unforeseen patterns emerge through interaction with and exploration of the visualization. To our surprise, the visualization of the ocean-bottom pressure data and coastal tide gauge data revealed data gaps and patterns.
It is extremely important to have continuous, uninterrupted time-series of water level measurements, even in the absence of tsunami observations. These data are the ground truth for tsunami propagation models. In other words, if the model predicts a tsunami to arrive at a given tide gauge location, but that tide gauge observation showed no tsunami present, then that model needs to be refined and corrected. If we don't have a measurement, we cannot validate the model. We cannot go back and remeasure the past, so every observation counts.
Data are considered at-risk of being lost or, at least “un-FAIR,” until they are archived and managed at NCEI. Success in finding and filling gaps depends on data providers being interested and willing collaborators. Our primary data provider for ocean bottom pressure data is the National Data Buoy Center (NDBC), and when the Deep-ocean Assessment and Reporting of Tsunamis (DART®) data inventory timeline (see https://www.ngdc.noaa.gov/hazard/dart and the associated Javascript code at https://www.ngdc.noaa.gov/hazard/js/dart_inventory_timeline.js) went live in 2016, NDBC examined it closely and compared it with their record of seafloor pressure sensor deployments (spreadsheets). Each sensor deployment on the seafloor produces 1–3 years of data and supporting metadata, generally stored in separate files. These data and metadata files from a single deployment are referred to as a “data package.” NDBC identified over 20 deployment data packages, going back as far as 12 years, that had not been submitted to NCEI for archive—including one that detected tsunami waves (Figure 1). Without the timeline, these data may have been lost forever.
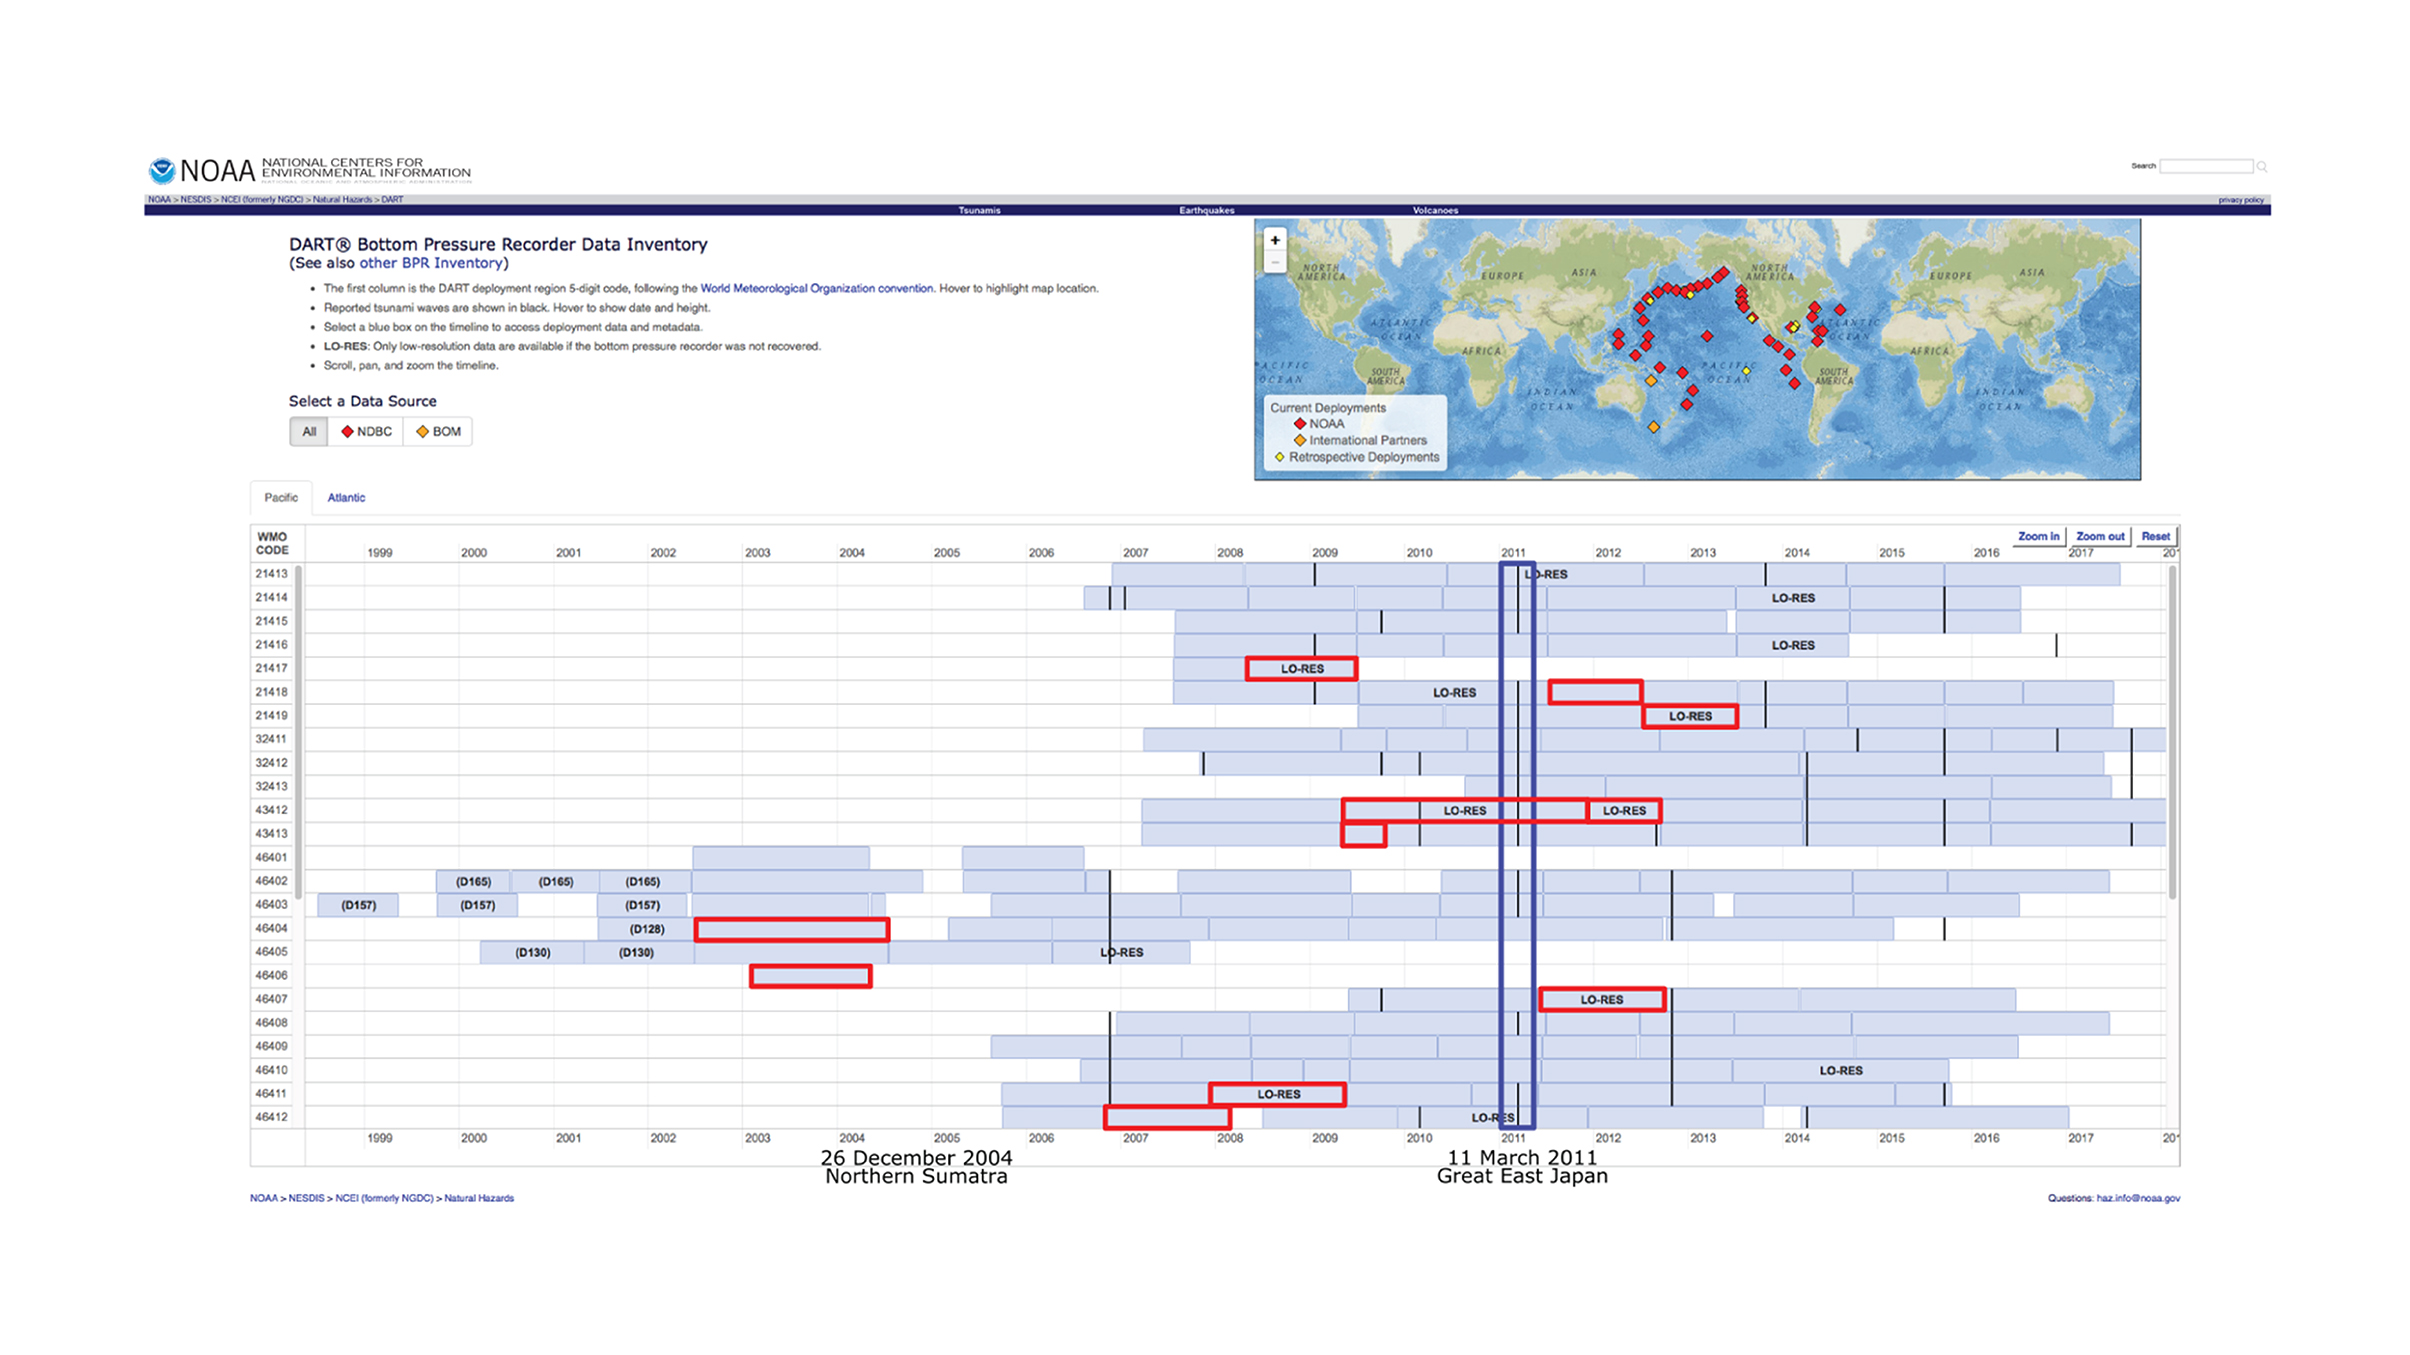
Figure 1. A timeline and map view of DART® ocean bottom pressure data archived at NCEI. As a result of the 26 December 2004 Northern Sumatra earthquake and tsunami, the U.S. DART® network was expanded from 6 to 39 stations by 2008. Superposed on the timeline are the dates of observed tsunami waves. As an example, observations of the 11 March 2011 Great East Japan earthquake and tsunami are circled in dark blue. More than 20 gaps in the Archive were identified by visual inspection of this timeline and filled by NDBC (circled in red, not all visible in this screenshot), including one deployment that observed two tsunamis. High resolution, 15-s data is stored on the seafloor instrument until recovery. If the instrument was not recoverable, lower resolution data (i.e., “LO-RES”) reported in real-time is archived instead. See https://www.ngdc.noaa.gov/hazard/dart.
With the coastal tide gauge inventory published (https://www.ngdc.noaa.gov/hazard/tide), a clear pattern of data transfer hiccups to NCEI really stood out: we observed a coincident absence of archived data from the entire network on specific days. Fortunately, CO-OPS holds onto all of their data for characterizing long-term changes and for defining tidal datums, so filling in the gaps at NCEI was possible. Specifically, we identified gaps in the Archive of 1-min water-level data going back to 2008 and rescued an average of 3 months of data per station across 243 coastal tide gauge stations operated by CO-OPS. We rescued more than 6 months of data from 13 stations—the longest record was 3 years' worth of data from Pago Pago, American Samoa. These rescued data include observations of two tsunamis at Pago Pago and Kwajalein, Marshall Islands.
These backfilled data have been incorporated into our quality-controlled and de-tided products (Mungov et al., 2013). One unexpected benefit of this Archive reconciliation effort was the discovery and correction of a reporting error: the CO-OPS Data API reported two heights for the same time for 20 stations on a select number of dates. We provided details to CO-OPS so they could troubleshoot and resolve this issue. This work directly supports NOAA's data stewardship role by ensuring the ocean environmental record is complete, preserved, and accessible.
Constructing a timeline from the NCEI/WDS Global Historical Tsunami Database of reported times and heights of maximum tsunami waves and the inventory of water level data can help us fill in our record of reported tsunami waves. We can immediately see where adjacent stations observed tsunami waves and begin to take a look at stations where no report was made, but where a closer examination of the quality-controlled and de-tided water level data may reveal additional tsunami detections.
The NCEI/WDS Global Historical Tsunami Database consists of dates and heights as reported in real-time by the National Tsunami Warning Center (NTWC) or the Pacific Tsunami Warning Center (PTWC). The centers are selective about which stations they typically examine, and they don't always report all stations, especially if an event was small. With our timeline, we can zero in on times and locations when and where a tsunami ought to have been detected. Because we have access to the digital time-series data, we then have an opportunity to fill in the database with additional reports.
Timeline visualizations promote event-driven data exploration and discovery. The most difficult aspect for a data curator is deciding which events and other sources of information to include and which sources are authoritative. During a tsunami event, NTWC and PTWC provide products listing the times and maximum heights of tsunami waves at select stations in their respective areas of operation. These are superposed on the DART® and tide gauge data inventory timelines to draw attention to events that may be of interest. Station pages (Figure 2) are linked from the timelines and provide access to raw data, quality-controlled and de-tided data products, modeled tidal constituents, summary time-series plots, and supporting metadata. In the future, we plan to enhance the station pages with interactive plots. We also hope to archive and redistribute data from international partners, with appropriate agreements in place.
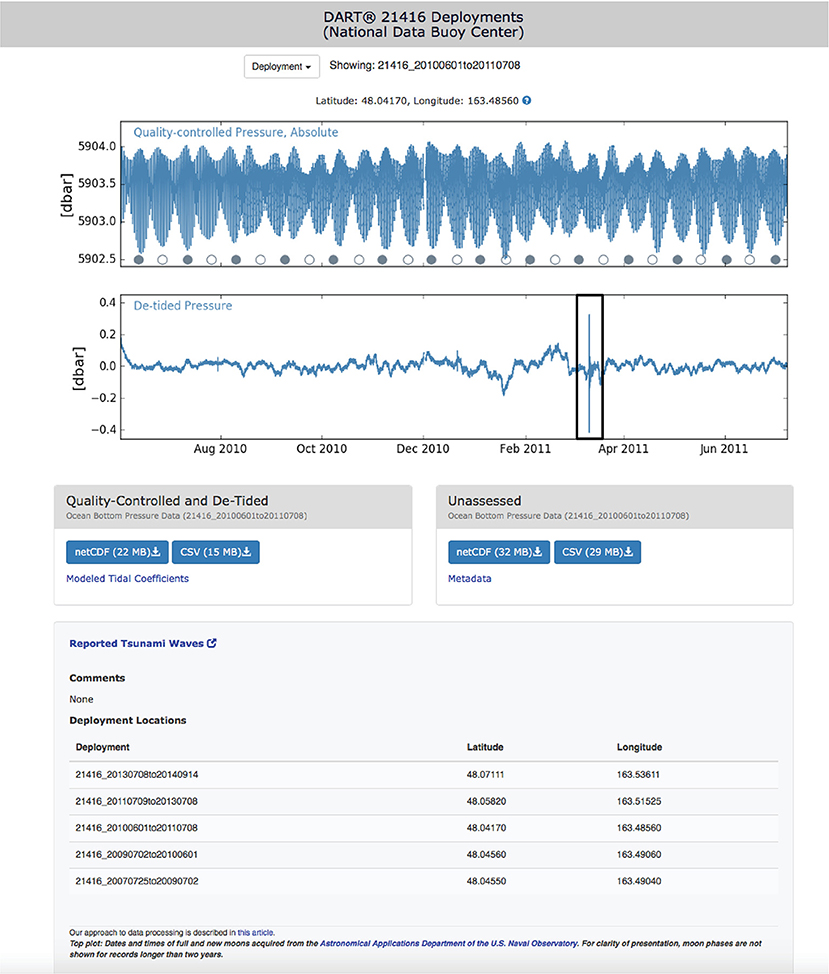
Figure 2. Clicking on one of the blue segments on the timeline (Figure 1) takes you to a page like this one. The deployment or station page shows a plot preview of quality-controlled data, clearly showing tidal oscillations that correlate with the dates of the new and full moon (gray and white circles, respectively), and de-tided data. The observation of the 11 March 2011 Great East Japan tsunami is circled in black.
These products support the operational forecasting efforts of the Tsunami Warning Centers and the research efforts of the NOAA Center for Tsunami Research (NCTR) under the auspices of the NOAA Tsunami Program, as well as the broader tsunami modeling community. If you have data you would like us to archive and re-distribute, please contact us ataGF6LmluZm9Abm9hYS5nb3Y=.
Publicly available datasets were analyzed in this study. This data can be found at: https://doi.org/10.7289/V59884XF, https://doi.org/10.7289/V5F18WNS, https://doi.org/10.7289/V5PN93H7.
AS was responsible for the research and development of the timelines, including data abstraction, and writing the manuscript.
This work was supported by the NOAA Cooperative Agreement with CIRES, NA17OAR4320101. The Archive was supported by the NOAA National Weather Service and the NOAA National Environmental Satellite, Data, and Information Service. Publication of this article was funded by the University of Colorado Boulder Libraries Open Access Fund.
The author declares that the research was conducted in the absence of any commercial or financial relationships that could be construed as a potential conflict of interest.
All claims expressed in this article are solely those of the authors and do not necessarily represent those of their affiliated organizations, or those of the publisher, the editors and the reviewers. Any product that may be evaluated in this article, or claim that may be made by its manufacturer, is not guaranteed or endorsed by the publisher.
A special thank to Dr. George Mungov for providing water level quality-control and tidal analysis and to Nicolas Arcos and Paula Dunbar for providing quality assurance of historical tsunami information. Main data providers include the National Data Buoy Center, the Center for Operational Oceanographic Products and Services, the National Tsunami Warning Center, the Pacific Tsunami Warning Center, and the Pacific Marine Environmental Laboratory. We are grateful to Richard Bouchard at NDBC for identifying and submitting DART® packages not previously archived, to Heather McCullough at NCEI for web page design review and suggestions, to John Cartwright at NCEI for mapping library considerations, and to Dr. Danielle Szafir at CU Boulder for discussion of user interfaces and design studies.
Center for Operational Oceanographic Products and Services (2007). CO-OPS 1-Minute Tsunami Water Level Data. NOAA National Centers for Environmental Information.
Fofonoff, N. P., and Millard, R. C. (1983). Algorithms for Computation of Fundamental Properties of Seawater. No. 44. Paris: UNESCO Technical Papers in Marine Sciences.
Kräutli, F. (2016). Visualising Cultural Data: Exploring Digital Collections Through Timeline Visualisations. (Dissertation), Royal College of Art. ProQuest Dissertations Publishing, London (United Kingdom).
Mungov, G., Eblé, M., and Bouchard, R. (2013). DART® tsunameter retrospective and real-time data: a reflection on 10 years of processing in support of tsunami research and operations. Pure Appl. Geophys. 170, 1369–1384. doi: 10.1007/s00024-012-0477-5
National Geophysical Data Center/World Data Service (2018). NCEI/WDS Global Historical Tsunami Database. NOAA National Centers for Environmental Information. doi: 10.7289/V5PN93H7
National Oceanic and Atmospheric Administration (2005). Deep-Ocean Assessment and Reporting of Tsunamis (DART®). NOAA National Centers for Environmental Information. doi: 10.7289/V5F18WNS
Shneiderman, B., Plaisant, C., Cohen, M., Jacobs, S., Elmqvist, N., and Diakopoulos, N. (2017). Defining the User Interface: Strategies for Effective Human-Computer Interaction, 6th Edn. Boston, MA: Pearson.
Keywords: data management, data rescue, timeline, tsunamis, visualization, water level
Citation: Sweeney AD (2021) Timeline Visualization Uncovers Gaps in Archived Tsunami Water Level Data. Front. Clim. 3:732174. doi: 10.3389/fclim.2021.732174
Received: 28 June 2021; Accepted: 30 November 2021;
Published: 20 December 2021.
Edited by:
Kevin Butler, Environmental Systems Research Institute, United StatesReviewed by:
James O'Donnell, Environmental Systems Research Institute, United StatesCopyright © 2021 Sweeney. This is an open-access article distributed under the terms of the Creative Commons Attribution License (CC BY). The use, distribution or reproduction in other forums is permitted, provided the original author(s) and the copyright owner(s) are credited and that the original publication in this journal is cited, in accordance with accepted academic practice. No use, distribution or reproduction is permitted which does not comply with these terms.
*Correspondence: Aaron D. Sweeney, YWFyb24uc3dlZW5leUBjb2xvcmFkby5lZHU=
Disclaimer: All claims expressed in this article are solely those of the authors and do not necessarily represent those of their affiliated organizations, or those of the publisher, the editors and the reviewers. Any product that may be evaluated in this article or claim that may be made by its manufacturer is not guaranteed or endorsed by the publisher.
Research integrity at Frontiers
Learn more about the work of our research integrity team to safeguard the quality of each article we publish.