 Eszter Sendula1*
 Héctor M. Lamadrid2
 J. Donald Rimstidt1†
 Matthew Steele-MacInnis3D. Matthew Sublett Jr.1
 László E. Aradi4Csaba Szabó4
 Mark J. Caddick1
 Zoltán Zajacz5
 Robert J. Bodnar1
- 1Department of Geosciences, Virginia Tech, Blacksburg, VA, United States
- 2Department of Geological Sciences, University of Missouri, Columbia, MO, United States
- 3Department of Earth and Atmospheric Sciences, University of Alberta, Edmonton, AB, Canada
- 4Lithosphere Fluid Research Laboratory, Institute of Geography and Earth Sciences, Eötvös University, Budapest, Hungary
- 5Department of Earth Sciences, University of Geneva, Geneva, Switzerland
Ultramafic and mafic rocks are possible targets for CO2 sequestration via mineral carbonation. The determination of reaction kinetics and the factors that control mineralization are important in order to understand and predict how fast injected CO2 will react with host rocks to permanently isolate and store the carbon. Here we present experimental results of olivine carbonation experiments using synthetic fluid inclusions (SFI) as micro-reactors. The micro-reactor technique coupled with non-destructive Raman spectroscopy allows us to monitor the reaction progress in situ and in real time at elevated temperatures (50–200°C) and pressures (several 10's to a few hundred bars), and quantify the amount of CO2 consumed in the reaction using the Raman CO2 densimeter and mass-balance calculations. Results show a measurable decrease of CO2 density in the fluid inclusions as a result of the reaction between the CO2-bearing seawater-like aqueous solution and olivine. Magnesite formation was observed within hours at ≥100°C, while at 50°C magnesite nucleation and precipitation was only observed after a few weeks. Raman mapping and FIB-SEM analysis confirmed the formation of a non-continuous Si-rich layer on the inclusion wall and the presence of ferroan magnesite as a reaction product. Reaction rates [log J (mol/m−2 s−1)] obtained for olivine carbonation range between ~-8.4 at 50°C and −4.7 at 200°C, which is sufficiently rapid to be suitable for commercial CO2 injection projects. Reaction rates involving a seawater-like fluid were similar to rates published for high salinity solutions containing NaHCO3, and were faster compared to rates involving solutions with low salinity. Thus, CO2 injection into submarine environments might offer some advantages over CO2 storage in onshore basalts where the pores are likely to be filled with low salinity meteoric water. The application of the synthetic fluid inclusion technique, combined with non-destructive analytical techniques, is a promising tool to monitor rates of fluid-rock reactions in situ and in real time. Here, we have documented its application to experimentally study carbonation reactions in the olivine-H2O-CO2-NaCl-MgCl2 system.
Introduction
Carbon Capture and Sequestration (CCS) in geological formations represents one possible solution to reduce greenhouse gas emissions associated with global warming. Among the various sequestration scenarios, carbon-dioxide (CO2) sequestration via carbonate mineral precipitation is considered to be one of the preferred long-term solutions to mitigate global temperature increase related to the rise in atmospheric CO2 levels (Oelkers et al., 2008). The high reactivity of mafic and ultramafic minerals (e.g., olivine, pyroxenes) compared to other silicate minerals makes rocks rich in these minerals, for example basalts and peridotites, a desirable target for CO2 sequestration via precipitation of carbonate minerals (McGrail et al., 2006; Matter and Kelemen, 2009; Matter et al., 2016). Basalts are abundant in the oceanic lithosphere and occur on land in large continental igneous provinces (e.g., Siberian Traps, Columbia River Basalt Group) and, therefore, have high storage potential both onshore and offshore. However, as noted by Benson and Cole (2008), mineral trapping of CO2 is comparatively slow compared to other geological trapping mechanisms because it depends on the dissolution of silicate minerals, thus highlighting the importance of determining rates of carbonation reactions.
Several small-scale pilot projects have been designed to study mineral carbonation by injecting CO2 into basalts. For example, at the Wallula Basalt Sequestration Pilot Project, nearly 1,000 tons of supercritical CO2 was injected into the Columbia River Basalt Group in southwestern Washington, USA (McGrail et al., 2017; White et al., 2020). Similarly, CO2 was dissolved in aqueous fluid and injected into basalt as part of the CarbFix project in Iceland (Matter et al., 2009, 2016). The CarbFix project demonstrated that within 2 years over 95% of injected CO2 was sequestered in carbonate minerals (Matter et al., 2016), while in the Wallula Basalt Pilot Project ~60% of injected CO2 was stored in minerals during a similar time period (White et al., 2020). The results of both pilot projects emphasize the high reactivity of basaltic rocks and the feasibility of mineral trapping as a viable process to reduce greenhouse gas emissions to the atmosphere.
Pilot projects have been conducted only on land, but offshore basalt formations have also been considered for submarine CO2 sequestration, including sites on the Juan de Fuca plate and the Central Atlantic Magmatic Province (Goldberg et al., 2008; Goldberg and Slagle, 2009), offshore Iceland (Snæbjörnsdóttir and Gislason, 2016), and in areas composed of old seabed where CO2 is denser than the seawater at the top of the basement rocks (Marieni et al., 2013). The presence of an aqueous solution with elevated salinity has been shown to accelerate the carbonation of olivine (Gadikota et al., 2014; Wang et al., 2019a) and basalts (Marieni et al., 2020). Thus, CO2 injection into submarine environments involving seawater might offer some advantages over CO2 storage in basalts onshore because carbonation reaction rates in the presence of seawater are likely to be faster compared to those associated with onshore basalts, where the pores are likely to be filled with low salinity meteoric water.
Because olivine is a rock forming mineral in both basalts and peridotites, the olivine carbonation reaction has been studied over a wide range of pressures, temperatures, and fluid compositions (PTX) using various experimental techniques (Giammar et al., 2005; O'Connor et al., 2005; Béarat et al., 2006; Chen et al., 2006; Gerdemann et al., 2007; Garcia et al., 2010; Kwak et al., 2010, 2011; Daval et al., 2011; Saldi et al., 2013; Gadikota et al., 2014; Johnson et al., 2014; Lafay et al., 2014; Sissmann et al., 2014; Eikeland et al., 2015; Turri et al., 2017; Ueda et al., 2017; Prikryl et al., 2018; Miller et al., 2019b). In this study, we present experimentally determined rates of olivine carbonation at temperatures ranging from 50 to 200°C in the presence of an aqueous solution with salinity similar to that of seawater, using synthetic fluid inclusions (SFI) as micro-reactors. The use of SFIs as micro-reactors applies non-destructive analytical techniques to follow the reaction in situ and in real time, and has been used successfully to monitor rates of serpentinization of olivine (Lamadrid et al., 2017b, 2021) as a function of temperature and fluid composition using changes in salinity as a proxy. In the present study, we use Raman spectroscopy to monitor reaction progress of olivine carbonation at elevated temperatures and pressures by quantifying the amount of CO2 consumed in the reaction as a function of time.
Conceptual Model
Engineered carbonation of basalts or peridotites involves the injection of compressed (sometimes referred to as “supercritical”) CO2 into the rock, which then interacts with olivine to form magnesite according to the simplified reaction:
where Ol, Mag and Qtz correspond to the phases olivine, magnesite and quartz (or amorphous silica), respectively. Note, that we use forsterite (Mg2SiO4) as a simplification in equation 1, since Fe would be present in most natural olivine, and during the reaction would be incorporated into the precipitating secondary phases (e.g., carbonates). The volume change associated with reaction (1), Vrxn, is given by:
where are the molar volumes of magnesite, quartz, olivine and CO2, respectively. Accordingly, in order for the reaction to proceed at constant volume (Figure 1A), the molar volume of CO2 must be equal to 17.06 cm3/mole, which corresponds to a density of 2.58 g/cm3:
For , the net volume change of the reaction is positive, and for , ΔVrxn is negative. In the temperature range from 50 to 200°C that we focus on in this study, is only possible at very high pressures (>20 kbar) (Pitzer, 1994). As a result, for all reasonable conditions considered, carbonation of olivine to produce magnesite results in a net negative volume change. Thus, a CO2 molar volume of 100 cm3/mole (density = 0.366 g/cm3) results in a net volume change of −165.9 cm3/mole of olivine reacted (Figure 1B).
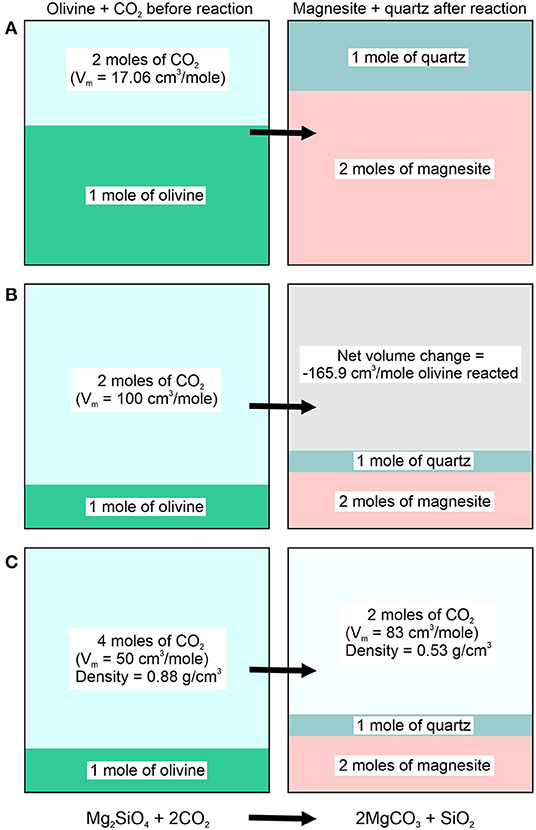
Figure 1. Conceptual model showing the volume changes of different phases associated with the carbonation of olivine in a rigid, constant volume system: (A) In order for the reaction products magnesite and quartz to completely fill the volume occupied by olivine and CO2 before the reaction begins requires that the CO2 have a molar volume of 17.06 cm3/mole. In this case, all of the initial CO2 and olivine react to form magnesite and quartz having the same total volume as that of the reactants. (B) If the molar volume of CO2 before the reaction begins is 100 cm3/mole, conversion of all of the olivine to magnesite + quartz results in a negative net volume change for the reaction (void space). (C) If excess CO2 is present before the reaction begins (i.e., the CO2/olivine molar ratio is >2), the excess CO2 will occupy the volume remaining after all of the olivine had been converted to magnesite and quartz. The CO2 phase will have a lower density compared to the density of CO2 before the reaction began.
In a rigid, constant volume system, the negative volume of reaction results in a void space (vacuum) if the amount of initial CO2 equals the stoichiometric amount required by reaction (1), i.e., 2 moles of CO2 per mole of olivine, and if 100% of the initial amount of olivine is converted to magnesite. If the system contains an excess of CO2 (e.g., 4 moles of CO2 per mole of olivine, rather than the 2 moles required for complete reaction by stoichiometry), the “negative volume” generated by the reaction is filled by the excess CO2 (2 moles) remaining after the reaction is complete. As such, if initially (density = 0.88 g/cm3), the remaining CO2 phase at the completion of the reaction would have a molar volume of 83 cm3/mole (density = 0.53 g/cm3) (Figure 1C).
The simplified conceptual model described above and illustrated on Figure 1 indicates that in a constant volume system, the density of the CO2 phase varies in proportion to the amount of magnesite being formed. Accordingly, the variation in CO2 density serves as a proxy for the extent of reaction.
In practice, carbonation of olivine does not proceed in the presence of a pure CO2 fluid. Rather, when CO2 is injected into subsurface environments containing aqueous pore fluids, some of the CO2 will dissolve into the aqueous phase to produce various molecular and ionic species in solution according to:
The decrease in pH associated with the generation of hydrogen ions via CO2 dissolution promotes olivine dissolution into the aqueous solution according to:
The amount of magnesium in solution increases until magnesite saturation is reached, at which point magnesite begins to precipitate:
Figure 2 illustrates the olivine carbonation process described by equations 1–7 in a synthetic fluid inclusion. It is important to note that in order to precipitate magnesite, the magnesium ion in solution interacts with carbonate ion dissolved in the aqueous phase and not the CO2 in the vapor phase. In this sense, the CO2 vapor phase in the SFI may be thought of as a reservoir that continuously replenishes the CO2 content of the aqueous phase as carbonate is removed to form magnesite. The amount of CO2 that is transferred from the vapor phase into the aqueous phase is calculated based on the change in density of the CO2 vapor phase determined by Raman analysis. The results allow us to quantify the amount of CO2 in the vapor phase as a function of time, which then serves as a proxy for the amount of magnesite being formed and the rate of reaction.
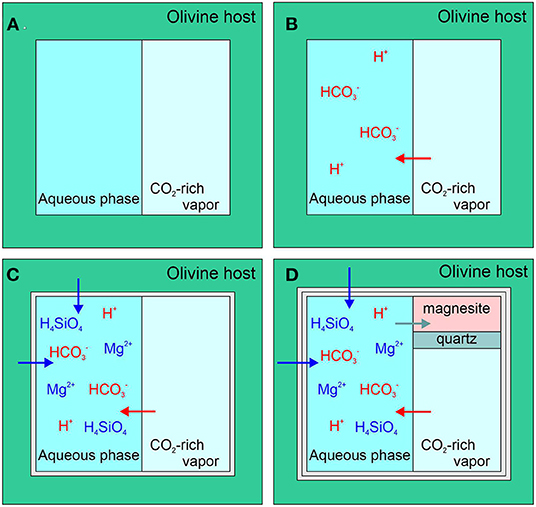
Figure 2. Conceptual model showing the sequential steps involved in the carbonation of olivine using synthetic fluid inclusions. (A) Initially the fluid inclusion contains an aqueous phase and a CO2-rich vapor phase; (B) Dissolution of CO2 into the aqueous phase occurs through the formation of various carbonated aqueous species; (C) The aqueous phase interacts with the olivine host, leading to dissolution of olivine from the inclusion walls, and; (D) Olivine dissolution leads to saturation and precipitation of magnesite and quartz (or amorphous silica), while at the same time transferring CO2 from the vapor phase into the solid (magnesite).
Samples and Methods
Preparation of Synthetic Fluid Inclusions
Synthetic fluid inclusions (SFI) were prepared following the procedure described in Sterner and Bodnar (1984) and Lamadrid et al. (2017b). Conditions during SFI synthesis are provided in Table 1. Thermally fractured inclusion free San Carlos olivine (Fo91) crystals were loaded into a platinum capsule along with oxalic acid dihydrate (C2H2O4 · 2H2O, ≥99% purity) and a salt solution similar to seawater (3.5 wt% NaCl-MgCl2 solution with NaCl:MgCl2 weight ratio of 9:1). The proportions of oxalic acid dihydrate and salt solution were determined to generate fluids with compositions of either ~10 or ~20 mol% CO2. Small amount of forsterite powder was also added to help the fractures heal faster during SFI synthesis. The capsules were sealed with an arc welder, placed into cold-seal pressure vessels, and held at 700°C and 2,000 bar for ≥31 days, during which time the fractures annealed and trapped the coexisting fluid phase in the form of fluid inclusions. The CO2 in the inclusions was generated from the decomposition of oxalic acid dihydrate through the reaction (Holloway et al., 1968):
At elevated temperature, H2 generated by this reaction diffuses out of the capsules relatively quickly (Mavrogenes and Bodnar, 1994), thus, H2 was not detected subsequently in the SFI with Raman spectroscopy. The PT conditions (700°C and 2,000 bar) during the synthesis of SFI were carefully selected, so that olivine and CO2 would not react with each other to form magnesite. The upper temperature limit of magnesite stability was estimated to be around 500°C at 2,000 bar and ~20 mol% CO2 fluid composition using PerpleX. Following SFI synthesis, the capsules were cooled to room temperature and each capsule was weighed to ensure that no leakage occurred during the SFI synthesis. The olivine crystals were then removed from the capsules, cut into approximately 1 mm thick chips, polished on both sides, and examined using a petrographic microscope. The SFI varied between 5 and 200 μm in maximum dimension, with most being ~10 μm. The olivine carbonation reaction was then followed in situ at elevated temperatures with Raman spectrometry.
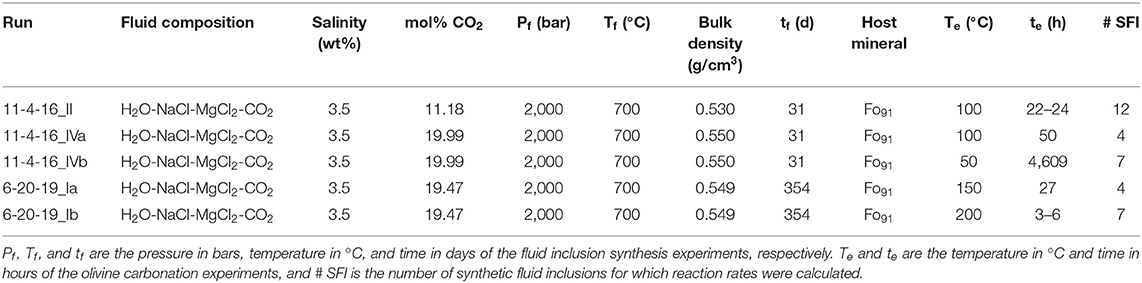
Table 1. Summary of conditions of formation of the synthetic fluid inclusions and olivine carbonation experiments.
Raman Spectroscopy
Raman analyses during the olivine carbonation experiments were conducted in the Vibrational Spectroscopy Laboratory in the Department of Geosciences at Virginia Tech. The characterization of reaction products by Raman mapping of unexposed fluid inclusions that had undergone various extents of reaction took place at the Faculty of Science Research and Industrial Relations Center, Eötvös University, Budapest (ELTE FS-RIRC). The detailed description of the two instruments, analytical parameters and procedures is presented in the Supplemental Methods.
The olivine carbonation reactions were observed in situ at temperatures ranging from 50 to 200°C by placing the samples into a heating stage (Linkam THMSG 600 or Chaixmeca stage) that was attached to a JY Horiba LabRam HR (800) confocal Raman spectrometer. The reaction between the olivine host mineral and the fluid inclusions was monitored by quantifying the change in CO2 density in the vapor bubble as a proxy for reaction progress. The amount of CO2 contained in the vapor bubble was obtained by measuring the splitting of the Fermi diad for CO2 and converting the Raman data into CO2 density (see details in section calculation of the amount of CO2 consumed in the reaction). The laser was focused in the CO2-rich bubble in the inclusion and Raman spectra were collected with single window collection mode between 1,000 and 1,489 cm−1. For carbonation experiments at ≥100°C, Raman spectra of CO2 were collected approximately every hour for each SFI. The reaction was slower at 50°C, therefore, the collection interval was gradually increased from once per day in the first week to once every 7–8 days.
The spectrometer position was calibrated with Ne lines bracketing the two bands of the CO2 Fermi diad by following the methodology described by Lin et al. (2007) and Lamadrid et al. (2017a).
The corrected (real) Fermi diad splitting (Δ) was calculated using the relationship (Lamadrid et al., 2017a):
where is the corrected (real) splitting of Fermi diad, and are the known (427.16 cm−1) and measured distances between the Ne lines, and is the measured distance between the CO2 Fermi diad peaks (ν− and ν+, cm−1). The uncertainty of peak position determination is 0.02 cm−1 (Lin et al., 2007; Lamadrid et al., 2017a) which translates to a density change of ~0.004 g/cm3.
Focused Ion Beam Scanning Electron Microscopy
Mineral phases produced during the carbonation reaction were characterized with a FEI QUANTA 3D Focused Ion Beam Scanning Electron Microscopy (FIB-SEM) at ELTE FS-RIRC. The fluid inclusion selected for FIB-SEM analysis based on the results of previous Raman mapping was ~15 × 3 μm and was located ~3 μm below the surface of the olivine crystal. The accelerating voltage and electron beam current were 10 kV and 4 nA. The step size for slicing with a focused gallium (Ga+) ion beam was 200 nm. Identification of the secondary mineral phases was based on their morphology in SE images and their brightness in BSE images. While accurate determination of the chemical composition of the step-daughter phases in the inclusion was not possible because of the small crystal sizes and the resulting mixed signals, element maps show clear differences in element concentrations between the phases.
Calculation of the Amount of CO2 Consumed in the Reaction
The total amount of CO2 in the SFI (nCO2, mol) at any given time was calculated as a sum of the moles of CO2 contained in the vapor bubble () and the moles of CO2 dissolved in the aqueous phase () at a given PTX:
The input data required to estimate the amount of CO2 in the fluid inclusion at any PTX condition include the measured Fermi-diad splitting, the volume of the inclusion and the volume fraction of the inclusion that is occupied by the CO2-rich bubble. The volume (and surface area) of the inclusions were calculated assuming a spherical shape with 10 μm diameter (V = 5.236 × 10⁻¹⁰ cm3 and A = 3.142 × 10⁻⁶ cm2) and the volume proportion of the bubble was assumed to be constant during the experiments. A more thorough discussion of the implications of these assumptions on the calculated reaction rates is provided in section discussion.
The amount of CO2 in the bubble was calculated assuming that the bubble contains only pure CO2 using the following relationship:
where ρCO2 is the density of CO2 in g/cm3, Vv is the volume of the bubble in cm3, and MCO2 is the molar weight of CO2 (44.01 g/mol).
Vv was calculated as the volume of the inclusion (cm3) multiplied by the volume fraction of the bubble in the inclusion. The initial volume fraction of the bubble in the SFI was calculated by mass and volume balance knowing the total (bulk) composition of the SFI based on the amounts of the starting materials loaded into the capsule and the bulk density of the fluid in the inclusions, which is equal to the density of the fluid at the temperature (T = 700°C) and pressure (P = 2,000 bar) of trapping (bulk density = 0.550 g/cm3 for inclusions containing ~20 mol% CO2, and 0.530 g/cm3 for inclusions containing ~11 mol% CO2) (Connolly and Bodnar, 1983; Bodnar et al., 1985).
The amount of dissolved H2O in the CO2-rich vapor at the experimental conditions has negligible effect on the density of CO2 (Bodnar et al., 2013), therefore the density determined from the measured Fermi diad splitting was assumed to represent the density of pure CO2. The relationship between CO2 density (pressure) and Fermi diad splitting depends on the temperature (Wang et al., 2019b; Sublett et al., 2020), and previous studies have shown that one should use a densimeter calibrated to the instrument being used for the analyses for best results (Lamadrid et al., 2017a). Therefore, to determine CO2 pressures in the inclusions we used data from Sublett et al. (2020) that were collected at elevated PT conditions (10–500 bar, 22–350°C) on the same Raman microprobe used in the present study. To improve the pressure estimate for our inclusions, we developed a relationship between pressure and Fermi diad splitting at each experimental temperature using the data of Sublett et al. (2020). The calculated CO2 pressure was assumed to be the total pressure in the fluid inclusion, ignoring the partial pressure of H2O, which is small compared to the partial pressure of CO2 at the experimental conditions. For internal consistency, CO2 density was calculated from the pressure with a modified version of the model presented by Steele-MacInnis (2018), which was also used to calculate properties for the aqueous phase described below.
The amount of CO2 in the aqueous phase is calculated as:
where mCO2 is the molality of CO2 (mol/kg H2O) in the aqueous phase, Vl is the volume of aqueous phase in the fluid inclusion in cm3, ρH2O is the density of the aqueous phase in g/cm3, and 0.001 is the conversion between kg and g. Vl was determined as the volume of the inclusion (cm3) multiplied by the volume fraction of the aqueous phase in the inclusion. The CO2 solubility and the density of the aqueous phase at the given pressure (determined from the Fermi diad), temperature and salinity are calculated by a modified version of the model presented by Steele-MacInnis (2018).
Calculation of Reaction Rates
Reaction rates were calculated using the Initial Rate Method (Rimstidt, 2014), whereby the rate of reaction is represented by the time derivative of the number of moles of CO2 consumed in the reaction according to:
where r is the reaction rate (mol/s), nCO2 is the moles of CO2 in the SFI calculated using equation (10), and t is time (s). The onset of the reaction was recognized at different times for different SFI (Figure 4), therefore, the initial rate method was applied starting from the time at which the reaction was first observed to be occurring during Raman analysis from the sufficiently large change in Fermi diad splitting (e.g., after 50 days in Figure 4B). With the initial rate method, a straight line was fit through the concentration vs. time data for each individual SFI and the slope of that function (rate) was extrapolated to time = 0. As such, some data points corresponding to the time when the reaction visibly slows down (i.e., decreases) following an initially faster reaction rate were excluded (e.g., data > ~90 days in Figure 4B).
Reaction rates obtained in this way were then normalized to the surface area of the inclusion to define the consumption of CO2 per unit surface area:
where J is the flux of CO2 consumption per unit surface area (mol/m2s) and A is the surface area in m2.
Results
The combination of SFIs as micro-reactors and non-destructive Raman spectroscopic analysis provides an opportunity to monitor the olivine-CO2 reaction visually on a micro-scale, while simultaneously collecting reaction rate data at elevated PT in situ and in real time from multiple SFI in a single olivine crystal. Figure 3 shows an example of the carbonation reaction occurring in a fluid inclusion at 100°C where the precipitation of magnesite is visually apparent after ~2.5 h from the start of the experiment. In the same sample, most of the fluid inclusions contained optically distinguishable magnesite crystals within 1–1.5 h after the start of the experiment. Synchronous collection of CO2 Raman data for the vapor phase shows a decrease in CO2 density as a result of the reaction between the CO2-bearing aqueous phase and olivine (Figure 4). At 100°C, magnesite formation begins within several hours, and most of the CO2 is consumed within 2 days in fluid inclusions in sample 11-4-16_IVa (containing ~20 mol% CO2 initially), and within 1 day for fluid inclusions in sample 11-4-16_II (containing ~11 mol% CO2 initially), as evidenced by the fact that the CO2 density becomes too low to detect the Fermi diad during Raman analysis. At 50°C, however, it took several days (>2 days), and in some cases a few weeks before magnesite nucleation and precipitation was observed (Figure 4B). In the experiments at 200°C, the CO2 density decreased below the Raman detection limit within 6 h.
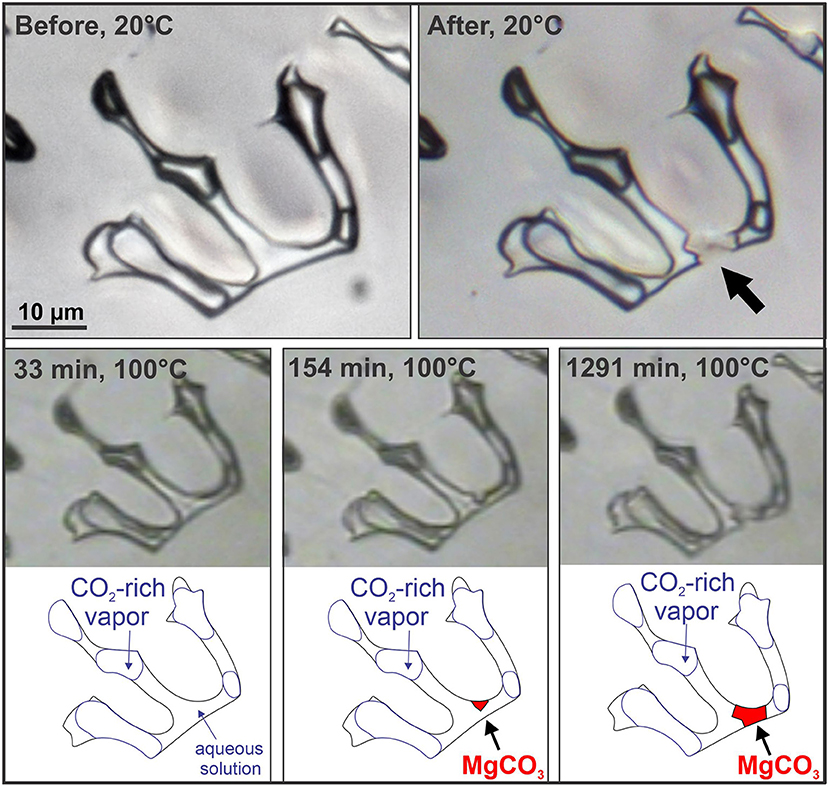
Figure 3. Photomicrographs of a large, irregularly-shaped fluid inclusion from sample 11-4-16_IV taken at various stages during the carbonation reaction. The photos taken at room temperature before and after the experiment show the precipitation of magnesite (arrow on the right). Photos taken during the experiment at 100°C and schematic drawings of the inclusion at each time step (33, 154, and 1,291 min) emphasize the progress of magnesite formation and growth.
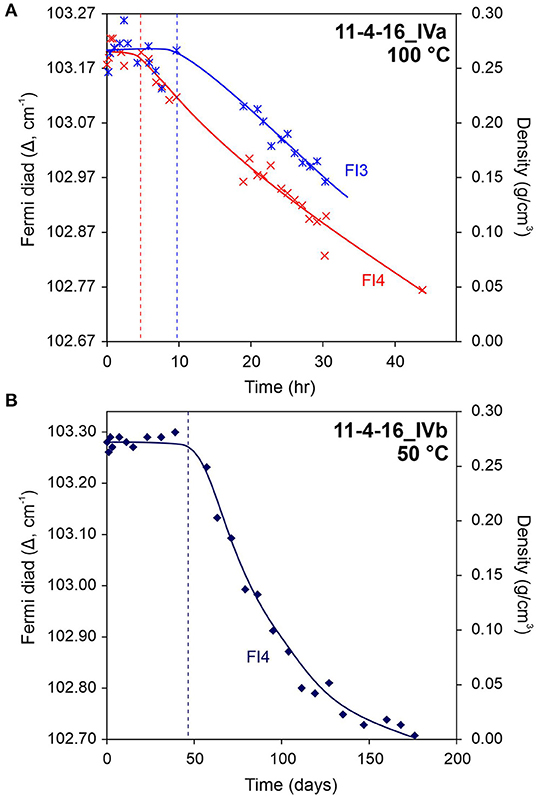
Figure 4. Variation in Fermi diad splitting and CO2 density during the reaction of olivine with CO2 at 100°C (A; sample 11-4-16_IVa) and 50°C (B; sample 11-4-16_IVb). All fluid inclusions initially contained ~20 mol% CO2. Dashed lines indicate the elapsed time from the beginning of the experiment at which the change in Fermi diad splitting (density) became large enough to detect and monitor by Raman to follow the reaction.
The calculated reaction rates are about 1.5 orders of magnitude slower at 50°C on average compared to results at 100°C (Table 2). While there were some differences in the initial pressure between sample 11-4-16_IVa (~134 bar) and 11-4-16_II (~97 bar) in the experiments at 100°C owing to the different bulk composition of these samples (20 mol% CO2 vs. 11 mol% CO2), no significant differences were observed in the reaction rates as a function of initial pressure. The initial pressure of ~134 bar corresponds to a CO2 density of 0.284 g/cm3 in the vapor bubble and CO2 solubility in the aqueous phase of 0.822 mol/kg H2O, and the initial pressure of ~97 bar corresponds to a CO2 density of 0.181 g/cm3 in the bubble and a CO2 solubility in the aqueous phase of 0.678 mol/kg H2O. The calculated reaction rates at 150°C and 200°C are about 2–2.5 log units faster than at 100°C. The standard deviation of the reaction rates varies between 0.09 and 0.37 log units (mol/m2s). This dispersion is most likely the result of the variation in the sizes and shapes (surface area) of the fluid inclusions being monitored (ranging from about 8–15 μm).
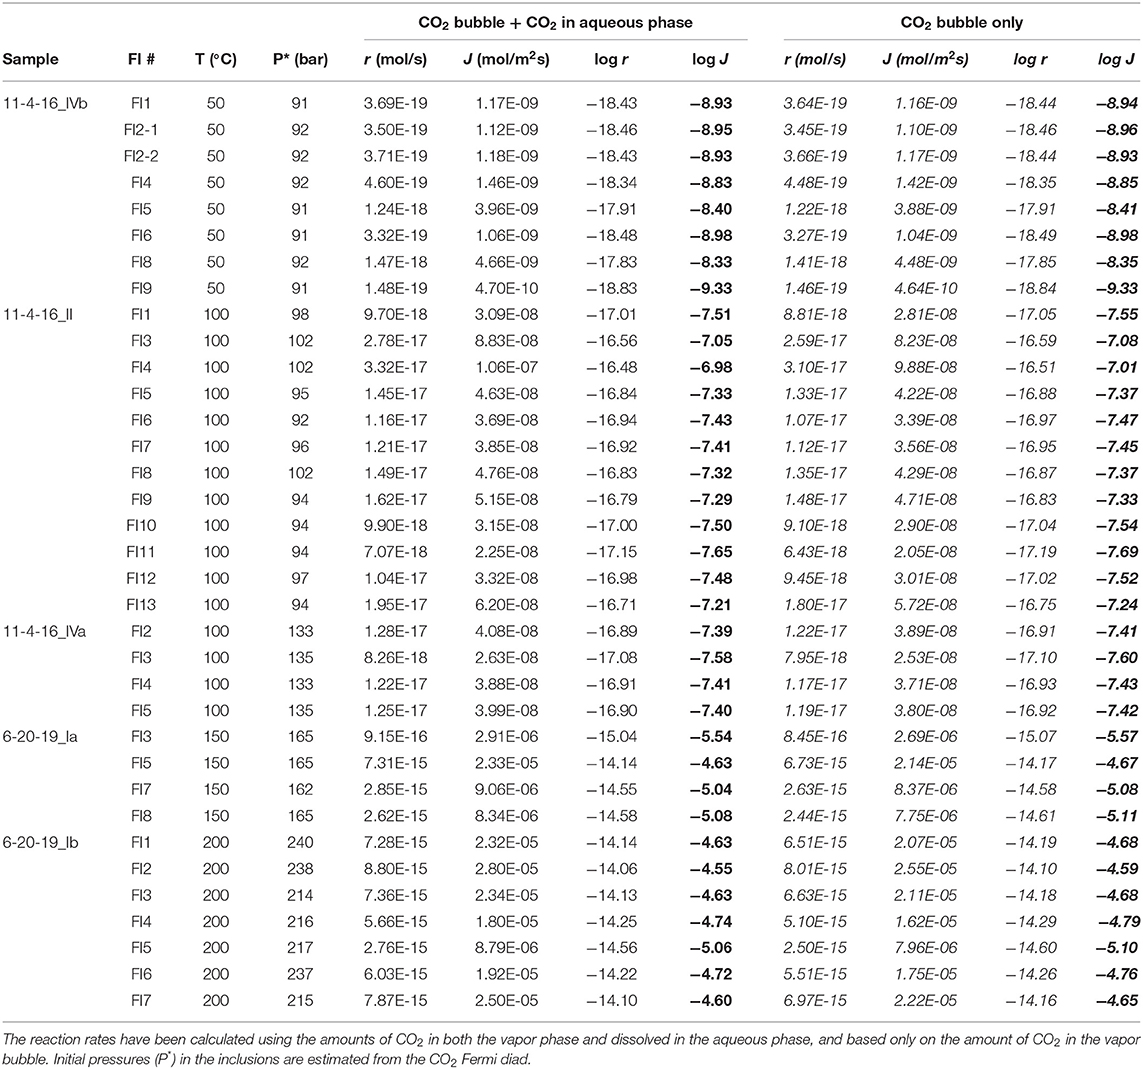
Table 2. Reaction rates (r, mol/s) and fluxes (J, mol/m2s) for each individual SFI.
The presence of magnesite as a reaction product in the fluid inclusions was confirmed during Raman mapping of a fluid inclusion after the reaction was complete (Figure 5) based on the presence of the main Raman peak of magnesite at 1,094 cm−1 (symmetric stretching of the CO bond), and minor peaks at 738 cm−1 (in-plane bending vibration) and 326 cm−1 (lattice vibration) (Rutt and Nicola, 1974; Gillet et al., 1993; Boulard et al., 2012; Frezzotti et al., 2012; Chukanov and Vigasina, 2020). An additional solid phase was detected along the wall of the fluid inclusion during Raman analysis, with Raman peaks at 606 and 883 cm−1. While this phase was not identifiable based on the Raman data alone, the combination of FIB-SEM element maps (Figure 6) with the Raman data indicate that the phase is a Si-rich layer with a maximum thickness of ~100 nm. This Si-rich layer does not coat the entire surface (walls) of the fluid inclusion, rather, it appears only locally on one side of the inclusion. Additionally, the SEM photomicrographs reveal spherical features with a uniform diameter of ~200 nm on the surface of the magnesite crystals. FIB-SEM element maps (Figure 6) also reveal that some Fe from the olivine is incorporated into the (ferroan) magnesite.
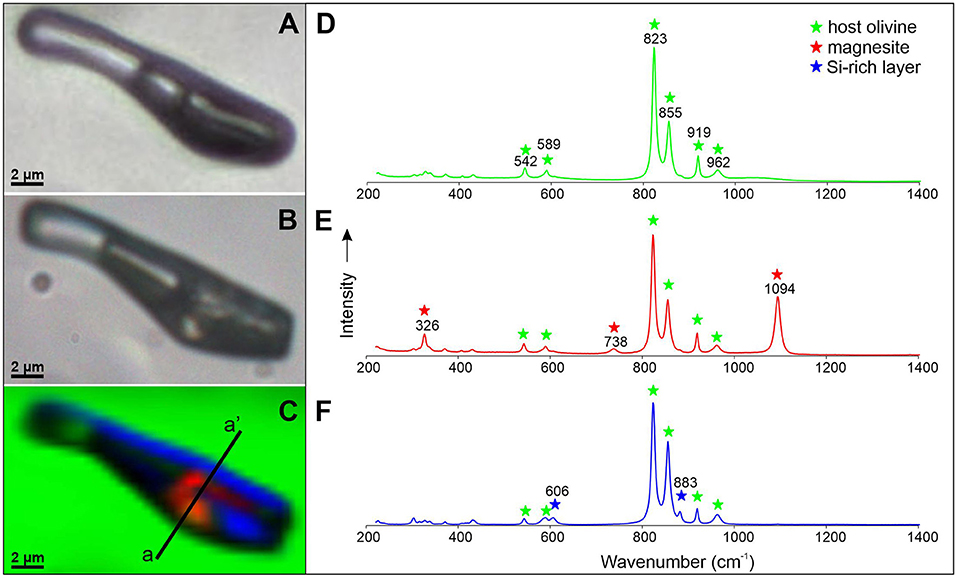
Figure 5. Photomicrographs of a fluid inclusion from sample 11-4-16_IVa taken before the reaction began (A) and after the carbonation reaction (B), and a Raman map of the reacted, unexposed fluid inclusion (C). Colors represent the different phases detected and correspond to the Raman spectra shown in (D) (host olivine, green), (E) (magnesite, red), and (F) (Si-rich layer, blue). The cross-section a-a' shown on (C) shows the location where the FIB-SEM analysis presented in Figure 6 was collected. No CO2 peaks were observed in the reacted fluid inclusion during Raman mapping, indicating that all (or most) of the initial CO2 was consumed during the carbonation reaction.
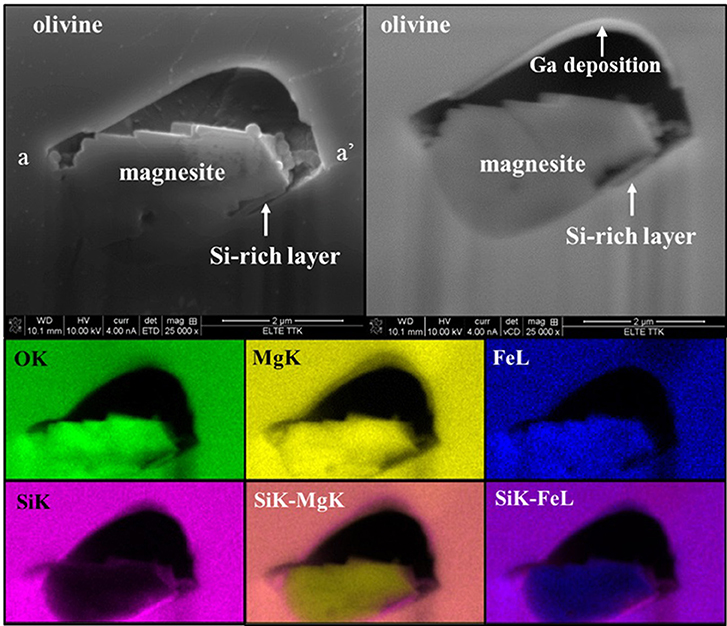
Figure 6. SE (top left) and BSE (top right) images and EDS X-rays element distribution maps for O, Si, Mg and Fe and Si-Mg and Si-Fe composite element distribution maps. The deposition of gallium from the focused gallium ion beam used to slice the fluid inclusion is shown on the BSE image. The images were taken along the a-a' cross section of the fluid inclusion shown on Figure 5. Element distributions support the identification of phases based on Raman analyses. A Si-rich layer of ~100 nm maximum thickness can be observed in the bottom right corner of the inclusion. The spherical objects on the surface of the magnesite crystals with a uniform diameter of ~200 nm are most likely amorphous silica spheres precipitated as a result of opening the fluid inclusion and evaporation of the aqueous phase containing some dissolved silica. Magnesite contains Fe.
Discussion
Reaction Products
The reaction products that precipitated in our experiments (i.e., ferroan magnesite and Si-rich layer on the inclusion wall) are in agreement with observations of previous studies. Additionally, the ~200 nm spherical features are interpreted to represent amorphous silica spheres that may have precipitated when the fluid inclusion was opened for analysis and the aqueous phase containing dissolved silica evaporated. The formation of a silica-rich layer on the surface of the olivine has been observed in other olivine carbonation experiments (Béarat et al., 2006; King et al., 2010; Daval et al., 2011; Saldi et al., 2013, 2015; Wang and Giammar, 2013; Johnson et al., 2014; Sissmann et al., 2014; Maher et al., 2016), and many of these studies discuss the rate limiting role of the Si-rich passivating layer in the carbonation of olivine as it may reduce the dissolution of olivine by limiting the contact between the aqueous solution and olivine. The nature of this Si-rich layer can be complex spatially and as a function of reaction time, and for more information the reader is referred to Miller et al. (2019b) who provide an in-depth discussion of Si-rich surface layers. The incorporation of Fe2+ into magnesite is also a commonly observed phenomenon (Jones et al., 2010; Saldi et al., 2013; Sissmann et al., 2014), which Saldi et al. (2013) finds to increase carbonation yields due to faster nucleation and growth of ferroan magnesite compared to pure MgCO3. Jones et al. (2010) found that the incorporation of Fe2+ into carbonates is more rapid than the oxidation of Fe2+ to Fe3+ that produces H2 and, as such, may inhibit H2 and CH4 production at conditions where carbonation and serpentinization of olivine compete with each other (200°C, 300 bar).
Reaction Rates
Calculation of Reaction Rates Using Only CO2 in the Vapor Phase
The amount of CO2 dissolved in the aqueous phase is about an order of magnitude less at the experimental conditions compared to the amount of CO2 stored in the CO2-rich bubble. Therefore, the calculated reaction rates do not differ significantly if only the change in the amount of CO2 in the bubble is used rather than using equation (10) (Table 2). As an example, consider a fluid inclusion at 100°C with a CO2 pressure of ~97 bar, which corresponds to a CO2 density of 0.181 g/cm3 in the bubble and a CO2 solubility of 0.678 mol/kg H2O in the aqueous phase. If the SFI volume = 1 cm3, and if the bubble occupies 0.5 volume fraction (50 vol%) of the SFI, the bubble contains 0.0021 moles of CO2 (= 0.181 g/cm3 × 0.5 cm3/44.01 g/mol) according to equation (11), and the amount of CO2 dissolved in the aqueous phase is 0.0003 moles (= 0.678 mol/kg H2O × 0.5 cm3 × 0.8985 g/cm3 × 0.001) according to equation (12). Because is small compared to , equation (10) can be re-written as:
Reaction rates (log J) calculated based only on the amount of CO2 in the bubble differ by only ~0.04 log units from rates calculated based on the amount of CO2 both in the bubble and dissolved in the aqueous phase. This variation is insignificant compared to variations in log J associated with variations in the sizes and shapes of fluid inclusions.
Effect of Fluid Inclusion Size and Shape on the Calculated Reaction Rates
The SFI size (8–15 μm) and shape (mostly ellipsoids, with some irregular semi-planar shapes) show some variation in the samples, but the most commonly analyzed SFI were ~10 μm in diameter and oblate to spherical in shape. To examine the effect of SFI size on calculated reaction rates, reaction rates (r, mol/s) and fluxes (J, mol/m2s) have been calculated assuming various SFI size and Fermi diad splitting data collected from FI1 in sample 11-4-16_II and from FI4 in sample 11-4-16_IVa (Table 3). The difference in calculated fluxes (log J) assuming a 5 μm diameter spherical SFI compared to an SFI with a diameter of 20 μm is ~0.6 log units in both examples (Table 3). Similarly, the difference between an SFI with a spherical shape and an SFI with the same total volume but a tabular shape with a thickness of 1 μm is ~0.5 log unit. The error introduced by assuming that all SFI studied are spherical and have a diameter of 10 μm is within the range of the dispersion observed in our data (±0.5 log J) for experiments conducted at 50°C. We conclude that variations in size and shape of the SFI studied are likely the biggest contributor to the dispersion in our data, however, similar uncertainties are commonly reported in other reaction rate studies (Rimstidt et al., 2012; Rimstidt, 2014), including reaction rate studies using fluid inclusions as microreactors (Lamadrid et al., 2017b, 2021).
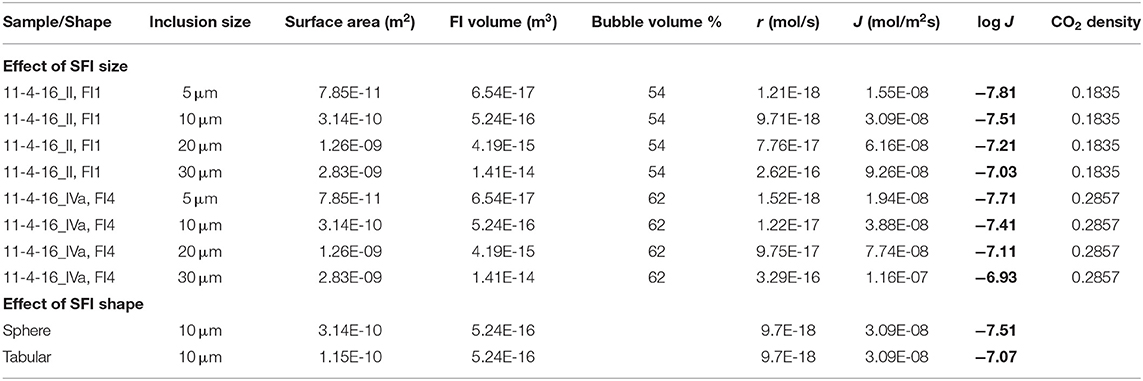
Table 3. The effect of inclusion size and shape on calculated reaction rates (r, mol/s) and fluxes (J, mol/m2s).
Volume Change of the CO2-Rich Vapor Bubble
As shown in equation (2), the net volume change of the solids associated with the carbonation of olivine is positive, i.e., the volume of magnesite + quartz (or amorphous silica) that forms is larger than the volume of olivine that dissolves. Thus, as the carbonation reaction proceeds in a fluid inclusion, representing a constant volume system, the volume of the CO2-rich bubble must decrease to accommodate the increasing volume of the solids. We note that change in the volume of the CO2-rich bubble was not resolvable optically in our samples. As the reaction proceeds, the density of the CO2 bubble changes for two reasons. First, the density changes because the volume available for the CO2 bubble is reduced as described above. Secondly, the density changes because some amount of CO2 is being removed from the bubble and incorporated into magnesite according to:
The relative rates at which the bubble volume and mass of CO2 in the bubble decrease as the reaction proceeds determines whether the density of the CO2 bubble increases or decreases as the reaction proceeds. Using PVTX data for the carbonation reaction, the change in CO2 density during carbonation of olivine has been calculated for two scenarios, one in which the volume of the CO2-rich bubble remains constant, and a second that considers changes in the volume of the bubble as the reaction proceeds (Figure 7). The model takes into account the volume change of the bubble according to equation (2), and has been calculated for different initial CO2 densities between 1.2 and 0.2 g/cm3, as well as three different initial volume fractions for the CO2-rich bubble (0.3, 0.5, 0.8). The results show that both the density of CO2 and the volume of the bubble decrease as the reaction proceeds (Figure 7). The density of the CO2-rich phase decreases more gradually for the scenario in which the bubble volume varies because a smaller volume is available to hold the same amount of CO2 as in the case of fixed bubble volume. The discrepancy between the two scenarios increases as the initial CO2 density increases (from 0.2 to 1.2 g/cm3). For initial densities applicable to our experiments (<0.3 g/cm3), the difference in calculated CO2 density for the two different scenarios is insignificant, thus justifying our use of a constant bubble volume in our model. As such, assuming a constant bubble volume does not significantly affect the calculated rates for our experiments (expected to be on the order of ~0.01 log J). The decrease in bubble volume for our experimental conditions is estimated to be 4 and 6 volume % for samples containing 11 mol% CO2 and 20 mol% CO2 initially, if all the CO2 is converted to magnesite (100% extent of reaction).
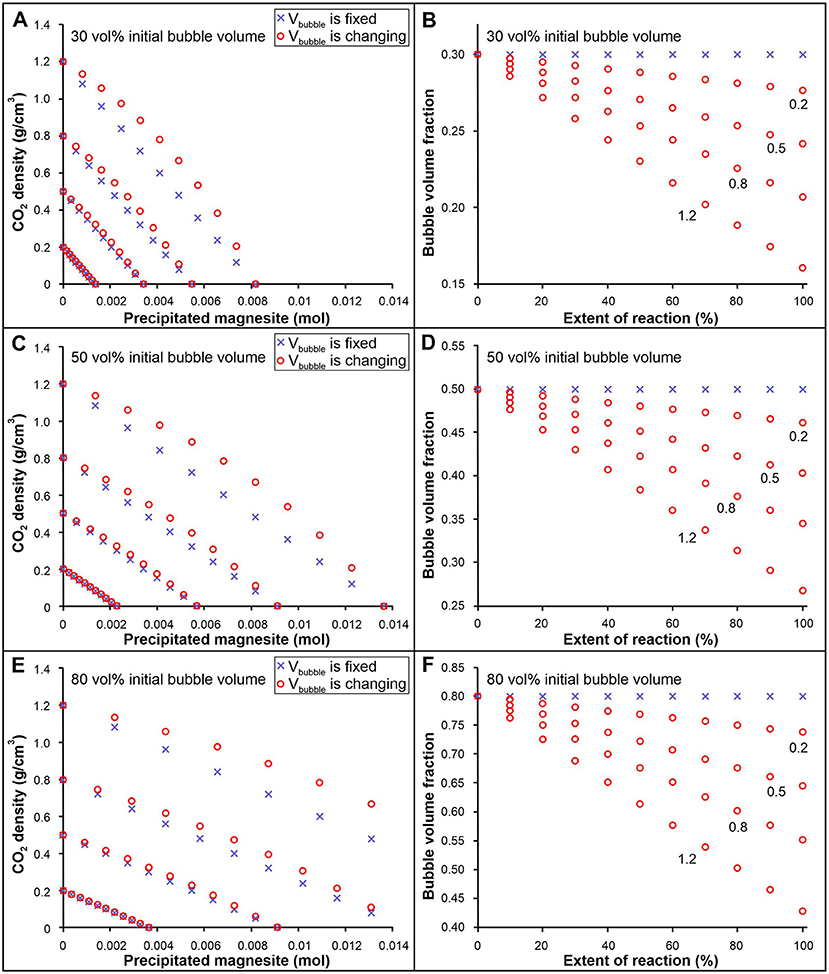
Figure 7. Calculated variation in CO2 density (A,C,E) and bubble volume (B,D,F) as the olivine carbonation reaction progresses assuming two scenarios: (1) the CO2-rich bubble volume remains constant (blue cross), and (2) the bubble volume changes as a result of the reaction according to equation (2) (red circle). The fluid inclusion is assumed to have a unit volume, and an initial volume fraction of the CO2-rich bubble of 0.3 (A,B), 0.5 (C,D), and 0.8 (E,F). The initial CO2 density ranges from 1.2 to 0.2 g/cm3. See text for more information.
Comparison of Calculated Reaction Rates With Data From the Literature
To compare reaction rates of olivine carbonation presented in this study with data in the literature, it was necessary to convert reaction rates into fluxes (J, mol/m2s). This was achieved by applying the Shrinking Particle Model (Rimstidt, 2014) to the literature data. The shrinking particle model assumes that the reacting particles are spherical in shape and calculates the dissolution rate constant k+ (mol/m2s) from the particle rate constant (kp) which is derived from a fit of the extent of reaction vs. time data according to:
where α is the conversion rate fraction (equal to the extent of reaction in % divided by 100), kp is the rate constant, and t is time (s). For studies in which the extent of reaction was reported or could be calculated for multiple time steps in a single experiment, kp was determined graphically as the slope of 1 − (1 − α)1/3 vs time. For studies that reported the extent of reaction at only one time step (usually at the end of the reaction), kp was determined from equation (18). The model assumes that J = k+ (mol/m2s) and calculates the flux as:
where k+ is the flux (mol/m2s), R0is the initial particle radius (m) and Vm is the molar volume of olivine (m3/mol). The initial particle size (R0) was obtained by calculating an effective diameter based on the reported grain size distribution:
where De is the effective diameter (m), Dmax and Dmin are the maximum and minimum grain size, respectively.
Data from the literature that were examined in this study are summarized in Figure 8 and Table 4. Comparison of reaction rates based on different experimental datasets is challenging because of the differences in experimental conditions, including temperature, pressure, olivine and fluid composition, grain size and specific surface area, water-rock ratio, etc. A compilation of 15 separate studies into an internally consistent kinetic framework can be found in Miller et al. (2019b), which contains most of the studies that we compared to our results. The ideal PT condition for olivine carbonation was found to be ~185°C and ~150 bar pCO2 (Gerdemann et al., 2007), and the rates decrease at higher temperatures, which is thought to be a result of competition between carbonation and serpentinization of olivine at temperatures >200°C (Dufaud et al., 2009; King et al., 2010). At a given temperature, the reaction rates increase with increasing salinity and alkalinity (O'Connor et al., 2002; Gadikota et al., 2014; Eikeland et al., 2015; Wang et al., 2019a). At the same time, it is important for the pH to be low enough to promote relatively fast dissolution of olivine, otherwise olivine dissolution could become the rate-limiting step as pH increases. Reaction rates calculated from our experiments using fluid inclusions as micro-reactors generally agree with reaction rates reported in the literature for olivine carbonation, and range between log J (mol/m2s) of approximately −8.4 at 50°C and −4.7 at 200°C. Some researchers report significantly lower reaction rates in the temperature range of 150–200°C, which are most likely the result of differences in fluid composition and/or pCO2 compared to our experiments. For example, at 150°C the flux (log J) that is calculated using data presented by Saldi et al. (2013) and Prikryl et al. (2018) varies between −6.7 and −8.2, while our experiments indicate an average flux of −5 log J. Saldi et al. (2013) used pure water in their experiments, which is known to result in slower reaction rates compared to reaction rates obtained using saline solutions (Gadikota et al., 2014). In the study of Prikryl et al. (2018), the partial pressure of CO2 is much lower (4.6 bar) than in our experiment at 150°C (initially ~165 bar). Similarly, in the study of Lafay et al. (2014) at 200°C CO2 partial pressure was low (~16 bar) and reaction rates were ~-7.3 log J, which is 2 log units lower than reaction rates calculated from our study for the same temperature with an initial CO2 pressure of ~220 bar. These differences in experimental PTX conditions might explain some of the discrepancies between our results and data in the literature. The reaction rates from our experiments using seawater-like solution at 150 and 200°C are comparable to reaction rates reported by Gadikota et al. (2014) at 185°C for aqueous solutions containing 0.64M NaHCO3 ± 1M NaCl, but are 1–1.5 log units faster than their rates determined in experiments using pure water or 0.5–1M NaCl solutions (Figure 8). At <150°C, our results agree relatively well with other experimental studies.

Figure 8. Comparison of calculated fluxes (log J, mol/m2s) obtained in this study with data from the literature. Symbols are color coded based on the chemical composition of the aqueous phase: blue, distilled water; red, NaHCO3 aqueous solution; green, NaCl + NaHCO3 aqueous solution; purple, NaCl aqueous solution; orange, our experiments with seawater-like composition; black/brown, other. The dotted line is provided to guide the eye but is not the result of kinetic modeling. Data plotted here are listed in Table 4.

Table 4. Summary of literature data presented on Figure 8.
The experimental results in this study suggest that olivine carbonation might be as effective and fast in the presence of seawater as in solutions made with high concentrations of NaHCO3 and NaCl, and accelerated compared to solutions with low salinity or solutions that contain only NaCl. Thus, CO2 injection into submarine environments might offer some advantages because carbonation reaction rates in the presence of seawater are likely to be accelerated compared to those associated with onshore basalts, where the pores are likely to be filled with low salinity meteoric water. Therefore, offshore sequestration of CO2 can extend already existing efforts on land for long-term climate solutions.
Conclusions
Synthetic fluid inclusions were used as micro-reactors to monitor in situ the reaction progress of olivine carbonation at elevated temperatures (50–200°C) and pressures (91–240 bar initial pressures) using non-destructive analytical techniques. At 50°C, magnesite nucleation and precipitation was not recognized until a few weeks to months after the experiment began, while in experiments ≥100°C magnesite formation was recognized in the inclusions within hours. The formation of ferroan magnesite and a non-continuous Si-rich layer on the inclusion wall was confirmed with Raman mapping and FIB-SEM. The amount of CO2 consumed in the reaction as a function of time was quantified using the Raman CO2 densimeter and mass-balance calculations. Reaction rates obtained using the initial rate method and our data generally agree with reaction rates available in the literature for olivine carbonation, and range between log J (mol/m2s) of approximately −8.4 at 50°C and −4.7 at 200°C. The reaction rate of olivine carbonation in the presence of seawater-like solution is fast enough to be suitable for converting CO2 into minerals for long-term CO2 storage in commercial CO2 injection projects into offshore olivine-rich mafic and ultramafic rocks and decrease CO2 emission to the atmosphere.
Data Availability Statement
The raw data supporting the conclusions of this article will be made available by the authors, without undue reservation.
Author Contributions
ES contributed to experimental design, data acquisition, analysis and interpretation, and wrote the first draft of the manuscript. HL, JR, and RB contributed to experimental design, furthermore, HL and JR helped with rate calculations. DS contributed to the calibration of Raman CO2 densimeter as a function of temperature and pressure and data acquisition. MS-M contributed with a model to calculate CO2 density, CO2 solubility, and density of the aqueous phase as a function of PTX. LA and CS helped with Raman mapping and FIB-SEM analysis. MC and ZZ contributed to data interpretation. All authors listed have made a substantial, direct and intellectual contribution to the work, and approved it for publication.
Funding
This material is based upon work supported by the National Science Foundation under Grant OCE-1459433 to RB. LA's and CS's work was granted by the ELTE Institutional Excellence Program (TKP2020-IKA-05) financed by the Hungarian Ministry of Human Capacities.
Conflict of Interest
The authors declare that the research was conducted in the absence of any commercial or financial relationships that could be construed as a potential conflict of interest.
Publisher's Note
All claims expressed in this article are solely those of the authors and do not necessarily represent those of their affiliated organizations, or those of the publisher, the editors and the reviewers. Any product that may be evaluated in this article, or claim that may be made by its manufacturer, is not guaranteed or endorsed by the publisher.
Acknowledgments
Special thanks go to Charles Farley, Lowell Moore, and Yury Klyukin for assistance with the Raman analyses and Ábel Szabó for assistance with FIB-SEM. ES acknowledges support from the Virginia Tech Geosciences Department and Virginia Tech Graduate School during this study.
Supplementary Material
The Supplementary Material for this article can be found online at: https://www.frontiersin.org/articles/10.3389/fclim.2021.722447/full#supplementary-material
References
Béarat, H., McKelvy, M. J., Chizmeshya, A. V., Gormley, D., Nunez, R., Carpenter, R., et al. (2006). Carbon sequestration via aqueous olivine mineral carbonation: role of passivating layer formation. Environ. Sci. Technol. 40, 4802–4808. doi: 10.1021/es0523340
Benson, S. M., and Cole, D. R. (2008). CO2 sequestration in deep sedimentary formations. Elements 4, 325–331. doi: 10.2113/gselements.4.5.325
Bodnar, R., Reynolds, T. J., and Kuehner, C. A. (1985). “Fluid inclusion systematics in epithermal systems,” in Reviews in Economic Geology 2, Geology and Geochemistry of Epithermal Systems, eds. B. R. Berger and P. M. Bethke (Littleton, CO: Society of Economic Geologists), 73–97.
Bodnar, R. J., Steele-MacInnis, M., Capobianco, R. M., Rimstidt, J. D., Dilmore, R., Goodman, A., et al. (2013). PVTX properties of H2O-CO2-“salt” at PTX conditions applicable to carbon sequestration in saline formations. Rev. Mineral. Geochem. 77, 123–152. doi: 10.2138/rmg.2013.77.4
Boulard, E., Guyot, F., and Fiquet, G. (2012). The influence on Fe content on Raman spectra and unit cell parameters of magnesite–siderite solid solutions. Phys. Chem. Miner. 39, 239–246. doi: 10.1007/s00269-011-0479-3
Chen, Z. Y., O'Connor, W. K., and Gerdemann, S. (2006). Chemistry of aqueous mineral carbonation for carbon sequestration and explanation of experimental results. Environ. Prog. 25, 161–166. doi: 10.1002/ep.10127
Chukanov, N. V., and Vigasina, M. F. (2020). Vibrational (Infrared and Raman) Spectra of Minerals and Related Compounds. Cham: Springer. doi: 10.1007/978-3-030-26803-9
Connolly, J. A. D., and Bodnar, R. J. (1983). A modified Redlich-Kwong equation of state for H2O-CO2 mixtures: application to fluid inclusion studies. EOS. 64:350.
Daval, D., Sissmann, O., Menguy, N., Saldi, G. D., Guyot, F., Martinez, I., et al. (2011). Influence of amorphous silica layer formation on the dissolution rate of olivine at 90°C and elevated pCO2. Chem. Geol. 284, 193–209. doi: 10.1016/j.chemgeo.2011.02.021
Dufaud, F., Martinez, I., and Shilobreeva, S. (2009). Experimental study of Mg-rich silicates carbonation at 400 and 500°C and 1 kbar. Chem. Geol. 265, 79–87. doi: 10.1016/j.chemgeo.2009.01.026
Eikeland, E., Blichfeld, A. B., Tyrsted, C., Jensen, A., and Iversen, B. B. (2015). Optimized carbonation of magnesium silicate mineral for CO2 storage. ACS Appl. Mater. Interfaces 7, 5258–5264. doi: 10.1021/am508432w
Frezzotti, M. L., Tecce, F., and Casagli, A. (2012). Raman spectroscopy for fluid inclusion analysis. J. Geochem. Explor. 112, 1–20. doi: 10.1016/j.gexplo.2011.09.009
Gadikota, G., Matter, J., Kelemen, P., and Park, A. (2014). Chemical and morphological changes during olivine carbonation for CO2 storage in the presence of NaCl and NaHCO3. Phys. Chem. Chem. Phys. 16, 4679–4693. doi: 10.1039/c3cp54903h
Garcia, B., Beaumont, V., Perfetti, E., Rouchon, V., Blanchet, D., Oger, P., et al. (2010). Experiments and geochemical modelling of CO2 sequestration by olivine: potential, quantification. Appl. Geochem. 25, 1383–1396. doi: 10.1016/j.apgeochem.2010.06.009
Gerdemann, S. J., O'Connor, W. K., Dahlin, D. C., Penner, L. R., and Rush, H. (2007). Ex situ aqueous mineral carbonation. Environ. Sci. Technol. 41, 2587–2593. doi: 10.1021/es0619253
Giammar, D. E., Bruant, R. G., and Peters, C. A. (2005). Forsterite dissolution and magnesite precipitation at conditions relevant for deep saline aquifer storage and sequestration of carbon dioxide. Chem. Geol. 217, 257–276. doi: 10.1016/j.chemgeo.2004.12.013
Gillet, P., Biellmann, C., Reynard, B., and McMillan, P. (1993). Raman spectroscopic studies of carbonates part I: high-pressure and high-temperature behaviour of calcite, magnesite, dolomite and aragonite. Phys. Chem. Miner. 20, 1–18. doi: 10.1007/BF00202245
Goldberg, D., and Slagle, A. L. (2009). A global assessment of deep-sea basalt sites for carbon sequestration. Energy Procedia 1, 3675–3682. doi: 10.1016/j.egypro.2009.02.165
Goldberg, D. S., Takahashi, T., and Slagle, A. L. (2008). Carbon dioxide sequestration in deep-sea basalt. Proc. Natl. Acad. Sci. U.S.A. 105, 9920–9925. doi: 10.1073/pnas.0804397105
Holloway, J. R., Burnham, C. W., and Millhollen, G. L. (1968). Generation of H2O-CO2 mixtures for use in hydrothermal experimentation. J. Geophys. Res. 73, 6598–6600. doi: 10.1029/JB073i020p06598
Johnson, N. C., Thomas, B., Maher, K., Rosenbauer, R. J., Bird, D., and Brown, G. E. (2014). Olivine dissolution and carbonation under conditions relevant for in situ carbon storage. Chem. Geol. 373, 93–105. doi: 10.1016/j.chemgeo.2014.02.026
Jones, L. C., Rosenbauer, R., Goldsmith, J. I., and Oze, C. (2010). Carbonate control of H2 and CH4 production in serpentinization systems at elevated P-Ts. Geophys. Res. Lett. 37:L14306. doi: 10.1029/2010GL043769
King, H. E., Plumper, O., and Putnis, A. (2010). Effect of secondary phase formation on the carbonation of olivine. Environ. Sci. Technol. 44, 6503–6509. doi: 10.1021/es9038193
Klein, F., and McCollom, T. M. (2013). From serpentinization to carbonation: new insights from a CO2 injection experiment. Earth Planet. Sci. Lett. 379, 137–145. doi: 10.1016/j.epsl.2013.08.017
Kwak, J. H., Hu, J. Z., Hoyt, D. W., Sears, J. A., Wang, C., Rosso, K. M., et al. (2010). Metal carbonation of forsterite in supercritical CO2 and H2O using solid state 29Si, 13C NMR spectroscopy. J. Phys. Chem. C 114, 4126–4134. doi: 10.1021/jp1001308
Kwak, J. H., Hu, J. Z., Turcu, R. V. F., Rosso, K. M., Ilton, E. S., Wang, C. M., et al. (2011). The role of H2O in the carbonation of forsterite in supercritical CO2. Int. J. Greenhouse Gas Control 5, 1081–1092. doi: 10.1016/j.ijggc.2011.05.013
Lafay, R., Montes-Hernandez, G., Janots, E., Chiriac, R., Findling, N., and Toche, F. (2014). Simultaneous precipitation of magnesite and lizardite from hydrothermal alteration of olivine under high-carbonate alkalinity. Chem. Geol. 368, 63–75. doi: 10.1016/j.chemgeo.2014.01.008
Lamadrid, H. M., Moore, L. R., Moncada, D., Rimstidt, J. D., Burruss, R. C., and Bodnar, R. J. (2017a). Reassessment of the Raman CO2 densimeter. Chem. Geol. 450, 210–222. doi: 10.1016/j.chemgeo.2016.12.034
Lamadrid, H. M., Rimstidt, J. D., Schwarzenbach, E. M., Klein, F., Ulrich, S., Dolocan, A., et al. (2017b). Effect of water activity on rates of serpentinization of olivine. Nat. Commun. 8:16107. doi: 10.1038/ncomms16107
Lamadrid, H. M., Zajacz, Z., Klein, F., and Bodnar, R. J. (2021). Synthetic fluid inclusions XXIII. Effect of temperature and fluid composition on rates of serpentinization of olivine. Geochim. Cosmochim. Acta 292, 285–308. doi: 10.1016/j.gca.2020.08.009
Lin, F., Bodnar, R. J., and Becker, S. P. (2007). Experimental determination of the Raman CH4 symmetric stretching (ν1) band position from 1–650 bar and 0.3–22°C: application to fluid inclusion studies. Geochim. Cosmochim. Acta 71, 3746–3756. doi: 10.1016/j.gca.2007.05.016
Maher, K., Johnson, N. C., Jackson, A., Lammers, L. N., Torchinsky, A. B., Weaver, K. L., et al. (2016). A spatially resolved surface kinetic model for forsterite dissolution. Geochim. Cosmochim. Acta 174, 313–334. doi: 10.1016/j.gca.2015.11.019
Marieni, C., Henstock, T. J., and Teagle, D. A. H. (2013). Geological storage of CO2 within the oceanic crust by gravitational trapping. Geophys. Res. Lett. 40, 6219–6224. doi: 10.1002/2013GL058220
Marieni, C., Matter, J. M., and Teagle, D. A. H. (2020). Experimental study on mafic rock dissolution rates within CO2-seawater-rock systems. Geochim. Cosmochim. Acta 272, 259–275. doi: 10.1016/j.gca.2020.01.004
Matter, J. M., Broecker, W. S., Stute, M., Gislason, S. R., Oelkers, E. H., and Stefánsson, A. (2009). Permanent carbon dioxide storage into basalt: the CarbFix pilot project, Iceland. Energy Procedia 1, 3641–3646. doi: 10.1016/j.egypro.2009.02.160
Matter, J. M., and Kelemen, P. B. (2009). Permanent storage of carbon dioxide in geological reservoirs by mineral carbonation. Nat. Geosci. 2, 837–841. doi: 10.1038/ngeo683
Matter, J. M., Stute, M., Snaebjornsdottir, S. O., Oelkers, E. H., Gislason, S. R., Aradottir, E. S., et al. (2016). Rapid carbon mineralization for permanent disposal of anthropogenic carbon dioxide emissions. Science 352, 1312–1314. doi: 10.1126/science.aad8132
Mavrogenes, J. A., and Bodnar, R. J. (1994). Hydrogen movement into and out of fluid inclusions in quartz – Experimental evidence and geologic implications. Geochim. Cosmochim. Acta 58, 141–148. doi: 10.1016/0016-7037(94)90452-9
McCollom, T. M., Klein, F., Robbins, M., Moskowitz, B., Berquó, T. S., Jöns, N., et al. (2016). Temperature trends for reaction rates, hydrogen generation, and partitioning of iron during experimental serpentinization of olivine. Geochim. Cosmochim. Acta 181, 175–200. doi: 10.1016/j.gca.2016.03.002
McGrail, B. P., Schaef, H. T., Ho, A. M., Chien, Y. J., Dooley, J. J., and Davidson, C. L. (2006). Potential for carbon dioxide sequestration in flood basalts. J. Geophys. Res. Solid Earth 111:B12201. doi: 10.1029/2005JB004169
McGrail, B. P., Schaef, H. T., Spane, F. A., Cliff, J. B., Qafoku, O., Horner, J. A., et al. (2017). Field validation of supercritical CO2 reactivity with basalts. Environ. Sci. Technol. Lett. 4, 6–10. doi: 10.1021/acs.estlett.6b00387
Miller, Q. R. S., Kaszuba, J. P., Schaef, H. T., Bowden, M. E., McGrail, B. P., and Rosso, K. M. (2019a). Anomalously low activation energy of nanoconfined MgCO3 precipitation. Chem. Commun. 55, 6835–6837. doi: 10.1039/C9CC01337G
Miller, Q. R. S., Schaef, H. T., Kaszuba, J. P., Gadikota, G., McGrail, B. P., and Rosso, K. M. (2019b). Quantitative review of olivine carbonation kinetics: reactivity trends, mechanistic insights, and research frontiers. Environ. Sci. Technol. Lett. 6, 431–442. doi: 10.1021/acs.estlett.9b00301
Miller, Q. R. S., Schaef, H. T., Kaszuba, J. P., Qiu, L., Bowden, M. E., and McGrail, B. P. (2018). Tunable manipulation of mineral carbonation kinetics in nanoscale water films via citrate additives. Environ. Sci. Technol. 52, 7138–7148. doi: 10.1021/acs.est.8b00438
O'Connor, W. K., Dahlin, D. C., Rush, G. E., Dahlin, C. L., and Collins, W. K. (2002). Carbon dioxide sequestration by direct mineral carbonation: process mineralogy of feed and products. Miner. Metallurgical Process. 19, 95–101. doi: 10.1007/BF03403262
O'Connor, W. K., Dahlin, D. C., Rush, G. E., Gerdemann, S. J., Penner, L. R., and Nilsen, D. N. (2005). Aqueous Mineral Carbonation, Final Report. National Energy Technology Laboratory.
Oelkers, E. H., Gislason, S. R., and Matter, J. (2008). Mineral carbonation of CO2. Elements 4, 333–337. doi: 10.2113/gselements.4.5.333
Pitzer, S. M. (1994). An equation of state for carbon dioxide valid from zero to extreme pressures. Contrib. Mineral. Petrol. 117, 362–374. doi: 10.1007/BF00307271
Prikryl, J., Stefánsson, A., and Pearce, C. R. (2018). Tracing olivine carbonation and serpentinization in CO2-rich fluids via magnesium exchange and isotopic fractionation. Geochim. Cosmochim. Acta 243, 133–148. doi: 10.1016/j.gca.2018.09.022
Rimstidt, J. D. (2014). Geochemical Rate Models: An Introduction to Geochemical Kinetics. Cambridge: Cambridge University Press.
Rimstidt, J. D., Brantley, S. L., and Olsen, A. A. (2012). Systematic review of forsterite dissolution rate data. Geochim. Cosmochim. Acta 99, 159–178. doi: 10.1016/j.gca.2012.09.019
Rutt, H., and Nicola, J. (1974). Raman spectra of carbonates of calcite structure. J. Phys. C 7:4522. doi: 10.1088/0022-3719/7/24/015
Saldi, G. D., Daval, D., Guo, H., Guyot, F., Bernard, S., Le Guillou, C., et al. (2015). Mineralogical evolution of Fe–Si-rich layers at the olivine-water interface during carbonation reactions. Am. Mineral. 100, 2655–2669. doi: 10.2138/am-2015-5340
Saldi, G. D., Daval, D., Morvan, G., and Knauss, K. G. (2013). The role of Fe and redox conditions in olivine carbonation rates: an experimental study of the rate limiting reactions at 90 and 150°C in open and closed systems. Geochim. Cosmochim. Acta 118, 157–183. doi: 10.1016/j.gca.2013.04.029
Sissmann, O., Brunet, F., Martinez, I., Guyot, F., Verlaguet, A., Pinquier, Y., et al. (2014). Enhanced olivine carbonation within a basalt as compared to single-phase experiments: reevaluating the potential of CO2 mineral sequestration. Environ. Sci. Technol. 48, 5512–5519. doi: 10.1021/es405508a
Snæbjörnsdóttir, S. Ó., and Gislason, S. R. (2016). CO2 storage potential of basaltic rocks offshore Iceland. Energy Procedia 86, 371–380. doi: 10.1016/j.egypro.2016.01.038
Steele-MacInnis, M. (2018). Fluid inclusions in the system H2O-NaCl-CO2: an algorithm to determine composition, density and isochore. Chem. Geol. 498, 31–44. doi: 10.1016/j.chemgeo.2018.08.022
Sterner, S. M., and Bodnar, R. J. (1984). Synthetic fluid inclusions in natural quartz I. Compositional types synthesized and applications to experimental geochemistry. Geochim. Cosmochim. Acta 48, 2659–2668. doi: 10.1016/0016-7037(84)90314-4
Sublett, D. M., Sendula, E., Lamadrid, H., Steele-MacInnis, M., Spiekermann, G., Burruss, R. C., et al. (2020). Shift in the Raman symmetric stretching band of N2, CO2, and CH4 as a function of temperature, pressure, and density. J. Raman Spectrosc. 51, 555–568. doi: 10.1002/jrs.5805
Turri, L., Muhr, H., Rijnsburger, K., Knops, P., and Lapicque, F. (2017). CO2 sequestration by high pressure reaction with olivine in a rocking batch autoclave. Chem. Eng. Sci. 171, 27–31. doi: 10.1016/j.ces.2017.05.009
Ueda, H., Sawaki, Y., and Maruyama, S. (2017). Reactions between olivine and CO2-rich seawater at 300°C: Implications for H2 generation and CO2 sequestration on the early Earth. Geosci. Front. 8, 387–396. doi: 10.1016/j.gsf.2016.10.002
Wang, F., Dreisinger, D., Jarvis, M., and Hitchins, T. (2019a). Kinetics and mechanism of mineral carbonation of olivine for CO2 sequestration. Miner. Eng. 131, 185–197. doi: 10.1016/j.mineng.2018.11.024
Wang, F., and Giammar, D. E. (2013). Forsterite dissolution in saline water at elevated temperature and high CO2 pressure. Environ. Sci. Technol. 47, 168–173. doi: 10.1021/es301231n
Wang, W., Caumon, M.-C., Tarantola, A., Pironon, J., Lu, W., and Huang, Y. (2019b). Raman spectroscopic densimeter for pure CO2 and CO2-H2O-NaCl fluid systems over a wide P-T range up to 360 °C and 50 MPa. Chem. Geol. 528:119281. doi: 10.1016/j.chemgeo.2019.119281
Keywords: CO2 sequestration, olivine carbonation, fluid inclusions, Raman spectroscopy, reaction rate
Citation: Sendula E, Lamadrid HM, Rimstidt JD, Steele-MacInnis M, Sublett DM Jr, Aradi LE, Szabó C, Caddick MJ, Zajacz Z and Bodnar RJ (2021) Synthetic Fluid Inclusions XXIV. In situ Monitoring of the Carbonation of Olivine Under Conditions Relevant to Carbon Capture and Storage Using Synthetic Fluid Inclusion Micro-Reactors: Determination of Reaction Rates. Front. Clim. 3:722447. doi: 10.3389/fclim.2021.722447
Received: 08 June 2021; Accepted: 28 September 2021;
Published: 25 October 2021.
Edited by:
Sarada Prasad Pradhan, Indian Institute of Technology Roorkee, IndiaReviewed by:
Debanjan Chandra, Indian Institute of Technology Bombay, IndiaDavide Ciceri, Private Practictioner, California, United States
Copyright © 2021 Sendula, Lamadrid, Rimstidt, Steele-MacInnis, Sublett, Aradi, Szabó, Caddick, Zajacz and Bodnar. This is an open-access article distributed under the terms of the Creative Commons Attribution License (CC BY). The use, distribution or reproduction in other forums is permitted, provided the original author(s) and the copyright owner(s) are credited and that the original publication in this journal is cited, in accordance with accepted academic practice. No use, distribution or reproduction is permitted which does not comply with these terms.
*Correspondence: Eszter Sendula, c2VzenRlcjFAdnQuZWR1
†Deceased