 Chris Funk
 Juliet Way-Henthorne
- Climate Hazards Center, Department of Geography, University of California, Santa Barbara, Santa Barbara, CA, United States
The overarching goal of this work is to develop and demonstrate methods that support effective agro-pastoral risk management in a changing climate. Disaster mitigation strategies, such as the Sendai Framework for Disaster Risk Reduction (SFDRR), emphasize the need to address underlying causes of disaster risk and to prevent the emergence of new risks. Such assessments can be difficult, because they require transforming changes in meteorological outcomes into sector-specific impact. While it is common to examine trends in seasonal precipitation and precipitation extremes, it is much less common to study how these trends interact with crop and pasture water needs. Here, we show that the Water Requirement (WR) component of the widely used Water Requirement Satisfaction Index (WRSI) can be used to enhance the interpretation of precipitation changes. The WR helps answer a key question: was the amount of rainfall received in a given season enough to satisfy a crop or pasture's water needs? Our first results section focuses on analyzing spatial patterns of climate change. We show how WR values can be used to translate east African rainfall declines into estimates of crop and rangeland water deficits. We also show that increases in WR, during recent droughts, has intensified aridity in arid regions. In addition, using the PWB, we also show that precipitation increases in humid areas of western east Africa have been producing increasingly frequent excessive rainfall seasons. The second portion of our paper focuses on assessing temporal outcomes for a fixed location (Kenya) to support drought-management scenario development. Kenyan rainfall is decreasing and population is increasing. How can we translate this data into actionable information? The United Nations and World Meteorological Organization advise nations to proactively plan for agro-hydrologic shocks by setting aside sufficient grain and financial resources to help buffer inevitable low-crop production years. We show how precipitation, WR, crop statistics, and population data can be used to help guide 1-in-10 and 1-in-25-year low crop yield scenarios, which could be used to guide Kenya's drought management planning and development. The first and second research components share a common objective: using the PWB to translate rainfall data into more actionable information that can inform disaster risk management and development planning.
Background and Rationale
In this study, we introduce a new Plant Water Balance (PWB) metric and demonstrate how it can be used to support trend analyses and risk management in east Africa (0–18°N, 20°E−51°E). Beginning in 2005 (Funk et al., 2005) and continuing to the present (Gebrechorkos et al., 2019), many studies have documented the decline in the eastern east Africa (east Africa east of 38°E and south of 8°N) boreal spring “Long” rains. This region experiences a bimodal seasonal cycle, with the boreal spring “Long” rainy season being longer and more copious than the boreal fall “Short” rainy season. More details on the crop phenology of the “Long” rains can be found in our accompanying paper, “An agro-pastoral phenological water balance framework” (Funk et al., 2021).
While it is generally accepted that this decline is associated with an intensification of the Indian Ocean branch of the Walker Circulation, as suggested in 2008 (Funk et al., 2008), the primary driver of that intensification is likely due to changes in the Pacific, and not Indian, Ocean (Williams and Funk, 2011; Lyon and DeWitt, 2012). These changes involve a combination of human-induced warming in the western Pacific and natural, La Niña-like, cool sea surface temperatures in the equatorial eastern Pacific (Hoell and Funk, 2013a,b; Liebmann et al., 2014). The relative contribution of natural variability to the observed declines in precipitation remains debated. Some studies have emphasized Pacific Decadal Variability (Lyon, 2014; Yang et al., 2014), while other papers have focused on anthropogenic warming in the western equatorial north-western Pacific (Funk et al., 2018, 2019b). Other studies, however, have focused on changes in the Indian Ocean. One study (Wainwright et al., 2019) suggested that the recent decline is strongly associated with a shorter rainy season, with warmer waters to the south of east Africa delaying the onset and decreasing surface pressures over Arabia, thus supporting an earlier cessation of the rainy season.
While decomposing the myriad potential drivers of the east African rainfall declines (Indian vs. Pacific, natural variability vs. climate change) is very difficult, it is not hard to identify the substantial increase in the frequency of poor eastern east African rains. Many of these dry seasons have been associated with strong Pacific sea surface temperature gradients, and the sea surface temperature gradients responsible for the decline, can be used as a basis for prediction (Funk et al., 2014; Shukla et al., 2014). At the same time, east Africa has also been impacted by extreme precipitation. According to the EM-Dat emergency database on natural and technological disasters (https://www.emdat.be/), since 2015, 119 flood events and extreme storms have impacted more than 11 million people. Climate science suggests a fairly straightforward explanation for at least some of these increases. As the atmosphere warms, saturation vapor pressures increase. A warmer atmosphere can hold more water vapor, which is expected to lead to more extreme precipitation events (Emori and Brown, 2005). While data limitations make assessments of extreme precipitation outcomes difficult in sub-Saharan Africa, recent assessments do suggest that in well-gauged areas, extreme events are becoming wetter, particularly in wet areas (Harrison et al., 2019).
To help contextualize the agricultural impacts associated with these extremes, it is useful to consider both crop water demand and crop water supply. In this study, we show how a new “Phenological Water Balance” (PWB) index can be used to (i) explore changes in both very dry and very wet growing seasons, and (ii) guide long-term risk management strategies by helping to identify plausible 1-in-10 and 1-in-25-year drought scenarios for Kenya. The focus of the first analysis section is spatial. Where are the hot spots of climate change? Where are crops and pastures experiencing more frequent water stress? Where is increased atmospheric water demand exacerbating the impact of rainfall deficits? In places where rainfall is increasing, where is it probably beneficial and where might it be harmful, in the sense that precipitation now often exceeds plant water requirements by a large amount? The focus of the second results section is temporal. For a given fixed region (Kenya), that has been experiencing rainfall declines, how bad might the next really low crop production year be? Answering such a question is central to the integrated drought management planning advocated by the World Meteorological Organization1 and the United Nations (UN). In their 2021 special report on drought,2 the UN Office of Disaster Risk Reduction discusses how the combination of climate change and population growth (Smirnov et al., 2016) is increasing drought exposure in many developing countries; understanding and managing these increasing drought risks will be central to meeting the objects enumerated in the Sendai Framework for Disaster Risk Reduction and 2030 Agenda for Sustainable Development. A key component of management involves quantifying drought impacts. This study uses precipitation, WR, population, and crop statistics to generate plausible near-term projections of low annual maize yields, maize production, and per capita maize production.
The PWB framework builds extensively on geospatial implementations of the “Water Requirement Satisfaction Index” (WRSI) (Verdin and Klaver, 2002; Senay and Verdin, 2003). In the results examined here, we use Start of Season (SOS) and Length of Growing Period (LGP) maps to define crop-growing seasons. Using these SOS dates and LGP, we can then calculate Growing Season Precipitation (GSP) and growing season Water Requirements (WR). The ratio of GSP and WR defines the PWB. In this paper, we explore how the PWB can be used to examine the following two questions:
1. Given the well-documented decline in the east African boreal spring rains, can the PWB framework be used to evaluate trends, thereby supporting monitoring at decadal time scales? Can we identify hot spots of elevated drought or flood risk?
2. Can the PWB framework be used with crop and population statistics to transform assumptions about precipitation into assumptions about national maize yields in Kenya, thereby supporting the development of plausible near-term low crop production scenarios? These scenarios can be used by Kenyan planning agencies to inform national-scale planning and preparedness for agricultural shocks, leading to improved drought management policies.
The trend analyses cover the entire east African Long rains growing area. We show that the WR framing adds substantial value beyond just analyzing changes in rainfall. A given decrease in rainfall may have very different impacts depending on local water requirements. Rainfall declines in areas where precipitation exceeds plant water requirements may have no negative effects. On the other hand, a relatively modest decrease in precipitation in a water-stressed region may dramatically increase the frequency of poor crop and pasture conditions. Precipitation increases in such areas might be very beneficial. But precipitation increases in areas where seasonal rainfall substantially exceeds WR values may actually be detrimental to crop outcomes.
The agricultural shocks analysis focuses on Kenya. The first and second research components share a common objective: using the PWB to translate rainfall data into more actionable information that can inform disaster risk management and development planning. The first research section focuses on spatial patterns. Where are we seeing changes in risk? The second research section focuses on temporal distributions for a given country. How can we translate long time-series of rainfall into actionable near-term crop production deficit scenarios?
It should be noted that while the results presented here are regional and seasonal, the general approach taken could be extended to multiple seasons, and on continental or global scales; scales at which running more complicated models would be difficult.
Data
Terminology
Before going into specifics about particular data sets, we present and discuss Figure 1, which schematically describes the PWB calculation. In this figure, we describe the typical seasonal progression of a rain-fed crop, such as maize, millet or sorghum. Farmers are well attuned to the typical seasonal progression of rains in their area, and these rains (shown with a solid blue curve) tend to begin with scattered showers, increase to a mid-season peak, and then taper off. In this paper, we break each growing season into “dekads.” Each month is divided into three dekads—two 10-day dekads followed by a third dekad that contains the remaining days in the month. In agricultural modeling, dekads are often used to represent time-varying environmental variables, such as precipitation or RefET. RefET will increase when radiation, surface wind, or local vapor pressure deficits increase. It is a measure of atmospheric water demand. Early research by the Food and Agriculture Organization (FAO), based on plot-level crop observations, related RefET to the seasonal progression of crop-specific Water Requirements (WR) (Doorenbos and Pruitt, 1977), and created the Water Requirement Satisfaction Index (WRSI) model (Frère and Popov, 1986) to estimate crop water deficits. This framework breaks the crop season into emergence, vegetative, grain-filling, and senescing stages. The SOS begins when enough precipitation has fallen to stimulate crop growth. In this study, the SOS commences when a location receives more than 25 mm of rain in a dekad and then 20 mm of precipitation in the following two dekads (AGRHYMET, 1996). The plant begins to grow, adding biomass and leaves. As the photosynthesis increases, WR increases as well, typically plateauing during the vegetative and grain-filling stages. Then, once grain filling is complete, plants senesce, photosynthesis, and water requirements drop rapidly. These WR changes are shown with a thick red line in Figure 1A.
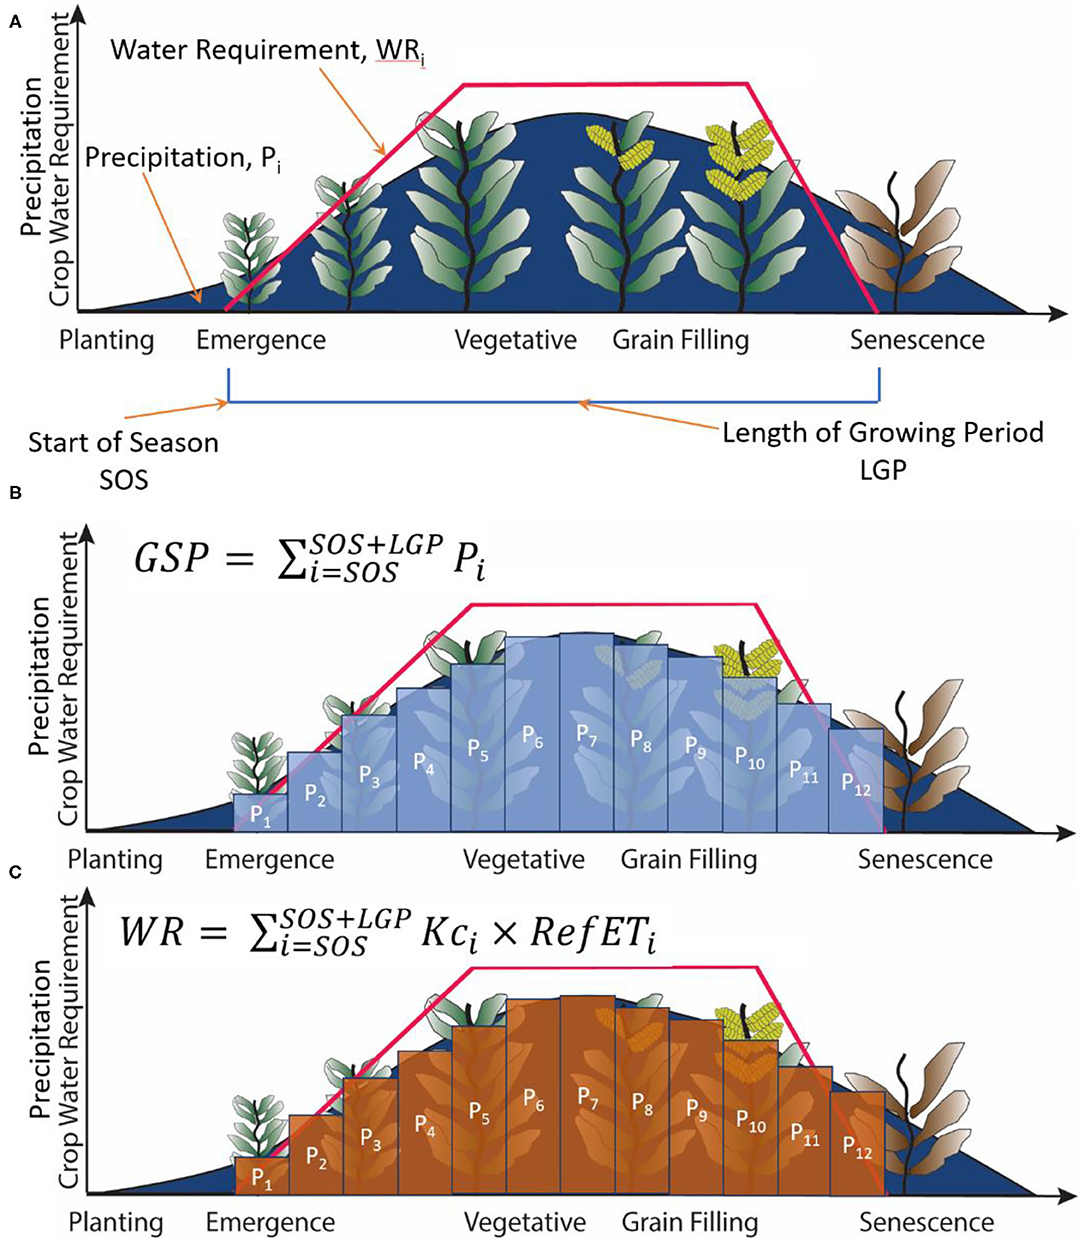
Figure 1. A schematic representations of the seasonal progressions of precipitation and plant Water Requirements, (B) The calculation of Growing Season Precipitation, and (C) The calculation of seasonal Water Requirement totals.
The PWB is based on the ratio of crop water supply and crop water demand, with supply and demand being based, respectively, on precipitation and RefET. To represent dekadal rainfall (Pi), this study uses 1981–2020 0.1° Climate Hazards InfraRed Precipitation with Stations3 (CHIRPS) rainfall data (Funk et al., 2015c). CHIRPS is a widely used gridded precipitation data set that was explicitly designed for drought monitoring in food-insecure countries in Africa. One key input is the Climate Hazards Center Precipitation Climatology4 (Funk et al., 2015b), which is constructed using moving window regressions, elevation, satellite observations and long-term in situ rain-gauge averages. At monthly and sub-monthly time scales, this climatology is combined with geostationary thermal infrared satellite observations and station data to produce gridded precipitation fields (Funk et al., 2015c). Several factors that make CHIRPS well suited to operational agro-meteorological drought monitoring are a long 40-year-plus period of record for historical context, low latency, low bias, and good performance in validation studies (Duan et al., 2016, 2019; Paredes Trejo et al., 2016; Agutu et al., 2017; Beck et al., 2017, 2019; Shrestha et al., 2017; Dinku et al., 2018; Gao et al., 2018; Retalis et al., 2018; Rivera et al., 2018; Harrison et al., 2019; Prakash, 2019; Gummadi et al., 2021). The CHIRPS product grows out of long-term efforts focused on representing orographic precipitation enhancements in data-sparse areas (Funk et al., 2003). In CHIRPS, these effects are represented by a high-resolution climatology and localized precipitation estimation parameters. This results in strong performance in east Africa's complex terrain (Dinku et al., 2018).
Dekadal RefET values (RefETi) are represented by 0.1° Penman-Monteith-based RefET (Hobbins et al., 2016). 5 The RefET is calculated using MERRA-2 reanalysis data. Radiation and near-surface wind speeds, temperatures, and humidity are used to calculate the amount of evapotranspiration that would be expected if an alfalfa-like well-watered “reference” crop was grown in each grid cell. In general, increases in radiation, increases in temperature, and decreases in humidity make the atmosphere more “thirsty,” increasing the associated crop water demand.
At each location, the start of the growing season (SOS) begins if a pixel receives more than 25 mm of rain, and is followed by two dekads that total more than 20 mm of rain combined (AGRHYMET, 1996). Time-varying crop-stage-dependent coefficients (Kc) are then used to modify RefET based on the phenological cycle of crop growth during a growing season (WRi = RefETi x Kc).
The length of the growing period (LGP) is typically determined by the specific genotype of the specific crop, but farmers typically use longer LGP (more slowly maturing) crops when they can, since longer seasons support more photosynthesis, more production of biomass, and higher yields. More details regarding the specifications of SOS, LGP, and crop types can be found in our accompanying paper in this Frontiers collection (Funk et al., 2021).
Methods
The core of the PWB is a comparison of the amount of water supply (precipitation) and plant water demand accumulated over the growing season, from the first dekad associated with SOS through to the end of season at a dekad corresponding to SOS+LGP. The dekadal totals of precipitation and WR are shown schematically in Figures 1B,C. Beginning with each location's SOS date, and assuming a fixed LGP value at each pixel, GSP values can be accumulated over each year's growing season's dekadal precipitation (Pi).
GSP represents the amount of rainfall, in mm, between the beginning and end of the growing season (Figure 1B). GSP can be compared with WR, which estimates the total amount of growing season moisture, in mm, required by crops or fields to maintain maximum “water satisfaction.” Each dekad's AET value is a function of that dekad's RefET and time-varying crop coefficients (Kc).
At the start of the season, at emergence, Kc values start low. They then increase during the vegetative and grain-filling stages. In cereal crops, Kc drops during senescence, while grassland Kc terms stay high throughout the short (7 dekad) growing season. The WR can be calculated from the beginning to the end of the growing season as follows (Figure 1C).
The GSP and WR terms can then be combined to yield the PWB.
The epsilon term (10 mm in this study) is added to both the numerator and denominator to increase numerical stability in arid regions. Our companion article compares PWB with WRSI and Kenya crop yield data, exploring the utility of PWB in routine agro-meteorological monitoring and forecast settings. Here, we focus on the use of PWB as a basis for trend analyses and risk assessment.
Examining the Utility of the PWB Framework as a Basis for Examining Trends in Agro-Pastoral Hazards?
Examining Changes in Mean Climate Conditions
Since the early 2000s, when the FEWS NET science team first identified the decline in the east African boreal rains (Funk et al., 2005), dozens of papers have studied the pattern, timing, and causes of these changes. While this is not the right venue for a review of that literature, we do wish to briefly show how the WR framework can provide a useful analytic foundation for exploring decadal variations in agro-pastoral hazard trends. Seasonal WR totals and PWB index values help to translate changes in precipitation into impacts on crop water availability.
There is almost universal agreement among experts that the eastern east Africa region has been substantially drier since about 1999. We contrast, therefore, changes between 1999 and 2020 and 1981–1998 (Figure 2). Figure 2A displays the well-documented declines in GSP. Central and coastal Kenya and eastern Ethiopia have seen substantial declines, which relate to 4 to 14% declines in WRSI (Figure 2B). Note that change shown here is in terms of the WRSI, which estimates the fraction (%) of the plant's water requirement that is satisfied. In some pastoral regions, recent rains have often failed to meet the criteria for season onset, and, therefore, we find large increases (i.e. delays) in the onset dates in these areas (Figure 2C). It is interesting to note that, in areas that rely on the boreal spring rains, we find little change in RefET (Figure 2D). While some increases are found in Sudan and South Sudan, that region tends to be associated with a boreal summer rainfall maxima. This is an important result. Warming temperatures do not appear to be associated with increasing WR trends, at least as represented via the Penman-Monteith calculation used in the Hobbins RefET data set. But we will return to this point momentarily, in the context of dry seasons, and reach a more nuanced, and more concerning, conclusion.
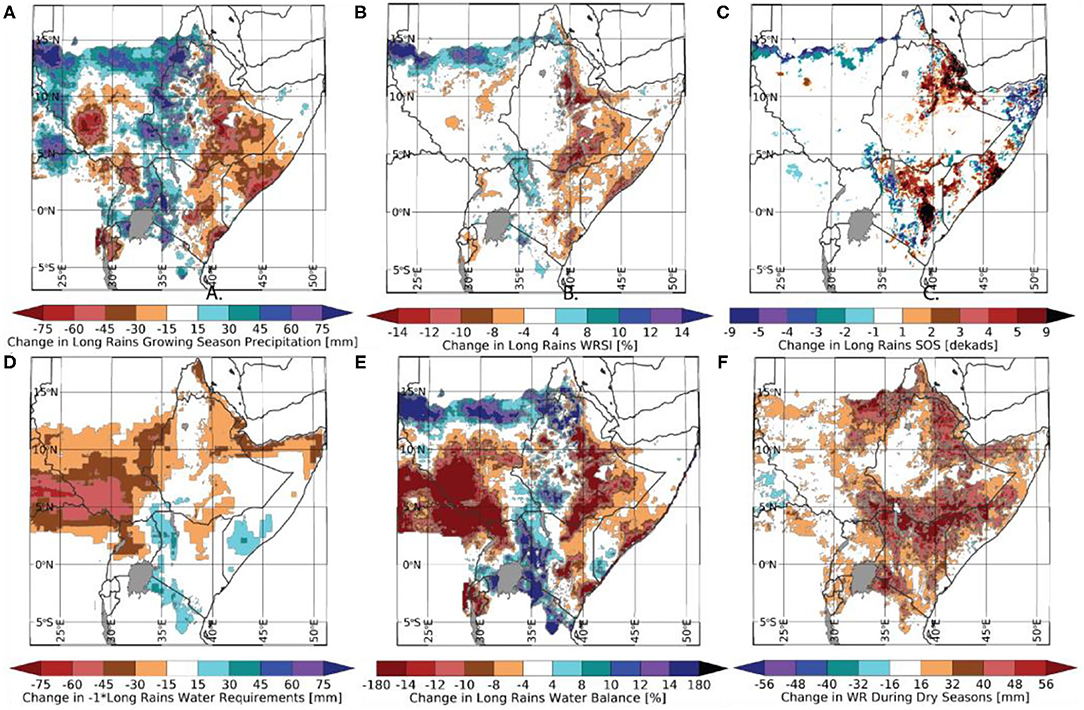
Figure 2. Changes in 1999–2020 vs. 1981–1998 agro-climatic indicators. (A) Change in growing season precipitation. (B) Change in WRSI. Note that ‘change in %’ in this instance refers to changes in the fraction of the plant's water requirement satisfaction. (C) Change in Start of Season (SOS). (D) Change in growing season WR. Note that these WR changes have been inverted (multiplied by −1), to express the desiccating impacts of increasing WR. (E) Change in growing season PWB. (F) Change in 1999–2020 vs. 1981–1998 WR when SPI values are <-0.7.
Figure 2E shows changes in PWB. While these maps closely follow the changes in precipitation, it is interesting to contrast these with the WRSI changes (panel 2B), which miss the substantial increases in western Kenya PWB values. Finally, PWB changes in terms of standardized anomalies (not shown) indicate that these declines are sufficient in magnitude to tilt the odds toward substantially more frequent droughts in central-eastern Kenya, southern Somalia, and eastern Ethiopia.
These results help demonstrate the value of WR framing. What we see is a tendency for TGP to increase in places where it is not generally needed (i.e., in wet areas) and decrease in arid regions where precipitation is desperately needed. One recent global Standardized Precipitation Evapotranspiration Index (SPEI) analysis (Funk et al., 2019a) found a robust global tendency toward higher RefET in arid regions, when SPI values were lower than −0.7. We find a similar result here. Figure 2F shows the difference between dry season (SPI < −0.7) WR averages over the 1999–2020 and 1981–1998 time periods. The +30 to +70 mm WR increases suggest that WR values, during meteorological droughts, are increasing. The spatial pattern of these increases, unfortunately, tends to align with some of the most food-insecure areas of eastern east Africa.
Examining Changes in Extreme Growing Season Precipitation
One interesting application of the PWB metric, not available with the WRSI, is to examine changes in the frequency of very wet seasons; seasons for which precipitation far exceeds WR. To demonstrate this, Figure 3A shows the change in frequency of the number of seasons for which GSP was more than twice the seasonal WR values. These results could suggest that the increases in PWB (Figure 2E), in areas that are already very wet (Figure 3B), might actually be detrimental. An example of this can be seen in the areas around Lake Victoria and across southwestern Ethiopia. In non-water-limited regions, increased cloudiness can reduce insolation and photosynthesis, while water logging, extreme precipitation, and flooding can have detrimental effects. In 2020, sites reporting flood impacts listed numerous crises in these regions.6 While more detailed analyses can be carried out using hydrologic simulations from systems like the FLDAS (McNally et al., 2017), the PWB and PWB forecasts seem like a useful tool for interpreting hydrological extremes from a crop-water perspective. Simply put, above-normal rains are more likely to be detrimental when they occur in regions that have climatologically high PWB values. A map of the recent mean PWB values (Figure 3B) reveals quite stunning gradients. In Kenya, for example, mean PWB values exceed 200% near the shores of Lake Victoria, then drop to near 100% over the span of about 100 kilometers. The same steep gradients hold for the western highlands of Ethiopia. When rainfall increases in places that are very wet, that will increase the frequency of exceptionally wet growing seasons. Hence, increase precipitation could be associated with increased agricultural disruption.
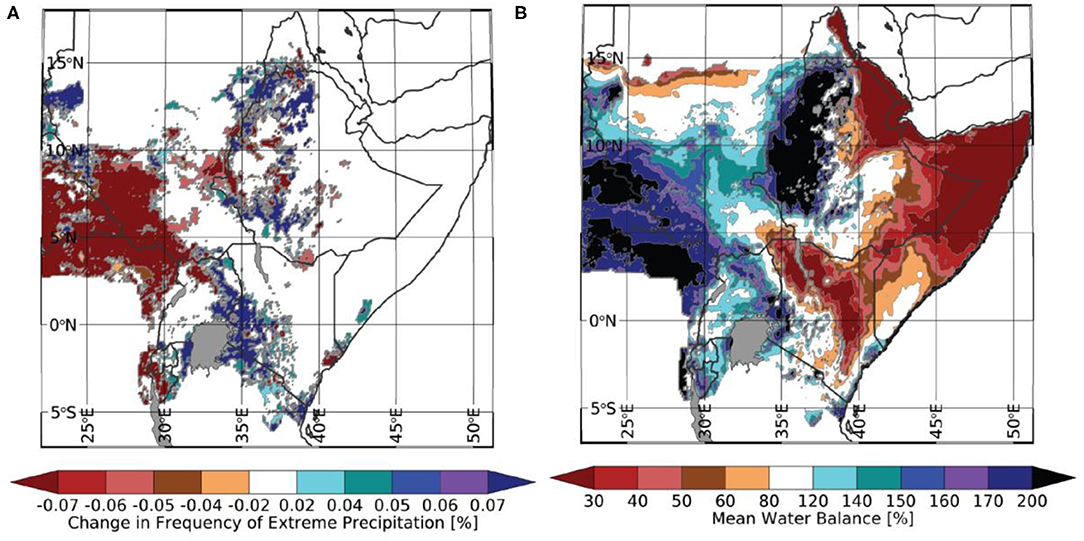
Figure 3. (A) Change in the frequency of extreme PWB values (PWB > 200%). (B) Mean 1999–2020 east African boreal spring season PWB values.
While extreme precipitation and floods can happen anywhere, it is often very difficult to distinguish beneficial vs. hazardous above-normal rainfall amounts in arid regions. A reference to drought monitoring can help make this case. An experienced agricultural drought analyst will pay special attention to rainfall deficits in more marginal crop-growing regions. A 75 mm rainfall deficit (Figure 2A) will be much more impactful in regions with mean PWB values of <100 (Figure 3A). Conversely, exceptionally heavy rains are much less likely to be beneficial when they occur in a region in which precipitation almost always exceeds WR by a wide margin. Such considerations might be used to identify more probable risk areas in forecasts and observations.
Examining Long Time-Series of PWB Estimates
While the PWB and WRSI changes are quite similar, the simplicity of the PWB framework makes it easy to link with longer precipitation records, such as the Centennial Trends archive (Funk et al., 2015a), which are almost exclusively monthly. There are very few long-period-of-record sub-monthly rainfall archives in Africa. The Centennial Trends and CHIRPS data sets are built using the same high-resolution climatology and the same stations, and hence, tend to be quite similar on regional/seasonal time-scales. We can use the Centennial Trends data set to place recent PWB variations in a deeper historic context. We do so for two regions: Kenya's main crop growing regions7 and “eastern east Africa,” which is defined as Ethiopia, Kenya, and Somalia east and south of 38°E, 8°N. Strong linear relationships exist between regional March-April-May Centennial Trends and CHIRPS GSP, and CHIRPS GSP and WR. Hence, Centennial Trends PWB estimates that correlate well with the CHIRPS/Hobbins RefET values during their period of overlap can be constructed (RKenya =0.9, REEA =0.89). This allows us to plausibly extend the PWB back to the early 1900s (Figure 4). As discussed in our Centennial Trends paper, Kenya actually has quite a few stations during this time period. The eastern east Africa region has lower station densities, especially prior to the 1920s.
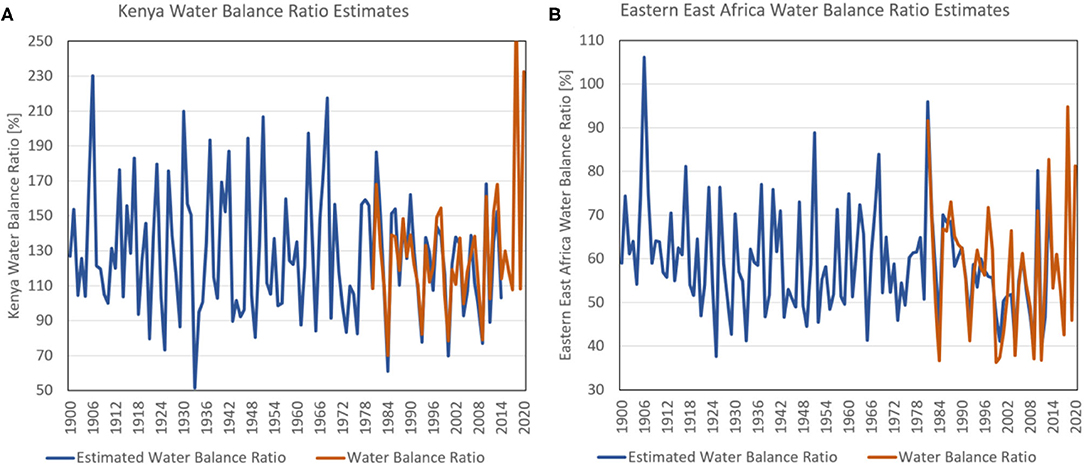
Figure 4. Long time-series of (A) Kenyan and (B) Eastern east Africa PWB time-series.
For Kenya (Figure 4A), we see juxtaposed both a tendency toward drier conditions and two exceptionally wet seasons (2018 and 2020). A deeper historical record reinforces how extremely wet 2018 and 2020 actually were. This deeper record, however, also suggests that recent (post-2009) droughts, like 2011, 2017, and 2019, really were not too severe, given the historical archive. These dry seasons had PWB values of around 110 percent. The historical archive has many examples of more severe droughts with PWB values on the order of 90 percent.
For eastern east Africa (Figure 4B), we find a much higher level of aridity, with a 1920-to-1989 Centennial Trends PWB mean of 59, which decreased to 52 over the 1999–2014 period—a 15% decrease. Between 1999 and 2020, 8 years were exceptionally dry (PWB < 46). The depth of drought during these dry seasons has also intensified as WR values increase (Figure 2F), resulting in frequent shocks that can erode resilience and increase vulnerability. These dry seasons can be contrasted with four very wet seasons (2010, 2013, 2018, 2020), with PWB values twice as large as dry seasons, i.e., 80 as opposed to 40. The skewed distribution of rain in this region, combined with the covariance of RefET and precipitation, sets the stage for volatile sequences of droughts and pluvials. As with Kenya, we note that the most recent dry seasons (2017, 2019) have not been as intense as prior severe droughts such as 1999, 2000, 2009, and 2011, which were associated with moderate-to-strong La Niña conditions. Disaster mitigation strategies, such as the Sendai Framework for Disaster Risk Reduction (SFDRR), emphasize the need to address underlying causes of disaster risk. Long time-series of historical PWB values (Figure 4) help inform drought management plans by helping us anticipate the magnitude of a “typical” drought sequence. What Figure 4 tells us is that a) there have been many recent droughts—three out of the last five seasons (2017, 2019, and 20218)— but the actual magnitude of those droughts has been moderate in comparison to the longer-term record. DRR practices use past extremes as inputs into future disaster management plans. Hence, we should prepare for substantially more severe future droughts akin to 1999, 2000, 2009, and 2011.
Examining the Utility of the PWB Framework as a Basis for Assessing 1-in-10 and 1-in-25-Year Crop Production Drought Risks
We next turn to the topic of disaster risk management, combining our PWB and Centennial Trends analyses with population and agricultural statistics to construct plausible near-term, low-yield scenarios. The intent is to demonstrate how the PWB can be used to inform national drought risk management planning, such as that advocated by the Sendai Framework for Disaster Risk Reduction and the United Nations Office for Disaster Risk Reduction.9 The first priority of the Sendai Framework focuses on understanding risk. Agro-pastoral hydro-climatic risks arise through the interaction of exposure, vulnerability, and weather-related shocks. Here, we develop plausible 1-in-10 and 1-in-25-year Kenyan yield reduction scenarios. There are numerous actions that countries can take to prepare for agricultural shocks: store grain to offset crop production deficits, establish cash reserves that can be used to help smooth out grain price shocks, and fund social safety net programs that can help poor households cope with reductions in food availability and access. But investments in these risk reduction activities diverts funds from other potentially important sectors: health, education, transportation, etc. It is important, therefore, to provide quantitative assessment of drought risk. The 1-in-10 and 1-in-25-year Kenyan yield reduction scenarios explored here provide plausible scenarios that can be used to develop risk management planning.
As context, it is important to recognize that despite rapidly growing economies, countries like Kenya and Ethiopia still face serious levels of acute food insecurity. A growing wage gap may be one factor that helps drive such insecurity. While the annual per capita inflation-adjusted incomes of the poorest 20% of Ethiopians and Kenyans climbed dramatically between 1993 and 2019 (Figure 5A), the gap between these incomes and the national average income climbed even more rapidly (Figure 5B), such that the ratio between poor and middle incomes essentially tripled between 1993 and 2018. Poor households have to compete with the rest of society for access to goods and services. And countries like Kenya continue to see high food-price volatility. Figure 5C shows wholesale maize prices in Kenya. In 2008/09, 2011, and 2017, the region experienced sequential October-November-December and March-April-May droughts (Funk et al., 2018), and large spikes in maize prices.
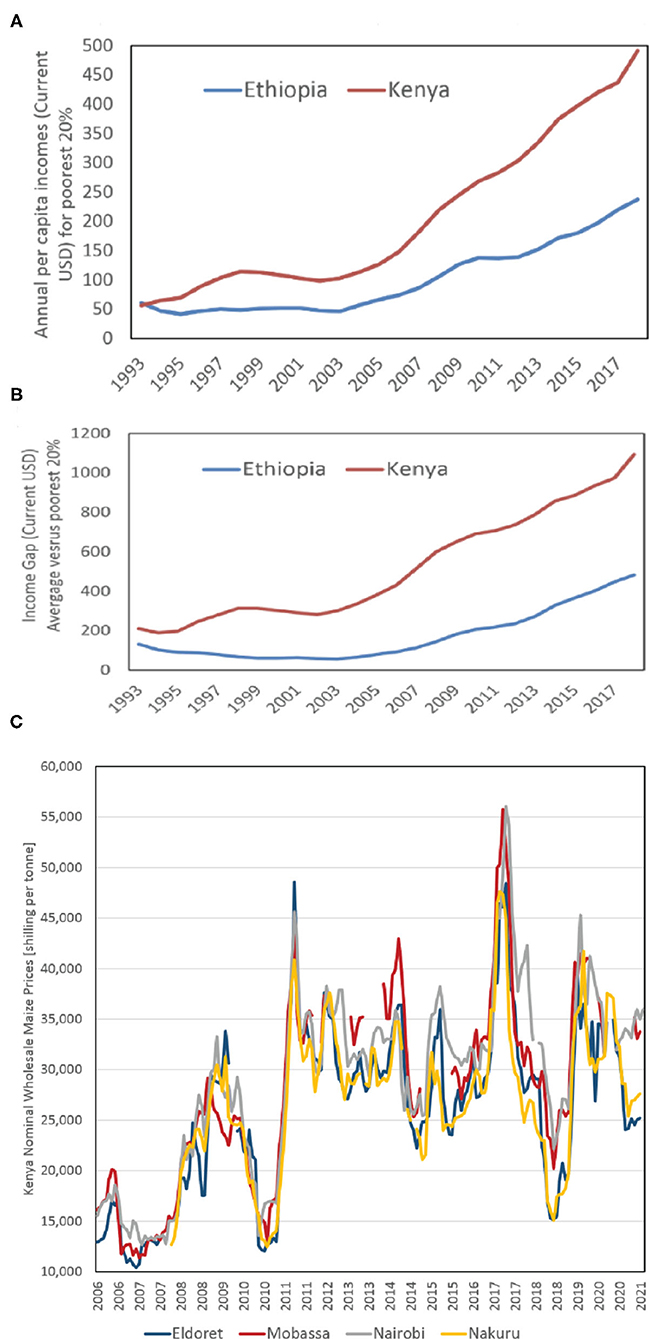
Figure 5. (A) World Bank estimates of per capita income for the poorest 20% of Ethiopians and Kenyans. (B) The gap between the per capita incomes of average and poor Ethiopians and Kenyans. (C) Monthly nominal wholesale maize prices in Kenya. Price data obtained from the FAO price monitoring tool.
One concerning result discussed above is the fact that the 2011 and 2017 Kenyan drought events were not actually all that extreme, based on the historical record (Figure 4A). Nevertheless, maize prices skyrocketed (Figure 5C). While a huge variety of factors influence prices, some insights can be gained from evaluating per capita maize cereal production. This metric can be composed into a yield term and per capita harvested area term (Funk and Brown, 2009). For many countries, this decomposition tends to highlight opposing tendencies, with yields increasing and per capita harvested areas declining. For Kenya, however, maize yield statistics suggest stagnation around a fairly low baseline of about 1.7 tons per hectare (ha) (Figure 6A). Kenya has primarily relied on increases in cultivated area to increase production, with the area harvest increasing by about 70% since the early 1980s (Figure 6B). Since 2009, however, the rate of this increase appears to have slowed.
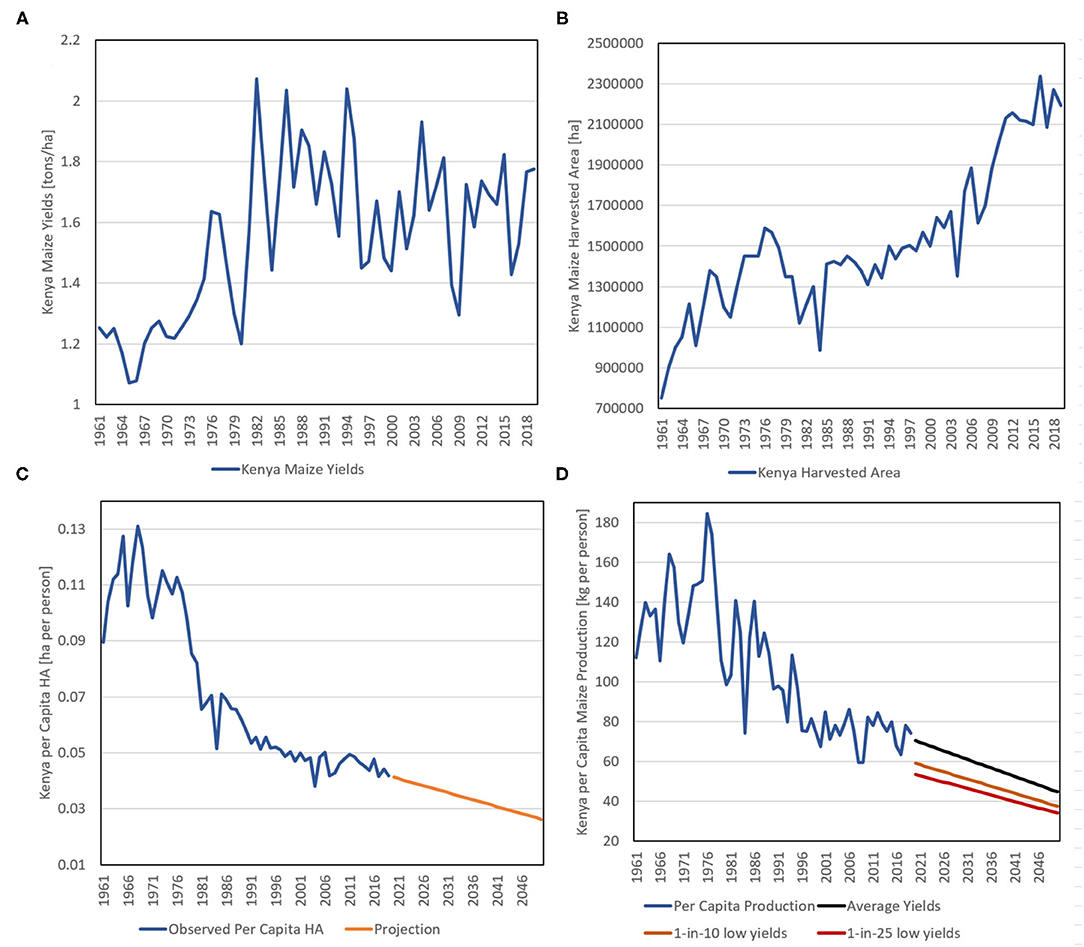
Figure 6. (A) FAOSTAT Kenyan maize yields. (B) FAOSTAT maize harvested area. (C) Observed and projected per capita harvested area, based on an assumed decline of−0.0002 hectare per person per year for 2020 to 2050. (D) Observed and projected per capita maize production. Projections based on recent observed yield values, and 1-in-10 year and 1-in-25-year drought year estimate (1.71, 1.43, and 1.3 tons ha−1).
Combining maize harvested area statistics and projections with UN's population statistics and projections (Figure 6C) reveals declining per capita-harvested area. Since the 1960s, this value has fallen precipitously, and in 2019, per capita-harvested area was very low—just 0.042 ha person−1. Expectations for the future trends are difficult to bracket, given the changing behavior in harvested area trends, which grew rapidly in the 2000s and then stagnated in the 2010s. Hence, the 2000–2019 downward trend in per capita HA is much smaller than the 2010–2019 trend (0.002 ha person−1 year−1 vs. −0.008 ha person−1 year−1). In panel 6C, we have picked a value halfway between these trends to project out through 2050. This moderate assumption leads to a concerning 14% reduction between 2030 and 2019.
We can use this projection, along with yield assumptions, to generate per capita cereal projections (Figure 6D). For the average yield scenario, we have used the 2000–2019 FAOSTAT mean (1.71 tons ha−1). The 1-in-10 and 1-in-25-year yield assumptions are largely guided by an analysis of long records of PWB time-series. There are 40 years of CHIRPS-driven PWB estimates, and in that record, 4 years stand out as substantially drier than the rest (1984, 1993, 2000, and 2008) (Figure 4A). Using the average yield of these four seasons (1.43 tons ha−1) as a 1-in-10-year low yield value seems plausible. This value also matches closely with the 10th percentile value of the 1982–2019 FAOSTAT yields. Yields of 1.43 tons ha−1 would be associated with a ~16% reduction in national yields. Kenya's relatively low variability seems realistic, given that many of the most productive crop-growing regions are in highland areas with high mean PWB values (Figure 3B). While vigorously defending any 1-in-25-year assumption is challenging, given substantial non-stationarity in both society and climate, we might select the low-2009 yield value (1.3 tons ha−1) as a realistic worst-case scenario. This would correspond with a 24% reduction in yields.
When examining changes in per capita crop production (Figure 6D), it is important to recognize that the 10-year trend in per capita harvested area effect (~14%) is on par with the 1-in-10-year yield shock (16%). This may help explain why many recent Kenyan food crises (2011, 2017, 2019) were induced by moderate, not extreme, drought and yield shocks. When the next 1-in-10-year drought comes, a drought event similar to 1984, 2000, or 2009, increases in population and slowing agricultural expansion will interact with, and likely amplify, the impact of water deficit-induced yield reductions. By 2028, for example, average per capita production may resemble the low value from the 2017 drought year (~64 kg maize person−1). A severe (1-in-10-year) drought in 2028 could result in per capita maize production of just 53 kg maize person−1(Figure 6D), a value much lower than the 2009 value of ~64 kg maize person−1. It is very likely, therefore, that trends in population and harvested area, combined with typical year-to-year rainfall and RefET variability, will produce an unprecedented national-level food shock in the near future.
Discussion
Our results emphasize that many climatologically dry areas in eastern east Africa (Figure 3B) have become drier (Figures 2A,B,E). For dry areas in the east, recent low-rainfall seasons have also been accompanied by larger positive WR anomalies (Figure 2F); WR acts to amplify precipitation deficits in eastern east Africa. While we did not find an upward tendency in most of east Africa (Figure 2D), we did find modest WR increases during low-rainfall seasons (Figure 2F).
Looking at longer time-series of PWB estimates (Figure 4), it is interesting to note that recent drought years like 2017 and 2019 were not actually as bad as the strong La Niña-related droughts in 2000, 2009, and 2011. It is not clear whether this represents a shift in the mean or a stochastic outcome. Perhaps recent combinations of large-scale forcing and random weather fluctuations have not combined to produce a really strong drought. When such a drought occurs, it will likely be exacerbated by WR increases (Figure 2F) and decreasing per capita-harvested areas (Figure 6D). Such an outcome would obviously be concerning, given the serious food-security concerns associated with 2017 and 2019 rainfall deficits.
The PWB analyses presented here also provides valuable insights into extreme seasonal precipitation outcomes. In general, we find a “wet-getting-wetter” and “dry-getting-drier” tendency—in climatologically humid regions in western Ethiopia and Kenya (Figure 3B), we find >14% increases in PWB (Figure 2E), which are also associated with an increased frequency of excessively wet rainy seasons (Figure 3A). Unlike the WRSI, the PWB lets us identify and explore “excessive” rainfall. The extreme Kenyan PWB values and increased frequencies of extreme PWB events found near Lake Victoria and in southwestern Ethiopia are quite concerning. To date, much more attention has been focused on the agricultural impacts of droughts. Relatively little work has focused on the potentially negative impacts of extreme growing season precipitation and associated reductions in radiation and RefET. Upward rainfall trends in areas with high climatological PWD are unlikely to improve crop production. This limit can also have a seasonal interpretation. In 2018 and 2020, we found extensive areas with PWB values of more than 200%. Even in an arid region, this “extra” water will be unlikely to enhance agricultural outcomes.
In both humid and arid regions, and wet and dry seasons, the complementary relationship between AET and RefET (Hobbins et al., 2016) provides a useful way to contextualize rainfall extremes and changes. Figure 7 shows a schematic describing the complementary hypothesis. We have used “WR” in place of RefET to emphasize the phenological filtering associated with the time-varying KC coefficients.
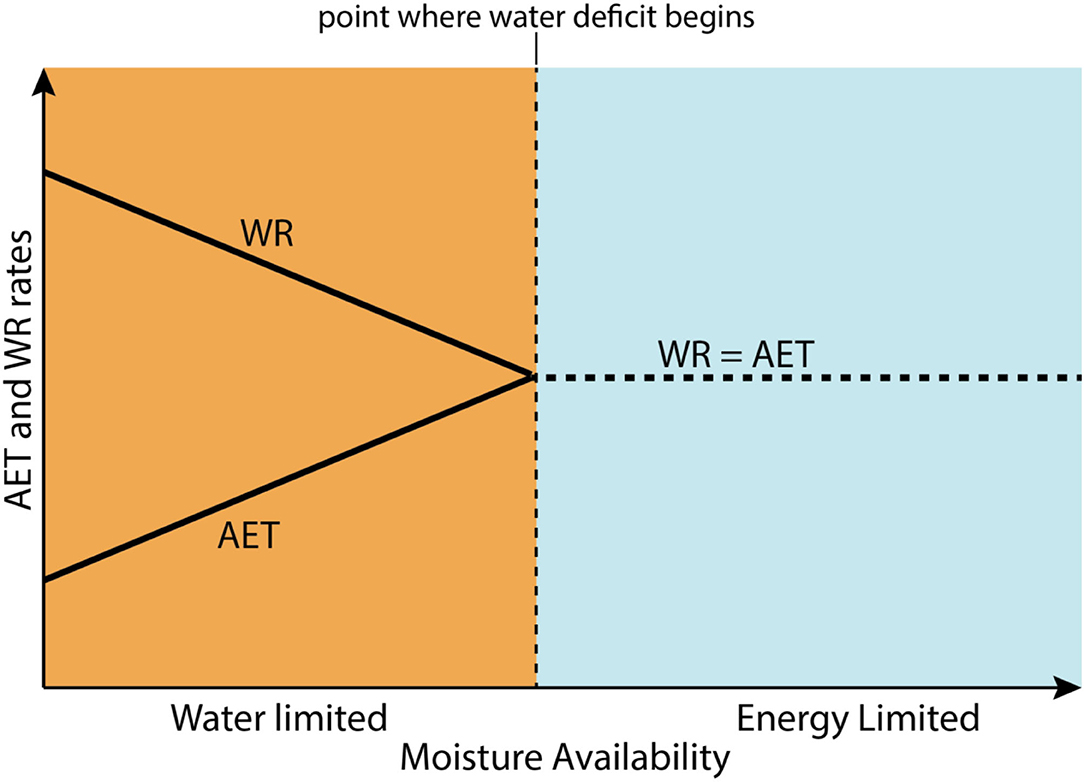
Figure 7. A schematic diagram of the Bouchet-Morton complementary relationship.
In wet regions and seasons, where TGP > WR, AET is energy limited. Cloudiness and cool air temperatures will tend to reduce RefET, which acts as a cap on AET, and ultimately, photosynthesis. Furthermore, since a coarse approximation of the local water balance can be written as runoff = GSP – WR, when GSP is much greater than WR, runoff can increase dramatically, helping to set the stage for floods.
In dry regions and seasons, where TGP < WR, AET is water limited. Under such conditions, the PWB and WRSI are likely to perform similarly. Furthermore, as aridity increases, AET and WR are expected to be complementary, with WR increasing as AET decreases (Figure 7). Extraction and analysis of the WR component has really emphasized this relationship, as many of the driest regions and seasons exhibit the largest anomalous WR increases during below-normal rainfall seasons. In these regions and seasons, the PWB, WRSI, or hydrologic modeling systems like FLDAS are likely to perform better than simple rainfall observations, because they can capture WR/precipitation covariations in very dry regions.
The Bouchet-Morton complementary relationship (Hobbins et al., 2016) helps us understand the spatial and temporal covariations of RefET and precipitation. These covariations amplify the impacts of rainfall deficits in dry areas, as well as the impact of rainfall excesses in wet areas. Ironically, east Africa may be experiencing more crop water deficits in dry areas and more extreme growing season rainfall in some very wet areas.
In the literature discussing climate change and precipitation extremes, it is common to discuss dynamic and thermodynamic drivers (Emori and Brown, 2005). Thermodynamic controls relate to warming in the atmosphere, and the expectation that atmospheric saturation vapor pressure will increase with increasing temperatures at approximately 7% per degree Celsius of warming. Ironically, these increases can both increase the frequency and magnitude of extreme precipitation events (Figure 3A), while also exacerbating the intensity of droughts, especially in dry areas (Figure 2F).
Theoretically, at global scales, climate scientists expect mean precipitation to remain fairly stable, while extreme precipitation increases (Trenberth et al., 2003; Allan and Soden, 2008). Mean precipitation is fundamentally constrained by an energy balance that involves radiation, condensation/diabatic heating, and surface and latent heat fluxes. Because radiation changes are quite small, overall, changes in mean precipitation—both in models and observations—are quite small. This constraint does not hold at small and short spatial and temporal scales, scales in which experts expect both dynamic and thermodynamic exacerbation of extremes (Emori and Brown, 2005). Stable means and more extremes imply that the frequency of dry days would increase.
Globally (Donat et al., 2016), there is substantial evidence that extreme precipitation is becoming more frequent. In areas of sub-Saharan Africa with quality daily precipitation data, robust trends over 1950–2013 indicate that extreme events have become wetter, but that annual totals have decreased due to fewer rain days (Harrison et al., 2019). While this study has only examined seasonal totals, further analyses of sub-seasonal precipitation and temperature statistics, such as consecutive dry days and growing degree days, would be informative. For example, one recent study (Laudien et al., 2020) found that monitoring consecutive dry days was the best overall predictor for Tanzanian yields. Using the WR phenological framework, multiple statistics, arising from a host of potential data sources, could be examined during the vegetative and grain-filling stages. Compositing multiple crop scenarios, such as the combination of maize and grasslands analyzed here, seems useful from a decision analytics perspective.
In Kenya and Ethiopia, these highlands are densely populated. So, the increases in the frequency of extreme wet season precipitation (Figure 3A) are occurring in areas with millions of people. East of ~38°E, densely populated highland areas in Kenya and Ethiopia are much more drought prone, and in these regions, we find substantial increases in water stress (Figure 2E). Below and between the highlands, sparsely populated but very food-insecure pastoralists in eastern east Africa are seeing more frequent water deficits being exacerbated by increasing WR demands (Figure 2F).
Our deeper dive into Kenya crop conditions and per capita cereal production suggests that persistence of the current trends—stagnant yields and rapidly growing population—will likely lead, very soon, to unprecedented low levels of per capita cereal production. Intensification of agriculture through the adoption of improved seeds and fertilizer can help improve yields (Davenport et al., 2018). In addition, the results presented here point toward adaptation strategies that manage climate (Figure 4) and price volatility (Figure 5C). Kenyan climate is strongly impacted by the Indian Ocean Dipole and the El Niño Southern Oscillation, and climate projections anticipate that these drivers will become more extreme (Cai et al., 2013, 2015a,b).
In addition to planning for future food production shocks (Figure 6D), the results presented here provide hopeful evidence supporting improved water management as a path toward increased resilience and more stable agricultural production. In arid regions, well-maintained boreholes can provide access to water during droughts (Thomas et al., 2019), and “drought emergencies can be mitigated by investing in resilience efforts that make safe water reliably available at strategic groundwater abstraction locations during cycles of water stress” (Thomas et al., 2020). In humid areas, improved water storage and expanded irrigation could reduce risks during extremely wet seasons and provide supplemental water during dry seasons.
In closing, we note that, while this study has focused on an important season in an important food-insecure region, the general methods employed here could be expanded to multiple growing seasons and regions. This could then be used to further explore global increases in dryland RefET during drought (Funk et al., 2019a), as results similar to Figure 2F are explored across larger domains. Similarly, excessive precipitation amounts, as evaluated in Figure 3A, could be examined globally.
Data Availability Statement
The original contributions generated for the study are included in the article/supplementary materials, further inquiries can be directed to the corresponding author/s.
Author Contributions
All authors listed have made a substantial, direct and intellectual contribution to the work, and approved it for publication.
Funding
Primary support for this work came from the National Aeronautics and Space Administration (NASA) GPM mission grant #80NSSC19K0686 and the United States Agency for International Development (USAID) cooperative agreement #72DFFP19CA00001 and the Famine Early Warning Systems Network.
Conflict of Interest
The authors declare that the research was conducted in the absence of any commercial or financial relationships that could be construed as a potential conflict of interest.
Publisher's Note
All claims expressed in this article are solely those of the authors and do not necessarily represent those of their affiliated organizations, or those of the publisher, the editors and the reviewers. Any product that may be evaluated in this article, or claim that may be made by its manufacturer, is not guaranteed or endorsed by the publisher.
Footnotes
1. ^https://public.wmo.int/en/programmes/integrated-drought-management-programme.
2. ^https://www.undrr.org/gar2021-drought.
3. ^https://data.chc.ucsb.edu/products/CHIRPS-2.0/.
4. ^https://data.chc.ucsb.edu/products/CHPclim/.
5. ^https://psl.noaa.gov/eddi/globalrefet/.
6. ^http://floodlist.com/africa/.
7. ^The counties of Baringo, Elgeyo-Marakwet, Kajiado, Kiambu, Kirinyaga, Kwale, Laikipia, Lamu, Murang'a, Nakuru, Narok, Nyandarua, Nyeri, Taita Taveta, Tana River, Trans Nzoia, Uasin Gishu, Kilifi.
8. ^https://fews.net/east-africa/alert/may-19-2021.
9. ^https://www.undrr.org/implementing-sendai-framework/what-sendai-framework.
References
AGRHYMET (1996). Méthodologie de suivi des zones à risque. Niamey: AGRHYMET FLASH, Bulletin de Suivi de la Campagne Agricole au Sahel, Centre Regional AGRHYMET.
Agutu, N., Awange, J., Zerihun, A., Ndehedehe, C., Kuhn, M., and Fukuda, Y. (2017). Assessing multi-satellite remote sensing, reanalysis, and land surface models' products in characterizing agricultural drought in East Africa. Remote Sens. Environ. 194, 287–302. doi: 10.1016/j.rse.2017.03.041
Allan, R. P., and Soden, B. J. (2008). Atmospheric warming and the amplification of precipitation extremes. Science 321, 1481–1484. doi: 10.1126/science.1160787
Beck, H. E., Pan, M., Roy, T., Weedon, G. P., Pappenberger, F., Van Dijk, A. I., et al. (2019). Daily evaluation of 26 precipitation datasets using Stage-IV gauge-radar data for the CONUHydrology. Earth Syst. Sci. 23, 207–224. doi: 10.5194/hess-23-207-2019
Beck, H. E., Vergopolan, N., Pan, M., Levizzani, V., Van Dijk, A. I., Weedon, G. P., et al. (2017). Global-scale evaluation of 22 precipitation datasets using gauge observations and hydrological modeling. Hydrol. Earth Syst. Sci. 21, 6201–6217. doi: 10.5194/hess-21-6201-2017
Cai, W., Santoso, A., Wang, G., Yeh, S. W., An, S. I., Cobb, K. M., et al. (2015a). ENSO and greenhouse warming. Nat. Clim. Chang. 5, 849–859. doi: 10.1038/nclimate2743
Cai, W., Wang, G., Santoso, A., McPhaden, M. J., Wu, L., Jin, F. F., et al. (2015b). Increased frequency of extreme La Niña events under greenhouse warming. Nat. Clim. Chang. 5, 132–137. doi: 10.1038/nclimate2492
Cai, W., Zheng, X. T., Weller, E., Collins, M., Cowan, T., Lengaigne, M., et al. (2013). Projected response of the Indian Ocean Dipole to greenhouse warming. Nat. Geosci. 6, 999–1007. doi: 10.1038/ngeo2009
Davenport, F., Funk, C., and Galu, G. (2018). How will East African maize yields respond to climate change and can agricultural development mitigate this response? Clim. Change 147, 491–506. doi: 10.1007/s10584-018-2149-7
Dinku, T., Funk, C., Peterson, P., Maidment, R., Tadesse, T., Gadain, H., et al. (2018). Validation of the CHIRPS satellite rainfall estimates over eastern of Africa. Q. J. R. Meteorol. Soc. 144, 292–312. doi: 10.1002/qj.3244
Donat, M. G., Lowry, A. L., Alexander, L. V., O'Gorman, P. A., and Maher, N. (2016). More extreme precipitation in the world's dry and wet regions. Nat. Clim. Chang. 6:508. doi: 10.1038/nclimate2941
Doorenbos, J., and Pruitt, W. O. (1977). Crop Water Requirements. FAO Irrigation and Drainage Paper 24, Land and Water Development Division. Rome: FAO.
Duan, Z., Liu, J., Tuo, Y., Chiogna, G., and Disse, M. (2016). Evaluation of eight high spatial resolution gridded precipitation products in Adige Basin (Italy) at multiple temporal and spatial scales. Sci. Total Environ. 573, 1536–1553. doi: 10.1016/j.scitotenv.2016.08.213
Duan, Z., Tuo, Y., Liu, J., Gao, H., Song, X., Zhang, Z., et al. (2019). Hydrological evaluation of open-access precipitation and air temperature datasets using SWAT in a poorly gauged basin in Ethiopia. J. Hydrol. 569, 612–626. doi: 10.1016/j.jhydrol.2018.12.026
Emori, S., and Brown, S. (2005). Dynamic and thermodynamic changes in mean and extreme precipitation under changed climate. Geophys. Res. Lett. 32:272. doi: 10.1029/2005GL023272
Frère, M., and Popov, G. (1986). Early Agrometeorological Crop Yield Forecasting, The Food and Agriculture Organization of the United Nations. Rome.
Funk, C., Dettinger, M. D., Michaelsen, J. C., Verdin, J. P., Brown, M. E., Barlow, M., et al. (2008). Warming of the Indian Ocean threatens eastern and southern African food security but could be mitigated by agricultural development. Proc. Nat. Acad. Sci. USA 105, 11081–11086. doi: 10.1073/pnas.0708196105
Funk, C., Harrison, L., Alexander, L., Peterson, P., Behrangi, A., and Husak, G. (2019a). Exploring trends in wet-season precipitation and drought indices in wet, humid and dry regions. Environ. Res. Lett. 14:115002. doi: 10.1088/1748-9326/ab4a6c
Funk, C., Harrison, L., Shukla, S., Pomposi, C., Galu, G., Korecha, D., et al. (2018). Examining the role of unusually warm Indo-Pacific sea surface temperatures in recent African droughts Quart. J. Roy. Meteor. Soc. 144, 360–383. doi: 10.1002/qj.3266
Funk, C., Hoell, A., Shukla, S., Blad,é, I, Liebmann, B., Roberts, J. B., et al. (2014). Predicting East African spring droughts using Pacific and Indian Ocean sea surface temperature indices. Hydrol. Earth Syst. Sci. Discuss. 11, 3111–3136. doi: 10.5194/hessd-11-3111-2014
Funk, C., Michaelsen, J., Verdin, J., Artan, G., Husak, G., Senay, G., et al. (2003). The collaborative historical African rainfall model: description and evaluation. Int. J. Climatol. J. Roy. Meteorol. Soc. 23, 47–66. doi: 10.1002/joc.866
Funk, C., Nicholson, S. E., Landsfeld, M., Klotter, D., Peterson, P., and Harrison, L. (2015a). The centennial trends greater horn of Africa precipitation dataset. Scien. Data 2:50. doi: 10.1038/sdata.2015.50
Funk, C., Pedreros, D., Nicholson, S., Hoell, A., Korecha, D., Galu, G., et al. (2019b). Examining the potential contributions of extreme 'Western V' sea surface temperatures to the March-June East African Drought. Bull. Amer. Meteor. Soc. 100, S55–S60. doi: 10.1175/BAMS-D-18-0108.1
Funk, C., Peterson, P, Landsfeld, M., Pedreros, D., Verdin, J., Shukla, S., et al. (2015c). The climate hazards infrared precipitation with stations—a new environmental record for monitoring extremes. Scien. Data 2:66. doi: 10.1038/sdata.2015.66
Funk, C., Senay, G., Asfaw, A., Verdin, J., Rowland, J., Michaelson, J., et al. (2005). Recent drought tendencies in Ethiopia and equatorial-subtropical eastern Africa. Vulnerability to Food Insecurity: Factor Identification and Characterization Report, NET F, Ed., US Agency for International Development, 12.
Funk, C., Turner, W., McNally, A., Hoell, A., Harrison, L., Galu, G., et al. (2021). An agro-pastoral phenological water balance framework for monitoring and prediction of growing season water deficits. Front. Clim. 10, 1–10. doi: 10.3389/fclim.2021.716568
Funk, C., Verdin, A., Michaelsen, J., Peterson, P., Pedreros, D., and Husak, G. (2015b). A global satellite assisted precipitation climatology. Earth Syst. Sci. Data Discuss. 7, 1–13. doi: 10.5194/essdd-8-401-2015
Funk, C. C., and Brown, M. E. (2009). Declining global per capita agricultural production and warming oceans threaten food security. Food Sec. 1, 271–289. doi: 10.1007/s12571-009-0026-y
Gao, F., Zhang, Y., Chen, Q., Wang, P., Yang, H., Yao, Y., et al. (2018). Comparison of two long-term and high-resolution satellite precipitation datasets in Xinjiang, China. Atmosph. Res. 212, 150–157. doi: 10.1016/j.atmosres.2018.05.016
Gebrechorkos, S. H., Hülsmann, S., and Bernhofer, C. (2019). Long-term trends in rainfall and temperature using high-resolution climate datasets in East Africa. Sci. Rep. 9, 1–9. doi: 10.1038/s41598-019-47933-8
Gummadi, S., Dinku, T., Shirsath, P. B., and Kadiyala, D. M. (2021). Spatial and temporal evaluation of satellite rainfall estimates overVietnam.
Harrison, L., Funk, C., and Peterson, P. (2019). Identifying changing precipitation extremes in Sub-Saharan Africa with gauge and satellite products. Environ. Res. Lett. 14:085007. doi: 10.1088/1748-9326/ab2cae
Hobbins, M. T., Wood, A., McEvoy, D. J., Huntington, J. L., Morton, C., Anderson, M., et al. (2016). The evaporative demand drought index. Part I: Linking drought evolution to variations in evaporative demand. J. Hydrometeorol. 17, 1745–1761. doi: 10.1175/JHM-D-15-0121.1
Hoell, A., and Funk, C. (2013a). Indo-Pacific sea surface temperature influences on failed consecutive rainy seasons over eastern Africa. Clim.Dynam. 43, 1645–1660. doi: 10.1007/s00382-013-1991-6
Hoell, A., and Funk, C. (2013b). The ENSO-Related West Pacific sea surface temperature gradient. J. Clim. 26, 9545–9562. doi: 10.1175/JCLI-D-12-00344.1
Laudien, R., Schauberger, B., Makowski, D., and Gornott, C. (2020). Robustly forecasting maize yields in Tanzania based on climatic predictors. Sci. Rep. 10, 1–12. doi: 10.1038/s41598-020-76315-8
Liebmann, B., Hoerling, M. P., Funk, C., Bladé, I., Dole, R. M., Allured, D., and Eischeid, J. K. (2014). Understanding recent eastern horn of africa rainfall variability and change. Climate J. 27, 8630–8645. doi: 10.1175/JCLI-D-13-00714.1
Lyon, B. (2014). Seasonal drought in the greater horn of Africa and its recent increase during the march-may long rains. J. Clim. 27, 7953–7975. doi: 10.1175/JCLI-D-13-00459.1
Lyon, B., and DeWitt, D. G. (2012). A recent and abrupt decline in the East African long rains. Geophys. Res. Lett. 39:337. doi: 10.1029/2011GL050337
McNally, A., Arsenault, K., Kumar, S., Shukla, S., Peterson, P., Wang, S., et al. (2017). A land data assimilation system for sub-Saharan Africa food and water security applications. Scien. data. 4:170012. doi: 10.1038/sdata.2017.12
Paredes Trejo, F. J., Alves Barbosa, H., Peñaloza-Murillo, M. A., Moreno, M. A., and Farias, A. (2016). Intercomparison of improved satellite rainfall estimation with CHIRPS gridded product and rain gauge data over Venezuela. Atmósfera 29, 323–342. doi: 10.20937/ATM.2016.29.04.04
Prakash, S. (2019). Performance assessment of CHIRPS, MSWEP, SM2RAIN-CCI, and TMPA precipitation products across India. J. Hydrol. 571, 50–59. doi: 10.1016/j.jhydrol.2019.01.036
Retalis, A., Katsanos, D., Tymvios, F., and Michaelides, S. (2018). Validation of the first years of GPM operation over Cyprus. Rem. Sens. 10:1520. doi: 10.3390/rs10101520
Rivera, J. A., Marianetti, G., and Hinrichs, S. (2018). Validation of CHIRPS precipitation dataset along the Central Andes of Argentina. Atmosph. Res. 213, 437–449. doi: 10.1016/j.atmosres.2018.06.023
Senay, G. B., and Verdin, J. (2003). Characterization of yield reduction in Ethiopia using a GIS-based crop water balance model. Canad. J. Rem. Sens. 29, 687–692. doi: 10.5589/m03-039
Shrestha, N. K., Qamer, F. M., Pedreros, D., Murthy, M., Wahid, S. M., and Shrestha, M. (2017). Evaluating the accuracy of Climate Hazard Group (CHG) satellite rainfall estimates for precipitation based drought monitoring in Koshi basin, Nepal. J. Hydrol. Reg. Stud. 13, 138–151. doi: 10.1016/j.ejrh.2017.08.004
Shukla, S., Funk, C., and Hoell, A. (2014). Using constructed analogs to improve the skill of March-April-May precipitation forecasts in equatorial East Africa. Environ. Res. Lett. 9:094009. doi: 10.1088/1748-9326/9/9/094009
Smirnov, O., Zhang, M., Xiao, T., Orbell, J., Lobben, A., and Gordon, J. (2016). The relative importance of climate change and population growth for exposure to future extreme droughts. Clim. Change 138, 41–53. doi: 10.1007/s10584-016-1716-z
Thomas, E., Jordan, E., Linden, K., Mogesse, B., Hailu, T., Jirma, H., et al. (2020). Reducing drought emergencies in the Horn of Africa. Sci. Total Environ. 727:138772. doi: 10.1016/j.scitotenv.2020.138772
Thomas, E. A., Needoba, J., Kaberia, D., Butterworth, J., Adams, E. C., Oduor, P., et al. (2019). Quantifying increased groundwater demand from prolonged drought in the East African Rift Valley. Sci. Total Environ. 666, 1265–1272. doi: 10.1016/j.scitotenv.2019.02.206
Trenberth, K. E., Dai, A., Rasmussen, R. M., and Parsons, D. B. (2003). The changing character of precipitation. B Am. Meteorol. Soc. 84, 1205–1217. doi: 10.1175/BAMS-84-9-1205
Verdin, J., and Klaver, R. (2002). Grid-cell-based crop water accounting for the famine early warning system. Hydrol. Process. 16, 1617–1630. doi: 10.1002/hyp.1025
Wainwright, C. M., Marsham, J. H., Keane, R. J., Rowell, D. P., Finney, D. L., Black, E., et al. (2019). ‘Eastern African Paradox'rainfall decline due to shorter not less intense Long Rains. npj Clim. Atmosph. Sci. 2, 1–9. doi: 10.1038/s41612-019-0091-7
Williams, P., and Funk, C. (2011). A westward extension of the warm pool leads to a westward extension of the Walker circulation, drying eastern Africa. Clim. Dynam. 37, 2417–2435. doi: 10.1007/s00382-010-0984-y
Keywords: climate change, East Africa, agriculture, risk management, climate extremes, drought, disaster risk management
Citation: Funk C, Way-Henthorne J and Turner W (2021) Phenological Water Balance Applications for Trend Analyses and Risk Management. Front. Clim. 3:716588. doi: 10.3389/fclim.2021.716588
Received: 28 May 2021; Accepted: 17 August 2021;
Published: 20 September 2021.
Edited by:
Mphethe Tongwane, Zutari, South AfricaReviewed by:
Alexandre S. Gagnon, Liverpool John Moores University, United KingdomFadji Maina, National Aeronautics and Space Administration, United States
Copyright © 2021 Funk, Way-Henthorne and Turner. This is an open-access article distributed under the terms of the Creative Commons Attribution License (CC BY). The use, distribution or reproduction in other forums is permitted, provided the original author(s) and the copyright owner(s) are credited and that the original publication in this journal is cited, in accordance with accepted academic practice. No use, distribution or reproduction is permitted which does not comply with these terms.
*Correspondence: Chris Funk, Y2hyaXNAZ2VvZy51Y3NiLmVkdQ==