 Fadzisayi Mashonganyika1
 Hillary Mugiyo
- 1Department of Research and Specialist Services (Crop Research Division), Harare, Zimbabwe
- 2Agricultural Technical and Extension Services (AGRITEX), Harare, Zimbabwe
- 3Centre for Transformative Agricultural and Food Systems, School of Agricultural, Earth & Environmental Sciences, University of KwaZulu-Natal, Pietermaritzburg, South Africa
- 4Chinhoyi University of Science and Technology, Chinhoyi, Zimbabwe
A robust early warning system can alert to the presence of food crises and related drivers, informing decision makers on food security. To date, decision-makers in Zimbabwe still rely on agriculture extension personnel to generate information on wheat production and monitor the crop. Such traditional methods are subjective, costly and their accuracy depends on the experience of the assessor. This study investigates Sentinel-2 NDVI and time series utility as a wheat-monitoring tool over the wheat-growing areas of Zimbabwe's Bindura, Shamva, and Guruve districts. NDVI was used to classify and map the wheat fields. The classification model's evaluation was done by creating 100 reference pixels across the classified map and constructing a confusion matrix with a resultant kappa coefficient of 0.89. A sensitivity test, receiver operating characteristic (ROC) and area under the curve (AUC) were used to measure the model's efficiency. Fifty GPS points randomly collected from wheat fields in the selected districts were used to identify and compute the area of the fields. The correlation between the area declared by farmers and the calculated area was positive, with an R2 value of 0.98 and a Root Mean Square Error (RMSE) of 2.23 hectares. The study concluded that NDVI is a good index for estimating the area under wheat. In this regard, NDVI can be used for early warning and early action, especially in monitoring programs like ‘Command Agriculture’ in Zimbabwe. In current and future studies, the use of high-resolution images from remote sensing is essential. Furthermore, ground truthing is always important to validate results from remote sensing at any spatial scale.
Introduction
Wheat is one of the cereal grains produced and consumed globally (Igrejas and Branlard, 2020). It is one of the most important crops for national food security and a source of livelihood in developing countries like Zimbabwe (Shiferaw et al., 2013). Wheat is considered the second most important cereal crop in Zimbabwe after maize (Chawarika, 2016). It is grown during the winter season (May–September) under irrigation, and it is the predominant crop grown during winter. The annual wheat consumption for Zimbabwe is above 400 000 metric tons, yet imports of around 80 percent wheat are made each year (Mutambara et al., 2013). This is attributable to several factors such as poor agricultural practices, lack of resources to finance wheat production in winter and, to a certain extent, unfavorable weather conditions. Therefore, the decision-makers must obtain accurate information on the planting area and production of winter wheat to determine how much wheat to import and protect the constrained local farmers who produce 15 to 25% of wheat required in the country.
Traditionally, the country relies on field surveys to monitor wheat production. This method is expensive, time consuming, and sometimes subjective (Wang et al., 2019). It is also not feasible in a large-scale agriculture landscape to facilitate national field crop mapping (Ouzemou et al., 2018). Therefore, cheaper and faster ways of identifying and mapping crop fields have become a necessity. Satellite remote sensing technology has been successfully used to estimate wheat production through vegetation indices (VI) time-series data at large scales (Atkinson et al., 2012; Franch et al., 2019). Crop phenological information can be derived from satellite data, and ground observations can be used for verifications (You et al., 2013). It has been investigated and practiced successfully in retrieving vegetation phenology based on remotely sensed vegetation indices (VI) time-series at broad scales (Atkinson et al., 2012; Zeng et al., 2020). Vegetation index time series are good indicators reflecting the dynamics of vegetation growth and vegetation coverage. This has provided a basis for wheat growth monitoring in this study. Sentinel-2 imagery was used, which provides free and open services and data with a high spatial resolution of 10–60 m (depending on the band). It has a temporal resolution of about 5 days (depending on the latitude) (Escolà et al., 2017a; Isbaex and Margarida Coelho, 2021). Such spatial and temporal resolutions and the availability of images free of charge make Sentinel-2 very appealing for crop monitoring. This includes identifying, mapping and estimating acreage of the field crops for subsequent yield forecasting when using yield statistical records. Therefore, the need to integrate remote sensing in crop monitoring with ground observations cannot be over-emphasized. However, this involves acquiring and using big data to monitor crops in real-time, which needs to be automated for easy management. Cloud based solutions require hardware and software driven by the appropriate applications, packaging and systems, and they require high financial investments.
Vegetation Indices (VIs) are a combination of surface reflectance at two or more different wavelengths and are designed to highlight a specific vegetation property. Vegetation Indices (VIs) obtained from remote sensing-based covers are simple and effective algorithms for quantitative and qualitative evaluations of vegetation cover, vigor, and growth dynamics. They include: normalized difference vegetation index (NDVI), leaf area index (LAI), vegetation condition index (VCI), enhanced vegetation index (EVI) and soil-adjusted vegetation index (SAVI). These vegetation indices have been applied widely in remote sensing using different aerial and satellite platforms. Recent advances involve Unmanned Aerial Vehicles (UAV) (do Amaral et al., 2020), although its application is still new in Zimbabwe. The NDVI, derived from remote-sensing (satellite) data, is commonly used in crop assessments (Stuhlmacher, 2011). NDVI measures the state of plant health based on the plant's reflection of light at specific frequencies (absorbs some waves and reflects others). Therefore, it is instrumental in crop monitoring and evaluation (Suárez et al., 2019).
In Zimbabwe, the estimation of the wheat area is always a challenge because it is the only major cereal winter crop with significant importance to the economy. Unlike other crops such as maize, sorghum, and groundnuts typically grown simultaneously during the rainy season, allowing assessments of multiple crops, monitoring of winter wheat crop is expensive because field assessments are done for a single crop. In addition, the government of Zimbabwe is financing wheat farmers by providing inputs under the ‘Command Agriculture’ program to improve wheat production (Supplementary Table 1). Therefore, cheaper and timely monitoring and evaluation techniques to acquire the planting area of winter wheat are critical for implementing these programs. We can improve the timing of assessment results, reduce cost, address subjectivity, and enhance broad-scale crop monitoring by integrating remote sensing into the current crop assessment programs. However, studies on remote sensing technology in crop monitoring systems are still limited in Zimbabwe. Therefore, the main objective of this study is to investigate the use of remote sensing data in crop monitoring. Sentinel-2 NDVI and time series analysis will be used as monitoring tools to identify, map, and estimate the winter wheat crop area.
Methods and Materials
Study Area
The study was carried out in major wheat-growing districts of Mashonaland Central province, namely Bindura, Guruve, and Shamva (Figure 1). The province is located between 30.014 ~ 32.858 degrees East and 15.620 ~ 17.688 degrees South. The province primarily lies in the agro-ecological region II (Intensive farming), with some small portions falling in regions III (Semi-Intensive farming) and IV (Semi-Extensive farming) (Musemwa and Mushunje, 2012). Rainfall in this region is confined to summer and ranges from moderate (650–800 mm) to moderately high (750–1,000 mm). The soils in this area vary from sandy loams to clays. Similarly, soil fertility varies from place to place. It is suitable for semi-intensive and semi-extensive farming, depending on the prevailing agro-ecological conditions (CIAT; World Bank., 2017). Major crops grown include tobacco, soya beans, citrus, cotton and small grains (including wheat).
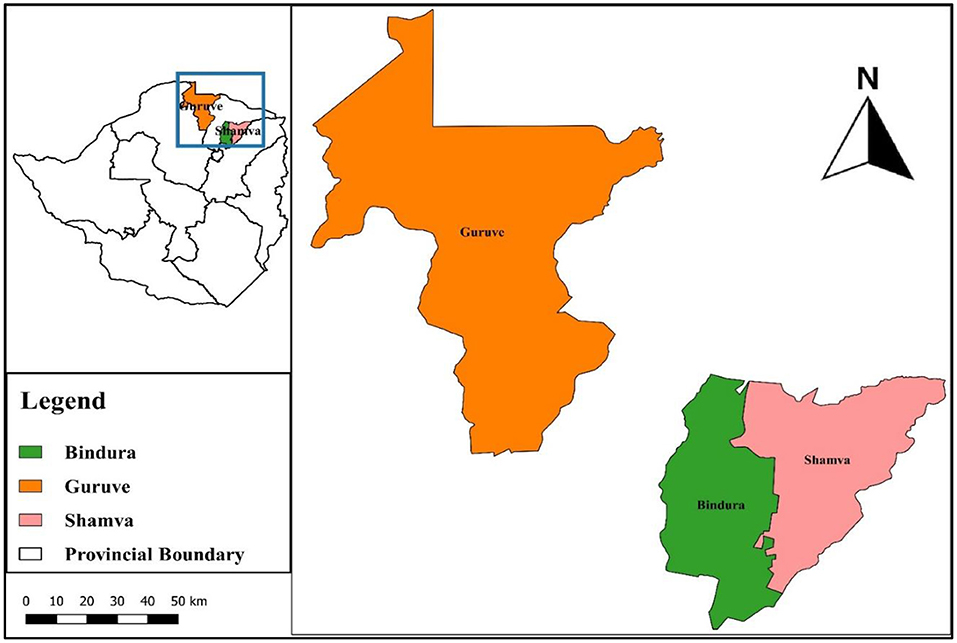
Figure 1. Study area.
Data Collection
Training of Agriculture Extension (AGRITEX) officers was done on Global Positioning System (GPS) technology to capacitate them to collect locational data for the wheat fields in Mashonaland Central districts for the 2019 season. The data was collected using Latitude/Longitude (degrees, minutes, and seconds) coordinate system with the World Geodetic System of 1984 (WGS84) as the reference datum. To cater to the GPS receivers' error margins, the GPS locations were recorded inside the fields about 3 m from the edges of the selected wheat fields. These locations and other attributes were captured in a table on a formatted data collection sheet. The data collected included; farm name, farm owner, farm model, an estimated area under wheat, date of planting and date of harvesting. The coordinates were then converted using QGIS software into shapefiles and used for satellite image analysis, i.e., classification of the image, identifying and mapping the fields, and computing area of the fields.
Sample Size
Six districts that grow wheat in Mashonaland Central province were initially targeted, but a few officers collected the data. However, only three sections were visited, namely; Bindura, Guruve, and Shamva districts. A total of 60 GPS locations of wheat fields were randomly collected during the survey. Farmers contracted to the ‘Command Agriculture’ program was our primary target, although a few commercial farmers who have not joined the program were included. According to statistics, Mashonaland Central had 139 farmers contracted to this program in 2019. Although 60 fields were visited and the relevant data was collected, not all the data collected was usable because of its quality. Some of the coordinates were wrongly captured, thereby falling far away from the actual fields. Some of the data supplied had missing details of critical attributes like the area of the fields. Such data was therefore discarded, and only usable data were considered for the analysis. Our sample size ultimately was 50 wheat fields (Table 1).
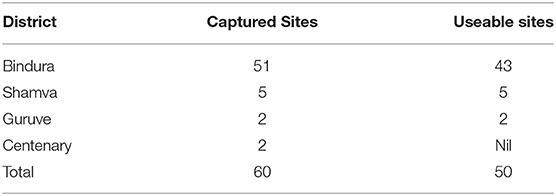
Table 1. Sites visit in Mashonaland Central province.
Normalized Difference Vegetation Index (NDVI) Data
NDVI data were derived from Sentinel 2 datasets. Sentinel 2 is a component of the Copernicus earth observation program developed by the European Union (EU) to study the earth's surface. It consists of two satellites designed to acquire reflected sunlight in the optical range of the electromagnetic wavelengths. It is susceptible to variations in vegetation and has been extremely useful for monitoring forests and crops (Hill, 2013). The Sentinel-2 images (tiles 36KTG, KUG, KTF and KUF) with zero percent cloud cover were selected and downloaded from the USGS Earth Explorer site: https://earthexplorer.usgs.gov/ for the period 1 May to 30 September 2019. These tiles were joined together by creating a virtual raster in QGIS. Pre-preprocessing, which involved atmospheric correction of the Sentinel-2 images, was done using the Semi-Automated Classification Plugin. Sentinel-2 contains reflectance data of 13 bands (Escolà et al., 2017a). The temporal resolution of this product is 5 days. The spatial resolution of Sentinel-2 images ranges from 10 to 60 meters. The red (Band 4) and near-infrared (Band 8) spectral bands are of significant importance to this study, with a spatial resolution of 10 meters. Normalized Difference Vegetation Index (NDVI) image was created from the red and near-infrared bands in ArcGIS using the spatial analyst module and the ‘raster calculator’ tool. The polygon for the study area was used to extract NDVI data for the area of interest for the analysis. The NDVI index is calculated as the ratio between the difference and sum of the reflectance in NIR (B8) and red (B4) regions (Adão et al., 2017).
The RNIR represents the reflectance of NIR radiation, while RRED is the reflectance of visible RED radiation.
With the formula above, vegetation density at any point of the image is highly correlated to the difference in reflected light's intensity in the red and infrared range divided by the sum of these intensities (Suárez et al., 2019).
Time Series Analysis for Phenology Extraction
We analyzed the NDVI values from May (usually the start of the winter wheat growing season) to September (end of the season). The value tool in QGIS was used to extract pixel data from the NDVI images created for a start to the end of the season. The NDVI values from the random points in the wheat fields were used to construct time series graphs. This is because NDVI time series from satellite data can approximate phenological stages and thus characterize the general vegetation behavior within its spatial footprint (Huang et al., 2019). Therefore, the wheat crop development was studied by looking at its phenological characteristics, including germination, leaf emergence, and up to the start of senescence. This was used as a monitoring tool to confirm the presence or absence during the period under study.
Mapping of Wheat Fields and Calculation of Area Under Wheat
On the NDVI image, wheat fields were an outstanding feature during the period under study. The image was classified into three land-use classes using NDVI thresholds derived from the NDVI raster map, i.e., <0.07 for water bodies, <0.3 for uncultivated land and >0.3 for the cropped area ArcGIS software. Fifty GPS coordinates collected from the fields were used to identify and match with the individual wheat fields to compute the area. The area of each field was calculated using the ‘Raster Calculator’ tool in ArcGIS. The area computed using this method was compared to the area reported by the farmers (Supplementary Table 4). Evaluation of this method of determining the area under wheat was done using a linear regression model. Coefficient of determination (R2) was used to indicate the consistency and linear correlation between the calculated area and the reference data (area reported by farmers). The closer the R2 is to 1, the higher the consistency between them. RMSE was also used to assess the model performance.
Validation of the Classification Model
The accurate location of the winter wheat fields is an essential consideration in obtaining accurate results. Therefore, the need to validate the classification process. A point map was created using 100 randomly selected reference points across the NDVI image with 30 points for water (class 1), 40 for uncultivated (class 2), and 30 for cultivated (class 3) land-use classes (Supplementary Table 2). The reference points were converted to reference pixels and combined with the NDVI classified map to extract the classified map's pixel values. Data extracted from the combined map was used to compute a confusion matrix (Supplementary Table 3). Validation of this model was based on the overall accuracy and the kappa coefficient values from the confusion matrix, the receiver operating characteristic (ROC), and the area under the curve (AUC) analysis. The ROC plot has an x-axis indicating the false-positive error rate, which signifies a wrong prediction by the model. The y-axis shows the actual positive rate, indicating a correct prediction by the model. If the value of AUC is ≤ 0.5, it means a random prediction, while values of AUC higher than 0.5 and closer to 1 indicates a better prediction by the model (Jiménez-Valverde, 2012; Senay and Worner, 2019). The composite operator helps illustrate how well two layers or maps agree on how the categories are clustered spatially.
Results
Time Series Analysis Results for the NDVI on the Wheat Fields
Time-Series Images
NDVI images for the wheat fields understudy for dates ranging from 5 May, 11 June, 1 July, 31 July, 30 August and 29 September 2019 are displayed in Figure 2. The NDVI images show a gradual increase in intensity on the wheat fields from May to the end of July, then a gradual decrease after that until there was no significant difference with the nearby environment in September. Therefore, NDVI values assumed an upward trend from early June to the end of July, then a downward trend after that until September (with deeper color standing for higher NDVI values).
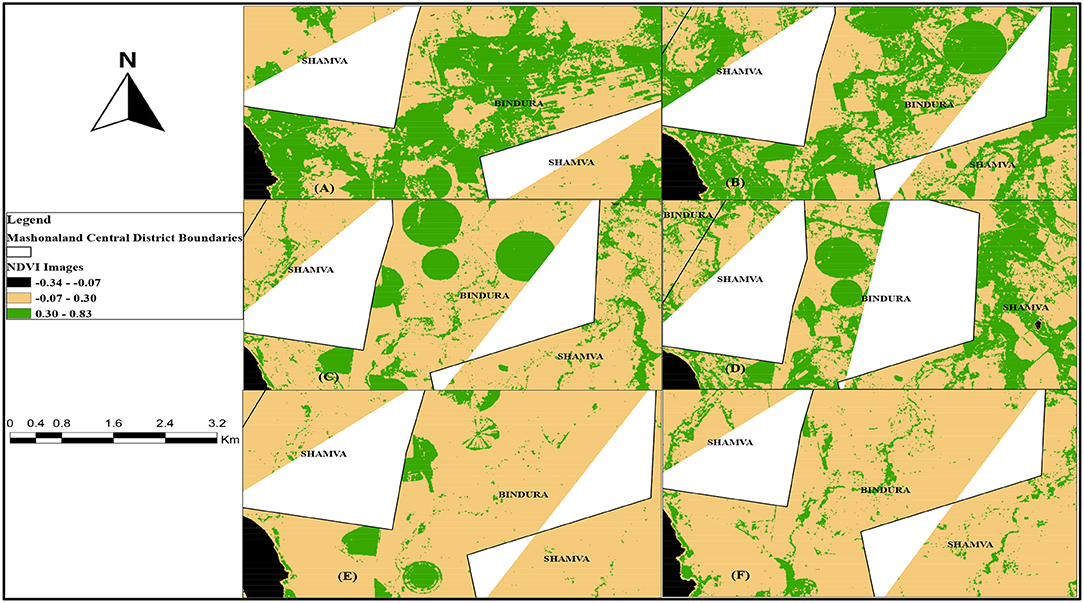
Figure 2. NDVI Time-series images for part of Bindura from May to September 2019. Image Acquisition dates: (A) May 2019, (B) 11 June 2019, (C) 1 July 2019, (D) 31 July 2019, (E) 30 August 2019, (F) 29 Septembers 2019.
Time-Series Graphs
The NDVI time series graphs from the beginning of May to the end of September 2019 are displayed in Figure 3. These results agree with results from the time series images. There is an increase in NDVI values from about 0.2 in May, rising to peak values ranging from 0.4 to 0.8 in July before gradually decreasing to around 0.2 again in September.
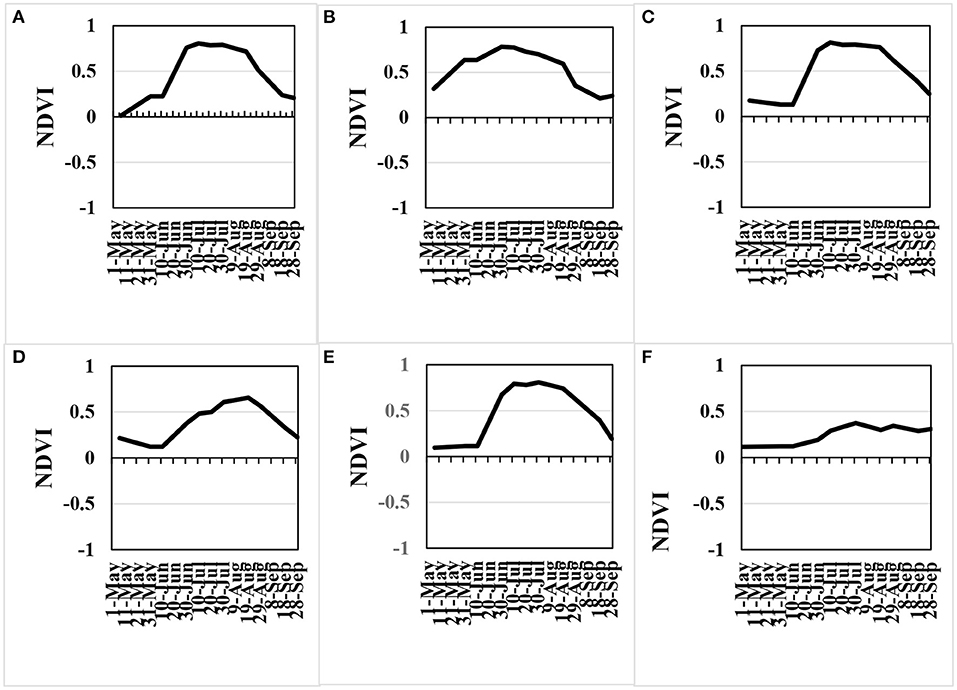
Figure 3. Time series graphs for (A) SOS Maizelands, (B) Hopedale, (C) Vale Farm, (D) Northstar, (E) Douglyn, (F) Kudukloof.
Classification of the NDVI Image and Mapping of Wheat Fields
Data was collected from selected farms in Bindura, Shamva, and Guruve districts extending from 30.80 to 31.60 E longitude and 16.60 to 17.170 S latitude. From the Sentinel-2 NDVI images, wheat fields were an outstanding observable feature. The image acquired on 1 July 2019 was used to classify and map the wheat fields (Figure 4). Locational data was used to identify and match the wheat fields with their farm names, farm owners and the area planted (as reported by the farmer).
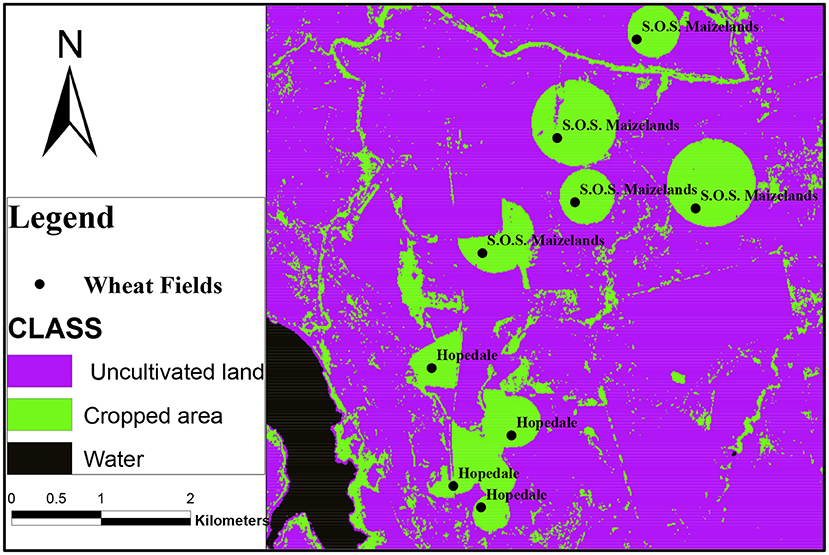
Figure 4. NDVI Classified Map.
Computation of Area Under Wheat
Hectarages of wheat fields were computed in ArcGIS to determine the hectarage of wheat planted using satellite imagery. The comparison between the output from these computations with the area reported during the field visits by the farmers was made. The locational, attribute data collected, and area of the wheat fields are displayed in Supplementary Table 4. The sizes of the wheat fields ranged from a minimum of 1 hectare to a maximum of 74 hectares.
Validation of the Results for Calculating the Area Under Wheat
The results obtained from calculating the actual hectarages was validated using simple linear regression analysis (Figure 5), and an R2 value of 0.9801 was attained with an RMSE of 2.23 hectares. The regression equation for predicting the area under wheat is;
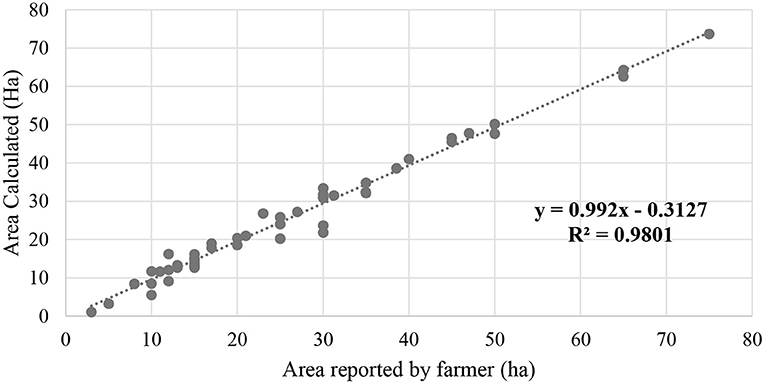
Figure 5. Scatter plot showing the relationship between reported and calculated hectarage for wheat fields in selected farms for Mashonaland Central province.
y = 0.992x−0.3127
Validation of the Classification Model
Evaluation of the classification model was done by computing the confusion matrix and through ROC/AUC analysis. The overall accuracy rate was 0.93, and the kappa coefficient was 0.89 (Supplementary Table 3). The ROC / AUC analysis results were derived from the logistic regression according to the maximum entropy (MaxEnt) theory (Figure 6). The value of AUC for this model is 0.91.
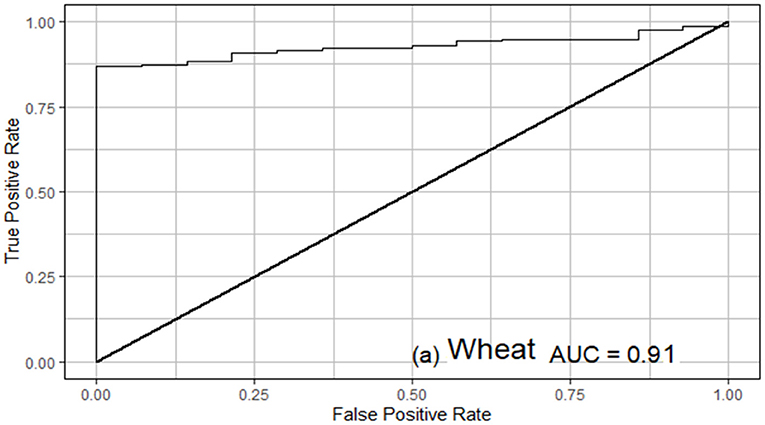
Figure 6. ROC/AUC analysis results.
Discussion
Many nations have widely adopted remote sensing data as a crop monitoring tool over the years. However, Zimbabwe seems to be lagging in adopting these new technologies. Relying on field assessments alone has proved to be costly, time-consuming and in some cases subjective. This study investigated the use of remote sensing data in crop monitoring. Sentinel-2 NDVI data and time series analysis were used as monitoring tools to identify, map, and estimate the winter wheat crop area. The NDVI from Sentinel-2 satellite imagery could locate wheat fields and calculate the area under wheat with relatively high precision (R2 = 0.98, RMSE = 2.23). The classification model was evaluated using the confusion matrix with an accuracy of 0.93 and a kappa coefficient of 0.89 (Supplementary Table 3). ROC/AUC analysis gave an accuracy of 91 percent (Figure 6). These results indicate a better prediction by the model. This implies that detecting wheat fields using Sentinel-2 NDVI as a remote sensing tool agrees with the ground truth. Therefore, NDVI provides a simple, faster and more reliable way of identifying wheat fields to monitor wheat production through the winter season.
The NDVI time series images and graphs obtained in the selected wheat fields generally showed a progression from values of <0.2 at the start of the season to a maximum range of between 0.4 and 0.8, then a gradual decrease after that (Figures 2, 3). Similar studies were carried out using EOS/MODIS in Henan Province, China. The results obtained are consistent with the results of this study, where a gradual increase in NDVI values of winter wheat was observed. The signal from NDVI reached peak value at the heading stage, then a gradual decrease toward harvesting (Filippa et al., 2018). This study shows a similar trend, thus confirming that NDVI values can be used for crop growth monitoring. This increase in NDVI is related to increases in the canopy leaf area index (LAI).
In estimating the area under a crop, accurate information on the temporal and spatial resolution of the remote sensing images is essential. In this study, sentinel-2 satellite data was used to provide high-resolution images (10 m), available for free. Sentinel-2 datasets can be used in developing countries like Zimbabwe, where high-resolution images from Light Detection and Ranging (LiDAR) are still expensive. The NDVI from sentinel-2 satellite data is used based on the physics of light reflection and absorption across bands (Suárez et al., 2019). It is known that healthy vegetation reflects light strongly in the near-infrared band and less strongly (absorbs more) in the visible portion of the spectrum (Suárez et al., 2019). The more a plant absorbs visible sunlight (during the growing season), the more photosynthesising and more productive it is (Rafezall et al., 2020).
Conversely, the less sunlight the plant absorbs, the less photosynthesising and the less productive it is. Therefore, a ratio between the light reflected in the near-infrared and light reflected in the visible spectrum will represent areas with wheat. This has formed the basis for using this tool for crop monitoring.
Estimating wheat areas on time will allow decision-makers to take appropriate action toward food security. This is critical in the Zimbabwean context, where the government is funding special agricultural programs to improve crop production and productivity with particular reference to the ‘Command agriculture’ program. Several challenges are being faced in recovering the total value of these government initiatives because some beneficiaries do not use the inputs for the intended program, thereby derailing the purpose of such initiatives. Due to slackened monitoring and evaluation systems, the government is unable to timely trace whether the farmer or beneficiary has complied or not. Use of NDVI time series can be used to confirm in time whether the beneficiaries of this program have planted wheat within the anticipated period or not. If not, the administrators of the programs can quickly make informed decisions and prevent abuse of resources.
This study shows that hectarages derived from the field images (calculated area) are very close to those reported by farmers (Supplementary Table 4). The scatter plot in Figure 2 shows a positive relationship between the area reported by farmers and the area calculated through the classification model. The simple linear regression analysis obtained a coefficient of determination (R2 value) of 98%. This means eyeballing and remote sensing determined areas are close to 1. It implies that 98% variation in Y can be explained in X. Therefore, it confirms that NDVI can extract winter wheat fields with high accuracy. Previous studies in China also demonstrated that NDVI could successfully extract winter wheat acreage with an error of 9.66% (Qiao and Cheng, 2009). In recent wheat mapping studies in China's Northern Anhui Counties and Central Anhui Counties, accuracy was obtained between 78 and 95 percent (Zhang et al., 2019). The variation in the accuracy of mapping was mainly due to differences in the size of the wheat fields. Large homogeneous wheat fields were mapped with high precision when compared to areas with smaller fields. In this study, our most minor wheat field was one hectare, but most of the wheat fields were in the range of 10–50 hectares; hence they were mapped with high precision. This study can therefore confirm that NDVI can be used successfully to estimate the area under wheat.
It was also noted during the initial stages of the data analysis process that the error of estimating area under wheat for this study was high, and this was attributed to the existence of many outliers. Most of the discrepancies came from the fact that some farmers contracted to the ‘Command Agriculture’ program has limited irrigation facilities on their farms but can grow more wheat. These farmers have resorted to increasing their hectarage by out-sourcing land from other farms with idle irrigation facilities to which they are sub-contracted. Many farmers just report the total area intended for wheat growing and get the corresponding inputs without declaring such arrangements. On the other hand, some farm owners who have sub-contracted part of their farms to other farmers only declare their hectarage, which is less than that observed on the satellite images. As a result, the total area under wheat on their farms detected through satellite imagery was much more or less than what is in the official records for ‘Command Agriculture’ contracts. Efforts were made to contact farmers with such scenarios to clarify these issues, which has greatly reduced the error of the field area calculations. Therefore, the results of this study demonstrate that satellite imagery can more accurately be used to timely estimate the acreage of wheat for each season.
Like most remote sensing studies on identifying and mapping crop fields, this study comes with some limitations. For example, the wheat fields visited were ranging from 1 to 74 hectares. However, we noted that some smaller fields were not included in this study because the field boundaries were not clearly defined on the images, making it difficult to map them. Recent studies in the Netherlands also assessed geospatial parcel parameters on arable land and revealed the same limitation on Sentinel-2 satellites on small agricultural plots (Vajsová et al., 2020). Therefore, higher resolution images like UAV technology may be recommended when mapping smaller agricultural plots. Downloading of images were done manually because of the limited capacity of our computer hardware and software, so we failed to download some of the images and sourced them from other government departments. Therefore, the need for financial investment in these resources should be prioritized. During the present data collection exercise, we have not considered the influence of different farming systems in Mashonaland Central province because the visual selection of occurrence location points may cause substantial bias in sample selection (Araújo and Peterson, 2012; Merow et al., 2013). Again, the three districts and the 50 sites selected in this study may not represent the whole country, Zimbabwe. A systematic random sampling technique is recommended to capture the dynamics of farming systems in the whole of Zimbabwe.
Way Forward
This study demonstrated the potential for remote sensing data to extract wheat fields and compute the area under wheat at the early stages of the wheat growing season, which can be used to predict yield. This has raised the need to roll out the research to a national level to create and deploy a near-real-time early warning system. Therefore, we recommend that more training sites be included across the country to ascertain the applicability of this tool in all scenarios in the wheat growing sector.
While the results of this study remain applicable for use, future research should consider the use of data with a finer resolution to improve the accuracy of crop mapping. This will improve the mapping of smaller agricultural plots and identify specific crops in mixed crop farming, which are now a common phenomenon in the Zimbabwean agricultural systems. The use of unmanned aerial vehicles can be used to capture high-resolution images and to validate satellite-derived data. One such sensor is LiDAR (Light Detection and Ranging) technology, which provides 3D models of croplands (Gago et al., 2015). LiDAR technology can provide accurate maps for farmlands in crop monitoring (Rosell and Sanz, 2012; Lin, 2015). However, the cost-benefit of using LiDAR for smallholder farmer settings needs to be evaluated to determine the feasibility of such investments (Escolà et al., 2017b).
Conclusion
Remote sensing technology has a great potential to timely provide national statistics on the area under wheat for the winter season. This study has demonstrated that Sentinel-2 NDVI data is a powerful and valuable tool to identify and map winter wheat fields and can be used at a national scale to calculate wheat acreage. NDVI time series analysis proved to be a tool that can effectively monitor wheat crop growth. A deeper analysis will make these tools relevant in the decision making on food security issues. In order to strengthen monitoring and evaluation of crops in Zimbabwe, integrating the use of GIS and remote sensing technology should be prioritized, especially for the winter wheat crop. Results from remote sensing should be validated with ground-truthed information to increase the confidence of decision-makers in adopting the use of remote sensing in wheat production monitoring in Zimbabwe.
Author's Note
This study is dedicated to one of the coauthors Dr. Ezekia Svotwa who succumbed to COVID-19 after this article was accepted.
Data Availability Statement
The raw data supporting the conclusions of this article will be made available by the authors, without undue reservation.
Author Contributions
All authors listed have made a substantial, direct and intellectual contribution to the work, and approved it for publication.
Conflict of Interest
The authors declare that the research was conducted in the absence of any commercial or financial relationships that could be construed as a potential conflict of interest.
Publisher's Note
All claims expressed in this article are solely those of the authors and do not necessarily represent those of their affiliated organizations, or those of the publisher, the editors and the reviewers. Any product that may be evaluated in this article, or claim that may be made by its manufacturer, is not guaranteed or endorsed by the publisher.
Acknowledgments
We acknowledge the services of the SIRDC team led by Dr. K. Murwira for training the AGRITEX officers on GPS technology. We thank SIRDC also for giving us most of the satellite imagery used for this research.
Supplementary Material
The Supplementary Material for this article can be found online at: https://www.frontiersin.org/articles/10.3389/fclim.2021.715837/full#supplementary-material
References
Adão, T., Hruška, J., Pádua, L., Bessa, J., Peres, E., Morais, R., et al. (2017). Hyperspectral imaging: a review on UAV-based sensors, data processing and applications for agriculture and forestry. Remote Sens. 9:1110. doi: 10.3390/rs9111110
Araújo, M. B., and Peterson, A. T. (2012). Uses and misuses of bioclimatic envelope modeling. Ecology 93, 1527–1539. doi: 10.1890/11-1930.1
Atkinson, P. M., Jeganathan, C., Dash, J., and Atzberger, C. (2012). Inter-comparison of four models for smoothing satellite sensor time-series data to estimate vegetation phenology. Remote Sens. Environ. 123, 400–417. doi: 10.1016/j.rse.2012.04.001
Chawarika, A. (2016). An assessment of the critical constraints to wheat production in Zimbabwe. Bus. Soc. Sci. 1, 33–48. doi: 10.26831/BSSJ.2016.1.1.33-48
CIAT; World Bank. (2017). Climate-Smart Agriculture in Zimbabwe. Washington, DC: CSA Ctry. Profiles Africa Ser. Int. Cent. Trop. Agric. (CIAT), 24.
do Amaral, L. R., Zerbato, C., de Freitas, R. G., Júnior, M. R. B., and da Silva Simões, I. O. P. (2020). UAV applications in Agriculture 4.0. Rev. Cienc. Agron. 51. doi: 10.5935/1806-6690.20200091
Escolà, A., Badia, N., Arnó, J., and Martínez-Casasnovas, J. A. (2017a). Using Sentinel-2 images to implement Precision Agriculture techniques in large arable fields: First results of a case study. Adv. Anim. Biosci. 8, 377–382. doi: 10.1017/S2040470017000784
Escolà, A., Martínez-Casasnovas, J. A., Rufat, J., Arnó, J, Arbonés, A., Sebé, F., et al. (2017b). Mobile terrestrial laser scanner applications in precision fruticulture/horticulture and tools to extract information from canopy point clouds. Precis. Agric. 18, 111–132. doi: 10.1007/s11119-016-9474-5
Filippa, G., Cremonese, E., Galvagno, M., Migliavacca, M., Sonnentag, O., Humphreys, E., et al. (2018). NDVI derived from IR-enabled digital cameras: applicability across different plant functional types. Agric. Forest Meteorol. 249, 275–285. doi: 10.1016/j.agrformet.2017.11.003
Franch, B., Vermote, E. F., Skakun, S., Roger, J. C., Becker-Reshef, I., et al. (2019). Remote sensing based yield monitoring: application to winter wheat in United States and Ukraine. Int. J. Appl. Earth Obs. Geoinf. 76:112–127. doi: 10.1016/j.jag.2018.11.012
Gago, J., Douthe, C., Coopman, R. E., Gallego, P. P., Ribas-Carbo, M., Flexas, J., et al. (2015). UAVs challenge to assess water stress for sustainable agriculture. Agric. Water Manag. 153, 9–19. doi: 10.1016/j.agwat.2015.01.020
Hill, M. J. (2013). Vegetation index suites as indicators of vegetation state in grassland and savanna: an analysis with simulated SENTINEL 2 data for a North American transect. Remote Sens. Environ. 137, 94–111. doi: 10.1016/j.rse.2013.06.004
Huang, X., Liu, J., Zhu, W., Atzberger, C., and Liu, Q. (2019). The optimal threshold and vegetation index time series for retrieving crop phenology based on a modified dynamic threshold method. Remote Sens. 11:2725. doi: 10.3390/rs11232725
Igrejas, G., and Branlard, G. (2020). “The importance of wheat,” in Wheat Quality for Improving Processing and Human Health. eds G. Igrejas, T. Ikeda, and C. Guzmán (Cham: Springer). doi: 10.1007/978-3-030-34163-3_1
Isbaex, C., and Margarida Coelho, A. (2021). “The potential of sentinel-2 satellite images for land-cover/land-use and forest biomass estimation: a review,” in Forest Biomass - From Trees to Energy. doi: 10.5772/intechopen.93363
Jiménez-Valverde, A. (2012). Insights into the area under the receiver operating characteristic curve (AUC) as a discrimination measure in species distribution modelling. Glob. Ecol. Biogeogr. 21, 498–507. doi: 10.1111/j.1466-8238.2011.00683.x
Lin, Y. (2015). LiDAR: an important tool for next-generation phenotyping technology of high potential for plant phenomics? Comput. Electron. Agric. 119, 61–73. doi: 10.1016/j.compag.2015.10.011
Merow, C., Smith, M. J., and Silander, J. A. (2013). A practical guide to MaxEnt for modeling species' distributions: what it does, and why inputs and settings matter. Ecography 36, 1058–1069. doi: 10.1111/j.1600-0587.2013.07872.x
Musemwa, L., and Mushunje, A. (2012). Factors affecting yields of field crops and land utilisation amongst land reform beneficiaries of Mashonaland Central Province in Zimbabwe. J. Dev. Agric. Econ. 4, 109–118. doi: 10.5897/JDAE12.002
Mutambara, J., Zvinavashe, A. P., and Mwakiwa, E. (2013). A critical review of the wheat industry in Zimbabwe. Glob. J. Biol. Agric. Heal. Sci. 2, 23–33.
Ouzemou, J. E., El Harti, A., Lhissou, R., El Moujahid, A., Bouch, N., Ouazzani, R. E., et al. (2018). Crop type mapping from pansharpened Landsat 8 NDVI data: a case of a highly fragmented and intensive agricultural system. Remote Sens. Appl. Soc. Environ. 11, 94–103. doi: 10.1016/j.rsase.2018.05.002
Qiao, H. B., and Cheng, D. F. (2009). “Application of EOS/MODIS-NDVI at different time sequences on monitoring winter wheat acreage in Henan province,” in 2009 International Conference on Environmental Science and Information Application Technology, Vol. 2 (Wuhan: IEEE), 113–115. doi: 10.1109/ESIAT.2009.159
Rafezall, C. M., Darwin, N., Ariff, M. F. M., and Majid, Z. (2020). “Detection of palm oil health through multispectral UAV platform,” in IEEE 10th International Conference on System Engineering and Technology (ICSET) (Shah Alam: IEEE). doi: 10.1109/ICSET51301.2020.9265374
Rosell, J. R., and Sanz, R. (2012). A review of methods and applications of the geometric characterization of tree crops in agricultural activities. Comput. Electron. Agric. 81, 124–141. doi: 10.1016/j.compag.2011.09.007
Senay, S. D., and Worner, S. P. (2019). Multi-scenario species distribution modeling. Insects 10:65. doi: 10.3390/insects10030065
Shiferaw, B., Smale, M., Braun, H.-J., Duveiller, E., Reynolds, M., and Muricho, G. (2013). Crops that feed the world 10. Past successes and future challenges to the role played by wheat in global food security. Food Security 5, 291–317. doi: 10.1007/s12571-013-0263-y
Stuhlmacher, M. (2011). Normalized Difference Vegetation Index (NDVI) derived from 2015 National Agriculture Imagery Program (NAIP) data for the central Arizona region. Environ. Data Initiat.
Suárez, P. L., Sappa, A. D., Vintimilla, B. X., and Hammoud, R. I. (2019). “Image vegetation index through a cycle generative adversarial network,” in IEEE 2019 IEEE/CVF Conference on Computer Vision and Pattern Recognition Workshops (CVPRW) - Long Beach, 1014–1021. doi: 10.1109/CVPRW.2019.00133
Vajsová, B., Fasbender, D., Wirnhardt, C., Lemajic, S., and Devos, W. (2020). Assessing spatial limits of Sentinel-2 data on arable crops in the context of checks by monitoring. Remote Sens. 12:2195. doi: 10.3390/rs12142195
Wang, Y., Xu, X., Huang, L., Yang, G., Fan, L., Wei, P., et al. (2019). An improved CASA model for estimating winter wheat yield from remote sensing images. Remote Sens. 11:1088. doi: 10.3390/rs11091088
You, X., Meng, J., Zhang, M., and Dong, T. (2013). Remote sensing based detection of crop phenology for agricultural zones in China using a new threshold method. Remote Sens. 5, 3190–3211. doi: 10.3390/rs5073190
Zeng, L., Wardlow, B. D., Xiang, D., Hu, S., and Li, D. (2020). A review of vegetation phenological metrics extraction using time-series, multispectral satellite data. Remote Sens. Environ. 237:111511. doi: 10.1016/j.rse.2019.111511
Keywords: food security, grain yield, GIS, remote sensing, Zimbabwe
Citation: Mashonganyika F, Mugiyo H, Svotwa E and Kutywayo D (2021) Mapping of Winter Wheat Using Sentinel-2 NDVI Data. A Case of Mashonaland Central Province in Zimbabwe. Front. Clim. 3:715837. doi: 10.3389/fclim.2021.715837
Received: 27 May 2021; Accepted: 01 October 2021;
Published: 11 November 2021.
Edited by:
Tamuka Magadzire, University of California Santa Barbara, United StatesReviewed by:
Terence Mushore, University of Zimbabwe, ZimbabweUğur Avdan, Eskisehir Technical University, Turkey
Ferdinando Urbano, Joint Research Centre, Italy
Copyright © 2021 Mashonganyika, Mugiyo, Svotwa and Kutywayo. This is an open-access article distributed under the terms of the Creative Commons Attribution License (CC BY). The use, distribution or reproduction in other forums is permitted, provided the original author(s) and the copyright owner(s) are credited and that the original publication in this journal is cited, in accordance with accepted academic practice. No use, distribution or reproduction is permitted which does not comply with these terms.
*Correspondence: Hillary Mugiyo, bXVnaXlvaEBnbWFpbC5jb20=
†Deceased