 Philbert Modest Luhunga
 Alexander Elias Songoro
- 1Department of Knowledge Management, Tanzania Commission for Science and Technology, Dar es Salaam, Tanzania
- 2Department of Geography and Economics, University of Dar es Salaam, Dar es Salaam, Tanzania
The understanding of climate change impacts and the associated climate extreme events at regional and local scales is of critical importance for planning and development of feasible adaptation strategies. In this paper, we present an analysis of climate change and extreme climate events in the Lake Victoria region of Tanzania, focusing on the Kagera and Geita regions. We use daily simulated climate variables (rainfall and minimum and maximum temperatures) from the Coordinated Regional Climate Downscaling Experiment Program Regional Climate Models (CORDEX_RCMs) for the analysis. Extreme climate event, rainfall, and minimum and maximum temperatures time series during historical (1971–2000) climate condition are compared to future climate projection (2011–2100) under two Representative Concentration Pathway (RCP): RCP 4.5 and RCP 8.5 emission scenarios. The existence, magnitude, and statistical significance of potential trends in climate data time series are estimated using the Mann–Kendall (MK) non-parametric test and Theil-SEN slope estimator methods. Results show that during historical (1971–2000) climate, the Lake Victoria region of Tanzania experienced a statistically significant increasing trend in temperature. The annual minimum and maximum temperatures in the Kagera and Geita regions have increased by 0.54–0.69°C, and 0.51–0.69°C, respectively. The numbers of warm days (TX90p) and warm nights (TN90p) during the historical climate have increased, while the numbers of cold days (TX10p) and cold nights (TN10p) have decreased significantly. However, in future climate condition (2011–2100) under both RCP 4.5 and RCP 8.5 emission scenarios, the Lake Victoria region is likely to experience increased temperatures and rainfall. The frequency of cold events (cold days and cold nights) is likely to decrease, while the frequency of warm events (warm days and warm nights) is likely to increase significantly. The number of consecutive wet days, the intensity of very wet days, and the number of extreme wet days are likely to increase. These results indicate that in future climate condition, socioeconomic livelihoods of people in the Kagera and Geita regions are likely to experience significant challenges from climate-related stresses. It is, therefore, recommended that appropriate planning and effective adaptation policies are in place for disaster risk prevention.
Introduction
The Intergovernmental Panel on Climate Change (IPCC) assessment reports indicate that it is very likely that climate change has influenced the increase of the frequency and intensity of extreme weather and climate events (IPCC, 2007, 2013). The projections for the future from the climate models indicate further increases in the frequency and intensity of extreme weather and climate events that relate to temperature and rainfall (Kundzewicz, 2016). These events have damaged residential, commercial, and government/municipal buildings and caused destruction of material assets within the building and destruction of public infrastructures (roads and bridges) (NCEI, 2017). Moreover, extreme weather and climate events are projected to damage many socioeconomic sectors such as water, health, transport, agriculture, and food security in different regions of the globe, particularly in developing countries (Sarker et al., 2012; IPCC, 2013; Curtis et al., 2017).
For instance, it is projected that due to climate change, millions of people in Africa are likely to face increased water stress (IPCC, 2013), and in some African countries, yields from rain-fed agriculture could decline (FAO, 2017; Benjamin et al., 2020). Agriculture production and access to food in many African countries will be severely impacted. This could affect all dimensions of food security and exacerbate malnutrition.
In East African countries, climate change has already affected weather patterns and hydrological cycles. Several studies over East Africa region indicated that temperatures have increased, rainfall in particular, the long rains that are historically considered important for agriculture activities in the region have declined by later onset and earlier cessation (Wainwright et al., 2019; Borhara et al., 2020), the frequency and intensity of extreme weather events such as persistent drought and floods have increased (Kijazi and Reason, 2009a,b; Chang'a et al., 2017; Nicholson, 2017), the unpredictability of rainfall seasons has increased, and sea rise and coastal erosion have been noticed over many coastal regions (Tumbo et al., 2010; Liwenga et al., 2014; Mubaya et al., 2014). These events have affected water availability, food security, human health, and other socioeconomic livelihoods (Opiyo et al., 2014).
Tanzania as one of the East African countries faces greater challenges both in proneness to significant impacts of climate change and the ability to address the impacts (URT, 2007, 2012; Kijazi et al., 2019). The country's economy heavily depends on rain-fed agriculture, which is sensitive and mostly affected by increasing erratic climate change and variability (Ehrhart and Twena, 2006; Enfors and Gordon, 2008; Müller et al., 2011). The main crops that are grown in Tanzania include maize, cassava, millet, bananas, sweet potatoes, cotton, coffee, and sorghum, which have been reported to decline in productivity due to climate change and variability (URT, 2008; Munishi et al., 2010; Rowhani et al., 2011; Kangalawe, 2012). A recent study by Luhunga (2017) examined the impact of inter-seasonal variability of maize production in the Wami-Ruvu Basin of Tanzania and found that rainfall, maximum temperature, and solar radiation are the most important climate variables that determine inter-seasonal variation in maize yields.
The future climate projections of Tanzania are likely to present several challenges to the agriculture sector. For instance, the projected increase in temperatures in many regions as indicated by Luhunga et al. (2018) are likely to influence wilting and drying of plants and multiplication of pest, weeds, and diseases that would result in increased costs of crop production and failure in crop yields. Also, warmer temperatures are likely to cause an eruption of new pests, parasites, and diseases that would affect the agriculture sector severely. The trends of increased frequency of very wet days and extreme wet days, as was found by Chang'a et al. (2017), are likely to influence nutrient leaching, washing away of topsoil, waterlogging, pests, disease outbreaks, and infrastructure damage that would result into low crop yields and disruptions of the food supply chain.
The only approach toward devising actionable adaptation and mitigation strategies to the impacts of climate change is through conducting robust climate analysis to characterize and understand the historical and future climate conditions.
This requires a detailed analysis to characterize the whole spectrums of inherent natural variability of the climate system, including extreme climate events that are of interest for economists and investors (Christensen and Christensen, 2003). Moreover, climate analysis at a higher temporal and spatial resolution is required to provide evidence that would properly guide the formulation of adaptation and mitigation strategies. This paper provides a detailed analysis of climate change in the Lake Victoria region of Tanzania focusing on two regions: Kagera and Geita regions. These regions have complex spatial and temporal climate patterns largely modulated by the presence of Lake Victoria. This has made the government of Tanzania identify Kagera and Geita as priority areas for addressing the vulnerability from the impacts of climate change in Tanzania.
Data and Methodology
Study Region
The study areas are the Kagera and Geita regions located in the northwestern part of the Lake Victoria region of Tanzania (Figure 1). These regions are experiencing significant climate-related stresses such that the government of Tanzania through Food and Agriculture Organization (FAO) Tanzania is developing a funding project proposal titled “Enhancing Climate Change Resilience in Kagera and Geita regions of Tanzania.” The developed project proposal will be submitted to access about USD 30 million from the Green Climate Fund as a grant to promote Climate-Smart Agriculture (CSA) practices and other forms of Agro-based innovations for adaptation benefits and mitigation contributions, support sustainable ecosystem management to ensure the flow of ecosystem goods and services for adaptation and mitigation, promote diversification of communities' livelihood in the context of the changing climate, and support Agro-meteorological infrastructure and services for climate resilience.
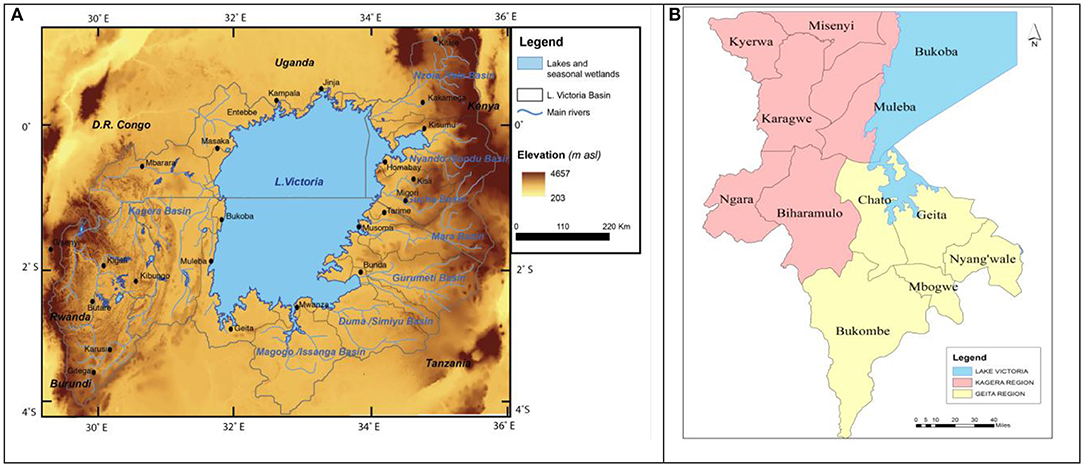
Figure 1. The topographical map of the Lake Victoria region (A) adopted from Olaka et al. (2019) and (B) in the Kagera and Geita regions in the western parts of the Lake Victoria region of Tanzania.
The Kagera and Geita regions experience bimodal rainfall patterns (Figure 2). This rainfall pattern is controlled by the movement of the Intertropical Convergence Zone (ITCZ), which moves southward in October and reaches the southern parts of the country in January or February and reverses northward in March, April, and May. This movement makes the Kagera and Geita regions receive two distinct seasonal rainfalls—the short rainfall season that starts in October and continues through December (OND) and the long rainfall season that starts in March and continues through May (MAM) (Agrawala et al., 2003; Luhunga et al., 2016).
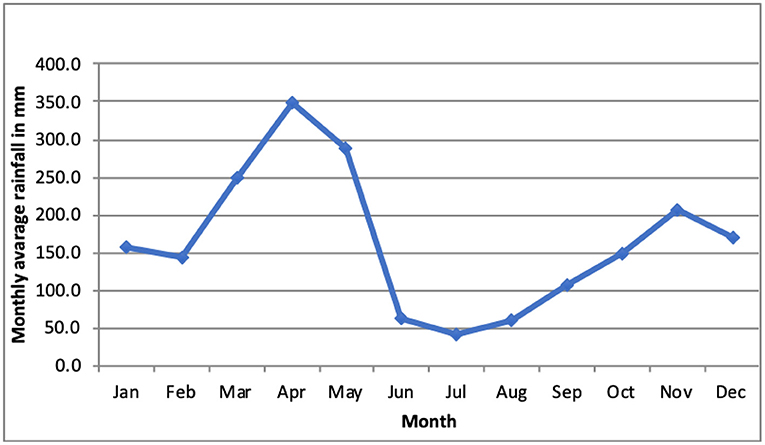
Figure 2. Long-term (1971–2000) observed annual cycle of rainfall in Bukoba, a district of the Kagera region.
Data
Model Data
Tanzania has very few weather stations (28-synoptic weather stations) that are sparsely distributed over complex topographical terrain. Many places, especially in the Kagera and Geita regions, have no weather stations to monitor weather and climate patterns.
The only synoptic weather station that is used to monitor weather patterns in the Geita region is located at Mwanza region that is about 124–125 km apart. On the other hand, the Kagera region has one synoptic weather station that is located in Bukoba district. This station has long-term climate data series. These climate data series, however, have been impacted adversely with inhomogeneity caused by the change of instruments due to their damage or failure and change of land use cover surrounding the weather station in Bukoba.
To overcome the problem of data availability, especially over areas with a limited number of weather stations, Luhunga et al. (2016) evaluated the possibility of using climate simulation from the Coordinated Regional Climate Downscaling Experiment program Regional Climate Models (CORDEX-RCMs) to represent the climate condition of Tanzania. They found that CORDEX-RCMs perform better to represent observed historical climate conditions in many regions and therefore can supplement observation in areas that have no weather stations. In this paper, we use climate simulations from five high-resolution RCMs listed in (Table 1) to analyze climate change over the Kagera and Geita regions. The data are obtained from https://esgf-data.dkrz.de/projects/esgf-dkrz/ and are quality controlled and can be used to the terms of use (http://wcrp-cordex.ipsl.jussieu.fr/).
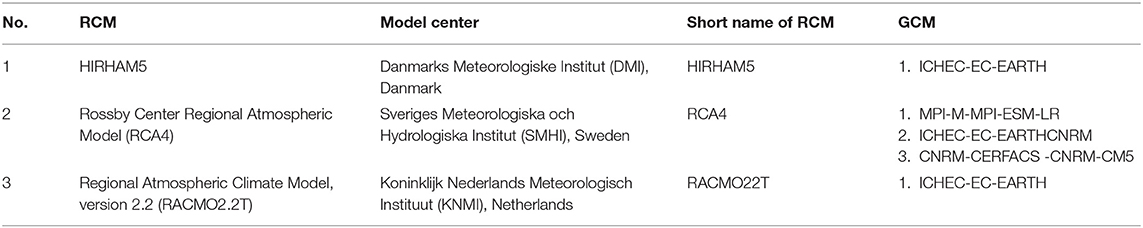
Table 1. The Coordinated Regional Climate Downscaling Experiment (CORDEX)–Regional Climate Models (RCMs) and their driving General Circulation Models (GCMs).
The RCMs indicated in Table 1 run at a spatial resolution of latitude 0.44° and longitude 0.44°. To obtain climate variables at specific regions or districts, a statistical downscaling approach using the inverse distance weighted average interpolation techniques was used to obtain climate simulation for relevant regions or districts especially when multiple districts are found inside one grid point of the RCMs (Hartkamp et al., 1999; Ly et al., 2013; Luhunga et al., 2016). The outputs from the RCMs for the reference period (1971–2000) and future climate projections (2011–2100) under two Representative Concentration Pathway (RCP) RCP 4.5 and RCP 8.5 emission scenarios are used for the analysis.
Methodology
In this paper, climate change has been analyzed by detecting the trend and significance of the trend in climate variables (rainfall and minimum and maximum temperatures) time series. SEN slope estimator method has been used to compute the gradient of the trends in climate data series. For detailed description on how the SEN slope method is used to compute the gradient of the trend in climate variables, the reader may consult Van Beusekom et al. (2015) and Byakatonda et al. (2018). Descriptive statistics such as moving average, standard deviation, and coefficient of variation (CV) are used to discern the change in climate variables.
Future (2011–2100) projections of climate variables (rainfall and minimum and maximum temperatures) are compared with climate variables in the reference period (1971–2000). The comparison is based on determining the departure of future climate during the present (2011–2040), mid (2041–2070), and end (2071–2100) centuries from climate condition in the reference period (1971–2000). The extreme climate indices are computed using RClimDex software. For detailed description on the computation of extreme climate indices using RClimDex, the reader may consult Zhang and Yang (2004) and Zhang et al. (2005). The RClimDex software is highly recommended by the World Meteorological Organization (WMO) to be used in computation of climate indices that are used to characterize climate extremes over different regions. The RClimDex software is used widely in computations of extreme climate indices using outputs from climate models, for instance, Gujree et al. (2017) have used outputs from RCM as input into RClimDex to compute 27 climate extreme indices in the Kashmir Valley of India, and Saddique et al. (2020) have used outputs from the General Circulation Models (GCMs) as inputs into RClimDex for computation of extreme climate indices in the Jhelum River Basin of India. In this study, RClimDex software is used to compute 17 climate indices recommended by the Expert Team on Climate Change Detection and Indices (ETCCDI) to characterize climate extremes over the Lake Victoria region. The computed indices presented in this study are percentile-based indices that relate to either temperature or rainfall. Percentile indices that relate to temperature include the occurrence of cold nights (TNp10), occurrence of warm nights (TNp90), occurrence cold days (TXp10), and occurrence of warm days (TXp90). The percentile indices that relate to rainfall are very wet days [which represent the amount of rainfall falling above the 95th (R95p)] and extreme wet days [which represent the amount of rainfall falling above 99th (R99p)].
Other indices that have been calculated include the absolute based indices that represent the minimum or maximum values of climate variables within a season or year. These indices include the maximum daily maximum temperature (TXx) and the maximum daily minimum temperature (TNx), the minimum daily maximum temperature (TXn) and the minimum daily minimum temperature (TNn), and the maximum 1-day precipitation amount (RX1day) and the maximum 5-days precipitation amount (RX5day). Furthermore, we have computed duration indices that include the Warm Spell Duration Index (WSDI); the number of Consecutive Dry Days (CDD) index, which is the length of the longest dry spell in a year; and the number of Consecutive Wet Days (CWD) index, which is defined as the longest wet spell in a year. The future changes in extreme climate events indices are analyzed by calculating the difference between extreme climatic events indices in present (2011–2040), mid (2041–2070), and end (2071–2100) centuries under two emission scenarios (RCP 4.5 and RCP 8.5) relative to the baseline period (1971–2000).
It should be noted that the use of the output from an individual climate model to analyze climate change over a particular region or location is subject to several uncertainties that arise from either the driving GCM or RCM (Northrop and Chandler, 2014; Qian et al., 2016; Luhunga et al., 2018). These uncertainties are overcome through the use of outputs from the multi-model ensemble average in the analysis. In this study, we constructed the ensemble average using five RCMs (RACMO22T and HIRHAM5 both driven by ICHEC-EC-EARTH, RCA4 driven by three GCMs: MPI-M-MPI-ESM-LR, CNRM-CERFACS-CNRM-CM5, and ICHEC-EC-EARTH) (Table 1) and used their outputs for climate change analysis.
Results and Discussion
The results on climate change and extreme climate events in the Lake Victoria region of Tanzania are presented and analyzed here in two subsections. The first subsection presents the analysis of climate condition and extreme climate events in the Lake Victoria region during the historical (1971–2000) climate condition, while the second subsection presents an analysis of climate condition and extreme climate events during the present (2011–2040), mid (2041–2070), and end (2071–2100) under two RCP (RCP 4.5 and RCP 8.5) emission scenarios. The data used for the analysis were obtained from ensemble average of five RCMs used in the CORDEX. These models were evaluated on their ability to reproduce the historical climate condition over different regions in Tanzania and found reasonable model skill, suggesting their potential use in representing the climate condition in different regions of Tanzania (Luhunga et al., 2016). However, it is important to mention here that although the outputs from RCMs are used in this study or have been used in other previous studies (Tölle et al., 2018; Almazroui, 2019), their results should be interpreted to account for the inability of the models to represent small-scale processes that play a role in modulating the intensity and magnitude of extreme climate events.
Analysis of Historical (1971–2000) Climate Condition and Extreme Climate Events in the Lake Victoria Region
Analysis of Annual Cycle of Rainfall and Minimum and Maximum Temperatures
All districts in the Geita and Kagera regions receive a bimodal type of rainfall, with two peaks of rainfall, a primary maximum is in April and a secondary maximum is in November. The short rainy season starts from October and ends in December, while the long rainy season starts from March and continues through May. The long rainy season (MAM) in both regions (Geita and Kagera) ranges from 151.56 to 314.52 mm, while the short rainy season (OND) ranges from 39.42 to 182.83 mm. The driest months in the Geita and Kagera regions start from June and continue through September (Figure 3A).
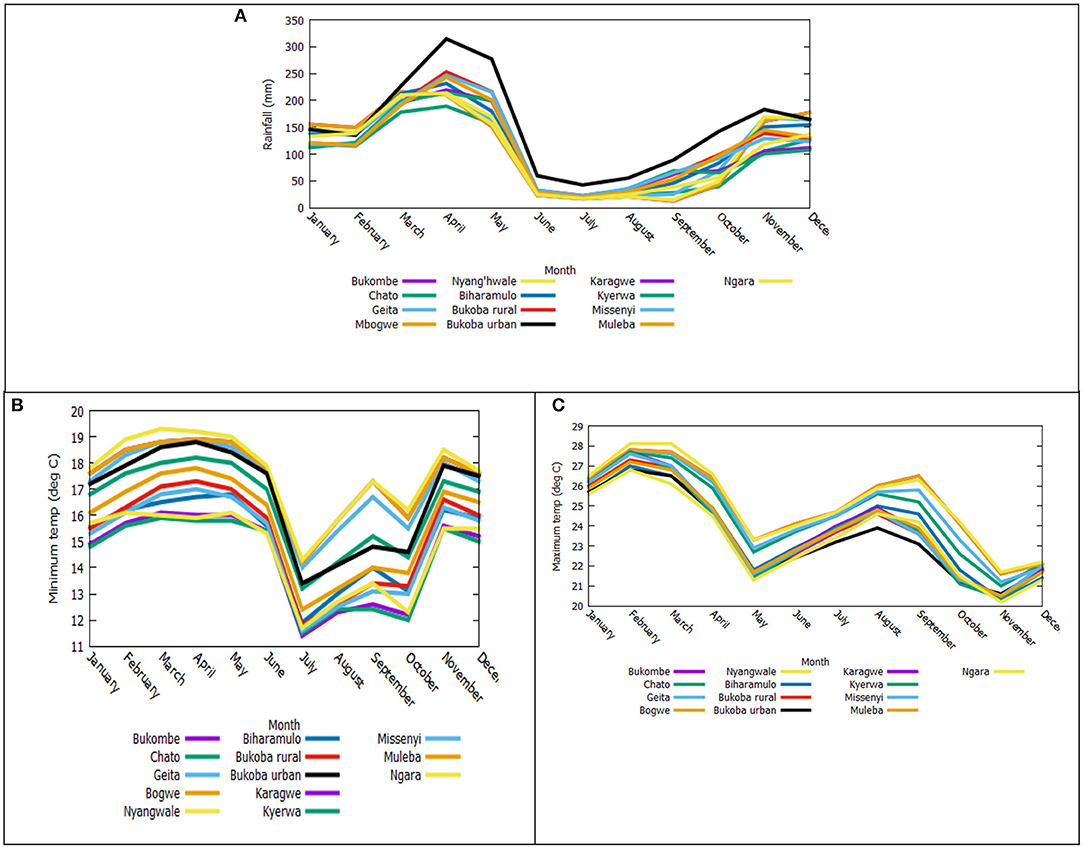
Figure 3. The annual cycle of rainfall and minimum and maximum temperatures in the Kagera and Geita regions during the historical climate (1971–2000). (A) Rainfall. (B) Minimum temperature. (C) Maximum temperature.
In the historical (1971–2000) climate condition, the analysis of seasonal rainfall in the Geita and Kagera regions revealed a decreasing trend of rainfall. For instance, rainfall in the long rainy season exhibited a non-statistically significant decreasing trend of 2.46 mm (in March) with the trend of −0.082 mm/year to 22.08 mm (in April) with the trend of −0.736 mm/year (Table 2). However, an increasing trend of rainfall is observed in May (Table 2). This has been observed in both regions (Geita and Kagera). In the short rainy season, in October, rainfall in two districts (Bukombe and Mbogwe) exhibited a statistically significant decreasing trend of −1.163 mm/year and −1.164 mm/year, respectively (Table 2). In December, however, all districts in the Geita region except Chato exhibited a non-statistically significant decreasing trend of rainfall in the range of −0.33 mm/year to −0.520 mm/year. It is interesting to note that statistically significant increasing trends in rainfall are observed in most districts during June. This is an indication that rainfall season during March, April, and May (MAM) is shifting toward June. This indeed has been observed in Bukombe, Mbogwe, Bukoba rural, Karagwe, Kyerwa, Missenyi, and Muleba districts, where statistically significant increasing trends in rainfall during June were observed. In general, seasonal rainfall in both MAM and OND seasons showed a decreasing trend in both the Geita and Kagera regions. However, it is important to note that for most parts in the Kagera and Geita regions, the trends in rainfall are not significant.
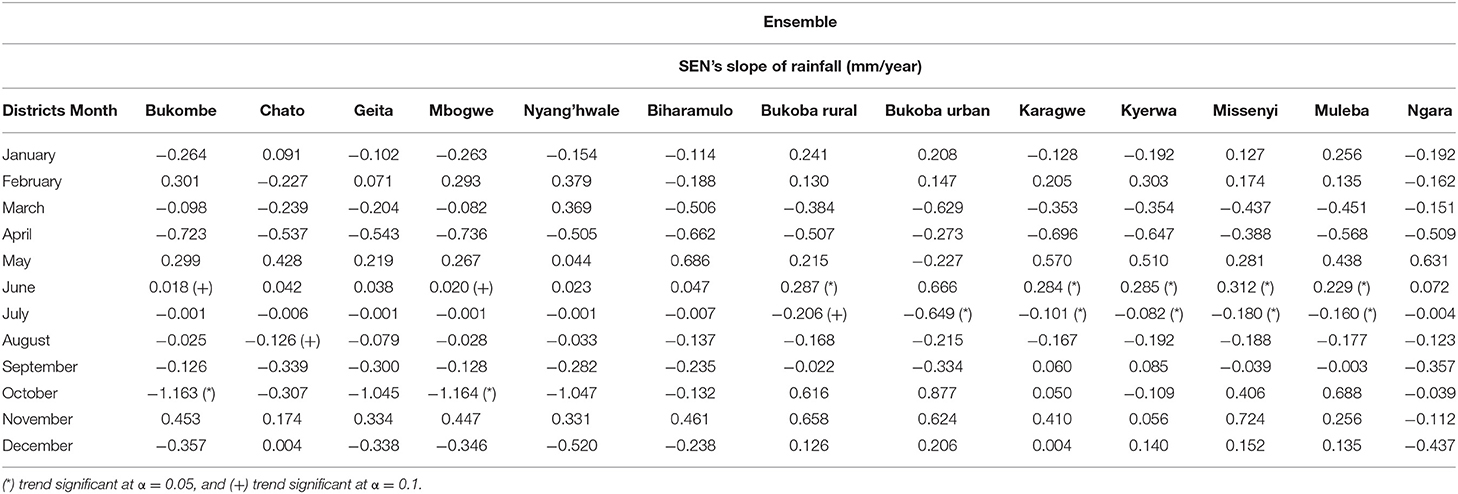
Table 2. The gradient of the annual cycles of rainfall during the historical climate condition (1971–2000).
All districts in the Geita region have seasonal minimum temperature in the range of 14.38°C to 18.45°C and the maximum temperature in the range of 23.25°C to 28.48°C (Figures 3B,C), while all districts in the Kagera region have seasonal minimum temperature in the range of 12.32–16.41°C and the maximum temperature in the range of 22.51–27.61°C (Figures 3B,C). The monthly minimum temperature in the Geita region exhibited a statistically significant increasing trend from January to April ranging from 0.01°C (in April) to 0.59°C (in March). These significant increases in temperature could affect agriculture activities in Geita, as an increase in temperature reduces grain yield in rice, wheat, and groundnut (Kaur and Hundal, 2010). Furthermore, Luhunga (2017) indicated that an increase in temperature shortens the length of growing season of maize crops (Zea mays). Statistically significant increased trends in minimum temperature in the range of 0.02–1.03°C/year are observed in the Geita region from September to December. It should be noted that both rainfall seasons (MAM and OND) minimum and maximum temperatures have increased significantly during the historical climate. These increasing trends in seasonal minimum and maximum temperatures are observed mainly in long-term rainfall season (MAM) as well as in short-term rainfall season (OND) (see Table 3 for minimum temperature). This increase in temperature in the main rainfall season could have impacts in agriculture, as higher temperatures reduce the length of the growing season of many crops (Kaur and Hundal, 2010; Luhunga, 2017; Luhunga et al., 2016). Moreover, the observed significant increase in temperature could influence the multiplication and eruption of new crop diseases, for instance, Velásquez et al. (2018) indicated that an increase in temperature increases the incidence of plant diseases such as rice bacterial and sheath blight, increases the incidence of leaf spot and rhizomania that affect the production of sugar beet, and increases sugarcane infection by the Colletotrichum falcatum. It should be noted that the statistically significant increased gradients in minimum and maximum temperatures in the Kagera and Geita regions are the evidence of climate change over those regions, since the main signal of climate change is an increasing trend in temperatures at local, regional, and global levels (Chang'a et al., 2017; Osima et al., 2018).
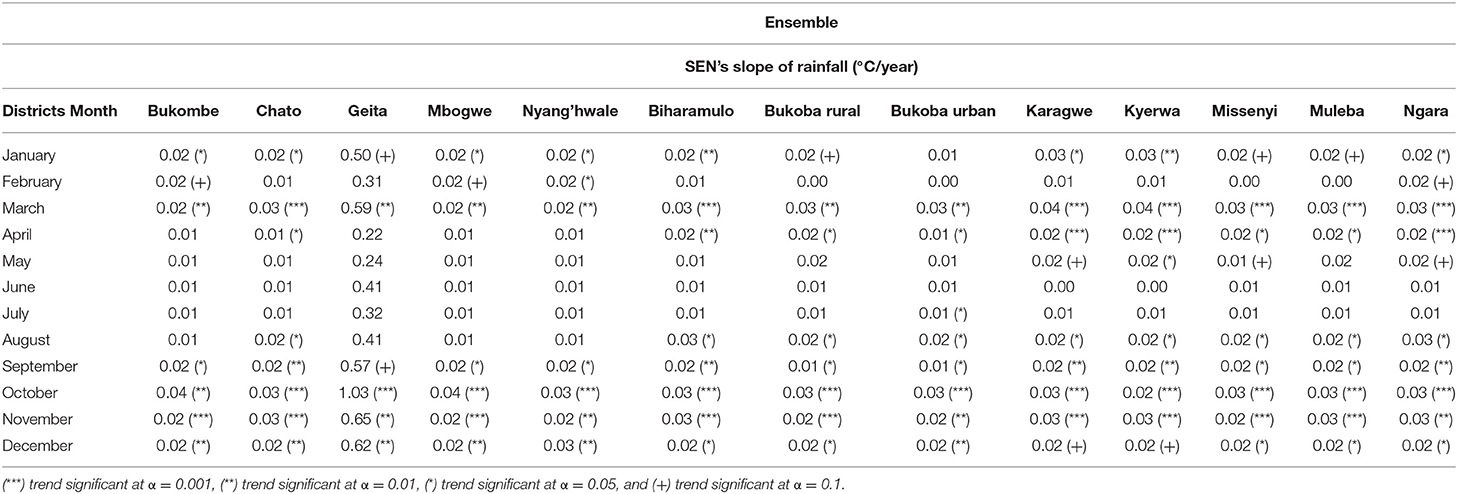
Table 3. The gradient of the annual cycles of minimum temperature during the historical climate condition (1971–2000).
Analysis of the Interannual Variation of Rainfall and Minimum and Maximum Temperatures
Table 4 indicates the annual total of rainfall and annual mean minimum and maximum temperatures in the Kagera and Geita regions during the historical climate (1971–2000). This table indicates that the annual minimum temperature in the Kagera and Geita regions ranges from 13.8°C (in Karagwe district) to 17°C (in Nyang'hwale district). While the maximum temperature ranges from 25.1°C (in Bukoba urban) to 26.8°C (in Nyang'hwale district). Annual rainfall total in the Geita and Kagera regions ranges from 626.3 mm (in Geita district) to 839.8 mm (in Bukombe district).
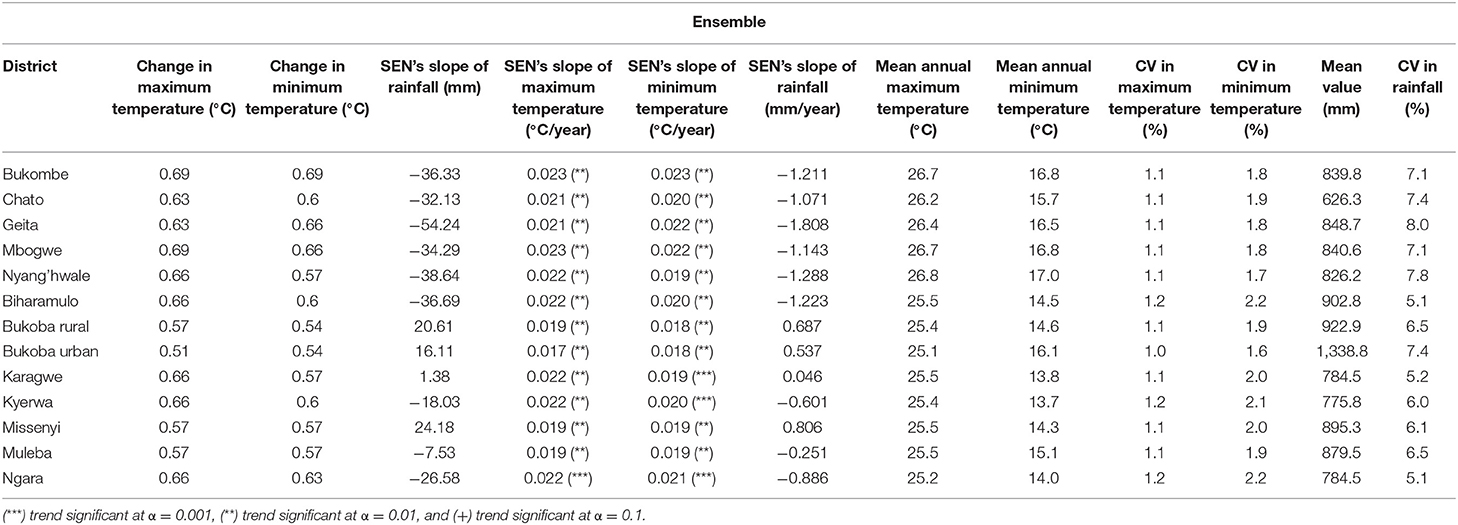
Table 4. Distribution of climate variables [changes in mean rainfall, minimum and maximum temperatures, gradient of change, and their coefficient of variation (CV)] during historical (1971–2000) climate conditions.
To analyze how rainfall and minimum and maximum temperatures are involved during historical (1971–2000), the CV within annual rainfall and minimum and maximum temperature time series was computed (Table 4). Furthermore, time-series graphs and trend analysis were performed (Figures 4A–C). It is found that annual rainfall in most districts of the Kagera and Geita regions has decreased during the historical climate condition (1971–2000) (Figure 4A). Ten out of 13 districts exhibited a nonsignificant decreasing trend in rainfall during the historical climate (Table 4), while three districts (Bukoba rural, Bukoba urban, and Karagwe) have experienced a nonsignificant increasing trend in rainfall during the historical climate condition. In general, the non-statistically significant decreasing trends of rainfall in the Kagera and Geita regions are in agreement with what was reported by Luhunga et al. (2016) that rainfall in all regions in Tanzania is decreasing with a nonsignificant trend.
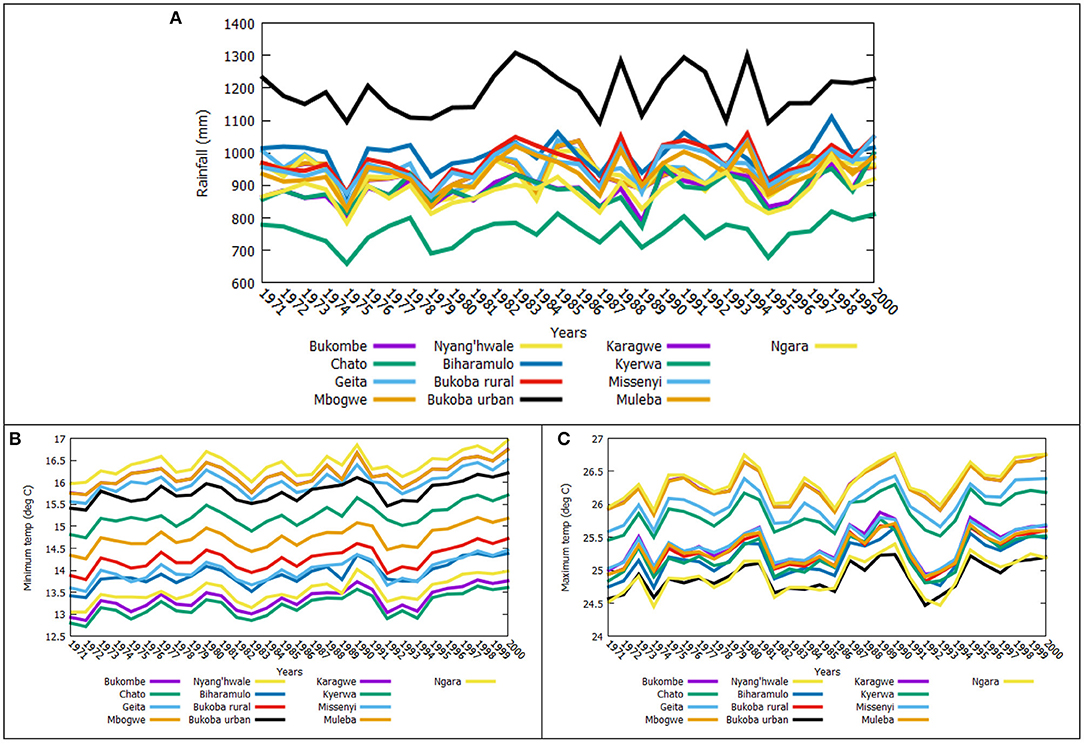
Figure 4. The interannual variation in rainfall and minimum and maximum temperature. (A) Annual rainfall. (B) Annual minimum temperature. (C) Annual maximum temperature.
The analyses of interannual variation in minimum and maximum temperatures indicate that minimum and maximum temperatures have increased significantly in all districts (Table 4). This could be due to the impacts of global climate change. The observed increase in both minimum and maximum temperatures could have adverse impacts on the agriculture sector by increasing the incidences of crop diseases; for instance, Velásquez et al. (2018) indicated that maximum temperature of 35°C and minimum temperature of 27°C are most favorable for Xanthomonas oryzae bacteria to colonize rice, temperatures between 26 and 31°C are ideal for papaya ringspot virus (PRSV) to infect papaya. Therefore, adaptation strategies need to be put in place to reduce the impacts, especially to temperature-sensitive crops.
To understand the influence of climate change on interannual variation of climate variables (rainfall and minimum and maximum temperatures) over the Kagera and Geita regions, we examine the CV. The CV of <20% is classified as less variability, 20% < CV < 30% as moderate, CV > 30% as high, CV > 40% as very high, and CV > 70% as extremely high variability. Table 4 indicates the annual rainfall total, annual mean minimum and maximum temperatures, and their respective CV. It can be seen from the table that climate variables (rainfall and minimum and maximum temperatures) over the Kagera and Geita regions are consistent during the historical climate condition (1971–2000). The annual minimum temperatures across districts are more consistent when compared to annual maximum temperatures. Annual rainfall is more variable across the districts when compared to temperatures (Table 4).
To understand the influence of climate change on the trend of climate variables over the Kagera and Geita regions, we examine the gradient of change of rainfall and minimum and maximum temperatures from 1971 to 2000. Table 4 shows the gradient of annual total rainfall, annual mean minimum and maximum temperatures, and their trends calculated from 1971 to 2000 climatological reference period. It is found that all districts in Kagera and Geita are dominated by increasing trends of minimum and maximum temperatures that are statistically significant at 99 and 99.9% confidence limit. From 1971 to 2000, the annual maximum temperature has, however, been increased at 99.99 significance level only at one district (Ngara) out of 13 districts. These results compare with what was reported by Chang'a et al. (2017) that the country has experienced a widespread statistically significant increase in temperature extremes consistent with the global warming pattern. The annual mean minimum temperature during historical climate (1971–2000) has increased at a 99.9% significance level at three districts (Ngara, Kyerwa, and Karagwe) out of the 13 districts. Increasing trends in the minimum and maximum temperature at statistically significant level of 99% are found in 12 districts for annual mean maximum temperature and 10 districts for the annual mean minimum temperature. These results provide very strong to strong evidence that minimum and maximum temperatures in the Kagera and Geita regions are increasing significantly. These increases are associated with the impacts of climate change in the respective regions and districts. In general, during historical climate (1971–2000), minimum temperature has increased, ranging from 0.54°C in both Bukoba urban and Bukoba rural to 0.69°C in Bukombe. While maximum temperature has increased in the range of 0.51°C in Bukoba urban to 0.69°C in Bukombe (Table 4).
Extreme Climate Indices Related to Rainfall and Temperature
One of the impacts of climate change is to increase the intensity, duration, and frequency of extreme climate events. This has contributed to the damage of properties and destruction of the environment and infrastructure in many regions. In agriculture, extreme climate events have contributed to crop failure, decreased crop yields, post-harvest loss, and disruptions of food supply chain especially from point of production (farm) to the marketplace (consumers). Here, the extreme climate indices in the Kagera and Geita regions during the historical climate condition (1971–2000) are analyzed. Table 5 indicates trends in extreme climate indices related to frequency, duration, and intensity.
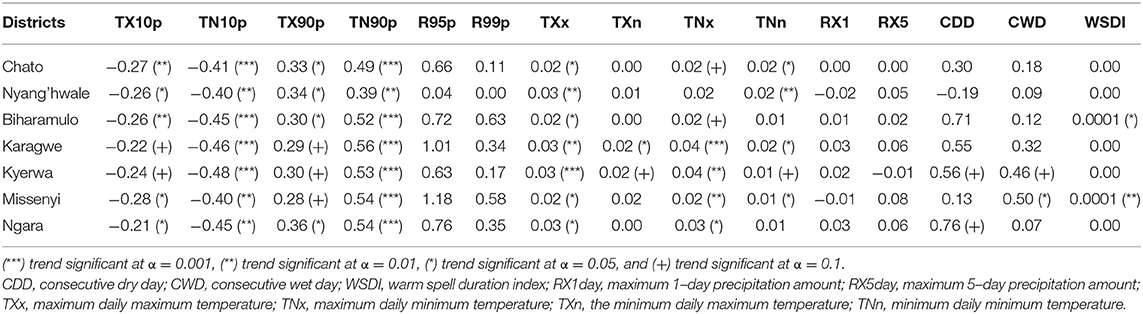
Table 5. Climate extreme indices during the historical climate condition (1971–2000).
It can be seen from Table 5 that all districts experienced a decreasing trend in cold days (TX10p). This implies that during the historical climate, daytime temperatures are becoming warmer and decrease the possibilities of having a day with cool temperatures. The decreased trend in cold days in the Geita and Kagera regions during the historical climate condition ranged from 0.21 days/year to 0.28 days/year. Missenyi district experienced a higher decreasing trend in cold days of 0.28 days/year at 95% significance level. The number of cold nights in the Kagera and Geita regions during historical climate indicates a decreasing trend. Kyerwa experienced the highest decreasing trend in cold nights of 0.48 days/year at 99.99% significance level. It is important to note that the number of cold days and cold nights in the Kagera and Geita regions have decreased at a very high significance level. This is a piece of strong evidence that climate change is taking place over those regions, as the IPCC (2013) concluded that due to climate change, the number of cold days and cold nights will decline in many regions of the world.
The number of warm days (TX90p) during historical (1971–2000) climate condition is presented in Table 5. It can be seen that all districts experienced a statistically increasing trend in warm days (TX90p) in the range of 0.28–0.36 days/year. Ngara experienced the highest increasing trend in warm days during the historical climate condition. The numbers of warm nights (TN90p) have increased significantly in the Kagera and Geita regions. These results are important, first, to discern or prove that climate change is happening in the Kagera and Geita regions and, second, to prepare appropriate adaptation strategies as the increase in daytime and nighttime temperatures would affect crop growth and can influence the development and eruption of new crop diseases.
The numbers of very wet days (R95p) and extreme wet days (R99p) indicate an increasing trend in all districts. These could have impacted by influencing sporadic flooding events in the Kagera and Geita regions. However, it is important to note that the numbers of very wet days and extreme wet days during the historical climate condition are non-statistically significant.
The extreme climate indices related to intensity are presented in Table 5. These indices include the monthly maximum value of daily maximum temperature (TXx), the monthly minimum value of daily maximum temperature (TXn), monthly maximum value of daily minimum temperature (TNx), the monthly minimum value of daily minimum temperature (TNn), maximum 1-day rainfall (RX1day), and maximum 5-day rainfall (RX5day).
Results from the trend analysis (Table 5) revealed that there is an increasing trend of TXx in all districts at the Geita and Kagera regions. Nyang'hwale, Karagwe, Kyerwa, and Ngara showed a positive increase in TXx of 0.03°C/year. This can be translated to an increase of 0.9°C at the end of the year 2000. Chato, Biharamulo, and Missenyi showed a positive increasing trend in TXx of 0.02°C/year. The trend analysis for TXn for two districts (Karagwe and Kyerwa) showed a statistically significant increasing trend of 0.02°C/year. Chato and Biharamulo, however, showed no trend in TXn. Based on the presented results in Table 5, TNx and TNn showed an increasing trend in most districts. The highest significant trend in TNx of 0.04°C/year is observed in Karagwe and Kyerwa. In general, these results indicate that the intensity of extreme temperature has increased significantly in the Geita and Kagera regions. Therefore, the adaptation plan must be put in place to reduce the impact of increased intensity of extreme temperature events. On the other hand, the maximum average 1-day (RX1day) rainfall revealed an increasing trend at four districts, Ngara, Kyerwa, Karagwe, and Biharamulo with 0.03, 0.02, 0.03, and 0.01 mm/year, respectively. This implies that there was an increased intensity of maximum 1-day rainfall in those districts during the historical climate condition. It is interesting to find the trend of maximum 5-days rainfall (RX5day) in all districts except Kyerwa, which showed a decreasing trend in RX5day rainfall of 0.01 mm/year. These results are important in devising adaptation strategies to come with increased intensity of 1-day and 5-days maximum rainfall in the Kagera and Geita regions.
The extreme climate indices related to duration are presented in Table 5. These indices include consecutive dry days (CDDs), consecutive wet days (CWDs), and warm spell duration index (WSDI). The presented results in Table 5 reveal that there was an increasing trend in the duration of CDDs in all districts except Nyang'hwale, which showed a non-statistically significant decreasing trend in CDD of 0.19 days/year. The highest CDD of 0.76 and 0.71 days was observed at Ngara and Biharamulo, respectively. It is important to note that Ngara and Kyerwa observed a statistically significant increasing trend in consecutive dry days at 90% significance level. The analysis of WSDI showed almost no changes in most districts. However, a lower statistically significant increasing trend in WSDI is observed Biharamulo and Missenyi.
Analysis of Future (2011–2100) Projection of Climate Condition and Extreme Climate Events in the Lake Victoria Region
Based on the detailed analysis of the historical climate condition in the Kagera and Geita regions, here we present the future projection of climate change in the Kagera and Geita regions. These changes in climate variable are assessed by comparing the future climate condition during the present (2011–2040), mid (2041–2070), and end (2071–2100) centuries under two emission scenarios (RCP 4.5 and RCP 8.5) relative to the historical climate condition (1971–2000). The detailed analysis of projected climate in the Lake Victoria region is presented in the following subsections.
Analysis of the Projected Change in Temperature (Minimum and Maximum Temperatures)
The projections of change in minimum temperature in the Kagera and Geita regions during the present (2011–2040) century under RCP 4.5 and RCP 8.5 emission scenarios are presented in Table 6. This table indicates that all districts will experience increased minimum temperature during the present century under both RCP 4.5 and RCP 8.5 emission scenarios. For instance, during June–July–August–September (JJAS) season, Chato, Biharamulo, and Ngara are likely to experience increased minimum temperature in the range of 1.0–1.5°C. Moreover, the minimum temperature is likely to increase during March–April–May (MAM) season in the range of 0.8–1.3°C. In October–November–December (OND) season, minimum temperature is likely to increase in the range of 1.0–1.2°C. Under RCP 8.5 emission scenario, it is evident from Table 6 that during the October–November–December (OND) season, Karagwe, Kyerwa, and Missenyi are likely to experience an increase in the minimum temperature in the range of 1.3–1.4°C. In general, all districts are likely to experience an increase in the minimum temperature predominantly in the main rainfall season MAM and OND. These results are consistent with a previous study by Luhunga et al. (2018), who indicated that the minimum temperature over the Lake Victoria Basin is projected to increase under both RCP 4.5 and RCP 8.5 emission scenarios. Moreover, the study by Osima et al. (2018) revealed increasing trends in temperatures in the entire Greater Horn of Africa in the future climate under both 1.5 and 2°C warming. The presented increases in minimum temperature are likely to affect the agriculture sector, as higher temperature reduces the length of the growing season of maize crops (Luhunga et al., 2016). Furthermore, higher temperature increases the incidence of crop disease outbreaks (Velásquez et al., 2018). Therefore, there is an urgent need to plan adaptation strategies on the projected change in minimum temperature in different districts in the Kagera and Geita regions.
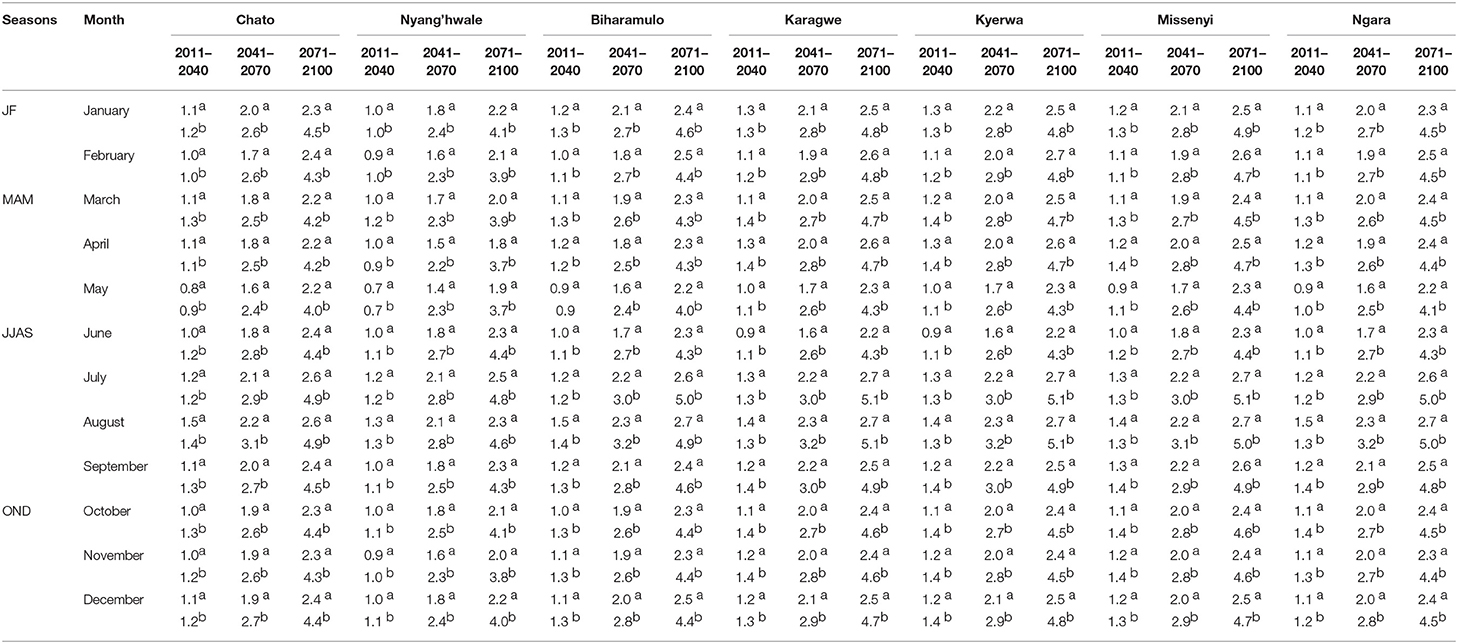
Table 6. Projected change in minimum temperature (°C) in the Kagera and Geita regions during the present (2011–2040), mid (2041–2070), and end (2071–2100) century for Representative Concentration Pathway a(RCP) 4.5 scenario and bRCP 8.5 scenario.
The changes in minimum temperature during the mid (2041–2070) century under RCP 4.5 and RCP 8.5 emission scenario are presented in Table 6. Like in the present century, all districts are likely to experience increased temperature during the mid (2041–2070) century under both RCP 4.5 and RCP 8.5 emission scenarios. In JJAS season, all districts are likely to experience increased minimum temperature in the range of 1.6–2.3°C under RCP 4.5 emission scenario and the range of 2.7–3.2°C under RCP 8.5 emission scenario. In the end century (1971–2100), see Table 6, minimum temperatures are likely to increase up to 5.1°C in Biharamulo, Karagwe, Missenyi, and Ngarain in the JJAS season. These results agree with previous studies (Luhunga et al., 2018, Osima et al., 2018) that indicated that the Lake Victoria Basin will experience increased temperature in the future climate.
The projected changes in maximum temperature during the present century under RCP 4.5 and RCP 8.5 emission scenarios are presented in Table 7. This table reveals that all selected districts are likely to feature increased maximum temperature in the range of 0.7–1.2°C during the present century. The maximum temperature is likely to increase by 4.4°C in the end century under RCP 8.5 emission scenario (Table 7).
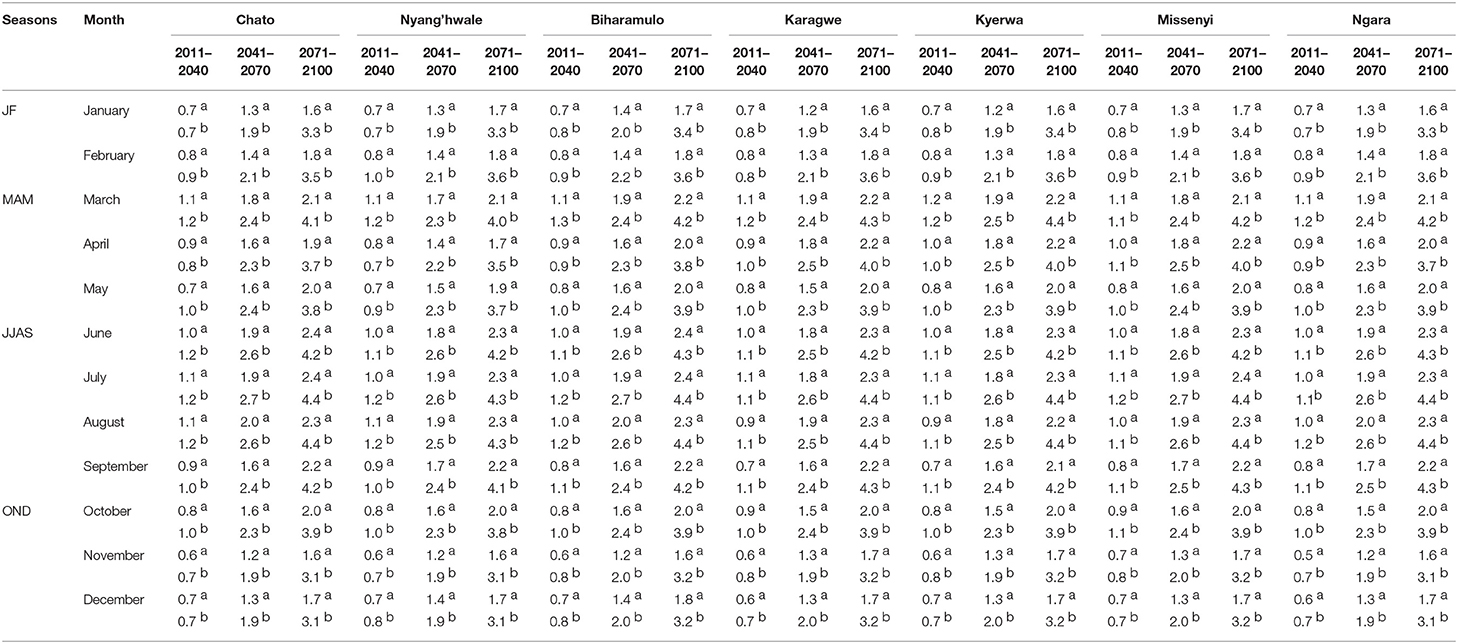
Table 7. Projected change in maximum temperature (°C) in the Kagera and Geita regions during the present (2011–2040), mid (2041–2070), and end (2071–2100) century for Representative Concentration Pathway a(RCP) 4.5 scenario and bRCP 8.5 scenario.
The projected percentage changes in rainfall during the present century (2011–2040) under RCP 4.5 and RCP 8.5 are presented in Table 8. This table indicates that in OND season, rainfall is expected to increase during the present climate. In mid (2041–2070) and end (2071–2100) centuries under both RCP 4.5 and RCP 8.5, see Table 8, all districts are likely to experience higher increased rainfall during OND season than in MAM season. It is interesting to find that all districts are likely to experience a decreased amount of rainfall in March. This is an indication that the MAM season is expected to shrink and become April and May (AM) season. On the other hand, the OND season is expected to extend to February and form an (ONDJF). This has been seen during present, mid, and end centuries (Table 8). These results are consistent with what has been reported in previous studies, for instance, Borhara et al. (2020) showed that there is a maximum rainfall decline in Tanzania during the long rainy (MAM) season and an increasing trend of rainfall during the short rainy (OND) season. Nicholson (2017) conducted a detailed review on climate and climate variability of rainfall over Eastern Africa and revealed that the long rains have been declining and the short rains have been increasing. Ogega et al. (2020) indicated that in the future, climate rainfall events over East Africa are projected to decline during MAM and increase during OND. The study by Wainwright et al. (2019) revealed that the projected decline in long rains during MAM is due to later onset of long rains influenced by the anomalously warmer Sea Surface Temperatures (SSTs) South of Eastern Africa that delay the north movement of the ITCZ and earlier cessation influenced by a decline of surface pressure over Arabia and warmer North Arabian Sea that pull the ITCZ northward outside the country. The presented results in this study are important, and special attention especially by farmers is needed when they plan their farming activities.
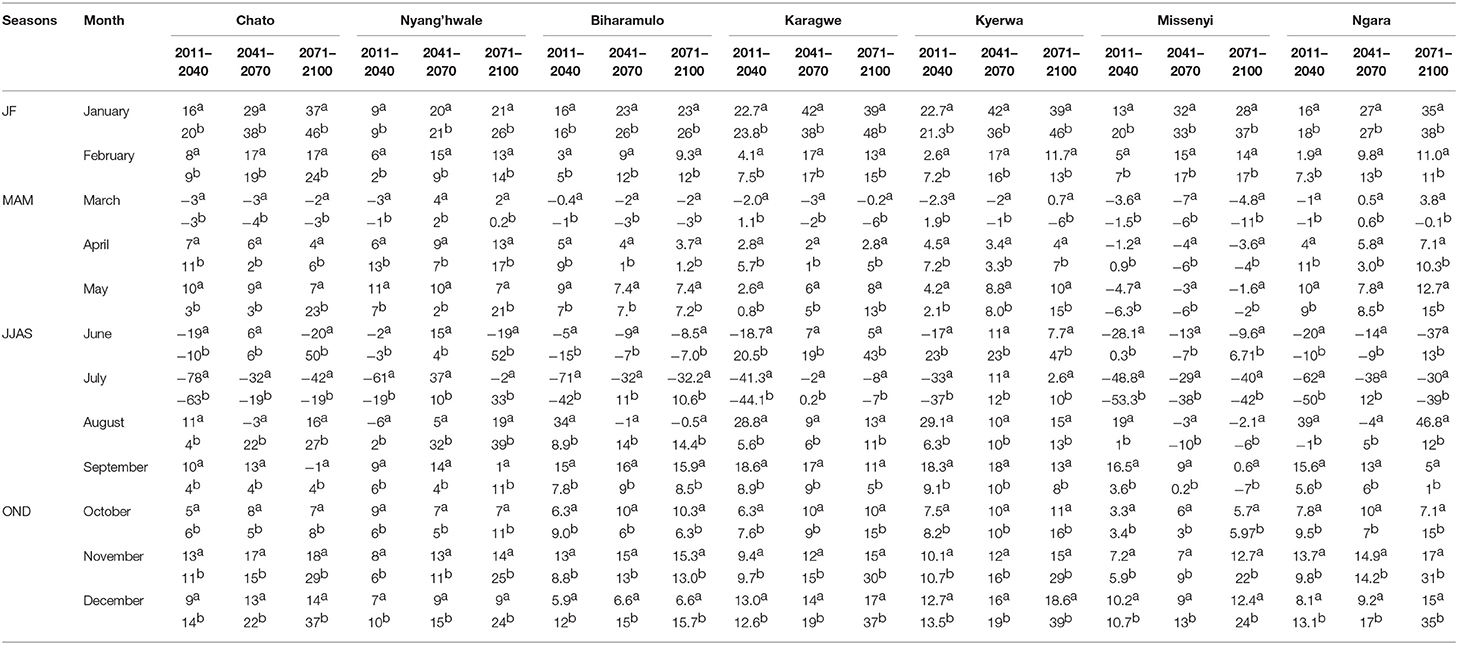
Table 8. Projected percentage changes in rainfall (%) in the Kagera and Geita regions during the present (2011–2040), mid (2041–2070), and end (2071–2100) century for Representative Concentration Pathway a(RCP) 4.5 scenario and bRCP 8.5 scenario.
Analysis of Projection of Changes in Extreme Climate Indices
The projected changes in extreme temperature indices in the Lake Victoria region under both RCP 4.5 and RCP 8.5 emission scenarios are presented in Table 9. All extreme temperature indices would increase in the present century (2011–2040) under both RCP 4.5 and RCP 8.5 emission scenarios. At the present century, the warmer indices TXx and TNx are likely to increase at the rate of 0.02 and 0.03°C/year, respectively, under RCP 4.5 scenario. Under RCP 8.5 scenario, the warmer indices TXx and TNx are likely to increase at the rate in the range of 0.02–0.04°C/year and 0.03–0.05°C/year, respectively. These results are consistent with the findings of Peng et al. (2019), who indicated that the warmer indices at night (TNx) would increase at a higher rate than warmer indices at daytime under both RCP 4.5 and RCP 8.5 scenarios. It is also observed that the higher the RCP, the larger the increasing rates, and this reveals the necessity of developing adaptation strategies on the climate change to reduce the impacts of extreme temperature indices as the response rates of warmer temperatures indices for adaption scenario (RCP 4.5) are lower than those of business-as-usual scenario (RCP 8.5). The cold indices TXn and TNn during the present century under RCP 4.5 scenario are likely to increase in the range of 0.01–0.03°C/year and 0.01–0.02°C/year, respectively, while under RCP 8.5 scenario, the cold indices would increase in the range of 0.003–0.023°C/year for TXn and from 0.027–0.039°C/year for TNn.
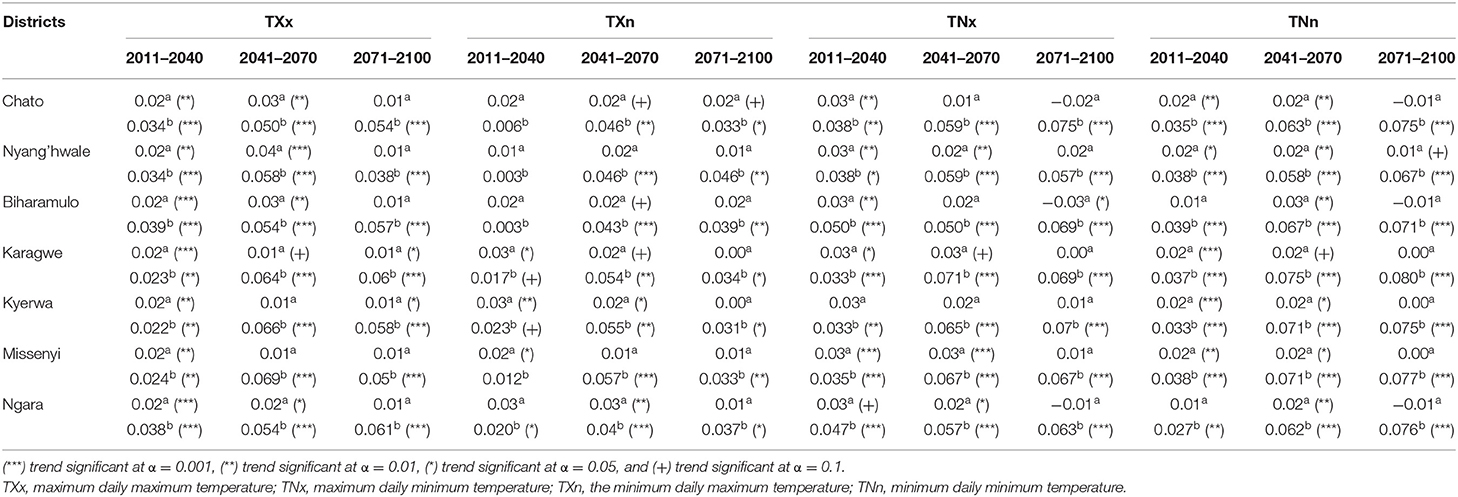
Table 9. Projected extreme climate indices related to intensity in the Kagera and Geita regions during the present (2011–2040), mid (2041–2070) and end. (2071–2100) centuries under Representative Concentration Pathway a(RCP) 4.5 scenario and bRCP 8.5 scenario.
The warmest day (TXx) during the mid-century (2041–2070) would increase in the range of 0.01–0.04°C/year and 0.05–0.069°C/year under RCP 4.5 and RCP 8.5 scenarios, respectively, while the warmest night (TNx) is likely to increase in the range of 0.01–0.03°C/year and 0.05–0.071°C/year under RCP 4.5 and RCP 8.5 scenarios, respectively (Table 9). On the other hand, the coldest day (TXn) during the mid-century would increase in the range of 0.01–0.03°C/year and 0.04–0.057°C/year under RCP 4.5 and RCP 8.5 scenarios, respectively. While the coldest night (TNn) is likely to increase in the range of 0.01–0.02°C/year and 0.027–0.039°C/year under RCP 4.5 and RCP 8.5 scenarios, respectively (Table 9).
In the end century (2071–2100), the warmest day (TXx) would increase at 0.01°C/year under RCP 4.5 scenario and in the range of 0.038–0.061°C/year under RCP 8.5 scenario. While the coldest day (TXn) is likely to increase in the range of 0–0.02°C/year and 0.031–0.046°C/year under RCP 4.5 and RCP 8.5 scenarios, respectively (Table 9).
The analysis of rainfall extreme indices reveals that during the present century (2011–2040) under RCP 4.5 scenario, four districts (Chato, Biharamulo, Karagwe, and Ngara) would experience a statistically significant increasing trend in the maximum 1-day precipitation of 0.1, 0.1, 0.01, and 0.08 mm/year, respectively (Table 10). On the other hand, during the present century, Misenyi is likely to experience a statistically decreasing trend in maximum 1-day precipitation by−0.056 mm/year. At the end century (2071–2100) under RCP 8.5 scenario, Karagwe and Kyerwa would experience a statistically significant increasing trend in maximum 1-day precipitation of 0.126 and 0.120 mm/year, respectively.
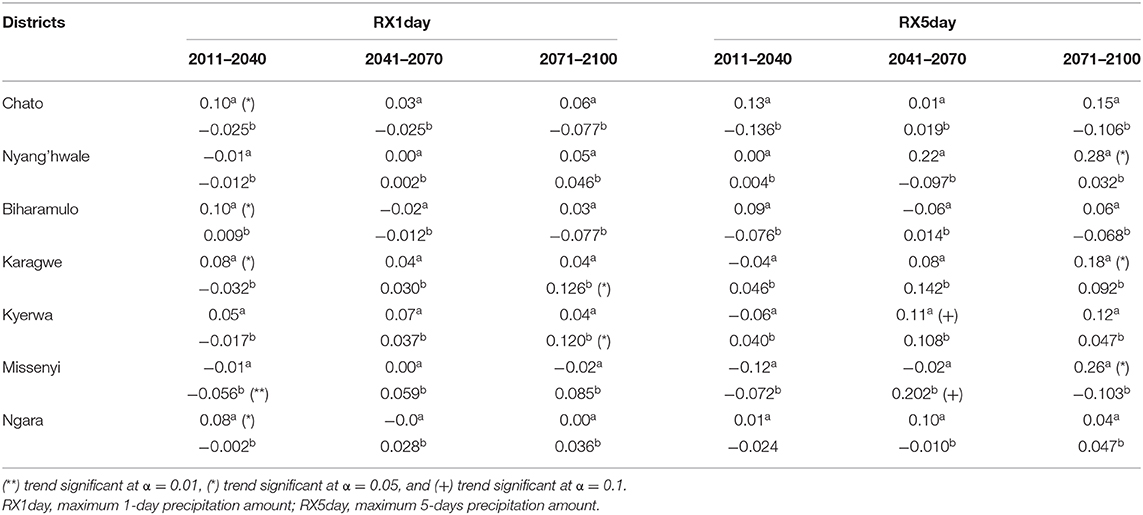
Table 10. Projected extreme climate indices related to intensity in the Kagera and Geita regions during the present (2011–2040), mid (2041–2070) and end. (2071–2100) centuries under Representative Concentration Pathway a(RCP) 4.5 scenario and bRCP 8.5 scenario.
During the present century (2011–2040) under RCP 4.5 scenario, the maximum 5-day precipitation shows a non-statistically increasing trend across all districts. However, in the mid-century (2041–2070), Kyerwa and Missenyi would experience a statistically significant increase in maximum 5-days precipitation of 0.11 mm/year for RCP 4.5 scenario and 0.202 mm/year for RCP 8.5 scenario, respectively (Table 10). In the end century (2071–2100), Nyang'hwale, Karagwe, and Missenyi are likely to experience a statistically significant increasing trend in maximum 5-days precipitation of 0.28, 0.18, and 0.26 mm/year, respectively, for RCP 4.5 scenario (Table 10).
Conclusion and Recommendation
In this study, the analysis of climate change and extreme climatic events in the Kagera and Geita regions has been carried out using the outputs from the CORDEX-RCMs. Daily simulated climate variables (rainfall and minimum and maximum temperatures) from the CORDEX-RCMs were used as input into the RClimDex software for computation of extreme climate events during historical (1971–2000) climate condition and future climate projection (2011–2100) under two RCP (RCP 4.5 and RCP 8.5) emission scenarios. The existence, magnitude, and statistical significance of potential trends in climate data time series were estimated using the Mann–Kendall (MK) nonparametric test and Theil-SEN slope estimator methods.
Results from the analysis revealed that there has been a significant increase in temperature in all districts in the Kagera and Geita regions. This has been observed in historical (1971–2000) and projected climate condition during the present (2011–2040), mid (2041–2070), and end (2071–2100) centuries under both RCP 4.5 and RCP 8.5 emission scenarios. Moreover, rainfall has decreased in the historical climate, while in future climate, it is predicted to increase especially during October, November, December season. In the long rainy season (MAM, rainfall is projected to decline especially in March (the beginning of the long rainfall season). These results support the previous studies (Nicholson, 2017; Wainwright et al., 2019; Borhara et al., 2020; Ogega et al., 2020) that indicated a decline in long rainy season (MAM) and an increase in short rainy (OND) season. It is especially important to note here that the analysis revealed a significant increase in extreme climate events. The number of warm nights and warm days is projected to increase significantly, cold days and cold nights are projected to decline significantly, and the number of extreme wet days is projected to increase significantly is some districts. In general, the intensity, duration, and frequency of extreme climate events in Kagera and Geita are likely to increase significantly. These results agree with what was reported by Ogega et al. (2020) that extreme climate indices related to rainfall are projected to increase in the East African region. This will present a serious challenge to many sectors; in particular, the agriculture sector will be at the highest risk (Velásquez et al., 2018). Therefore, there is an urgent need to plan and develop adaptation options on climate-related threats. There is an urgent need to develop adaptation strategies to withstand the projected significant increase in minimum temperatures. As it is well-known that higher minimum temperatures affect the respiration process of many crops. This process tends to increase with the increase in minimum temperature. On the other hand, photosynthesis is affected by moisture availability and carbon dioxide concentration. The length of the growing season is severely affected by the increase in temperatures (Luhunga et al., 2016). The projected increase in extreme wet days in the Kagera and Geita regions is likely to present a significant challenge to the agriculture sector (Velásquez et al., 2018). Therefore, actionable adaptation options must be put in place to reduce the impacts of climate change to the agriculture sector.
Data Availability Statement
The original contributions presented in the study are included in the article/supplementary materials, further inquiries can be directed to the corresponding author/s.
Author Contributions
The data search and analysis was done by PL. The validation of the model data was done by AS. Results analysis and manuscript writing was done by both authors. All authors contributed to the designing, analyzing, and writing of the manuscript.
Funding
This work was supported by FAO Tanzania as part of developing a feasibility report on climate change vulnerability for Kagera and Geita Regions. The paper forms one of the inputs in the development of a full funding proposal that will be submitted to Green Climate Fund to access financial support for addressing the impacts of climate change in different districts of Kagera and Geita regions, Tanzania.
Conflict of Interest
The authors declare that the research was conducted in the absence of any commercial or financial relationships that could be construed as a potential conflict of interest.
The reviewer LC declared a past co-authorship with one of the authors PL to the handling Editor.
References
Agrawala, S., Moehder, A., Hemp, A., Van Aalst, M., Hitz, S., Meena, H., et al. (2003). Development and Climate Change in Tanzania: Focus on Mount Kilimanjaro. Paris: OECD.
Almazroui, M. (2019). Climate extremes over the arabian peninsula using RegCM4 for present conditions forced by several CMIP5 models. Atmosphere 10: 675. doi: 10.3390/atmos10110675
Benjamin, S., Alcamo, J., and Schaldach, R. (2020). Projected climate change impacts on mean and year-to-year variability of yield of key smallholder crops in Sub-Saharan Africa. Clim. Dev. 12, 1–15. doi: 10.1080/17565529.2020.1760771
Borhara, K., Pokharel, B., Bean, B., Deng, L., and Wang, S. -Y. S. (2020). On Tanzania's precipitation climatology, variability, and future projection. Climate 8:34. doi: 10.3390/cli8020034
Byakatonda, J., Parida, B. P., Kenabatho, P. K., and Moalafhi, D. B. (2018). Analysis of rainfall temperature time series to detect long-term climatic trends variability over semi-arid Botswana. J. Earth Syst. Sci. (2018) 127:25. doi: 10.1007/s12040-018-0926-3
Chang'a, L. B., Kijazi, A. L., Luhunga, P. M., Ng'ongolo, H. K., and Mtongor, H. I. (2017). Spatial and temporal analysis of rainfall and temperature extreme indices in Tanzania. Atmosph. Clim. Sci. 07, 525–539. doi: 10.4236/acs.2017.74038
Christensen, J. H., and Christensen, O. B. (2003). Severe summertime flooding in Europe. Nature 421, 805–806. doi: 10.1038/421805a
Curtis, S., Fair, A., Wistow, J., Val, D., and Oven, K. (2017). Impact of extreme weather events and climate change for health and social care systems. Environ. Health 16:128. doi: 10.1186/s12940-017-0324-3
Ehrhart, C., and Twena, M. (2006). Climate Change and Poverty in Tanzania: Realities and Response Options for CARE. Background Report. CARE International Poverty-Climate Change Initiative. Available online at: http://www.care.dk/multimedia/pdf/web_english/Climate%20Change%20and%20Poverty%20in%20Tanzania%20-%20Country%20Profile.pdf
Enfors, E., and Gordon, L. (2008). Dealing with drought: the challenge of using water system technologies to break dryland poverty traps. Glob. Environ. Change 18, 607–616. doi: 10.1016/j.gloenvcha.2008.07.006
FAO. (2017). Climate Change Predictions in Sub-Saharan Africa: Impacts and Adaptations. Available online at: http://www.fao.org/3/a-i7040e.pdf (accessed October 09, 2020).
Gujree, I., Wani, I., Muslim, M., Farooq, M., and Meraj, G. (2017). Evaluating the variability and trends in extreme climate events in the Kashmir Valley using PRECIS RCM simulations. Model. Earth Syst. Environ. 3, 1647–1662. doi: 10.1007/s40808-017-0370-4
Hartkamp, A. D., De Beurs, K., Stein, A., and White, J. W. (1999). Interpolation Techniques for Climate Variables. NRG-GIS Series 99-01. Mexico, DF: CIMMYT.
IPCC (2013). “Physical science basis,” in Contribution of Working Group I to the Fifth Assessment Report of the Intergovernmental Panel on Climate Change, eds. T. F. Stocker, D. Qin, G.-K. Plattner et al., (Cambridge, UK: Cambridge University Press).
IPCC (2007). Working Group II Fourth Assessment Report. Climate Change: Climate Change Impacts, Adaptation and Vulnerability. Available online at: https://www.ipcc.ch/pdf/assessment-report/ar4/wg2/ar4_wg2_full_report.pdf (accessed November 15, 2020).
Kangalawe, R. Y. M. (2012). Food security and health in the southern highlands of Tanzania: a multidisciplinary approach to evaluate the impact of climate change and other stress factors. Afr. J. Environ. Sci. Technol. 6, 50–66. doi: 10.5897/AJEST11.003
Kaur, P., and Hundal, S. S. (2010). “Global climate change vis-à-vis crop productivity,” in Natural and Anthropogenic Disasters, ed M. K. Jha (Dordrecht: Springer), 413–431.
Kijazi, A., Chang'a, L., Luhunga, P., Ng'ongolo, H., Merchades, M., and Levira, P. (2019). The Contribution of the Global Framework for Climate Services Adaptation Programme in Africa (GFCS APA) in National Adaptation Plan (NAP) Process for Tanzania. Atmosph. Clim. Sci. 9, 650–661. doi: 10.4236/acs.2019.94040
Kijazi, A. L., and Reason, C. J. C. (2009b). Analysis of the 2006 floods over northern Tanzania. Int. J. Climatol. 29 955–970. doi: 10.1002/joc.1846
Kijazi, A. L., and Reason, C. J. C. (2009a). Analysis of the 1998 to 2005 drought over the northeastern highlands of Tanzania. Climate Res. 38, 209–223. doi: 10.3354/cr00784
Kundzewicz, Z. (2016). Extreme Weather Events and Their Consequences. Papers on Global Change IGBP, Volume 23, Issue 1. Warsaw: Polish Academy of Sciences, 59–69. doi: 10.1515/igbp-2016-0005
Liwenga, E. T., Jalloh, A., and Mogaka, H. (2014). Review of Research and Policies for Climate Change Adaptation in the Agriculture Sector in East Africa. (Brighton: Future Agricultures Consortium).
Luhunga, P. M. (2017). Evaluation of the impacts of climate variability on rainfed maize production over the Wami Ruvu basin of Tanzania. J. Water Clim. Change 9, 207–222.
Luhunga, P. M., Chang'a, L., and Djolov, G. D. (2016). Assessment of the impacts of climate change on maize production in the Wami Ruvu basin of Tanzania. J. Water Clim. Change 7. doi: 10.2166/wcc.2016.055
Luhunga, P. M., Joel, B., and Frederick, K. (2016). Evaluation of the performance of CORDEX regional climate models in simulating present climate conditions of Tanzania. J. South. Hemisph. Earth Syst. Sci. 66, 33–55 doi: 10.22499/3.6601.005
Luhunga, P. M., Kijazi, A. L., Chang'a, L., Kondowe, A., Ng'ongolo, H., and Mtongori, H. (2018). Climate change projections for tanzania based on high-resolution regional climate models from the Coordinated Regional Climate Downscaling Experiment (CORDEX)-Africa. Front. Environ. Sci. 6:122. doi: 10.3389/fenvs.2018.00122
Ly, S., Charles, C., and Degre, A. (2013). Geostatistical interpolation of daily rainfall at catchment scale:the use of several variogram models in the Ourthe and Ambleve catchments, Belgium. Hydrol. Earth Syst. Sci. 15, 2259–2274. doi: 10.5194/hess-15-2259-2011
Mubaya, C. P., Jalloh, A., and Mogaka, H. (2014). Review of Research and Policies for Climate Change Adaptation in Urban Areas in East Africa, working paper, Future Agriculture. Available online at: http://africainteract.coraf.org/wp-content/uploads/2014/10/Review-of-research-and-policies-for-climate-change-adaptation-in-Urban-areas-in-East-Africa.pdf
Müller, C., Cramer, W., Hare, W. L., and Lotze-Campen, H. (2011). Climate change risks for African agriculture. Proc. Natl. Acad. Sci. U.S.A. 108, 4313. doi: 10.1073/pnas.1015078108
Munishi, P. K. T., Shirima, D., Jackson, H., and Kilungu, H. (2010). Analysis of Climate Change and its Impacts on Productive Sectors, Particularly Agriculture in Tanzania. Study for United Republic of Tanzania Ministry of Finance and Economic Affairs Published April 2010. Morogoro, Tanzania: Sokoine University of Agriculture, Department of Forest Biology.
NCEI (2017). U.S. Billion-Dollar Weather and Climate Disasters. Available online at: https://www.ncdc.noaa.gov/billions (accessed September 13, 2020).
Nicholson, S. E. (2017). Climate and climatic variability of rainfall over eastern Africa. Rev. Geophys. 55, 590–635. doi: 10.1002/2016RG000544
Northrop, P. J., and Chandler, R. E. (2014). Quantifying sources of uncertainty in projections of future climate. Clim. J. 27, 8793–8808. doi: 10.1175/JCLI-D-14-00265.1
Ogega, O. M., Koske, J., Kung'u, J. B., Scoccimarro, E., Endris, H. S., and Mistry, M. N. (2020). Heavy precipitation events over East Africa in a changing climate: results from CORDEX RCMs. Clim. Dyn. 55, 993–1009. doi: 10.1007/s00382-020-05309-z
Olaka, L. A., Ogutu, J. O., Said, M. Y., and Oludhe, C. (2019). Projected climatic and hydrologic changes to lake victoria basin rivers under three RCP emission scenarios for 2015–2100 and impacts on the water sector. Water 11:1449. doi: 10.3390/w11071449
Opiyo, F. E., Wasonga, O. V., and Nyangito, M. M. (2014). Measuring household vulnerability to climate-induced stresses in pastoral rangelands of Kenya: implications for resilience programming. Pastoralism 4:10. doi: 10.1186/s13570-014-0010-9
Osima, S., Indasi, V. S., Zaroug, M., Endris, H. S., Gudoshava, M., Misiani, H. O., et al. (2018). Projected climate over the Greater Horn of Africa under 1.5°C and 2°C global warming. Environ. Res. Lett. 13:065004. doi: 10.1088/1748-9326/aaba1b
Peng, D., Zhou, T., Zhang, L., Zhang, W., and Chen, X. (2019). Observationally constrained projection of the reduced intensification of extreme climate events in Central Asia from 0.5°C less global warming. Clim. Dyn. 54, 543–560. doi: 10.1007/s00382-019-05014-6
Qian, Y., Jackson, C., Giorgi, F., Booth, B., Duan, Q., and Forest, C. (2016). Uncertainty quantification in climate modeling and projection. Bull. Amer. Meteor. Soc. 97, 821–824. doi: 10.1175/BAMS-D-15-00297.1
Rowhani, P., Lobell, D. B., Linderman, M., and Ramankutty, N. (2011). Climate variabilty and crop production in Tanzania. Agric. Forest Meteorol. 151, 449–460. doi: 10.1016/j.agrformet.2010.12.002
Saddique, N., Khaliq, A., and Bernhofer, C. (2020). Trends in temperature and precipitation extremes in historical (1961–1990) and projected (2061–2090) periods in a data scarce mountain basin, northern Pakistan. Stoch. Environ. Res. Risk Assess. 34, 1441–1455. doi: 10.1007/s00477-020-01829-6
Sarker, M. A. R., Alam, K., and Gow, J. (2012). How does the variability of Aus rice yield respond to climate change in Bangladesh? J. Agro. Crop Sci. 199, 189–194. doi: 10.1111/jac.12011
Tölle, M. H., Schefczyk, L., and Gutjahr, O. (2018). Scale dependency of regional climate modeling of current and future climate extremes in Germany. Theor. Appl. Climatol. 134, 829–848. doi: 10.1007/s00704-017-2303-6
Tumbo, S. D., Mpeta, E., Tadross, M., Kahimba, F. C., Mbillinyi, B. P., and Mahoo, H. F. (2010). Application of self-organizing maps technique in downscaling GCMs climate change projections for Same, Tanzania. Phys. Chem. Earth 35, 608–617. doi: 10.1016/j.pce.2010.07.023
URT (2007). Tanzania National Adaptation Programme of Action. Dar es Salaam: Vice President's Office.
URT (2008). Study on strategies for addressing negative effects of climate change in food insecure areas of Tanzania. Dar es Salaam: Ministry of Agriculture, Food and Cooperatives.
Van Beusekom, A. E., González, G., and Rivera, M. M. (2015). Short-term precipitation and temperature trends along an elevation gradient in Northeastern Puerto Rico. Earth Interact. 19, 1–33. doi: 10.1175/EI-D-14-0023.1
Velásquez, A. C., Castroverde, C. D. M., and He, S. Y. (2018). Plant and pathogen warfare under changing climate conditions. Curr. Biol. 28, R619–R634. doi: 10.1016/j.cub.2018.03.054
Wainwright, C. M., Marsham, J. H., Keane, R. J., Rowell, D. P., Finney, D. L., Black, E., et al. (2019). “Eastern African Paradox” rainfall decline due to shorter not less intense Long Rains. NPJ Clim. Atmos. Sci. 2:34. doi: 10.1038/s41612-019-0091-7
Zhang, X., Hegerl, G., Zwiers, F. W., and Kenyon, J. (2005). Avoiding inhomogeneity in percentile-based indices of temperature extremes. Clim. J. 18, 1641–1651. doi: 10.1175/JCLI3366.1
Zhang, X., and Yang, F. (2004). RClimDex (1.0) user manual. Environ. Canada 23. Available online at: http://etccdi.pacificclimate.org/RClimDex/RClimDexUserManual.doc (accessed May 01, 2020).
Keywords: climate change, climate variability, extreme climate indices, extreme weather, impact
Citation: Luhunga PM and Songoro AE (2020) Analysis of Climate Change and Extreme Climatic Events in the Lake Victoria Region of Tanzania. Front. Clim. 2:559584. doi: 10.3389/fclim.2020.559584
Received: 06 May 2020; Accepted: 23 November 2020;
Published: 22 December 2020.
Edited by:
Katharine Emma Vincent, Kulima Integrated Development Solutions, South AfricaReviewed by:
Michael C. Kruk, National Oceanic and Atmospheric Administration, United StatesLadislaus Benedict Chang'a, Tanzania Meteorological Agency, Tanzania
Ross Campbell Blamey, University of Cape Town, South Africa
Copyright © 2020 Luhunga and Songoro. This is an open-access article distributed under the terms of the Creative Commons Attribution License (CC BY). The use, distribution or reproduction in other forums is permitted, provided the original author(s) and the copyright owner(s) are credited and that the original publication in this journal is cited, in accordance with accepted academic practice. No use, distribution or reproduction is permitted which does not comply with these terms.
*Correspondence: Philbert Modest Luhunga, cGhpbHVodW5nYUB5YWhvby5jb20=; cGhpbGJlcnR0Lmx1aHVuZ2FAY29zdGVjaC5vci50eg==