 Evan A. Thomas1,2*
 Styvers Kathuni2Daniel Wilson2Christian Muragijimana2
 Taylor Sharpe1,2Doris Kaberia3
 Denis Macharia4Asmelash Kebede5Petros Birhane5
- 1Mortenson Center in Global Engineering, University of Colorado Boulder, Boulder, CO, United States
- 2SweetSense Inc., Nairobi, Kenya
- 3Millennium Water Alliance, Nairobi, Kenya
- 4Regional Centre for Mapping of Resources for Development, Nairobi, Kenya
- 5DT Global, Addis Ababa, Ethiopia
Millions of people living in the drought-prone Horn of Africa face an increasing threat from a lack of safe, reliable, and affordable water year-round as droughts become more severe and frequent. Drought emergencies emerge when reduced rainfall conspires with limited community water service capacity to cause dramatic reductions in access to water for people, livestock and agriculture. Drought-driven humanitarian emergencies can be prevented if groundwater is reliably made available at strategic locations during cycles of water stress. The Drought Resilience Impact Platform (DRIP) is an initiative combining early detection and planning with proactive groundwater management to ensure water availability, thus enabling drought-prone communities to become effective managers in the prevention of these humanitarian crises. It replaces reactive and expensive short-term assistance measures, like water trucking, with a framework for drought resilience. DRIP links in situ sensors deployed in East Africa with remote sensing data to improve estimates for rainfall and groundwater availability, and it will also develop a localized model for water demand forecasting. These indicators support the operation and maintenance of strategically selected groundwater borehole systems, thereby helping to support water delivery during dry and drought seasons. DRIP can be used to support pay-for-performance contracting, ensuring that water asset management is incentivized. DRIP is presently monitoring the water supplies of about 3 million people in East Africa. This paper presents DRIP's current web-based functionality, which uses several custom and commercial tools, and its applications, including rainfall-adjusted indicators of water pump functionality in Kenya and Ethiopia. Future work includes experimental and statistical characterization of the impact of these capabilities on water security, and the development of forecasting capabilities. This work is supported by NASA, United States Agency for International Development, and the National Science Foundation. The views expressed in this paper do not necessarily reflect the views of the United States Agency for International Development or the United States Government.
1. Introduction
Millions of people living in the drought-prone Horn of Africa face an increasing threat from a lack of safe, reliable, and affordable water year-round as droughts become more severe and frequent (Funk et al., 2015b). Droughts in this region in 2011 and 2016 resulted in food insecurity for millions of people (FAO, 2011; Nicholson, 2014; Uhe et al., 2017). Drought emergencies occur when reduced rainfall, exacerbated in recent years by climate change, conspires with limited community capacity and institutional failures to cause dramatic reductions in access to water for people, livestock, and agriculture. This lack of water results in catastrophic crop failures, public health stress, economic shocks, and displacement of people, disrupting patterns of nomadic migration.
Typically, drought response is reactive, involving international emergency assistance, which then disappears when the immediate crisis dissipates. The destabilizing impact of drought emergencies increases with each successive event, leading to vulnerability and insecurity in this complex region of Africa. The United States Agency for International Development (USAID) and UNICEF estimate that measures taken in advance of drought can save hundreds of millions of dollars compared to emergency relief efforts in the region (Godfrey and Hailemichael, 2017; Venton, 2018).
Drought-driven humanitarian emergencies can be prevented if groundwater is reliably made available at strategic locations ahead of drought. Improved localized monitoring combined with rapid actions can result in cost-effective improvements in water security in advance of drought. The Drought Resilience Impact Platform's (DRIP's) comprehensive system design integrates early detection and planning with proactive groundwater management to ensure water availability, thus enabling drought-prone communities to become effective managers in the prevention of these humanitarian crises.
In previous work in Rwanda, we demonstrated that providing local service providers in Rwanda with real-time information from sensor-enabled handpumps significantly improved water delivery from a baseline functionality of 56–91% (Nagel et al., 2015). We have further demonstrated that 99% uptime could be achieved with the support of machine learning (ML)-based predictive failure algorithms (Wilson et al., 2017), and we have examined the institutional frameworks supporting groundwater management as a means toward drought resilience (Turman-Bryant et al., 2019). As we have seen in Rwanda and Kenya, effectively using real-time data to improve water delivery requires this information be incorporated into local water management policies and practices.
This paper presents DRIP's current web-based functionality, which uses several custom and commercial tools, and its applications, including rainfall-adjusted indicators of water pump functionality in Kenya and Ethiopia. Future work includes experimental and statistical characterization of the impact of these capabilities on water security, and the development of additional capabilities.
2. Design Intent
DRIP is intended to reduce barriers and create opportunities to improve the operation and maintenance of rural water supplies in arid, drought-prone regions of East Africa. The DRIP theory of change posits that improved drought indicator monitoring, including food and water security estimates, will inform and strengthen networks including communities, governments, and international organizations to collectively ensure water availability and ultimately end drought emergencies. Figure 1 illustrates this theory of change.
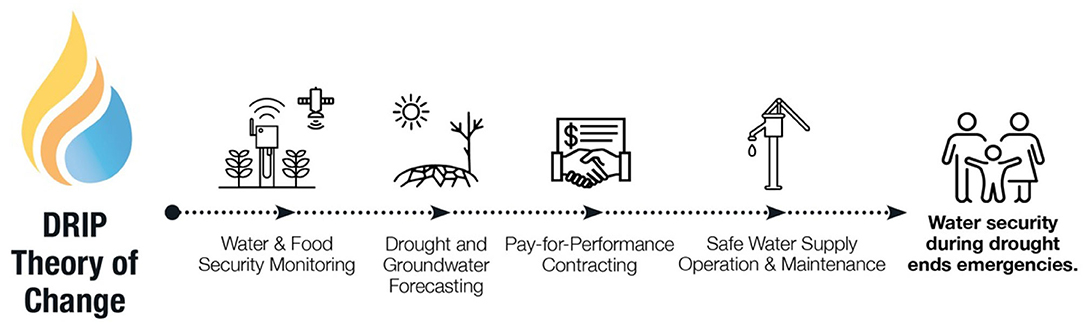
Figure 1. The Drought Resilience Impact Platform (DRIP) theory of change—improved water and food security monitoring can provide localized, actionable drought forecasts. These forecasts and monitoring can support pay-for-performance contracting to maintain water services in advance of drought.
DRIP links in situ sensors deployed in East Africa with remote sensing data to improve estimates for rainfall and groundwater demand, and it will ultimately include a localized model for water security forecasting. Using localized water security estimates to identify and prioritize strategically selected groundwater borehole systems, DRIP can ensure water delivery during dry and drought seasons. In some cases, pay-for-performance contracting is leveraged to ensure that all institutions and partners are incentivized to ensure water asset management and year-round safe water supplies. DRIP includes the following points:
1. Stakeholder collaborations to understand the actors and factors that support increased water security.
2. Groundwater pump monitoring.
3. Online integration of in situ and remote sensing data.
4. Decision-response tools to identify water service gaps.
5. Translation of service gaps and resource shortages into performance-based water security actions.
DRIP seeks to replace reactive and expensive short-term assistance measures like water trucking, with a framework for drought resilience. Enacted within local institutional and governance framework, DRIP can direct adaptation responses, secure ongoing delivery of key services, and deliver assistance specifically when and where it is needed.
3. Operational Basis
The DRIP theory of change and conceptual architecture were developed iteratively and informed by several aligned, though independent, efforts. Some elements of DRIP are currently operational at varying scales and geographies, while additional capabilities are in development.
In Kenya, the USAID and the Swiss Development Corporation (SDC) provided funding for the Kenya Resilient Arid Lands Partnership for Integrated Development (Kenya RAPID) program, a consortium effort led by the Millennium Water Alliance and operating in five of the arid northern counties of Kenya—Garissa, Isiolo, Marsabit, Turkana, and Wajir. Under Kenya RAPID, satellite- and cellular-connected sensors provided by SweetSense Inc. (www.sweetsensors.com) have been installed on over 150 mechanized groundwater pumps, including all of the pumps (about 80) designated by the National Drought Management Authority (NDMA) as critical infrastructure to support drought alleviation. Under Kenya RAPID, IBM Research's office in Nairobi, Kenya, was contracted to develop a data management platform, called “eMaji” that linked the sensor data with additional data sources to support the county governments in water asset management.
In Ethiopia, the USAID Lowland WASH Activity, operated under contract by DT Global, has installed over 240 cellular- and satellite-connected sensors in the Afar and Somali regions. In Afar, these sensors cover nearly all of the mechanized boreholes, and in Somali, sensors have been installed on some critical pump infrastructure. Under the USAID Lowland WASH Activity, mWater (www.mwater.co) was contracted to develop a water asset management information system, linking sensor data with electronic smartphone-based survey data on asset characteristics, functionality, and repair activities.
In Kenya and Ethiopia, implementer staff have organized government stakeholder consultations to identify the form and function of these data collection and sharing platforms, and have facilitated the iterative design and adoption of these systems among local, regional, and national stakeholders responsible for the management of water services. Furthermore, we have encouraged international donors to engage with the data platforms to inform monitoring of current projects and to support decision making for future funding priorities.
The USAID-supported Sustainable WASH Systems Learning Partnership (SWS) is a four-country, multipartner study to identify the institutional and governance conditions that result in effective improvements of complex water and sanitation systems in this region. Led by the University of Colorado Boulder, SWS activities include studying both the Kenya and Ethiopia water service provisioning contexts described above.
SWS has recently identified key factors in enabling effective water service delivery. These include monitoring capacity, technical capacity, policy and regulatory oversight, and government-led financial incentive programs. Similarly, several factors have been identified that influence water user payments. Most critically, users are more likely to pay for water services if reliable and fast maintenance and repairs occur (Sustainable WASH Systems Learning Partnership, 2020). These water service and water user payment factors are relevant to the DRIP theory of change and deployments.
Finally, the NASA and USAID SERVIR partnership (www.servirglobal.net) have provided support to the University of Colorado Boulder, Oregon State University, the Famine Early Warning Systems Network (www.fews.net), and the Kenya-based Regional Center for Mapping of Resources for Development (RCMRD, www.rcmrd.org) to link these groundwater pump sensor data with additional in situ data sets including weather stations and land propriety surveys with satellite-based remotely sensed data for rainfall, groundwater, soil moisture, and vegetation.
Figure 2 illustrates a typical groundwater pump in northern Kenya (center) with an electrical current clamp being installed on the control panel (left) and the satellite or cellular telemetry transmitter (right). Figure 3 illustrates the spatial coverage of this groundwater pump monitoring network overlaying the Famine Early Warning System (FEWS NET) food security classification in March, 2020. Daily borehole status classifications are described below.
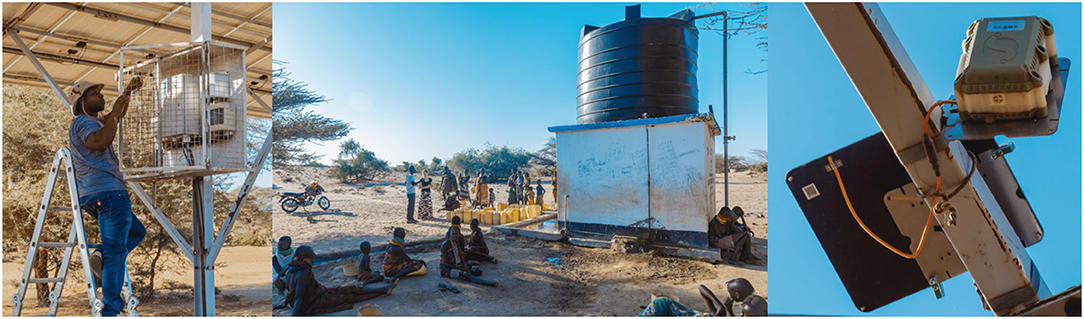
Figure 2. A typical groundwater borehole in Turkana, Kenya (center). Electrical monitoring sensors are installed at the pump controller (left), and wireless transmit data to a self-powered satellite or cellular transmitter (www.sweetsensors.com).
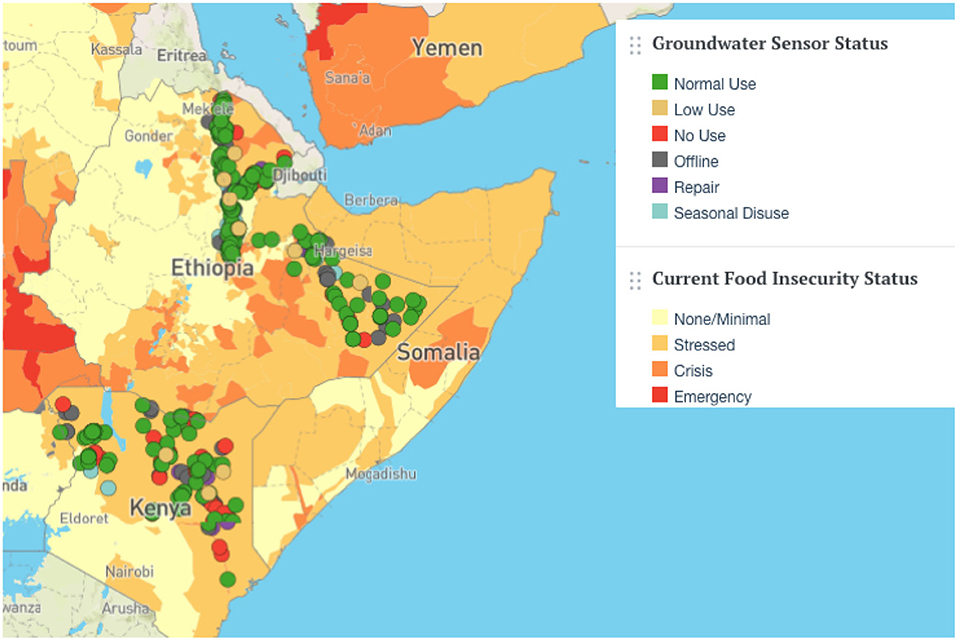
Figure 3. DRIP borehole status map with Famine Early Warning System (FEWS NET) food security classification in March, 2020. Available through https://prepdata.org/dashboards/the-drought-resilience-impact-platform-drip.
Several limitations of the sensor architecture have been identified. These include that the electrical current clamps are easily accidental or deliberately tamper prone, which can lead to false negatives (the pump is running though the sensor data suggest it is not). Further, the current lithium-ion batteries are not well-suited for more than a few years of exposure in hot ambient conditions. Finally, the current satellite data services are cost barriers to scale. These limitations are being addressed in further hardware iterations.
4. Design Architecture
As of April 2020, over 400 groundwater pumps are being monitored, with over 727 pump-years of data combined, since the first installation in January 2016. On average, each pump has 1.8 years of sensor-collected runtime data. In total, the water supplies of ~3 million people are being monitored on a daily basis.
The publicly accessible DRIP front-end (www.prepdata.org/dashboards/the-drought-resilience-impact-platform-drip) is hosted under the Partnership for Resilience and Preparedness (PREP). PREP was formed in 2016 with the World Resources Institute and Future Earth as core partners, and designed to provide publicly accessible and usable climate and socioeconomic data. The PREP partnership includes research institutions, government agencies, adaptation practitioners and technology companies “working to empower communities and businesses around the world to build resilience to climate change by improving access to data, creating best-in-class tools and helping people navigate the complicated resilience planning landscape.” The PREPdata platform (www.prepdata.org) is designed to be an “open data online platform that allows users to access and visualize spatial data reflecting past and future climate, as well as the physical and socioeconomic landscape for climate adaptation and resilience planning.”
4.1. User Interfaces
The public DRIP provides regional-level aggregation of water pump characteristics, as shown in Figure 4. DRIP public analytics, generated with Sisense, a web-based data visualization system (www.sisense.com), includes average borehole runtime per administrative region, rainfall, and estimated mean time between failures and repairs. Detailed analytics for every pump is available to authorized users through password-protected logins.
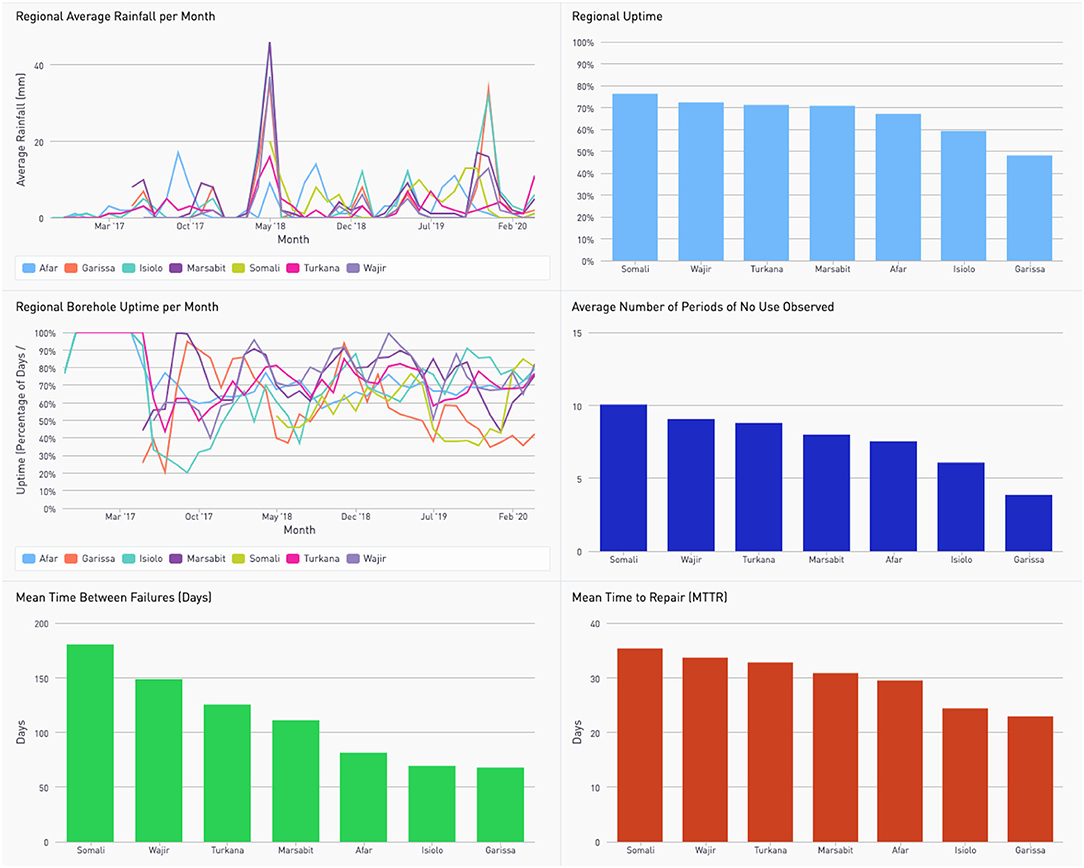
Figure 4. DRIP public analytics includes average borehole runtime per administrative region, rainfall, and estimated mean time between failures and repairs. Detailed analytics for every pump is available to authorized users through password-protected logins. Available through https://prepdata.org/dashboards/the-drought-resilience-impact-platform-drip.
Various data users engage with additional web-based platforms to access and act on pump sensors and other data. These users may use password-protected logins to access authorized detailed data and control actions, including generating and tracking repair tickets. These functions are provided through dashboard tools created in Sisense (www.sisense.com), mWater (www.mwater.co), and by IBM Research.
An important function of these data platforms includes tracking user engagement and real-world activities at the pump sites. Using smartphone-based survey tools, such as mWater or IBM eMaji's applications, partners are able to collect local asset characteristics (e.g., location, pump type, and estimated water yields operator contact information), sensor installation tracking and pump repair activities. These site-level reports are incorporated throughout the analytical and decision support process including calibration of water yield estimates and reporting on pump repair activities.
4.2. Remotely Sensed Rainfall Influence
In our previous work, we demonstrated the inverse relationship between remotely sensed local rainfall estimates [the Monthly Climate Hazards Group InfraRed Precipitation with Station (CHIRPS) data] (Funk et al., 2015a) and borehole pump runtime (Thomas et al., 2019). After 1 week without rainfall, we observed a 23% increase in runtime compared to sites with recent rainfall. Overall, a 1-mm increase in rainfall was associated with a 1% decrease in borehole use the following week. When surface water availability is reduced during the dry seasons, groundwater demand increases. These findings are consistent with another recent study comparing rainfall to handpump use in Kenya, wherein handpumps were used one-third less often during the wet season compared to the dry season (Thomson et al., 2019).
Based on these findings, we incorporated the CHIRPS remotely sensed local rainfall as a relevant covariant in classifying water pump functionality.
4.3. Water Pump Classifications
Initially, an ML-based system was used to classify borehole status. This ML approach used supervised ensemble ML to predict pump status. The ML system used a training set of labeled data to create an ensemble of algorithms, which, when weighted together, predicted pump status in a way that optimally matched the training set. The prediction about the status of a given site for a given historical day could change as more information was gathered. While this approach has the advantage of continuous improvement, it was a “black box,” and it became difficult to explain precisely the rules that are applied to classify any given pump. This had the effect of reducing stakeholder confidence in the classification system as it was not easily explainable.
The ML system was therefore replaced by an “expert classification” system that follows a system of easy-to-understand rules. These rules, defined with the assistance of our “expert” stakeholders, predict the status of pumps in a way that is deterministic. Unlike SweetSense ML, the predictions of the SweetSense Expert System can be easily mapped out with logic statements, and the Expert System-derived status for a particular site and day will never change.
This classification system is described in Figure 5. Daily borehole status classifications include “Normal Use” for a 7-days average of typical runtime observed at that site; “Low Use” for a 7-days average use lower than the 20th percentile for that site; “No Use” for no observed use in the past 7 days; “Seasonal Disuse” for sites with no observed use in the past 7 days but where CHIRPS observed rainfall within a 4-km radius of that site exceeding 10 mm in the previous week (7–14 days preceding today); “Repair” for sites that have been filed electronically by users as under repair; and “Offline” for sensors that have not reported for more than 7 days.
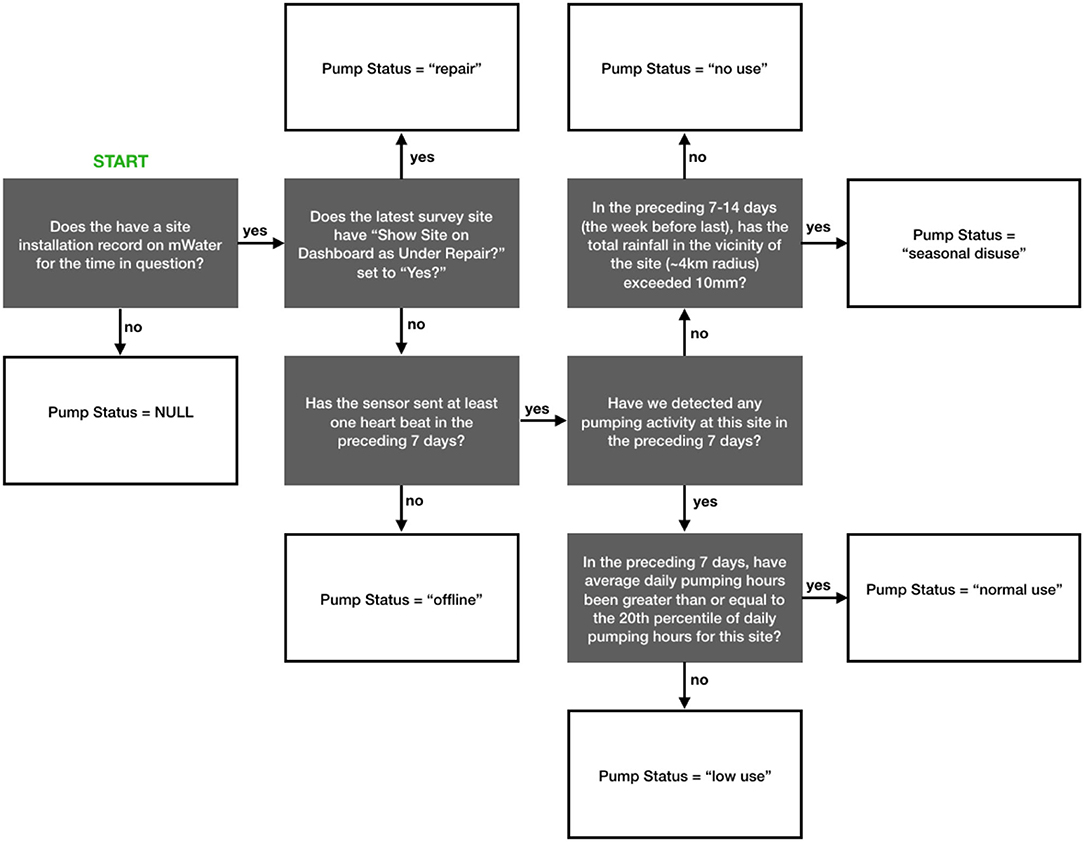
Figure 5. Sensor data expert classification system flowchart.
Rolling 7-days increments for borehole classification were chosen, as stakeholder feedback indicated that a classification system based only on the previous day's characteristics would be too sensitive to variation. The pump classification system considers historical averages a local rainfall on a per-site basis, as pump runtime is dominated by local characteristics.
5. Use Cases
Our service stakeholders include the Kenya National Drought Management Authority and the Ethiopia Ministry of Water, Irrigation and Energy, as well as regional and local government entities and supporting non-profits and companies. In this section, we describe the iterative process of designing the DRIP decision aid tools including representative user vignettes.
5.1. Kenya
The mechanized borehole pump sensor was developed based on identified partner needs in northern Kenya. Starting in 2014, a series of formal and informal stakeholder consultations were held with representatives of county ministries of water and partner non-government organizations. At first, only cellular-connected handpump sensors were available for deployment. A clear consensus emerged that monitoring mechanized boreholes, mostly outside cellular coverage areas, was a critical need for these counties. After a year of product design and testing, electrical pump sensors with satellite connectivity were deployed starting in 2016. After ~120 sensors were installed across five counties and the data provided through an online dashboard system, further stakeholder meetings were held with county officials and the NDMA.
While the online dashboards provided the most up-to-date, customizable, and detailed data, limited time and access to computers to navigate the dashboards were noted as major hindrances to accessing information. It was also noted that though the sensors were providing near-time data on functionality of pumps, most of the relevant staff instead only wanted to have a snapshot of those pumps that had changed status (i.e., from “Normal” to “No Use”). Further, daily updates were not actionable by most stakeholders—resource allocation decisions, including staffing, budgets, and scheduling, are made at best on a weekly basis.
Based on this feedback, water pump functionality data were provided, in addition to the web-based dashboards, via automated PDF files emailed weekly to identified users. County-level customized reports are now provided to county staff, while national-level summaries are provided to national staff. Furthermore, the boreholes, specially designated by NDMA as critical drought response infrastructure, are provided as their own report.
The staff receiving these weekly emails include top- and mid-level management and technicians who are involved in taking appropriate action in repair of boreholes. These actions include allocation of funds for repairs, initiating procurement of borehole spare parts, and undertaking repairs.
Each of the selected staff receives the email that can be conveniently accessed on their phones. All the five counties have technicians who respond to borehole breakdowns, and in most cases, they set out on Monday mornings based on a weekly schedule to repair non-functional boreholes. Since the email report is received every Monday morning, it is useful to the technicians as they plan for site visits and repairs in the week. Based on the report, the technicians visit a non-functional borehole, and in case minor repairs are required, the technicians fix the borehole. In case where spare parts are required, they inform their line managers for procurement to commence.
For senior and mid-level county and NDMA managers who attend strategy and planning meetings, such as the County Steering Group meetings, the email reports have been useful in verifying borehole functionality and justifying actions taken to support repairs. Since the email reports also highlight boreholes that have changed from a non-functional to a functional status, they have been useful to senior county and NDMA managers to ascertain that resources allocated for the repair of a particular borehole translated to actual repairs, and the borehole is back to functional status.
Two illustrative user vignettes are provided—a county-level borehole repair technician and a national-level NDMA employee.
The borehole technician receives an email on Monday morning. This email provides a map of all sensor-equipped boreholes in her county. A table below identifies which of these pumps have had a status change within the last week. The technician identifies boreholes that have become non-functional. Based on this information, she then calls the local borehole operator, if possible, to identify if there is a pump failure and of what kind. If a likely need for repair is identified, the technician works with her manager to schedule a visit to this borehole. The inspection and repair actions taken are recorded electronically by the technician on a smartphone survey (e.g., IBM's eMaji or mWater).
The national-level NDMA staff receives a similar email on Monday, but in this case tracking all of the NDMA-designated boreholes across northern Kenya. She identifies which pumps have become functional after dysfunction in the past week and vice versa. Working with NDMA staff at the county level, she discusses resource allocation, including budget support, to enable technicians to repair boreholes.
Based on additional feedback from county staff, additional analytics have been added to the web-based dashboards on average borehole uptime, which shows the percentage of boreholes that are functional in a county on a monthly basis. These trends in average functionality are now being incorporated into performance indicators by some counties, including the newly appointed Garissa Rural Water Corporation Board of Directors, which is considering high borehole uptime data as a performance indicator for its senior staff.
5.2. Ethiopia
In Ethiopia, the USAID Lowland WASH Activity envisioned telemetry-based monitoring of electrical groundwater boreholes in the Afar region to support the Afar Regional Water Bureau (ARWB) and local Woerdas in water asset management. Between 2015 and 2018, about 180 cellular- and satellite-connected sensors were installed in Afar Region, on nearly every electrical borehole pump. Primarily because of the increased cost of satellite data services compared to cellular, the initial preference was for cellular connectivity whenever feasible. However, during the implementation period, several barriers to reliable cellular-based telemetry were identified, including national-level cellular blackouts in 2018 and 2019 and uncertain cellular coverage at many sites. While more expensive, the satellite-connected sensors have proven to more reliably provide pump data.
Between 2015 and 2020, a series of stakeholder consultations were held with ARWB and the USAID Lowland WASH Activity implementing partners. These meetings identified three limitations to improved water system functionality: (1) information on water system failures, (2) staffing capacity to manage water system assets and respond to breakdowns, and (3) insufficient budgets for maintenance. These constraints were further reinforced by life cycle cost analyses conducted by the implementing partners. In response, the implementing partners proposed a combination of interventions including installation of the pump sensors; integration of asset management and sensor data in a customized mWater-designed asset management system (AMS) including capabilities to identify possible failures of water points with sensor data, creation of dispatch tickets for maintenance, repairs, or new assets, and tracking of key performance indicators for reporting; the engagement with ARWB to institutionalize operations involving the AMS and support decision making through an embedded staff facilitator; and the formation of a regional learning alliance in Afar with the purpose of engaging stakeholders in policy advocacy with the regional and national government for water system operation and maintenance budgetary support.
An illustrative user vignette of the actions taken in the Afar region is provided.
On a daily basis, the implementer-supported embedded facilitator reviews pump functionality reports through several of the web-dashboard tools. He identifies water pumps that are not in use and, if possible, calls the local operators to confirm. He manually updates water scheme functionality and local insights into the mWater AMS. These summaries are then shared with the Afar Regional Water Bureau staff to support resource allocation planning.
6. Ongoing Work
The present embodiment of the DRIP theory of change has been applied in several contexts, while ongoing work will expand its capabilities toward developing a regional-scale water security estimate and planning tool.
Notably, our iterative, stakeholder-supported design process arrived at a utility similar to the Famine Early Warning Systems Network (FEWS NET) approach of providing periodic, categorical food security estimates and forecasts (Funk et al., 2019).
6.1. Pay-for-Performance Water Pump Repair Incentives
Measurement and feedback are increasingly being incorporated into global engineering and development financing and programming. Within this ecosystem, there is room to incorporate near-time measurement of program, product, and service performance and feed these measures back to responsible parties (i.e., donors, implementers, governments, and communities) in a way that enables iterative testing and improvement.
Pay-for-performance incentive models for water system operation and maintenance are a clear opportunity to improve cost-effective water security in East Africa. A combination of taxes, tariffs, and transfers, deployed using innovative, accountable, and cost-effective contracting mechanisms, can improve water service delivery.
The DRIP theory of change includes performance-based financial incentives to support the prioritization of cost-effective water pump management. While not yet deployed at scale, several promising examples are currently deployed in Kenya. These include the Proof of Impact platform (www.proofofimpact.com/events/provide-stable-water-access), currently creating funding incentives to support water system operations in Turkana, Kenya, as part of Kenya RAPID, the Swiss Development Corporation direct county transfer program and the FundiFix handpump maintenance program that is supported by sensor-triggered repairs paid for through the Water Services Maintenance Trust Fund (REACH, 2016). These demonstrations, if successful, should support monitored performance-based payments at a greater scale.
6.2. Impact Evaluations
While we have demonstrated previously that providing local water service providers with real-time information can significantly improve water delivery (Nagel et al., 2015), there has been little previous study of the barriers and facilitators to utilizing real-time data at scale for water management in low-income settings. As a consequence, we have limited guidance in developing effective strategies to promote adoption and implementation of sensor-based technologies to improve water service delivery.
A useful framework for determining the impact of sensor-enabled boreholes on water delivery while simultaneously evaluating and refining methods to implement these data into local water management practices is the hybrid effectiveness–implementation design. Importantly, unlike the traditional randomized clinical trial, this approach allows information from formative evaluation to be utilized during the conduct of the study to optimize implementation and creates a framework for assessing the impact of evolving implementation strategies.
We are presently using this approach to experimentally and iteratively evaluate and improve the impact of the DRIP theory of change, independently in each of our Ethiopia and Kenya contexts.
6.3. Localized Groundwater Use and Demand Forecast
Presently, rainfall-controlled groundwater pump functionality indicators are provided for instrumented water schemes. Leveraging additional remote sensing and in situ data sources, we are developing gridded estimates for present and forecasted groundwater demand, intended for locations that are not instrumented.
To support this data service, we are now integrating additional local rainfall data with CHIRPS, collected by the Trans-African HydroMeteorological Observatory weather station network (www.tahmo.org) that currently operates 462 active weather stations across 25 countries.
Further, we are using data collected by the Land Potential Knowledge System (LandPKS) smartphone application, both on soils and vegetation cover, which can be used to test and improve hydrological models and spatial products.
Our localized site characteristics will then be applied in concert with our groundwater use sensor monitoring network to create an interpolated groundwater use gridded data product for the region. This current-use estimate combined with rainfall forecasting data will then be used to forecast future groundwater demand based on recent trends in rainfall and groundwater use in the region. This new groundwater use and demand forecasting data product can then be used as a decision support tool for groundwater borehole repairs, and for borehole drilling efforts, supporting the broad DRIP theory of change.
Furthermore, we anticipate examining any potential correlations between regional-scale changes in remotely sensed groundwater (Grace-FO), NDVI, and soil moisture against changes in groundwater use. We hypothesize that decreases in surface water availability, as reflected in NDVI and soil moisture, may correlate to increased groundwater use, and further that regional-scale changes in remotely sensed groundwater may correlate to aggregated changes in groundwater use. We previously identified an inverse correlation on a site-wise basis for rainfall and groundwater use, and may be able to identify similar trends when examining groundwater, NDVI, and soil moisture across larger areas.
Our work uses several candidate remote sensing-based data products, including CHIRPS rainfall and temperature (Peterson et al., 2018), vegetation (NDVI obtained from USGS Landsat 8 and NASA MODIS) Roy et al. (2016), groundwater [Gravity Recovery and Climate Experiment-Follow On (GRACE-FO)] (Tapley et al., 2004; Wahr et al., 2004), and soil moisture (Synthetic Aperture Radar from RadarSat-2, Helios-2, Sentinel-1 data, and ALOS PALSAR) (Wang and Qu, 2009; Fang and Lakshmi, 2014).
6.3.1. Extensibility
This paper describes early efforts to use web-based interfaces to provide water security insights to decision makers in Kenya and Ethiopia. If useful at improving water management decisions, we anticipate expanding DRIP's functionality for application in other areas of the world, including additional regions of East Africa.
Further, the technical tools, including the sensors, analytics, and web interfaces, are presently also being deployed to support groundwater conservation efforts in the western United States, including Colorado, and in support of the California Sustainable Groundwater Management Act.
Data Availability Statement
Publicly available datasets were analyzed in this study. This data can be found at: https://prepdata.org/dashboards/the-drought-resilience-impact-platform-drip.
Author Contributions
ET, DK, and PB: conceptualization. ET, TS, DW, and CM: methodology. ET, DW, and TS: software. SK, CM, and AK: validation. ET: formal analysis and writing—original draft preparation. ET, SK, DW, CM, TS, DK, DM, AK, and PB: investigation. DW, ET, SK, and CM: data curation. SK, DW, CM, TS, DK, DM, AK, and PB: writing—review and editing. ET and DW: visualization. ET, DK, and PB: supervision. DK, PB, and ET: project administration and funding acquisition. All authors contributed to the article and approved the submitted version.
Funding
The work described in this publication was made possible through support provided by the National Aeronautics and Space Administration, under the terms of Grant No. 80NSSC20K0150; the National Science Foundation under the terms of Award No. 1738321; the U.S. Agency for International Development, under the terms of Contract No. AID-663-TO-16-00001, and Cooperative Agreement No. AID-615-A-15-00008. The opinions expressed herein are those of the authors and do not necessarily reflect the views of the U.S. Agency for International Development. Additional funding was provided by the Autodesk Foundation and the Moore Foundation.
Conflict of Interest
ET, SK, DW, CM, and TS are employed by the company SweetSense Inc. which produces the sensors used in this project. AK and PB are employed by DT Global and DK is employed by the Millennium Water Alliance, organizations contracted to operate some of the work described.
The remaining author declares that the research was conducted in the absence of any commercial or financial relationships that could be construed as a potential conflict of interest.
Acknowledgments
The work presented in this paper represents the effort and input of many collaborators. These include mWater, IBM, DT Global, IRC WASH, the Millennium Water Alliance membership, Proof of Impact, Laura Brunson, Karl Linden, Amy Javernick-Will, Dan Hollander, Anna Libey, Pranav Chintalapati, Jason Neff, Amy Hill, Jamie McDevitt-Galles, Roger Pulwarty, John Selker, Amy McNally, Josh Tewksbury, Emily Nilson, Skot Croshere, Lauren Stover and Joseph Pearce, Bret McSpadden, John Butterworth, and Jemal Ibrahim Seid.
Supplementary Material
The Supplementary Material for this article can be found online at: https://www.frontiersin.org/articles/10.3389/fclim.2020.00006/full#supplementary-material
References
Fang, B., and Lakshmi, V. (2014). Soil moisture at watershed scale: remote sensing techniques. J. Hydrol. 516, 258–272. doi: 10.1016/j.jhydrol.2013.12.008
FAO (2011). Drought-Related Food Insecurity: A Focus on the Horn of Africa. Rome: Food and Agricultural Organization of the United Nations. Available online at: https://reliefweb.int/sites/reliefweb.int/files/resources/MB738_Drought%20in%20Horn%20of%20Africa%20paper.pdf
Funk, C., Peterson, P., Landsfeld, M., Pedreros, D., Verdin, J., Shukla, S., et al. (2015a). The climate hazards infrared precipitation with stations-a new environmental record for monitoring extremes. Sci Data 2:150066. doi: 10.1038/sdata.2015.66
Funk, C., Shukla, S., Hoell, A., and Livneh, B. (2015b). Assessing the contributions of east African and west pacific warming to the 2014 boreal spring east African drought. Bull. Amer. Meteor. Soc. 96, S77–S82. doi: 10.1175/BAMS-D-15-00106.1
Funk, C., Shukla, S., Thiaw, W. M., Rowland, J., Hoell, A., Mcnally, A., et al. (2019). Recognizing the famine early warning systems network over 30 years of drought early warning science advances and partnerships promoting global food security. Bull. Am. Meteorol. Soc. 100, 1011–1027. doi: 10.1175/BAMS-D-17-0233.1
Godfrey, S., and Hailemichael, G. (2017). Life cycle cost analysis of water supply infrastructure affected by low rainfall in Ethiopia. J. Water Sanit. Hyg. Dev. 7, 601–610. doi: 10.2166/washdev.2017.026
Nagel, C., Beach, J., Iribagiza, C., and Thomas, E. A. (2015). Evaluating cellular instrumentation on rural handpumps to improve service delivery–a longitudinal study in rural Rwanda. Environ. Sci. Technol. 49, 14292–14300. doi: 10.1021/acs.est.5b04077
Nicholson, S. E. (2014). A detailed look at the recent drought situation in the Greater Horn of Africa. J. Arid Environ. 103, 71–79. doi: 10.1016/j.jaridenv.2013.12.003
Peterson, P., Peterson, S., Meiburg, A., Funk, C. C., Michaelsen, J., Davenport, F., et al. (2018). “A new 34-year satellite-based monthly Tmax climate data record, the climate hazards infrared/MERRA2 Tmax with stations: CHIMERRAS Tmax,” in Exhibit Hall 3 (ACC) (Austin, TX: American Meteorological Society).
REACH (2016). The FundiFix Model: Maintaining Rural Water Services. (Oxford, UK: University of Oxford).
Roy, D. P., Kovalskyy, V., Zhang, H. K., Vermote, E. F., Yan, L., Kumar, S. S., et al. (2016). Characterization of Landsat-7 to Landsat-8 reflective wavelength and normalized difference vegetation index continuity. Rem. Sens. Environ. 185, 57–70. doi: 10.1016/j.rse.2015.12.024
Sustainable WASH Systems Learning Partnership (2020). Maintenance Approaches to Improve the Sustainability of Rural Water Supplies (Washington, DC: USAID).
Tapley, B., Bettadpur, S., Watkins, M., and Reigber, C. (2004). The gravity recovery and climate experiment: mission overview and early results. Geophys. Res. Lett. 31:L09607. doi: 10.1029/2004GL019920
Thomas, E. A., Needoba, J., Kaberia, D., Butterworth, J., Adams, E. C., Oduor, P., et al. (2019). Quantifying increased groundwater demand from prolonged drought in the East African Rift Valley. Sci. Total Environ. 666, 1265–1272. doi: 10.1016/j.scitotenv.2019.02.206
Thomson, P., Bradley, D., Katilu, A., Katuva, J., Lanzoni, M., Koehler, J., et al. (2019). Rainfall and groundwater use in rural Kenya. Sci. Total Environ. 649, 722–730. doi: 10.1016/j.scitotenv.2018.08.330
Turman-Bryant, N., Nagel, C., Stover, L., Muragijimana, C., and Thomas, E. A. (2019). Improved drought resilience through continuous water service monitoring and specialized institutions–a longitudinal analysis of water service delivery across motorized boreholes in northern Kenya. Sustainability 11, 1–16. doi: 10.3390/su11113046
Uhe, P., Philip, S., Kew, S., Shah, K., Kimutai, J., Mwangi, E., et al. (2017). Attributing drivers of the 2016 Kenyan drought. Int. J. Climatol. 38, e554–e568. doi: 10.1002/joc.5389
Venton, C. (2018). Economics of Resilience to Drought–Kenya Analysis. Technical report, USAID Center for Resilience.
Wahr, J., Swenson, S., Zlotnicki, V., and Velicogna, I. (2004). Time–variable gravity from GRACE: first results. Geophys. Res. Lett. 31:L11501. doi: 10.1029/2004GL019779
Wang, L., and Qu, J. J. (2009). Satellite remote sensing applications for surface soil moisture monitoring: a review. Front. Earth Sci. China 3, 237–247. doi: 10.1007/s11707-009-0023-7
Keywords: drought, groundwater, climate data, East Africa, drip
Citation: Thomas EA, Kathuni S, Wilson D, Muragijimana C, Sharpe T, Kaberia D, Macharia D, Kebede A and Birhane P (2020) The Drought Resilience Impact Platform (DRIP): Improving Water Security Through Actionable Water Management Insights. Front. Clim. 2:6. doi: 10.3389/fclim.2020.00006
Received: 28 April 2020; Accepted: 10 August 2020;
Published: 02 November 2020.
Edited by:
Walter Lee Ellenburg, University of Alabama in Huntsville, United StatesReviewed by:
Catherine Vaughan, Columbia University, United StatesUdit Bhatia, Indian Institute of Technology Gandhinagar, India
Copyright © 2020 Thomas, Kathuni, Wilson, Muragijimana, Sharpe, Kaberia, Macharia, Kebede and Birhane. This is an open-access article distributed under the terms of the Creative Commons Attribution License (CC BY). The use, distribution or reproduction in other forums is permitted, provided the original author(s) and the copyright owner(s) are credited and that the original publication in this journal is cited, in accordance with accepted academic practice. No use, distribution or reproduction is permitted which does not comply with these terms.
*Correspondence: Evan A. Thomas, ZXZhbi50aG9tYXNAY29sb3JhZG8uZWR1