
94% of researchers rate our articles as excellent or good
Learn more about the work of our research integrity team to safeguard the quality of each article we publish.
Find out more
ORIGINAL RESEARCH article
Front. Chem., 17 April 2025
Sec. Inorganic Chemistry
Volume 13 - 2025 | https://doi.org/10.3389/fchem.2025.1536383
This article is part of the Research TopicThe landscape of the Metal Complexes: Relevant Properties and Potential ApplicationsView all 4 articles
 Ban H. Al-Tayyem1Philipp Müscher-Polzin1Kanupriya Pande2Oleksandr Yefanov2Valerio Mariani2Anja Burkhardt3Henry N. Chapman2,4,5
 Christian Näther1Michael Braun1Marvin Radke1Steve Waitschat1
 Kenneth R. Beyerlein2*†
 Huayna Terraschke1*
Despite wide application of lanthanide complexes in solar cells, light-emitting diodes and sensors, their crystallization mechanisms have not been studied in detail. Further investigations of this kind can lead to the development of targeted synthesis protocols and tailoring of their structure-related physical properties. In this work, the structural evolution during the synthesis of the luminescent [Tb (bipy)2(NO3)3] (bipy = 2,2′-bipyridine) complex is studied by monitoring the ligand-to-metal energy transfer through in situ luminescence measurements combined with synchrotron-based X-ray diffraction (XRD) analysis. These experiments reveal an interesting crystallization pathway involving the formation of a reaction intermediate that is dependent on parameters such as ligand-to-metal molar ratios. In addition, the structure of [Tb (bipy)2(NO3)3] is solved from serial crystallography data collected at a microfocused synchrotron X-ray beamline. This is an emerging technique that can be used to interrogate individual crystallites and overcome beam damage effects. The resulting structure is found to correspond to that determined by classical single crystal XRD, and a perspective on realizing future in situ measurements of this type is given. This work therefore describes multiple advancements combining crystallite-specific diffraction probes and in situ techniques to track the synthesis kinetics of luminescent materials.
The worlds growing energy and technological demands requires the synthesis of new functional materials (Kuznetsov and Edwards, 2010). While it is well known that material properties are strongly dependent of their crystal structure, structure determination and control of the crystallization process can be a bottleneck in materials development. Despite the many advantages of single-crystal and in situ powder X-ray diffraction measurements, these techniques have required samples to be highly crystalline to follow the crystallization processes, with a large crystal size for structure determination. We will present two techniques to complement these approaches, namely, serial crystallography (Nam, 2020) for solving inorganic small molecule crystal structures and in situ measurements for monitoring the crystallization pathway (Terraschke et al., 2018; Lindenberg et al., 2019).
Serial X-ray crystallography involves the use of a bright, tightly focused X-ray source, collecting a large set of short-exposure diffraction patterns and using the intensities merged from thousands of snapshot diffraction images from different crystallites to solve the structure (Chapman et al., 2011; Boutet et al., 2012). Such macromolecular structure solution has been shown to be possible from small crystals (Gati et al., 2017), and by de novo phasing (Barends et al., 2014; Yamashita et al., 2015; Colletier et al., 2016). Furthermore, it has been used to investigate the light-induced dynamics of photoactive proteins (Tenboer et al., 2014; Barends et al., 2015; Nango et al., 2016) and diffusion-limited reactions of macromolecules with ligands (Stagno et al., 2017; Kupitz et al., 2017; Beyerlein et al., 2017a). This approach has been recently extended to small-molecule serial femtosecond X-ray crystallography (smSFX), which has allowed for the structure solution of radiation sensitive inorganic complexes (Schriber et al., 2022; Aleksich et al., 2023) and study of their light-induced atomic dynamics (Kang et al., 2024; Støckler et al., 2023).
Monitoring the formation of solid materials in situ is important for unraveling the phenomena behind the crystallization process (Derelli et al., 2024; Embrechts et al., 2018; Pienack and Bensch, 2011; Keilholz et al., 2023). Important examples of such phenomena are the desolvation of ions in solution and their incorporation by the formed nuclei as well as formation of reaction intermediates during phase transitions. This knowledge combined with the influence of synthesis parameters such as reagent concentrations or reaction temperature on the phenomena listed above are essential for controlling and improving structure-related properties of functional materials (Pienack et al., 2016; Arana et al., 2017; Rönfeldt et al., 2020; Pienack et al., 2018). Important examples of functional materials are luminescent complexes (Suckert et al., 2017; Neumann et al., 2017; Cotton et al., 2003; Cotton and Raithby, 2017), crucially important for technological and biomedical applications such as production of light-emitting diodes (LEDs) (Li et al., 2020) fluorescent chemosensor (Cable et al., 2013; Binnemans, 2009; Zhou et al., 2020), medical diagnostic (Heffern et al., 2014; Bünzli, 2010; Dong et al., 2015; Wen et al., 2019) and treatment (Marturano et al., 2019). They have been widely studied due to their unique photoluminescent properties, i.e., sharp emission lines, long lifetime and the ability to emit light in the visible region (Binnemans, 2009). For example, the luminescent complex [Tb (bipy)2(NO3)3] was first synthesized in 1969 and its unit cell was studied by single crystal X-ray diffraction collected by the Weissenberg method. [Tb (bipy)2(NO3)3] was found to crystalize in Pbcn orthorhombic space group with Z = 4. In this complex, Tb3+ ions have 10-fold coordination with four nitrogen from the two bidentate bipyridine ligands and with three bidentate nitrate groups (Moss and Sinha, 1969).
We report on the synthesis, spectroscopy and structure of the compound [Tb (bipy)2(NO3)3]. Here, we have solved the structure of the compound as a model system from a serial crystallography measurement of an ensemble of microcrystals. Our [Tb (bipy)2(NO3)3] structure is found to agree with that found from new single crystal X-ray diffraction analysis of crystals of approximately 1 mm. This affirmation demonstrates the large data volume needed for ab initio direct methods structure solution of inorganic compounds. Presented data on the obtained unit cell distribution in the ensemble also suggests how information about the homogeneity and purity of a powder sample can be obtained from such a measurement. In addition, the synthesis of this compound is studied using in situ fluorescence spectroscopy and synchrotron-based powder X-ray diffraction. We then conclude the article with a perspective of combining serial and fluorescence measurements to track the synthesis of such compounds in situ. Such a crystallite-sensitive tracking of a reaction could offer new insights into materials synthesis and how to govern their crystallization processes.
2,2ʹ-Bipyridine (99+%, Alfa Aesar GmbH and Co. KG, Karlsruhe, Germany) and Tb(NO3)3·5H2O (99.99%, Abcr, Karlsruhe, Germany) were of analytical grades and used as received without further purification.
[Tb (bipy)2(NO3)3] was firstly synthesized ex situ (Table 1, Experiment 1) by adding 4 mL of the 2,2ʹ-bipyridine solution (100 mM) to a 4 mL of Tb(NO3)3·5H2O solution (50 mM). The resultant solution was left to react at room temperature until the product precipitated as colorless crystals (0.1038 g, yield 79%).
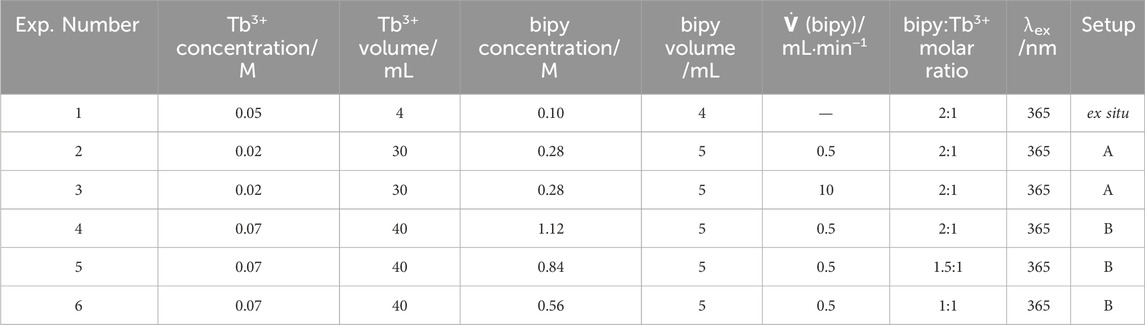
Table 1. Experimental conditions for elucidating the formation mechanism of the [Tb (bipy)2(NO3)3] complex, in situ applying setups A (University of Kiel) or B (DESY P08 beamline) as well as ex situ.
[Tb (bipy)2(NO3)3] was synthesized using a simplified co-precipitation method as described in our reported studies (Polzin et al., 2018). The analytical study of the complex formation was performed in situ using different monitoring techniques under different synthetic parameters (Table 1, Experiments 2-6). All experiments were executed in a glass reactor at room temperature, in which the metal precursor was dissolved in ethanol and stirred at 500 rpm. The ethanolic ligand solution was then controllably added to the metal solution at rates of 0.5 or 10 mL min−1. At predetermined times, samples were removed from reaction vessel for further ex situ analysis, the samples collected were directly quenched, centrifuged and dried at 80°C for 2 h. The in situ study was carried out using two different setups as we previously reported (Ströh et al., 2023; Ströh et al., 2024). Experiments using Setup A (Table 1, Experiment 2-3) were carried out at Kiel University while experiments using Setup B (Supplementary Table S1, Experiment 4-6) were conducted at the P08 beamline of the Deutsches Elektronen-Synchrotron (DESY).
Setup A combines in situ measurement of pH value, ionic conductivity and in situ luminescence. In this setup, the simultaneous in situ measurements were conducted using an EasyMax® 102 (Mettler Toledo, Gießen, Germany) synthesis workstation. This workstation granted automatic control over the reaction parameters, e.g. the solution addition rate, reaction temperature and stirring speed. Additionally, it allowed simultaneous multiparameter monitoring of the solution pH value and ionic conductivity. The in situ luminescence measurements were recorded using portable EPP 2000 (StellarNet Inc., United States) spectrometer equipped with a charge-coupled device (CCD)-based detector and a FL322 Fluorolog-3 spectrofluorometer (HORIBA Jovin Yvon GmbH, Unterhaching, Germany), which contains an R928P Photomultiplier, iHR-320-FA triple grating imaging spectrograph and a 450 W xenon lamp. The detectors were attached to an optical fiber, which was submerged into the reactor solution while the reactor was irradiated by UV light-emitting diodes (LEDs) with a wavelength of 365 nm (Sahlmann Photochemical Solutions, Germany).
In Setup B (see Supplementary Figures S1, S2, supporting information), the in situ XRD and in situ luminescence measurements were simultaneously recorded. The XRD structural analysis was obtained using an in situ synchrotron-based crystallography technique. Radiation of 25 keV photon energy penetrated the glass reactor walls and the reaction solution, enabling these measurements. Additionally, the reactor was specially designed to have an indented tube in one of its walls to decrease the radiation pathway length through the reaction volume. This reactor was positioned in a holder containing two openings for the transmission of X-ray radiation, as well as a third large opening for the UV-light excitation source (Pienack et al., 2016). The setup contained an integrating stirring system and a ground plate that fits different beamlines without necessitating readjustment after each reaction. The X-ray outlet was equipped with an aluminum window, which Bragg peaks served as an external standard for normalizing the intensities of the XRD patterns and correcting for the intensity fluctuation of the X-ray beam. In situ XRD measurements were recorded in a transmission geometry every 30 s. At P08 (25 keV, λ = 0.04959 nm), a PerkinElmer XRD1621 detector (PerkinElmer Technologies, Walluf, Germany, 2048 × 2048 pixels, x pixel size of 200.00 mm, and y pixel size of 200.00 mm) was applied. In this setup, the in situ luminescence measurements were recorded using the same EPP2000 spectrometer and light sources applied in setup A. However, the reaction volume used in Setup B experiments was increased to 40 mL to reach the minimum solution height required for accurate in situ XRD measurements. The volumes and concentrations of the solutions used in this work are summarized in Table 1.
For the ex situ characterization, luminescence spectra were measured using a Fluorolog-3 with a R928P photomultiplier, whereas ex situ XRD patterns were recorded using a STOE Stadi-p powder diffractometer (Cu-Kα1 radiation, λ = 1.540598 Å) equipped with a Ge monochromator and a DECTRIS® MYTHEN 1K detector (DECTRIS, Baden-Daettwil, Switzerland). Additionally, the reflection spectra were measured at room temperature with Varian Techtron PtyUV/Vis/NIR two-channel Cary 5,000 spectrometer using BaSO4 as a reference. The single-crystal XRD analysis was performed using an IPDS-2 diffractometer (STOE and Cie GmbH, Darmstadt, Germany) with Mo-Kα radiation (λ = 0.71073 Å).
A sample was crystallized to the final product according to the protocol described in Section 2.2.2. This resulted in a powder with an average agglomerate size of approximately 1 µm.
A serial crystallography dataset was measured at beamline P11 (20 keV, λ = 0.062 nm) of the PETRA III synchrotron (Burkhardt et al., 2016). The dry sample was fixed between 2 strips of polyimide tape that were each 6 mm wide and 12 µm thick (Caplinq, Netherlands). A uniform and dilute coverage of the sample powder was achieved by dusting it onto the sticky side of the tape and pulling off excess powder with another piece of tape. This process was followed to prepare a 2-m length of tape with [Tb (bipy)2(NO3)3] that was then affixed to a roll of non-sticky polyimide tape. This was mounted onto a tape drive device installed at the beamline that has been also used to conduct serial crystallography measurements of proteins (Beyerlein et al., 2017a). A schematic of the measurement geometry is shown in Figure 1.
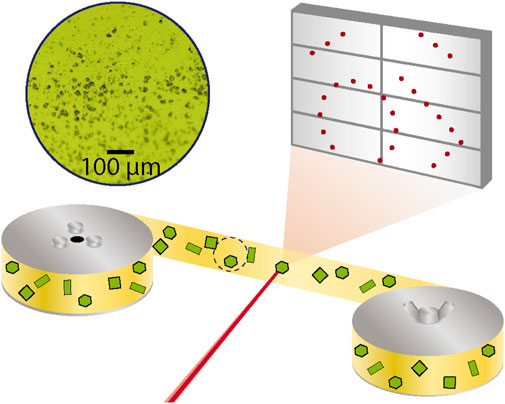
Figure 1. Serial crystallography measurement using polyimide tape drive. The red X-ray beam is focused onto a yellow polyimide tape that is strung between two rollers and contains green [Tb (bipy)2(NO3)3] crystals affixed to it. The diffraction from a crystal is measured in transmission on a large grey 2D detector. A microscopic image of such a tape that was used for the measurement is shown.
The measurement was conducted with the sample at room temperature and using a 20 keV X-ray beam focused to 4 × 8 µm with a flux of 1013 photons/second. The sample tape was then fed through the tape drive device translating crystals through the X-ray focus at a constant rate of 0.7 mm/s. A spinning metal disc with holes in it served as an X-ray beam chopper and was installed upstream from the X-ray focusing optics and provided an exposure time of 9.3 ms at a repetition rate of 10 Hz. A Pilatus 6M detector was synchronized with the X-ray exposure and the resulting detector frames were saved for later evaluation. A live analysis of the fraction of recorded images found to contain a diffraction pattern (hit fraction) was made using the OnDA software (Mariani et al., 2016). A hit fraction around 50% was controlled during the experiment by changing the sample coverage density on the tape. When the end of the prepared sample tape was reached, the tape was rewound, translated a few beam diameters away from the previous height and fed through again. This rastering was repeated until the full width of the sample tape was scanned, after which another sample was prepared.
After the dataset was collected, the raw data images were again analyzed to sort out the diffraction images from blanks using a program called OffDA. Then the refined hit images were indexed using the indexamajig program of CrystFEL (White et al., 2012; White et al., 2013; White, 2014; White et al., 2016). Initially, this was used to index the patterns without providing unit cell information to the auto-indexing program DIRAX (Duisenberg, 1992). A dominant lattice consisting of a primitive orthorhombic cell with constants of a = 16.71 Å, b = 9.14 Å and c = 15.07 Å was found. This cell was then given as input to the FELIX indexer (Beyerlein et al., 2017b), which can independently index the patterns from multiple crystals in a snapshot image. The parameters of FELIX were then optimized to maximize the number of indexed crystals from the measured “hit” images. This resulted in a total of 288,396 indexed crystals in 186,432 frames, an average of 1.5 crystals per indexed frame. An overview of other dataset statistics is given in Table 2.

Table 2. Serial crystallography dataset statistics.
The integrated intensities from the indexed crystals were then merged using the CrystFEL program process_hkl assuming the mmm Laue class. The self-consistency of the merged intensities was quantified by randomly sorting the indexed crystals into two datasets of equal length and merging them independently. The difference between these datasets can then be quantified by calculating
The merged intensities were analyzed by the program XPREP (Bruker) and the most likely space group was found to be Pbcn. The structure was then solved ab initio using shelxt (Sheldrick, 2015) and refined in the program olex2 (Dolomanov et al., 2009) using the olex2.refine program.
The distribution of unit cell parameters determined from each indexed pattern is shown in Figure 2A and is in good agreement with those determined from the single crystal structure described later. The trend of the data quality metric Rsplit in Figure 2B shows that the merged intensities in the final dataset converged for scattering vector magnitudes below 14 nm−1. This was then used as a cutoff to define the reflection dataset used in structure solution. The dataset had 100% completeness in this range and a view of the merged intensities in the a*-b* reciprocal space plane is shown in Figure 2C. The structure of [Tb (bipy)2(NO3)3] determined ab initio from this dataset (pastel colors) is overlayed in Figure 2D with the single crystal structure described in detail in Section 3.2 (primary colors). From this figure it is seen that the atomic coordinates of the two structure solution methods are in good agreement, however, the anisotropic atomic displacement parameters of the serial crystallography structure are slightly larger. A higher sample temperature during the serial crystallography measurement (298 K) compared to the single crystal measurement (170 K) can partially explain this discrepancy. This could also be caused by merging intensity data from many crystals, which can combine different structural disorder found in each crystal.

Figure 2. [Tb (bipy)2(NO3)3] Serial Structure Solution. (A) The distributions of orthorhombic unit cell parameters found by indexing frames without symmetry input are shown. (B) The trend of Rsplit for the merged intensities is shown along with a dashed line denoting the cutoff used on the reflection list. (C) A cross-section of the merged reflections through the h-k plane of reciprocal space, generated using the CrystFEL render_hkl program. Each spot represents an hkl reflection with the color representing the structure factor [sqrt(I)] according to the normalized color scale shown. (D) Structure comparison. The atomic anisotropic displacement isosurfaces obtained from serial crystallography (pastel colors) are overlayed onto those obtained from of the single crystal structure refinement (RGB colors).
As detailed in Table 2, the dataset used to solve the serial crystallography structure was formed from merging diffraction patterns from more than 288,000 crystallites. This required the collection of more than 890,000 patterns, which took more than 24 h of measurement time. When just 10,000 crystals from the serial dataset were merged and used to solve the structure, an incorrect space group of Pna21 and a higher refined R-metric around 6% was found. Furthermore, the anisotropic thermal displacement parameters of the carbon atoms in the bipyridine ligands were double what was refined in the final structure. The temperature factors of other room temperature metal-bipyridine complex structures deposited in the Cambridge Structural Database were found to be in good agreement with those refined in the final structure.
This large amount of data was critical to obtaining an accurate structure as preliminary datasets prepared using fewer crystals resulted in structures with carbon and oxygen atoms missing in some places from ligands. Positional information about the Tb3+ center was possible with less data, however, the anisotropic displacement parameters of Tb3+ were found to be abnormally large. It should be noted that a higher number of crystals could be necessary for the solution of precursors or possible unknown intermediate phases with a decreased crystallite size and crystal quality, as in such cases the intensity of high-resolution Bragg reflections will be lower. This information is important for the design of future experiments to determine the nature of the early precursor phases suggested by our in situ optical measurements described below.
The necessity to merge data from almost 300,000 crystals presents a major challenge to performing in situ serial crystallography experiments to study these phases. Nonetheless, this result motivates efforts to develop instrumentation to increase the data collection speed and analysis routines to reduce the amount of data necessary to solve inorganic structures ab initio by serial crystallography. Faster collection is possible at modern XFEL facilities such as European XFEL and LCLS-II that have average repetition rates ranging from kHz to MHz. At this rate 890,000 patterns can be collected in a matter of seconds to minutes, allowing for a series of time points tracking the evolution of intermediate states to be collected in a few hours. However, our study also shows that the analysis of smSFX data is dramatically simplified when an X-ray photon energy above 15 keV is used. Compared to the sparse data collected from previous smSFX experiments (Schriber et al., 2022; Beyerlein et al., 2015), the resulting diffraction patterns contain enough Bragg spots and high-resolution information to use already developed auto-indexing and structure solution algorithms. The optimization of in situ serial crystallography experiments of this kind may require the high photon energies of 15–25 keV becoming available at superconducting-linac XFEL facilities. A new approach of convergent-beam serial crystallography provides the potential to access a reciprocal space volume of 50 times or more than with a collimated beam, in a single shot (Chapman et al., 2024). The patterns obtained using highly focused beams contain many more Bragg reflections, overcoming the problem of indexing sparse patterns and providing fully-integrated intensities. The approach is suitable for synchrotron and XFEL beamlines.
To confirm the serial crystallography results, [Tb (bipy)2(NO3)3] was synthesized ex situ (Table 1, Experiment 1), and its crystal structure of was solved by single crystal XRD analysis (Supplementary Tables S1–S3). As shown in Table 3, the unit cell parameters obtained by serial crystallography and single crystal XRD were similar and in agreement with previously reported results (Moss and Sinha, 1969). [Tb (bipy)2(NO3)3] crystallizes into the orthorhombic
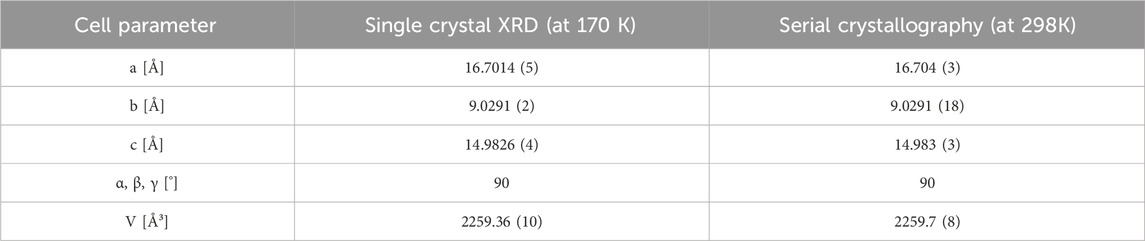
Table 3. Cell parameters of [Tb (bipy)2(NO3)3] obtained by conventional single crystal XRD and serial crystallography in comparison.
Moreover, [Tb (bipy)2(NO3)3] composition was confirmed by CHN elemental analysis (Supplementary Table S4). The calculated elemental composition for Tb(C10H8N2)2(NO3)3 was: C, 36.6%; H, 2.5%; N, 14.9%, whereas the elemental composition found showed no significant difference from that calculated and was: C, 36.2%; H, 2.5%; N, 15.0%. In this complex, the central ion Tb+3 is coordinated 10-fold, as three nitrate ligands are attached to the metal centre via six oxygen ions and two 2,2'-bipyridine molecules via nitrogen (Figure 3; Supplementary Figure S3). The binding distances between the complex centre and the ligands as well as detailed crystallographic information are listed in Supplementary Tables S5, S6. The lengths correspond to the values known in literature (Moss and Sinha, 1969) and also show good similarity to the values of the [Eu (bipy)2(NO3)3] complex (Supplementary Table S10) (Cotton et al., 2003; Cotton and Raithby, 2017). Supplementary Figure S4 shows also the good agreement of the measured diffraction pattern for Experiment 1 with the calculated pattern resulting from the single crystal structure solution.
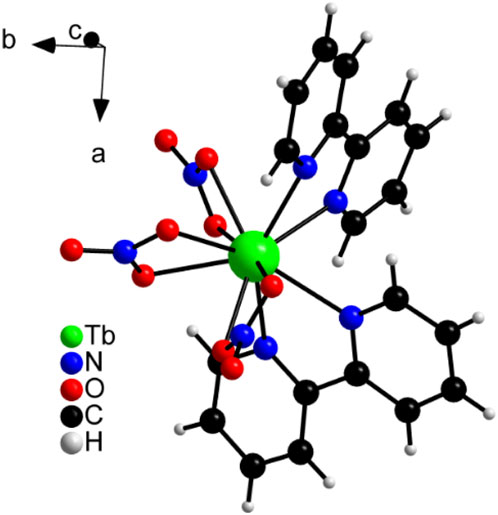
Figure 3. View of the Tb3+ coordination in the crystal structure of [Tb (bipy)2(NO3)3].
Therefore, the structure of [Tb (bipy)2(NO3)3] solved by direct methods from serial crystallography measurements described in Section 3.1 is in good agreement with the structure determined by single crystal measurements.
[Tb (bipy)2(NO3)3] was first synthesized ex situ in ethanol, as described in detail in the experimental section (Experiment 1, Table 1). The synthesized crystals were colorless under daylight, and showed green luminescence upon irradiation with UV light (λex = 330 nm) (Figure 4). This photoluminescence behavior can be explained by studying the excitation and emission spectra of [Tb (bipy)2(NO3)3] crystals (Figure 5).

Figure 4. Synthesized [Tb (bipy)2(NO3)3] illuminated with ambient (left) and UV light (right).
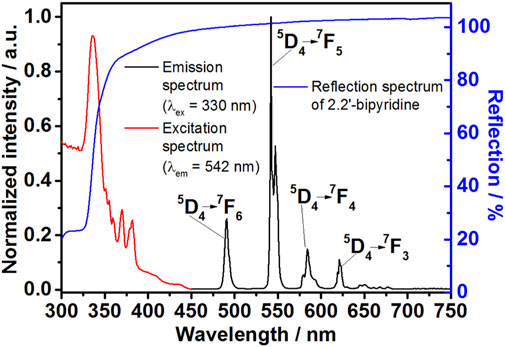
Figure 5. Optical reflectance of 2,2′-bipyridine (blue curve), excitation (λem = 542 nm, red curve) and emission (λex = 330 nm, black curve) spectra of [Tb (bipy)2(NO3)3] crystals.
The emission spectrum (λex = 330 nm) of [Tb (bipy)2(NO3)3] crystals indicates that the characteristic emission peaks due to the 5D4→ 7F3-6 electronic transitions are accountable for this compound green luminescence (Ströh et al., 2019). In the emission spectrum, the typical Tb3+ emission lines are observed at 491 nm (5D4 → 7F6), 542 nm (5D4 → 7F5), 589 nm (5D4 → 7F4), and 621 nm (5D4 → 7F3) (Figure 5, black curve). The excitation spectrum (λem = 542 nm) of the complex shows a series of excitation bands belonging to the Tb3+ and 2,2′-bipyridine electronic transitions at 350–375 and 320–350 nm, respectively (Figure 5, red curve). The reflectance spectrum of pure 2,2′-bipyridine shows that the ligand reflects light strongly in the visible range (400–750) and weakly in the UV region (<350 nm, Figure 3, blue curve). This observation implies that the complex strong absorption in the UV region is a consequence of 2,2′-bipyridine high absorbance in the same region.
The ligand-to-metal energy transfer is detected in the excitation spectrum as a broad strong absorption band with a maximum located at 336 nm (λem = 542 nm), assigned to the ligand π−π* transition. This transition is also observed in the 2.2′-bipyridine reflectance spectrum as a strong absorption in the UV region (Figure 5, blue curve). In contrast, the electronic transitions of Tb3+ ions appear in the excitation spectrum as a series of less intense narrower peaks. This difference in intensities signifies that the ligand-to-metal energy transfer is the primary factor responsible for the [Tb (bipy)2(NO3)3] photoluminescence behavior. Herein; the energy is absorbed by the ligand and transferred to Tb3+ ions resulting in metal ion sensitization and emission peaks intensification (Hasegawa et al., 2018). In detail, Zahariev et al. (2021) used density functional theory (DFT)-based approaches to investigate the energy transfer between heterocyclic nitrogen donor chelating antennae and Tb3+, revealing the S0→S1→T2→T1→5D4 excitation channel behind the sensitization pathway leading to light emission.
In this work, rationalization of [Tb (bipy)2(NO3)3] crystallization mechanism was achieved by tailoring its reaction pathway. For this purpose, the influence of the following reaction aspects was investigated: (i) addition rate of the ligand to the metal solution, (ii) initial reactants’ concentrations and (iii) ligand-to-metal ratio.
Figure 6 shows typical results obtained for monitoring the crystallization of the terbium complex by in situ luminescence analysis of coordination sensor (ILACS) (Ruiz Arana et al., 2019), in situ measurements of pH value and ionic conductivity (Experiment 2, Table 1). Before beginning the reaction (t < 0 min), in situ luminescence spectrum of Tb(NO3)3·6H2O ethanolic solution showed broad low-intensity emission peaks due to the Tb3+ electronic transitions within the 4f-shells (Figure 6A). At the time t = 0 min, the splitting behavior and intensities of the emission peaks assigned to the 5D4→7F6-3 transitions were governed by the strong quenching effect caused by the protic solvent molecules (Beeby et al., 1999). As discussed in detail by Di Bernardo et al. (2012), trivalent lanthanide ions are hard acids and have a strong affinity for charged ligands or neutral O- and N-donors. During complex formation, ligand coordination to metal ions in solution competes with solvation of the species involved in the reaction, which is highest for cations. Herein, ethanol-Tb3+ interaction occurs within the Tb3+ coordination sphere, where the luminescence quenching is a consequence of the solvents’ overtone vibrational transitions (Huang et al., 2018). At the early stage of the reaction (t < 7 min), a slight decrease in the luminescence intensity of the 5D4→7F6-3 transitions was observed (see Supplementary Figures S5–S7). This decrease is conceivably due to the dilution caused by the increase in the solution volume.
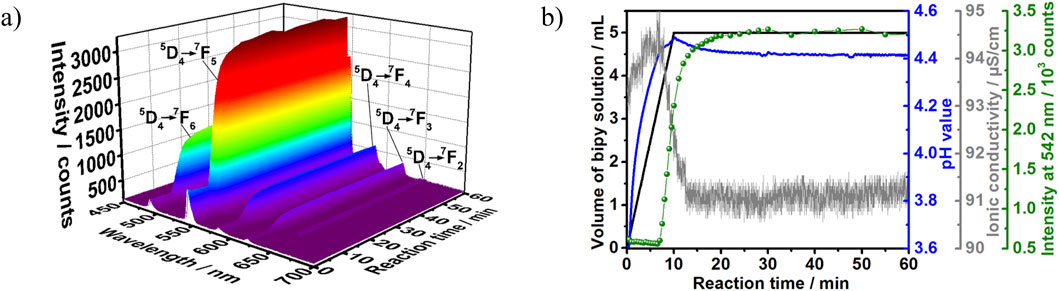
Figure 6. (A) 3D representation of the in situ luminescence spectra (λex = 365 nm) recorded during the synthesis of [Tb (bipy)2(NO3)3] at a ligand addition rate of 0.5 mL/min. (B) Respective time-dependence of the addition volume of the 2,2′-bipyridine to Tb3+ solutions (black), the pH value (blue), the ionic conductivity (grey) and the normalized emission intensity of the 5D4→7F5 Tb3+ transition (green) (Exp. 2, Table 1).
To gain precise insights into the crystallization process, the changes in green emission located at 542 nm was followed, assigned to the 5D4→7F5 electronic transition (Manzur et al., 2020; Huang et al., 1999) (Figure 6B, green curve). Upon the ligand solution addition, the luminescence intensity of the 5D4→7F5 transition remains nearly constant up to t = 7 min. However, a sharp increase in intensity at t > 7 min was recorded; this observation indicates that the reaction requires approximately 7 min induction time to start the product formation. In detail, at t = 7–12 min and a constant addition rate of the ligand solution, a rapid growth in luminescence intensity was observed. This rise reflects a transformation in the solvation shell surrounding Tb3+ ion caused by both the desolvation process and the ligand-to-metal energy transfer process. In this stage, the ligand molecules gradually exchange ethanol molecules in Tb3+ local coordination environment, which promotes the increase in the Tb3+ ion luminescence during the product formation stage. At t = 12–26 min, the luminescence intensity of the 5D4→7F5 transition continued to increase however slowly. At t > 26 min, the emission intensity stabilized indicating the equilibrium state of the reaction and the end of the crystallization. The powdered sample was then washed, dried and subjected to XRD analysis.
To achieve a better understanding of the product formation mechanism, the splitting behavior of the luminescence peaks was investigated as well. At the early stage of the reaction (t < 7 min), the recorded luminescence spectrum showed a series of broad asymmetrical emission peaks corresponding to the 5D4→7F6-3 transitions of Tb3+ ion, these intensities were located in the range from 480 to 530 nm and showed no significant splitting pattern due to their reduced intensity and consequently low spectral resolution (see also Supplementary Figures S5–S7). As the crystallization reaction starts (t > 7 min), the emission peak corresponding to the 5D4→7F5 transition (λem = 542 nm) presented a twofold split and a threefold split was observed for the transition 5D4→7F4 (λem = 583 nm). According to Dalal et al. (2019), there is no pure magnetic dipole allowed transition in the emission spectrum of Tb3+. Therefore, the split of the emission peak assigned to 5D4→7F5 could be explained by electric dipole contributions within this electronic transition. Changes in the split of the emission peaks assigned to the 5D4→7F6 transition are less clear, most likely because of the greater overlap between them due to the high number of sublevels due to the respective high J values. This one-step transformation in the splitting pattern at t = 7 min implies that the Tb3+ ion was exposed to two different coordination environments during the course of reaction, namely in the solvation shell and within the product lattice. In this context, it is important to mention that the split pattern observed in situ for t > 7 min coincides to the one of the final product recorded ex situ, discussed in Figure 5. Therefore, the time range from t = 0–7 min correlates to the replacement of solvent molecules by the ligand in the Tb3+ inner sphere and the product was formed under these synthesis conditions via a single-step transformation mechanism. It can be also noticed that the splitting becomes stronger and clearer throughout the reaction. This is due to the change in Tb3+ local symmetry during the product formation and the time-dependent increase in the ligand-to-metal energy transfer caused by the increase in the luminescent product concentration (Supplementary Figure S6). Besides the splitting behavior, changes in the intensity ratio (I) of the 5D4→7F5 (magnetic dipole transition) to the 5D4→7F6 (electric dipole transition) can also indicate changes in Tb3+ ion local symmetry (Manzur et al., 2020). The forced electric dipole 5D4→7F6 transition is forbidden in the free lanthanide ion state (Bao et al., 2018) and its intensity is highly suppressed when Tb3+ occupies a high symmetry site (Yin et al., 2017). However, the time-dependent change in the ions coordination sphere during the product formation decreases the local symmetry, which results in an increase in 5D4→7F6 peak height. Consequently, the increase in 5D4→7F6 transition emission intensity lowered the intensity ratio (I) as depicted in Supplementary Figure S7.
Additional deep insights are delivered by in situ measurements of the pH values, confirming the data obtained by the ILACS approach discussed above. The steady increase in the pH values at t < 7 min (Figure 6B) indicates a constant increase in the ligand concentration, which evidences the presence of the ligand as free basic bipy molecules in the solution and confirms the induction time before the formation of product. As the definition of pH is based on its measurement in water (Chan and Tan, 2016), the measurements carried out in this work on ethanol are valuable for showing trends due to the evolution of chemical reactions, but should not be considered as isolated absolute values. However, at t = 7–10 min, a deceleration in the pH curve is noticed despite the continuous addition of the ligand solution. Clearly, the shape of the pH curves at this period is a result of two simultaneous effects: the decrease of pH due to the product formation and the increase of the pH value due to the further addition of the solution. This decrease is associated with the ligand molecules consumption from the solution and the incorporation of these basic molecules into the complex formation. At t = 10–26 min, the pH curve steadily decreases then reaches a plateau at t > 26 min, indicating a decrease in the free bipy concentration due to the product formation followed by reaction completion at t > 26 min.
The simultaneously recorded ion conductivity measurement also confirmed the product formation indicated by the ILACS approach. Hence, a significant drop in the ionic conductivity was recorded at t = 7–12 min, indicating the uptake of the charge carriers from the solution due to the beginning of crystallization. Afterward, the ion conductivity curve (Figure 6B) shows continual decrease during the crystal growth stage (t = 10–26 min), followed by plateau at the end of the crystallization time (t > 26 min).
In an additional experiment for confirming the formation of [Tb (bipy)2(NO3)3], samples were collected from the reaction vessel at predetermined times and analyzed using ex situ X-ray diffraction analysis (Experiment 2, Supplementary Figure S8). Up to t = 5 min of the reaction time, no solid was formed in the reaction vessel, which is in agreement with the delayed crystallization indicated by the analogue in situ luminescence measurements (Figure 6A). Subsequently, further samples were collected in the time range from t = 5–60 min. The ex situ XRD pattern of the solid collected at t = 5 min indicates the presence of two crystalline phases, these phases were identified by comparison with the simulated diffraction patterns of the target product, generated by the structure solution reported in Section 3.2, and of the precursor Tb(NO3)3·6H2O (Moret et al., 1990) (Supplementary Figure S8). As the reaction proceeded, the reflections corresponding to the starting material decreased in intensities until t = 7 min and disappeared completely at t = 10 min, while the recorded Bragg reflections at, e.g. t = 12 and 60 min confirmed the product formation as a pure phase.
The influence of ligand addition rate on the crystallization mechanism is an important synthetic parameter to consider. In this work, the crystallization process was studied using the addition rates of 0.5 and 10 mL/min in Experiments 2 and 3, respectively (Table 1). In general, speeding up the addition rate of the ligand solution resulted in a reduced induction time. For instance, at the addition rate 0.5 mL/min, the offset of the luminescence intensity started only at t = 7 min, while under the accelerated addition rate (10 mL/min) this value remarkably shortened to 1 min (Figure 6A; Supplementary Figure S9).
Similar to Experiment 2 (Supplementary Figures S5, S6), the recorded in situ luminescence spectra for Experiment 3 showed a direct transformation in 5D4→7F5 transition splitting pattern (Supplementary Figure S10). Under the accelerated conditions, the emission intensity evolved from a broad emission peak to a twofold split indicating a direct single-step transformation mechanism between the Tb3+ ion in the solution and in the product, without the formation of reaction intermediates under these conditions. Also for this experiment, the ex situ X-ray diffraction analysis of samples collected during the synthesis confirmed the direct formation of the product at t = 2 min (Supplementary Figure S11).
The pH and ionic conductivity measurements (Supplementary Figure S12, blue and gray curves, respectively) showed comparable responses toward the accelerated product formation, the curves of these measurements showed similar behavior patterns under the studied addition rates (0.5 and 10 mL/min). However, the response times of these measurements shifted to shorter durations under the accelerated addition rate. To illustrate, under the addition rate 0.5 mL/min, the pH curve reaches a maximum at t = 10 min (Figure 6B), while under the addition rate 10 mL/min, this maximum shifted in time to t = 1.5 min (Supplementary Figure S12), this is due to fast increase in the ligand concentration in the solution.
Likewise, the in situ ionic conductivity measurement showed an analogous behavior. The drastic reduction in the ionic conductivity shifted in time from 7 min to 45 s upon changing the flow rate from 0.5 (Figure 6B) to 10 mL/min (Supplementary Figure S12), respectively. This also indicates that the accelerated addition rate results in an early uptake of the charge carriers from the solution and an early product formation. Building on these observations, it can be stated that the flow rate has a strong influence over the crystallization kinetics but less impact on the crystallization mechanism.
Ex situ XRD measurements are helpful for offering insights into the crystal structure of the formed compounds. However, information extracted from this approach was acquired for products that have been subjected to quenching, centrifuging and drying, which makes this analysis useful as a preliminary approach to analyze the crystallization duration but inadequate representative of the overtime structural evolution. Therefore, in situ synchrotron X-ray diffraction has been utilized for elucidating the stages of transformation occurring in the reactor under different reaction conditions and to explicitly avoid ex situ structural changes caused by the isolation and drying steps.
The findings obtained from our previous reported study on the crystallization process of [Eu (bipy)2(NO3)3] demonstrated that the formation of an intermediate phase depends strongly on the reactants’ concentrations (Polzin et al., 2018). This in situ study revealed that [Eu (bipy)2(NO3)3] crystallizes directly under diluted reaction conditions. On the other hand, an unknown crystalline intermediate was detected under high concentration conditions. This observed species was highly reactive and transformed completely to the target product via a solid-solid transformation mechanism during the reaction. Although a direct comparison between the stability of [Eu (bipy)2(NO3)3] and [Tb (bipy)2(NO3)3] is not possible due to the different experimental conditions used in the present and in the previous (Polzin et al., 2018) publications, Eu3+ complexes are generally expected to be slightly more labile than the Tb3+ ones. This fact is explained, for example, by the smaller ionic radius of Tb3+ and the increase in ion charge density (Raj, 2014). In the present article, time-resolved luminescence investigations of [Tb (bipy)2(NO3)3] formation revealed a single-step crystallization mechanism under the diluted conditions (Experiment 2, Table 1). Therefore, the influence of increasing the reactants’ concentrations to 300% (Experiment 4, Table 1) was consecutively studied here to evaluate the possibility of multistep crystallization pathway under high concentration conditions. Also, for the Tb3+ analog complex, the formation of [Tb (bipy)2(NO3)3] under the tested conditions (300%, Experiment 4, Table 1) was followed by ILACS and synchrotron X-ray diffraction analysis at PETRA III (P08 beamline). Simultaneously, variations in the solution turbidity were tracked monitoring changes in the in situ light transmission measurements. For these measurements, the used light source was positioned outside the reaction vessel while its intensity was recorded through an optical fiber immersed inside the vessel.
The ILACS characterization method offers the advantage of detecting luminescent species independent if they are dissolved, amorphous or crystalline. This feature was beneficial in our study of crystallization pathways in both diluted and concentrated systems in Experiments 2 and 4, respectively. Increasing the reactants’ concentration by 300% in Experiment 4 (Table 1) showed an impact over the luminescence onset time (Figure 7). As mentioned previously, under the diluted reaction conditions in Experiment 2 (100% reactants’ concentration, Table 1), 7 min were necessary for the 5D4→7F5 emission peak to exhibit a sharp increase in intensity. On the other hand, the threefold increase in concentration in Experiment 4 revealed a different time-dependent luminescence behavior. At t = 0–1.5 min, a slight increase in the 5D4→7F5 emission intensity was detected and kept constant until approximately t = 17 min (Figure 7). As the reaction proceeded, the intensity remarkably increased in the time range of t = 17–21 min showing two distinct growth rates for this reaction, indicating the formation of two different compounds.
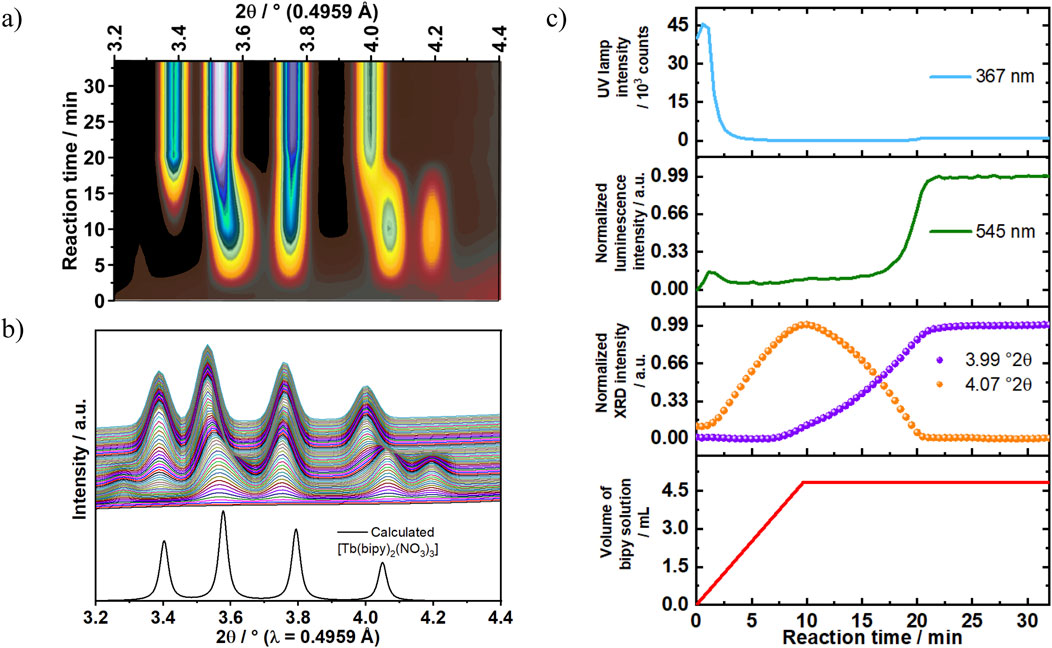
Figure 7. (A) In situ XRD patterns recorded at the P08 DESY beamline (λ = 0.4959 Å) are (B) compared to calculated diffraction patterns for [Tb (bipy)2(NO3)3] (ratio bipy:Tb = 2:1, Exp. 4). (C) Time-dependence of light transmission intensity at 367 nm (blue curve) and emission intensity of the Tb3+ 5D4→7F4 transition at 545 nm (green curve) are compared to simultaneous in situ XRD measurements at, e.g. 3.99° 2θ {violet doted curve, [Tb (bipy)2(NO3)3]} and 4.07°2θ (orange doted curve, intermediate) as well as the addition rate of the bipy solution to the reactor containing terbium (III) nitrate at 0.5 mL/min (red curve).
This effect of reactant concentration on the crystallization pathway can be also observed on the 5D4→7F5 transition splitting behavior. The reaction conducted under diluted reactants condition (100% reactants’ concentration, Experiment 2) showed a direct transformation from a single broad emission intensity to twofold split (5D4→7F5 transition). However, the 5D4→7F5 transition emission peaks recorded under the concentrated conditions (Experiment 4) showed a different time-dependent transition splitting behavior. As shown in Figure 8, the 5D4→7F5 transition peak was recorded in the range of λem = 537–553 nm with a maximum located at 542 nm. At the beginning of the reaction (t = 0 min), this intensity had a broad asymmetrical appearance with no observable split. As the reaction progressed, the emission intensity developed three peaks splitting pattern at t = 5 min. This pattern evolved afterwards into two peaks at t = 17 min and exhibited continuous intensity growth up to the end of reaction period. Interestingly, the observed three peaks splitting under the concentrated reaction conditions confirms a two-step crystallization mechanism. In the first step an unknown luminescent phase is formed with three-folds split, which therefore transformed to [Tb (bipy)2(NO3)3] in the second step. Unfortunately, isolating this phase by quenching experiments for ex situ characterization was not possible due to its low stability, also showing the importance of in situ analysis techniques.
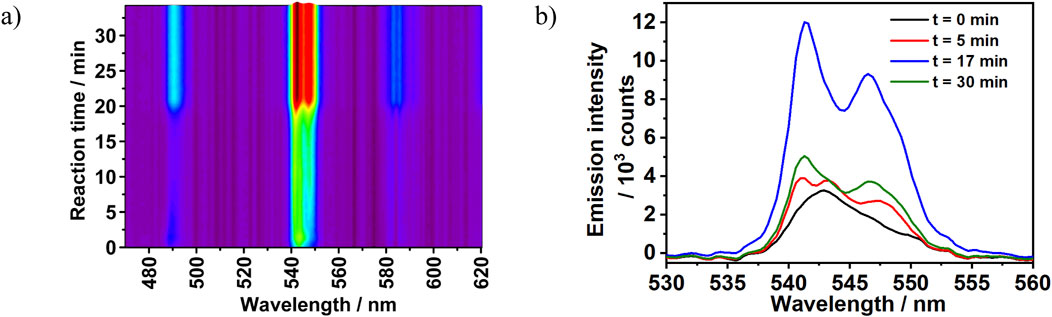
Figure 8. (A) In situ emission intensity (λex = 365 nm) recorded during the synthesis of [Tb (bipy)2(NO3)3] at 300% reactant concentration with the addition rate of 2,2′-bipyridine at 0.5 mL/min (Experiment 4). (B) Time-dependent changes in 5D4→7F5 splitting pattern recorded during the synthesis of [Tb (bipy)2(NO3)3] (ratio bipy:Tb3+ = 2:1, Experiment 4).
Besides the ILACS results, synchrotron-based in situ XRD and solution turbidity measurements also revealed the intermediate formation. During the first 2 min of Experiment 4, an increase in the Bragg reflection at a scattering angle of 2θ = 4.07° was detected by in situ XRD measurement. This reflection reached a maximum intensity at t = 10 min, followed by a complete decay at t = 21 min (Figure 7A). This behavior indicates the formation of an unknown crystalline intermediate during the reaction. This period was also assigned by ILACS measurement as the three-fold splitting pattern stage. However, despite of the increase in the Bragg reflection corresponding to the intermediate in the described period, no noticeable increase in the 5D4→7F5 transition emission intensity at 545 nm was observed. It implies that the generated intermediate is weakly luminescent species and that it has a greater impact on the 5D4→7F5 transition emission-splitting pattern (Figures 7, 8) than on the emission intensity. As the reaction proceeded, an increase in the Bragg reflection at 2θ = 3.99° was recorded at t = 7 min. This reflection reached a plateau at t = 21 min, showing an equilibrium state and the formation of a stable crystalline phase. This phase was identified as [Tb (bipy)2(NO3)3] by comparing the in situ XRD patterns to the calculated diffraction patterns obtained for [Tb (bipy)2(NO3)3] (Section 3.2. The time-dependent evolution of the Bragg reflection at 2θ = 3.99° follows a sigmoidal growth model, in which the crystalline intermediate is generated at the early stage of the reaction and then crystallizes into the product [Tb (bipy)2(NO3)3]. This model of transformation which is frequently observed in solid-state transformations (Pienack et al., 2009), additionally supports the two-step transformation mechanism indicated by the 5D4→7F5 transition emission-splitting behavior recorded by ILACS measurement. As the reflections correlated to the reaction intermediate reach complete decays, the reflections assigned to the product reach their maximums values, which confirms the conversion of the intermediate to product through a solid-solid transformation.
Additional results obtained by in situ monitoring changes in turbidity (Pienack et al., 2016) were found to be consistent with the result obtained by ILACS and XRD measurements (Figure 7). At t = 0–2 min, a slight increase in the light transmission was observed, this increase indicates a decrease in the solution turbidity caused by an initial dilution. As the reaction progresses, a strong decrease in the in the light transmission was recorded at the time range t = 2–3 min, demonstrating an increase in the solution turbidity and the beginning of solid compounds. It is worth noting that this time range (t = 2–3 min) associates with the induction time detected by in situ XRD measurement. At t = 3 min, the turbidity strongly increases, indicating the formation of the reaction intermediate, slightly decreasing upon its disappearance at t = 21 min.
Since increasing the reactants’ concentrations significantly influenced [Tb (bipy)2(NO3)3] crystallization pathways (Experiment 2 and 4), additional experiments were conducted in order to investigate the influence of the ligand-to-metal ratio (bipy:Tb3+) on the crystallization mechanism. In Experiments 5 and 6 (Table 1), the reaction was conducted using bipy:Tb3+ molar ratios of, respectively, 1.5:1 (Supplementary Figures S13–S15) and 1:1 (Supplementary Figure S16–S18). As shown in Figure 9, reducing the bipy:Tb3+ ratio below to the stoichiometric one necessary for the [Tb (bipy)2(NO3)3] formation (2:1), systematically delayed the formation of the product and prolonged the existence of the intermediate.
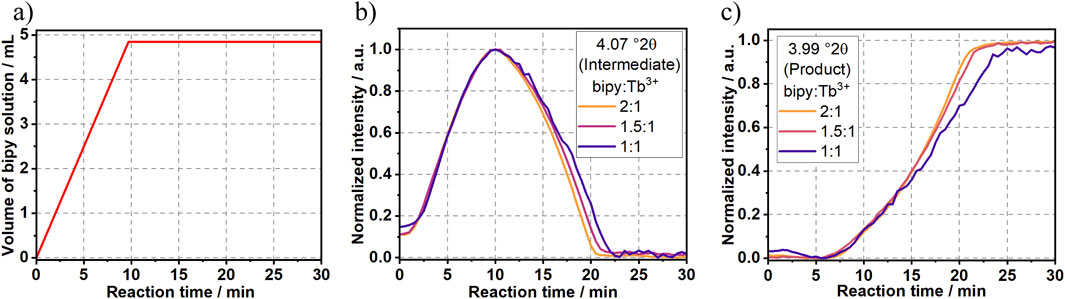
Figure 9. Time dependence of (A) the addition of bipy to the Tb3+ solution as well as intensity of the synchrotron-based Bragg peak assigned to (B) the intermediate at 4.07°2θ and to (C) the [Tb (bipy)2(NO3)3] product at 3.99°2θ.
The structure of [Tb (bipy)2(NO3)3] solved from serial crystallography is comparable to the one obtained via single-crystal measurements, giving a further demonstration of the feasibility of this approach for solving structures of inorganic-organic hybrid compounds with crystals size down to the nanoscale, using nanofocused beams. The present study found that it was necessary to merge data from 288,000 crystals for ab initio solution of carbon, nitrogen and oxygen atoms in the structure. This motivates the development of high-repetition-rate and high-X-ray-energy facilities to realize in situ serial crystallography studies to determine the structure of intermediate phases formed during crystallization of such fluorescent complexes and other inorganic compounds. Hence, in situ monitoring of reactions pathways provided real-time, high-quality information on phase-phase transformations during the reaction. In this work, we reported a detailed study on [Tb (bipy)2(NO3)3] crystallization process using experimental characterization, spectroscopic and crystallographic methods. Investigating the time-dependent changes in reaction dynamics was achieved by combining information extracted from in situ luminescence analysis of coordination sensors (ILACS), in situ synchrotron X-ray diffraction, ex situ luminescence and X-ray diffraction, in addition to pH, solution turbidity and ion conductivity measurements. Additionally, the influence of synthesis parameters on the luminescent complex crystallization pathways was studied. The crystallization behavior was found to be primarily dependent on the reactant’s concentrations; under high concentrations, reactions proceed via a crystalline intermediate formation, whereas no intermediate was formed under low concentrations. Changing the concentrations also influenced the reaction induction time and the evolution of emission splitting patterns. The crystallization reaction was also influenced by the ligand-to-metal molar ratios. Reducing the ligand-to-metal ratios below 2:1 systematically delayed the product formation and prolonged the intermediate lifetime. These in situ results are extremely important since they open doors for controlling the formation of the intermediate, enabling its possible isolation and solution of its crystal structure in the future.
The original contributions presented in the study are included in the article/Supplementary Material, further inquiries can be directed to the corresponding authors. CCDC-2406109 (single crystal) and CCDC-2427847 (serial crystallography) contain the supplementary crystallographic data of [Tb(bipy)2(NO3)3]. These data can be obtained free charge from the Cambridge Crystallographic Data Centre via http://www.ccdc.cam.ac.uk/data_request/cif.
BA-Ta: Writing–original draft, Data curation, Formal Analysis. PM-P: Writing–review and editing, Conceptualization, Investigation, Methodology. KP: Data curation, Formal Analysis, Investigation, Writing–review and editing. OY: Data curation, Formal Analysis, Investigation, Writing–review and editing. VM: Data curation, Formal Analysis, Investigation, Software, Writing–review and editing. AB: Data curation, Investigation, Writing–review and editing. HC: Conceptualization, Funding Acquisition, Supervision, Writing–review and editing. CN: Formal Analysis, Investigation, Visualization, Writing–review and editing. MB: Formal Analysis, Investigation, Validation, Writing–review and editing. MR: Formal Analysis, Investigation, Validation, Writing–review and editing. SW: Formal Analysis, Investigation, Validation, Writing–review and editing. KB: Conceptualization, Formal Analysis, Investigation, Methodology, Project administration, Supervision, Visualization, Writing–original draft, Writing–review and editing. HT: Conceptualization, Funding acquisition, Methodology, Project administration, Supervision, Writing–original draft, Writing–review and editing.
The author(s) declare that financial support was received for the research, authorship, and/or publication of this article. German Research Foundation (priority program 1415 and project TE 1147/1-1), the Daimler and Benz Foundation (project 32-11/15). Funding was also provided by DESY (Hamburg, Germany), a member of the Helmholtz Association HGF, and the Cluster of Excellence “CUI: Advanced Imaging of Matter” of the Deutsche Forschungsgemeinschaft (DFG)—EXC 2056—project ID 390715994. We acknowledge financial support by DFG within the funding programme Open Access-Publikationskosten.
The authors would like to thank Prof. Dr W. Bensch, Prof. Dr. F. Tuczek, Prof. Dr. M. Behrens and Prof. Dr N. Stock for access to the equipment utilized in this work. Thanks to M. Köppen for the development of the software for in situ data analysis and I. Jeß for the help with the single crystal X-ray diffraction analysis. We acknowledge DESY (Hamburg, Germany), a member of the Helmholtz Association HGF, for the provision of experimental facilities. Parts of this research were carried out at PETRA III and we would like to thank Dr. Florian Bertram (P08) and Dr. Alke Meents (P11) for assistance. Beamtime was allocated for proposals I-20160643 and I-20160477.
The authors declare that the research was conducted in the absence of any commercial or financial relationships that could be construed as a potential conflict of interest.
The author(s) declare that no Generative AI was used in the creation of this manuscript.
All claims expressed in this article are solely those of the authors and do not necessarily represent those of their affiliated organizations, or those of the publisher, the editors and the reviewers. Any product that may be evaluated in this article, or claim that may be made by its manufacturer, is not guaranteed or endorsed by the publisher.
The Supplementary Material for this article can be found online at: https://www.frontiersin.org/articles/10.3389/fchem.2025.1536383/full#supplementary-material
Aleksich, M., Paley, D. W., Schriber, E. A., Linthicum, W., Oklejas, V., Mittan-Moreau, D. W., et al. (2023). XFEL microcrystallography of self-assembling silver n-alkanethiolates. J. Am. Chem. Soc. 145 (31), 17042–17055. doi:10.1021/jacs.3c02183
Arana, L. R., Lindenberg, P., Said, H., Radke, M., Heidenreich, N., Cunha, C. S., et al. (2017). Monitoring the mechanism of formation of [Ce(1,10-phenanthroline) 2 (NO 3) 3 ] by in situ luminescence analysis of 5d–4f electronic transitions. RSC Adv 7 (83), 52794–52800. doi:10.1039/C7RA07488C
Bao, G., Wong, K.-L., Jin, D., and Tanner, P. A. (2018). A stoichiometric terbium-europium dyad molecular thermometer. Energy transfer properties. Light, Sci. and Appl. 7, 96. doi:10.1038/s41377-018-0097-7
Barends, T. R. M., Foucar, L., Ardevol, A., Nass, K., Aquila, A., Botha, S., et al. (2015). Direct observation of ultrafast collective motions in CO myoglobin upon ligand dissociation. Sci. (New York, N.Y.) 350 (6259), 445–450. doi:10.1126/science.aac5492
Barends, T. R. M., Foucar, L., Botha, S., Doak, R. B., Shoeman, R. L., Nass, K., et al. (2014). De novo protein crystal structure determination from X-ray free-electron laser data. Nature 505 (7482), 244–247. doi:10.1038/nature12773
Beeby, A., Clarkson, I. M., Dickins, R. S., Faulkner, S., Parker, D., Royle, L., et al. (1999). Non-radiative deactivation of the excited states of europium, terbium and ytterbium complexes by proximate energy-matched OH, NH and CH oscillators. An improved luminescence method for establishing solution hydration states. J. Chem. Soc. Perkin Trans. 2 (3), 493–504. doi:10.1039/a808692c
Beyerlein, K. R., Dierksmeyer, D., Mariani, V., Kuhn, M., Sarrou, I., Ottaviano, A., et al. (2017a). Mix-and-diffuse serial synchrotron crystallography. IUCrJ 4 (Pt 6), 769–777. doi:10.1107/S2052252517013124
Beyerlein, K. R., Jooss, C., Barty, A., Bean, R., Boutet, S., Dhesi, S. S., et al. (2015). Trace phase detection and strain characterization from serial X-ray free-electron laser crystallography of a Pr 0.5 Ca 0.5 MnO 3 powder. Powder Diffr. 30 (S1), S25–S30. doi:10.1017/S0885715614001171
Beyerlein, K. R., White, T. A., Yefanov, O., Gati, C., Kazantsev, I. G., Nielsen, N.F.-G., et al. (2017b). FELIX. An algorithm for indexing multiple crystallites in X-ray free-electron laser snapshot diffraction images. J. Appl. Crystallogr. 50 (Pt 4), 1075–1083. doi:10.1107/S1600576717007506
Binnemans, K. (2009). Lanthanide-based luminescent hybrid materials. Chem. Rev. 109 (9), 4283–4374. doi:10.1021/cr8003983
Boutet, S., Lomb, L., Williams, G. J., Barends, T. R. M., Aquila, A., Doak, R. B., et al. (2012). High-resolution protein structure determination by serial femtosecond crystallography. Sci. (New York, N.Y.) 337 (6092), 362–364. doi:10.1126/science.1217737
Bünzli, J.-C. G. (2010). Lanthanide luminescence for biomedical analyses and imaging. Chem. Rev. 110 (5), 2729–2755. doi:10.1021/cr900362e
Burkhardt, A., Pakendorf, T., Reime, B., Meyer, J., Fischer, P., Stübe, N., et al. (2016). Status of the crystallography beamlines at PETRA III. Eur. Phys. J. Plus 131 (3), 56. doi:10.1140/epjp/i2016-16056-0
Cable, M. L., Kirby, J. P., Gray, H. B., and Ponce, A. (2013). Enhancement of anion binding in lanthanide optical sensors. Accounts Chem. Res. 46 (11), 2576–2584. doi:10.1021/ar400050t
Chan, K. S., and Tan, J. (2016). Understanding advanced physical inorganic chemistry. Singapore: Ws Education.
Chan, K. S., and Tan, J. (2016). Understanding advanced physical inorganic chemistry. Singapore: WS Education.
Chapman, H. N., Fromme, P., Barty, A., White, T. A., Kirian, R. A., Aquila, A., et al. (2011). Femtosecond X-ray protein nanocrystallography. Nature 470 (7332), 73–77. doi:10.1038/nature09750
Chapman, H. N., Li, C., Bajt, S., Butola, M., Dresselhaus, J. L., Egorov, D., et al. (2024). Convergent-beam attosecond X-ray crystallography.
Colletier, J.-P., Sawaya, M. R., Gingery, M., Rodriguez, J. A., Cascio, D., Brewster, A. S., et al. (2016). De novo phasing with X-ray laser reveals mosquito larvicide BinAB structure. Nature 539 (7627), 43–47. doi:10.1038/nature19825
Cotton, S. A., Noy, O. E., Liesener, F., and Raithby, P. R. (2003). Unequivocal characterisation of a [Ln(terpy)(NO3)3·(H2O)] complex. Inorganica Chim. Acta 344, 37–42. doi:10.1016/S0020-1693(02)01266-5
Cotton, S. A., and Raithby, P. R. (2017). Systematics and surprises in lanthanide coordination chemistry. Coord. Chem. Rev. 340, 220–231. doi:10.1016/J.CCR.2017.01.011
Dalal, J., Dalal, M., Devi, S., Hooda, A., Khatkar, A., Malik, R. K., et al. (2019). Magnetic- and electric-dipole radiative rates in multifunctional Ba5Zn4Y8O21:Tb3+ nanorods. J. Mater. Sci. Mater. Electron. 30, 17547–17558. doi:10.1007/s10854-019-02104-3
Derelli, D., Frank, K., Grote, L., Mancini, F., Dippel, A.-C., Gutowski, O., et al. (2024). Direct synthesis of CuPd icosahedra supercrystals studied by in situ X-ray scattering. Small Weinheim der Bergstrasse, Ger. 20 (32), e2311714. doi:10.1002/smll.202311714
Di Bernardo, P., Melchior, A., Tolazzi, M., and Zanonato, P. L. (2012). Thermodynamics of lanthanide(III) complexation in non-aqueous solvents. Coord. Chem. Rev. 256, 328–351. doi:10.1016/j.ccr.2011.07.010
Dolomanov, O. V., Bourhis, L. J., Gildea, R. J., Howard, J. A. K., and Puschmann, H. (2009). OLEX2. A complete structure solution, refinement and analysis program. J. Appl. Crystallogr. 42 (2), 339–341. doi:10.1107/S0021889808042726
Dong, H., Du, S.-R., Zheng, X.-Y., Lyu, G.-M., Sun, L.-D., Li, L.-D., et al. (2015). Lanthanide nanoparticles. From design toward bioimaging and therapy. Chem. Rev. 115 (19), 10725–10815. doi:10.1021/acs.chemrev.5b00091
Duisenberg, A. J. M. (1992). Indexing in single-crystal diffractometry with an obstinate list of reflections. J. Appl. Crystallogr. 25 (2), 92–96. doi:10.1107/S0021889891010634
Embrechts, H., Kriesten, M., Hoffmann, K., Peukert, W., Hartmann, M., and Distaso, M. (2018). Elucidation of the formation mechanism of metal–organic frameworks via in-Situ Raman and FTIR spectroscopy under solvothermal conditions. J. Phys. Chem. C 122 (23), 12267–12278. doi:10.1021/acs.jpcc.8b02484
Gati, C., Oberthuer, D., Yefanov, O., Bunker, R. D., Stellato, F., Chiu, E., et al. (2017). Atomic structure of granulin determined from native nanocrystalline granulovirus using an X-ray free-electron laser. Proc. Natl. Acad. Sci. U. S. A. 114 (9), 2247–2252. doi:10.1073/pnas.1609243114
Hasegawa, Y., Kitagawa, Y., and Nakanishi, T. (2018). Effective photosensitized, electrosensitized, and mechanosensitized luminescence of lanthanide complexes. NPG Asia Mater 10 (4), 52–70. doi:10.1038/s41427-018-0012-y
Heffern, M. C., Matosziuk, L. M., and Meade, T. J. (2014). Lanthanide probes for bioresponsive imaging. Chem. Rev. 114 (8), 4496–4539. doi:10.1021/cr400477t
Huang, B., Bergstrand, J., Duan, S., Zhan, Q., Widengren, J., Ågren, H., et al. (2018). Overtone vibrational transition-induced lanthanide excited-state quenching in Yb3+/Er3+-doped upconversion nanocrystals. ACS nano 12 (11), 10572–10575. doi:10.1021/acsnano.8b05095
Huang, Y., Yu, A., Huang, C.-H., Gan, L., Zhao, X., Lin, Y., et al. (1999). Microcavity effect from a novel terbium complex Langmuir-blodgett film. Adv. Mater. 11 (8), 627–629. doi:10.1002/(SICI)1521-4095(199906)11:8<627::AID-ADMA627>3.0.CO;2-A
Kang, J., Lee, Y., Lee, S., Ki, H., Kim, J., Gu, J., et al. (2024). Dynamic three-dimensional structures of a metal-organic framework captured with femtosecond serial crystallography. Nat. Chem. 16 (5), 693–699. doi:10.1038/s41557-024-01460-w
Keilholz, S., Uhlenhut, H., Gabke, A., Schollenbruch, G., and Kohlmann, H. (2023). In situ studies on the industrial production process for molybdenum dioxide, MoO 2. Z. Anorg. allge Chem. 649 (18), 31. doi:10.1002/zaac.202300111
Kupitz, C., Olmos, J. L., Holl, M., Tremblay, L., Pande, K., Pandey, S., et al. (2017). Structural enzymology using X-ray free electron lasers. Struct. Dyn. Melv. N.Y. 4 (4), 044003. doi:10.1063/1.4972069
Kuznetsov, V. L., and Edwards, P. P. (2010). Functional materials for sustainable energy technologies. Four case studies. ChemSusChem 3 (1), 44–58. doi:10.1002/cssc.200900190
Li, J., Wang, L., Zhao, Z., Sun, B., Zhan, G., Liu, H., et al. (2020). Highly efficient and air-stable Eu(II)-containing azacryptates ready for organic light-emitting diodes. Nat. Commun. 11 (1), 5218. doi:10.1038/s41467-020-19027-x
Lindenberg, P., Arana, L. R., Mahnke, L. K., Rönfeldt, P., Heidenreich, N., Doungmo, G., et al. (2019). New insights into the crystallization of polymorphic materials. From real-time serial crystallography to luminescence analysis. React. Chem. Eng. 4 (10), 1757–1767. doi:10.1039/c9re00191c
Manzur, J., Poblete, C., Morales, J., Santana, R. C. d, Maia, Q., June, L., et al. (2020). Enhancement of terbium(III)-Centered luminescence by tuning the triplet energy level of substituted pyridylamino-4-R-phenoxo tripodal ligands. Inorg. Chem. 59 (8), 5447–5455. doi:10.1021/acs.inorgchem.0c00023
Mariani, V., Morgan, A., Yoon, C. H., Lane, T. J., White, T. A., O'Grady, C., et al. (2016). OnDA. Online data analysis and feedback for serial X-ray imaging. J. Appl. Crystallogr. 49 (Pt 3), 1073–1080. doi:10.1107/S1600576716007469
Marturano, V., Kozlowska, J., Bajek, A., Giamberini, M., Ambrogi, V., Cerruti, P., et al. (2019). Photo-triggered capsules based on lanthanide-doped upconverting nanoparticles for medical applications. Coord. Chem. Rev. 398, 213013. doi:10.1016/j.ccr.2019.213013
Moret, E., Bünzli, J.-C. G., and Schenk, K. J. (1990). Structural and luminescence study of europium and terbium nitrate hexahydrates. Inorganica Chim. Acta 178 (1), 83–88. doi:10.1016/S0020-1693(00)88138-4
Moss, D. S., and Sinha, S. P. (1969). The crystal structure of decacoordinated terbium(III)-Bis-(2,2′-bipyridyl)-Tris-Nitrate: Tb(NC 5 H 4·C 5 H 4 N)2(NO 3)3. Z. für Phys. Chem. 63 (1_4), 190–192. doi:10.1524/zpch.1969.63.1_4.190
Nam, Ki H. (2020). Approach of serial crystallography. Crystals 10 (10), 854. doi:10.3390/cryst10100854
Nango, E., Royant, A., Kubo, M., Nakane, T., Wickstrand, C., Kimura, T., et al. (2016). A three-dimensional movie of structural changes in bacteriorhodopsin. Sci. (New York, N.Y.) 354 (6319), 1552–1557. doi:10.1126/science.aah3497
Neumann, T., Germann, L. S., Moudrakovski, I., Dinnebier, R. E., dos Santos Cunha, C., Terraschke, H., et al. (2017). Synthesis, crystal structures, and properties of M (NCS) 2 -3-aminomethylpyridine coordination compounds (M = Cd, Zn). Z. Anorg. allge Chem. 643 (23), 1904–1912. doi:10.1002/zaac.201700250
Pienack, N., and Bensch, W. (2011). In-situ monitoring of the formation of crystalline solids. Angewandte Chemie Int. ed. Engl. 50 (9), 2014–2034. doi:10.1002/anie.201001180
Pienack, N., Lindenberg, P., Doungmo, G., Heidenreich, N., Bertram, F., Etter, M., et al. (2018). In situ monitoring of the formation of [Bis(acetylacetonato)manganese(II)] complexes. Z. Anorg. allge Chem. 644 (24), 1902–1907. doi:10.1002/zaac.201800392
Pienack, N., Näther, C., and Bensch, W. (2009). Solvothermal syntheses of two new thiostannates and an in-situ energy dispersive X-ray scattering study of their formation. Eur. J. Inorg. Chem. 2009 (7), 937–946. doi:10.1002/ejic.200801084
Pienack, N., Ruiz Arana, L., Bensch, W., and Terraschke, H. (2016). In situ studies on phase transitions of tris(acetylacetonato)-aluminum(III) Al(acac)3. Crystals 6 (12), 157. doi:10.3390/cryst6120157
Polzin, P., V Eliani, I., Ströh, J., Braun, M., Ruser, N., Heidenreich, N., et al. (2018). From ligand exchange to reaction intermediates. What does really happen during the synthesis of emissive complexes? Phys. Chem. Chem. Phys. PCCP 20 (11), 7428–7437. doi:10.1039/c7cp07142f
Rönfeldt, P., Grape, E. S., Inge, A. K., Novikov, D. V., Khadiev, A., Etter, M., et al. (2020). A scandium MOF with an unprecedented inorganic building unit, delimiting the micropore windows. Inorg. Chem. 59 (13), 8995–9004. doi:10.1021/acs.inorgchem.0c00840
Ruiz Arana, L., Olchowka, J., and Terraschke, H. (2019). Monitoring the solvation process and stability of Eu 2+ in an ionic liquid by in situ luminescence analysis. Z. für Naturforsch. B 74 (1), 147–152. doi:10.1515/znb-2018-0201
Schriber, E. A., Paley, D. W., Bolotovsky, R., Rosenberg, D. J., Sierra, R. G., Aquila, A., et al. (2022). Chemical crystallography by serial femtosecond X-ray diffraction. Nature 601 (7893), 360–365. doi:10.1038/s41586-021-04218-3
Sheldrick, G. M. (2015). SHELXT - integrated space-group and crystal-structure determination. In Acta Crystallogr. A Found. Adv. 71 (Pt 1), pp. 3–8. doi:10.1107/S2053273314026370
Stagno, J. R., Liu, Y., Bhandari, Y. R., Conrad, C. E., Panja, S., Swain, M., et al. (2017). Structures of riboswitch RNA reaction states by mix-and-inject XFEL serial crystallography. Nature 541 (7636), 242–246. doi:10.1038/nature20599
Støckler, L. J., Krause, L., Svane, B., Tolborg, K., Richter, B., Takahashi, S., et al. (2023). Towards pump-probe single-crystal XFEL refinements for small-unit-cell systems. IUCrJ 10 (Pt 1), 103–117. doi:10.1107/S2052252522011782
Ströh, J., Hess, T., Ohrt, L., Fritzsch, H., Etter, M., Dippel, A.-C., et al. (2023). Detailed insights into the formation pathway of CdS and ZnS in solution. A multi-modal in situ characterisation approach. Phys. Chem. Chem. Phys. PCCP 25 (6), 4489–4500. doi:10.1039/D2CP02707K
Ströh, J., Ohrt, L., Harder, A., Collette, Y., Liers, L., Teotonio, E., et al. (2024). α-Ag 2 S nanoparticles. Low-temperature syntheses, crystallisation pathway, and first operando luminescence measurements for sodium-ion battery applications. New J. Chem. 48 (3), 1086–1095. doi:10.1039/D3NJ04282K
Ströh, J., Arana, L. R., Polzin, P., Eliani, I. V., Lindenberg, P., Heidenreich, N., et al. (2019). Real-time probing the formation of [ M (2,2-bipyridine) 2 (NO 3) 3 ] (M = Ce, La, Tb) complexes and influence of synthesis parameters. Z. Anorg. allge Chem. 645 (5), 537–543. doi:10.1002/zaac.201800458
Suckert, S., Terraschke, H., Reinsch, H., and Näther, C. (2017). Synthesis, crystal structures, thermal, magnetic and luminescence properties of Mn(II) and Cd(II) thiocyanate coordination compounds with 4-(Boc-amino)pyridine as co-ligand. Inorganica Chim. Acta 461 (2014), 290–297. doi:10.1016/j.ica.2017.03.002
Tenboer, J., Basu, S., Zatsepin, N., Pande, K., Milathianaki, D., Frank, M., et al. (2014). Time-resolved serial crystallography captures high-resolution intermediates of photoactive yellow protein. Sci. (New York, N.Y.) 346 (6214), 1242–1246. doi:10.1126/science.1259357
Terraschke, H., Rothe, M., and Lindenberg, P. (2018). In situ monitoring metal-ligand exchange processes by optical spectroscopy and X-ray diffraction analysis. A review. Rev. Anal. Chem. 37 (1). doi:10.1515/revac-2017-0003
Wen, S., Zhou, J., Schuck, P., James, S., Schmidt, T. W., and Jin, D. (2019). Future and challenges for hybrid upconversion nanosystems. Nat. Photonics 13 (12), 828–838. doi:10.1038/s41566-019-0528-x
White, T. A. (2014). Post-refinement method for snapshot serial crystallography. Philosophical Trans. R. Soc. Lond. Ser. B, Biol. Sci. 369 (1647), 20130330. doi:10.1098/rstb.2013.0330
White, T. A., Barty, A., Stellato, F., Holton, J. M., Kirian, R. A., Zatsepin, N. A., et al. (2013). Crystallographic data processing for free-electron laser sources. Acta Crystallogr. Sect. D. Biol. Crystallogr. 69 (Pt 7), 1231–1240. doi:10.1107/S0907444913013620
White, T. A., Kirian, R. A., Martin, A. V., Aquila, A., Nass, K., Barty, A., et al. (2012). CrystFEL. A software suite for snapshot serial crystallography. J. Appl. Crystallogr. 45 (2), 335–341. doi:10.1107/S0021889812002312
White, T. A., Mariani, V., Brehm, W., Yefanov, O., Barty, A., Beyerlein, K. R., et al. (2016). Recent developments in CrystFEL. J. Appl. Crystallogr. 49 (Pt 2), 680–689. doi:10.1107/S1600576716004751
Winn, M. D., Ballard, C. C., Cowtan, K. D., Dodson, E. J., Emsley, P., Evans, P. R., et al. (2011). Overview of the CCP4 suite and current developments. Acta Crystallogr. Sect. D. Biol. Crystallogr. 67 (Pt 4), 235–242. doi:10.1107/S0907444910045749
Yamashita, K., Pan, D., Okuda, T., Sugahara, M., Kodan, A., Yamaguchi, T., et al. (2015). An isomorphous replacement method for efficient de novo phasing for serial femtosecond crystallography. Sci. Rep. 5, 14017. doi:10.1038/srep14017
Yin, H., Li, Y., Bai, J., Ma, M., and Liu, J. (2017). Effect of calcinations temperature on the luminescence intensity and fluorescent lifetime of Tb 3+ -doped hydroxyapatite (Tb-HA) nanocrystallines. J. Materiomics 3 (2), 144–149. doi:10.1016/j.jmat.2016.11.004
Zahariev, T., Shandurkov, D., Gutzov, S., Trendafilova, N., Enseling, D., Jüstel, T., et al. (2021). Phenanthroline chromophore as efficient antenna for Tb3+ green luminescence: a theoretical study. Dyes Pigments 185, 108890–108913. doi:10.1016/j.dyepig.2020.108890
Keywords: In situ luminescence, ligand-to-metal energy transfer, lanthanide complexes, crystal structure, small-molecule serial crystallography, synchrotron radiation
Citation: Al-Tayyem BH, Müscher-Polzin P, Pande K, Yefanov O, Mariani V, Burkhardt A, Chapman HN, Näther C, Braun M, Radke M, Waitschat S, Beyerlein KR and Terraschke H (2025) In situ monitoring of ligand-to-metal energy transfer in combination with synchrotron-based X-ray diffraction methods to elucidate the synthesis mechanism and structural evolution of lanthanide complexes. Front. Chem. 13:1536383. doi: 10.3389/fchem.2025.1536383
Received: 28 November 2024; Accepted: 13 February 2025;
Published: 17 April 2025.
Edited by:
Fabio Piccinelli, University of Verona, ItalyReviewed by:
Nawal K. Al-Rasbi, Sultan Qaboos University, OmanCopyright © 2025 Al-Tayyem, Müscher-Polzin, Pande, Yefanov, Mariani, Burkhardt, Chapman, Näther, Braun, Radke, Waitschat, Beyerlein and Terraschke. This is an open-access article distributed under the terms of the Creative Commons Attribution License (CC BY). The use, distribution or reproduction in other forums is permitted, provided the original author(s) and the copyright owner(s) are credited and that the original publication in this journal is cited, in accordance with accepted academic practice. No use, distribution or reproduction is permitted which does not comply with these terms.
*Correspondence: Kenneth R. Beyerlein, a2VubmV0aC5iZXllcmxlaW5AaW5ycy5jYQ==; Huayna Terraschke, aHRlcnJhc2Noa2VAYWMudW5pLWtpZWwuZGU=
†Present addresses: Kenneth R. Beyerlein, Centre Énergie Matériaux Télécommunications, Institut National de la Recherche Scientifique, Varennes, Québec, Canada
Disclaimer: All claims expressed in this article are solely those of the authors and do not necessarily represent those of their affiliated organizations, or those of the publisher, the editors and the reviewers. Any product that may be evaluated in this article or claim that may be made by its manufacturer is not guaranteed or endorsed by the publisher.
Research integrity at Frontiers
Learn more about the work of our research integrity team to safeguard the quality of each article we publish.