 Jing Ran
- Northeast Asia Institute of Traditional Chinese Medicine, Changchun University of Chinese Medicine, Changchun, Jilin, China
Background: Ganoderma lucidum is a widely used medicinal fungus whose quality is influenced by various factors, making traditional chemical detection methods complex and economically challenging. This study addresses the need for fast, noninvasive testing methods by combining hyperspectral imaging with machine learning to predict polysaccharide and ergosterol levels in Ganoderma lucidum cap and powder.
Methods: Hyperspectral images in the visible near-infrared (385–1009 nm) and short-wave infrared (899–1695 nm) ranges were collected, with ergosterol measured by high-performance liquid chromatography and polysaccharides assessed via the phenol-sulfuric acid method. Three machine learning models—a feedforward neural network, an extreme learning machine, and a decision tree—were tested.
Results: Notably, the extreme learning machine model, optimized by a genetic algorithm with voting, provided superior predictions, achieving R2 values of 0.96 and 0.97 for polysaccharides and ergosterol, respectively.
Conclusion: This integration of hyperspectral imaging and machine learning offers a novel, nondestructive approach to assessing Ganoderma lucidum quality.
1 Introduction
Ganoderma lucidum, a member of the Ganodermataceae family, is classified as a white-rot fungi (Wang T. T. et al., 2024). This species primarily grows in tropical, subtropical, and temperate climates. As one of the leading producers, China has developed a large-scale Ganoderma lucidum planting industry. This fungus is rich in specific bioactive components, including polysaccharides, triterpenes, proteins, and sterols (Cör et al., 2022). Ganoderma lucidum, known for its remarkable antioxidant, antibacterial, tumor-inhibiting, and anti-inflammatory effects, holds a significant position in the healthcare and nutrition market. This is attributed to its three primary functions: nourishment, treatment, and tonification. As awareness of the quality of Ganoderma lucidum increases, it becomes evident that its quality is significantly affected by many factors, including producing area, cultivation environment, harvest conditions, and so on. Researchers have developed various quality control techniques for Ganoderma lucidum, including UV-Vis spectrophotometry (Jiang et al., 2018) and nuclear magnetic resonance (Wang M. et al., 2024) spectroscopy for analyzing polysaccharides, high-performance liquid chromatography (HPLC) for assessing triterpenoid acids (Zeng et al., 2023) and ergosterol (Liu et al., 2011), HPLC-ELSD lipid profiling (Xia et al., 2023), and high-performance capillary electrophoresis for nuclear glycoside content analysis (Dai et al., 2002). Although these methods can be employed to determine the chemical composition of Ganoderma lucidum, traditional detection techniques have limitations, including complexity, time consumption, destructiveness, and sensitivity to standard experimental procedures.
Advancements in spectral technology have significantly improved non-destructive testing methods. Consequently, researchers have quantitatively analyzed polysaccharides and triterpene compounds in Ganoderma lucidum (Zhang and Huang, 2021; Zhang, 2020) alongside rapid identification of Ganoderma lucidum varieties (Yang et al., 2017) through near-infrared fingerprint technology. Near-infrared spectroscopy works by measuring samples that absorb near-infrared light, which provides insight into their chemical composition and physical properties. However, this technique typically offers lower spatial resolution and is limited to spectroscopic information. Hyperspectral imaging technology (HSI)—a novel analytical method—integrates traditional imaging with spectroscopy to simultaneously capture spatial and spectral information of samples. This technology offers several advantages: it is non-contact, non-destructive, fast, and capable of providing a large amount of information. It holds significant potential for applications across agriculture, food, medicine, and other fields. Machine learning, an important branch of artificial intelligence, automatically extracts features from large datasets and learns rules by creating predictive models to accurately predict or classify unknown samples. Xu et al. employed principal component analysis (PCA) to extract feature bands and utilized a support vector machine for modeling moldy walnuts (Xu et al., 2022). Xiao et al. developed an SVM model using feature wavelengths extracted via PCA and convolutional neural networks, achieving results comparable to or better than those of the full-wavelength model (Xiao et al., 2020). Li et al. extracted 13 characteristic wavelengths using a stacked autoencoder and achieved optimal predictive performance in a GA-ELM model, with an R2 value of 0.97 (Li et al., 2023a). This study achieved an overall classification accuracy of 93%. Furthermore, Li et al. successfully used the SNV-SPA-LS-SVM algorithm to detect protein content in mulberry leaves. This method effectively assessed leaf quality, yielding an RPD value of 3.83 and an R2for protein detection (Li et al., 2023b).
The researchers captured hyperspectral images of wheat flour in the range of 968–2576 nm and developed models using partial least squares discriminant analysis and SVM based on characteristic wavelengths. The results indicate that the nonlinear discriminant model outperformed the linear model in classifying the wheat flour grades. Furthermore, the MSC-UVE-CARS-PSO-SVM model provides superior prediction performance, achieving 100% accuracy in the calibration and validation sets (Zhang et al., 2023). Alfaro-Mejía et al. propose an unsupervised deep learning model for endmember extraction and fractional abundance map estimation from the HSI (Alfaro-Mejía et al., 2023). Other scholars have used a fast and compact Hybrid CNN to process HSI data for bloodstain identification and classification (Butt et al., 2022). Hou et al. proposed a hyperspectral imagery classification model based on self-supervised contrastive learning (SSCL),where conventional spectral-spatial features and deep models are combined to improve the classification accuracy (Hou et al., 2021). Advancements in HSI and machine learning algorithms are further improving their application in the quality detection of Ganoderma lucidum. For example, Pan et al. and other researchers developed a prediction model by collecting hyperspectral images of Ganoderma lucidum spore powder samples with varying wall-breaking rates (Pan et al., 2024). The model incorporated spectral preprocessing and characteristic band extraction. The combination of Savitzky-Golay smoothing and competitive adaptive reweighted feature band selection together with partial least squares yielded the best prediction performance. This technique successfully enabled a rapid, non-destructive testing approach for determining the wall-breaking rate of Ganoderma lucidum spore powder. Additionally, other researchers have employed visible-near infrared HSI to pre-detect polysaccharide content in Ganoderma lucidum fruiting bodies. Ganoderma lucidum polysaccharide content has been accurately predicted by collecting hyperspectral images, conducting spectral preprocessing, extracting characteristic bands, and utilizing partial least squares modeling (Liu Y. et al., 2021). The concentration of 15 inorganic elements, including lead, in the entire fruiting body of Ganoderma lucidum was higher than those in the caps (Liu et al., 2023). Furthermore, while the caps contain higher concentrations of ganoderic acid A (Huang et al., 2017) and ganoderic acid B (Shi et al., 2013), infrared spectroscopy indicates that the levels of amino acids, peptides, and proteins in Ganoderma lucidum were higher than those in the caps (Huang et al., 2015).
In a previous hyperspectral study of Ganoderma lucidum polysaccharides, only the cap was collected. However, differences in the distribution of chemical compositions in Ganoderma lucidum may result in inaccurate model predictions. Therefore, hyperspectral images of Ganoderma lucidum caps and powder were collected, and the hyperspectral data were preprocessed using genetic algorithms and principal component analysis, and three kinds of machine learning models, BPNN, ELM, and DT, of the original spectral data and the preprocessed spectral data, were established for the prediction of the chemical content of the samples of different morphologies of Ganoderma lucidum, and the best prediction models were screened out by comparing different algorithms with each other. It aims to provide a new method for non-destructive testing of Ganoderma lucidum quality.
2 Materials and methods
2.1 Sample preparation and hyperspectral image acquisition
In this study, 32 fruiting bodies of Ganoderma lucidum were collected from 13 production areas. Table 1 provides detailed information. Upon collection, the Ganoderma lucidum cap was immediately crushed into powder, which was pressed onto A4 paper to coin-sized shapes for consistent hyperspectral image acquisition under the same conditions. During the collection, the indoor temperature was kept at approximately 25°C. Each sample was photographed three times, and the average spectrum was calculated from the original spectral data.

Table 1. Samples of Ganoderma lucidum.
The HSI system used for image acquisition adopts a dual-light source set-up, consisting of a grating splitter, charge-coupled device, an IMPERX 1920 × 1080 visible near-infrared camera (lens: Kowa 35 mm focal length), Guohui 640 × 512 short-wave infrared camera (lens: AZURE 50 mm focal length), halogen light sources, electric platform, and computer. The experimental equipment was provided by the Changchun Institute of Optics and Precision Machinery, Chinese Academy of Sciences (Figure 1).
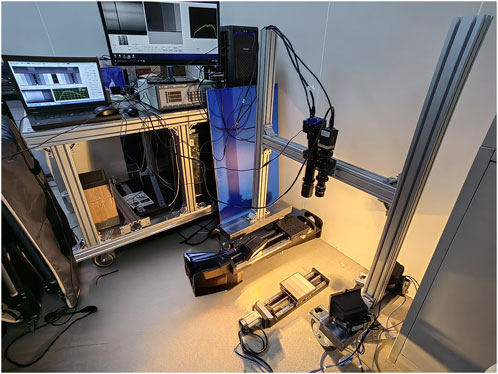
Figure 1. Hyperspectral imaging system.
Calibration images were collected (Reddy et al., 2023) before acquiring the hyperspectral images to correct for any variations in light source intensity and dark current, ensuring accurate spectral data (Dai et al., 2023). The calibration formula is in the following Equation 1.
where R is the calibrated reflectance image, Iraw is the original reflectance image, Idark represents the blackboard reference image, and Iwhite is the whiteboard reference image.
Figure 2 Provides a schematic overview of the analysis process, including the acquisition of spectral data and model development.
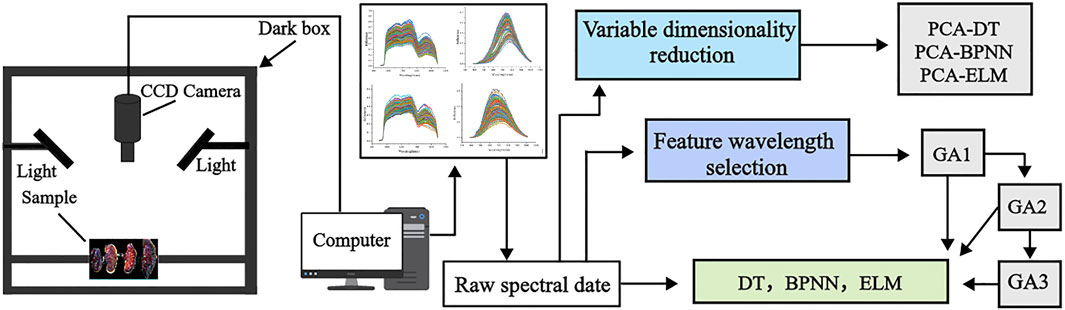
Figure 2. Schematic diagram of Ganoderma lucidum sample program analysis.
2.2 Region of interest extraction and sample set division
The region of interest was manually delineated using ENVI5.3 software, selecting three pixels and calculating their average values as the spectral reflectance for each sample. Overall, 128 regions of interest were extracted from 32 Ganoderma lucidum cap (GLC) and powder (GLP), which were randomly divided into training and prediction sets at a ratio of 115:13 for subsequent modeling.
2.3 Measurement of chemical composition
2.3.1 Polysaccharides
To measure polysaccharide content, 1.0 g of the fruiting body powder of Ganoderma lucidum collected from the hyperspectral images was weighed, and 40 mL of pure water was added. The mixture was then boiled for 2 h, fixed volume to 50 mL, and filtered. The filtrate (5 mL) was added to 25 mL of anhydrous ethanol, followed by overnight precipitation. The mixture was centrifuged at 5000 rpm for 25 min. The resulting supernatant was discarded, and the residue was dissolved in 25 mL of water. The solution (1 mL) was thoroughly mixed with water to 2 mL, and the absorbance was determined according to the phenol sulfate method. The determination was repeated three times, and the average value was calculated.
2.3.2 Ergosterol
A 1.0 g sample of the powder collected from the HSI was dissolved in 20 mL of methanol, thoroughly mixed, and sonicated for 1 h. Following filtration, the ergosterol content in Ganoderma lucidum was determined using HPLC. The HPLC conditions were as follows: an Agilent Eclipse Plus C18 column (4.6 mm × 250 mm,5 μm), flow rate of 1.0 mL/min, detection wavelength of 282 nm, injection volume of 10 μL, column temperature of 30°C, and methanol as mobile phase.
2.4 Hyperspectral data processing methods
Hyperspectral data is high-dimensional and nonlinear, often containing large volumes of information, noise, redundancy, and collinearity, all of which complicate analysis (Chen et al., 2024; Sun et al., 2024). Using full-spectrum modeling not only increases the complexity of model training but also causes overfitting. Therefore, reducing variables and selecting relevant wavelengths are essential for enhancing classification accuracy and simplifying computations.
2.4.1 Variable dimensionality reduction
Dimensionality reduction is an essential preprocessing step in data mining with broad applications, particularly for spectral data. PCA is a commonly used unsupervised learning method.
PCA uses an orthogonal transformation to convert observed data represented by linearly correlated variables into a smaller set of linearly independent variables, known as principal components. Principal components with high interpretive value retain most of the critical information from hyperspectral images (Xiao et al., 2020; Ye et al., 2022).
2.4.2 Characteristic wavelength selection
A GA is an optimization method inspired by the principles of natural selection and Darwinian evolution theory. Following the “survival of the fittest” principle, GA uses the “network” to find the global optimal solution by simulating the biological evolution process (Zhang et al., 2024). Using “minimum error” as the evolutionary criterion, the optimal solution is searched in the global scope (Wang et al., 2021). Compared with the inverse gradient descent method, GA can search multiple solutions within the solution space simultaneously without requiring differential operation. This makes GA highly robust and widely applicable (Wang et al., 2023). We propose two methods for selecting feature wavelengths using GA. The first is iterative feature selection, which reduces the number of wavelengths over multiple iterations, refining the quality of the selected wavelengths. The second approach uses voting-based feature selection, where multiple runs are performed, and the wavelengths selected most frequently are designated as the characteristic wavelength. The roulette wheel selection strategy was used to select the most fit individual. Additionally, single-point crossover was implemented to improve the search process. The variation operator uses the fundamental bitwise variation and sets the variation probability to 0.05. This setting helped prevent the algorithm from getting stuck in a local optimum. It also enhanced its ability to perform global searches. These genetic operators collaborate to help the algorithm discover a better combination of features in the feature selection process, which ultimately improves the final model’s performance.
2.5 Model construction and evaluation
2.5.1 BP neural network
A back propagation (BP) neural network is a multilayer feed forward network and one of the most widely used neural network architectures (Figure 3). Each BP neural network (Yu and Sun, 2024) consists of an input, hidden, and output layer, where there can be one or more hidden layers (He and Zhou, 2022). The core concept of a BP neural network is to adjust the connection weight of the network through the backpropagation error, thus minimizing the output error. However, in complex networks, training can often become trapped in local minimum (Yuan et al., 2009). Additionally, the performance of BP neural networks largely depends on the settings of hyperparameters, such as the learning rate and number of hidden layers and neurons. If the learning rate is too high, training may become unstable, while too low may cause slow or stalled training. Increasing hidden layers or nodes can reduce error and improve model generalization, simultaneously increasing neural network complexity, extending learning time, and may eventually cause overfitting. Overfitting makes the model prone to getting trapped in a local minimum, ultimately degrading its e performance. Conversely, reducing the number of hidden layers may prevent the network from achieving sufficient accuracy or cause underfitting. Therefore, balancing the number of nodes is essential for optimizing model performance, minimizing overfitting, and achieving a robust fit (Liu et al., 2016). In this study, we configure the BPNN with the following parameters: the hidden layer contains 100 neurons, the maximum number of iterations is set to 1000, the initial learning rate is 0.01, the activation function is the tanh, and the solver is the lbfgs algorithm.
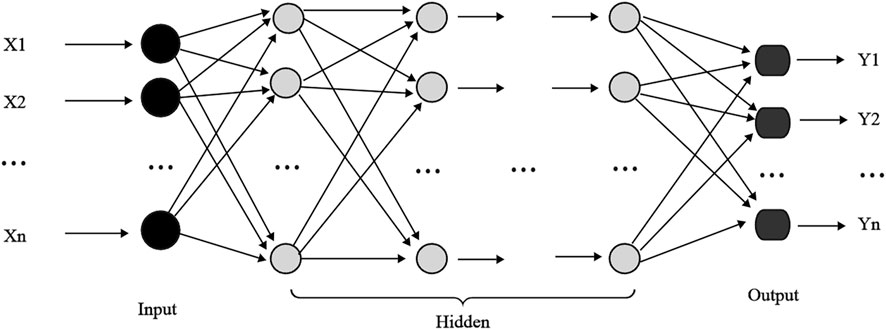
Figure 3. Topology diagram of backpropagation neural network.
2.5.2 Decision tree
A decision tree (DT) is a machine-learning model that uses a hierarchical tree structure composed of a root node, several internal nodes, and leaf nodes to represent decision rules and classification outcomes. The root node serves as the starting point of the tree, each internal node represents a feature attribute or judgment condition (Xu et al., 2022), and the leaf node represents the final prediction result (Figure 4). The decision tree recursively partitions the dataset until the stopping condition is met, thus forming a prediction model (Li M. Y., 2024). Model stability generally increases with a lower learning rate. Additionally, the complexity of the model is influenced by the tree depth and number of splits: as complexity increases, more decision trees are required, which increases training time and storage requirements (Zhang et al., 2024).
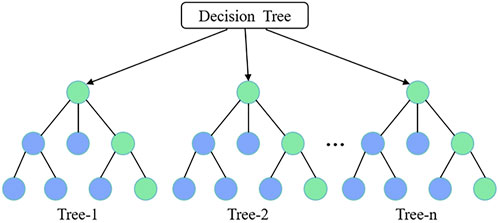
Figure 4. Topology diagram of the decision tree.
2.5.3 Extreme learning machine
Extreme learning machine (ELM) is a single-layer feedforward neural network consisting of an input, a hidden, and an output layer (Figure 5), known for its strong performance in classification and regression (Jia et al., 2024; Huang et al., 2006; Liu et al., 2022; Feng et al., 2024). The principle of the ELM is to map the input data into a high-dimensional feature space to establish an optimal hyperplane that best represents the relationship between inputs and outputs (Li P. X., 2024). Unlike traditional feedforward neural networks, ELM reduces complexity by avoiding iterative learning and parameter tuning, transforming the training into a simple matrix inversion problem. Hidden layer weights and thresholds are assigned randomly, while output layer weights are directly calculated, bypassing gradient descent. Therefore, ELM significantly reduces training time and offers high learning efficiency, accuracy, and ease of parameter adjustment (Chen and Wang, 2019; Lu et al., 2024; Liu T. et al., 2021).
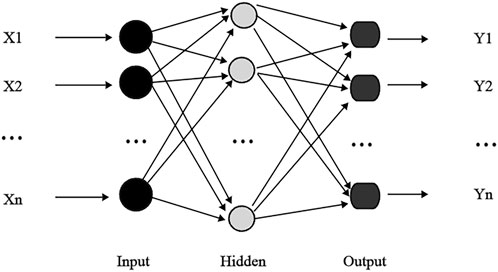
Figure 5. Topology diagram of the extreme learning machine.
2.6 Model evaluation
The training set determination coefficient (RT2), verification set determination coefficient (RV2), and mean square error (MSEP) are utilized as indicators to determine the model performances. All the models ran 10 times for averaging to ensure the robustness of the model evaluation. The closer the determination coefficient (R2) is to 1, the better the fitting effect of the model (Li et al., 2023c). Among them, R2 > 0.90 indicates excellent prediction ability of the model, 0.81 < R2 < 0.90 suggests good prediction performance of the model, and 0.60 < R2 < 0.80 shows that the model is general but still useable for prediction. The MSEP is employed to determine the deviation between the predicted and real values. A larger R2 and a smaller MSEP indicates higher accuracy and better stability of the model (Cui et al., 2017).
3 Results
3.1 Chemical composition content
By mapping the average content of Ganoderma lucidum polysaccharides and ergosterol (Figure 6), the polysaccharide content in Bozhou, Anhui, and Baise, Guangxi, was <1.0%, which was the lowest among all the producing areas. In contrast, ergosterol content was relatively high in Longquan, Zhejiang, and Fusong, Jilin Province, with the highest levels found in Jilin City, Jilin Province. These findings suggest significant variation in Ganoderma lucidum contents across different areas; however, traditional separation and detection methods were time-consuming and complex. Furthermore, the performance of each component differs across production areas, complicating the evaluation of Ganoderma lucidum quantity based solely on a single component. Therefore, using hyperspectral technology to predict the content and assess the quality of Ganoderma lucidum may be highly valuable.
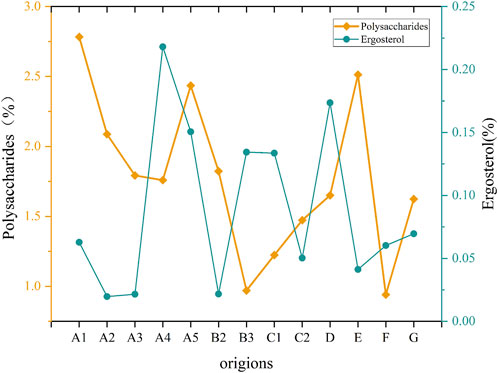
Figure 6. Diagram of chemical composition content in Ganoderma lucidum samples.
3.2 Spectral characteristics
The spectral reflectance of the GLC and GLP showed similar trends in different wavelength bands, but their reflectance values exhibited significant differences (Figure 7). The average reflectance of the GLC was higher than that of the GLP. In the range of the VNIR band, the reflectance map of the GLC appeared delaminated, owing to structural variation, such as surface roughness and texture. After crushing, the sample exhibited high uniformity, causing this delamination effect to disappear and shifting the position of the absorption peak accordingly. Absorption peaks were observed near 1100, 1300, and 1520 nm in the SWIR band; the peak at 1100 nm may be related to the second overtone of N-H stretching, while that at 1300 nm may be attributed to the second overtone of C-H stretching. A local minimum is observed near 1200 and1430 nm; the trough at 1200 nm may correspond to the ergosterol absorption band in Ganoderma lucidum (Delwiche et al., 2019), and those at 1430 and 1520 nm may be related to the first overtone of O-H stretching.
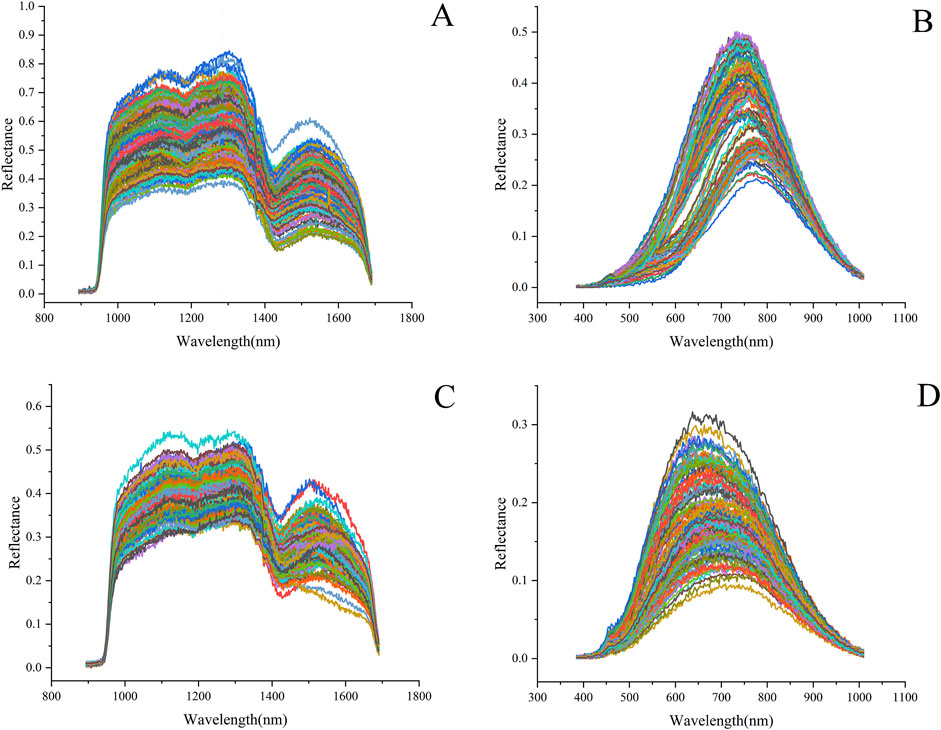
Figure 7. Spectral reflectance map of Ganoderma lucidum samples: (A) GLC spectrum in the range of SWIR and (B) VNIR. (C) GLP spectrum in the range of SWIR and (D) VNIR.
3.3 Modeling and analysis
Through the modeling of polysaccharide and ergosterol contents in the GLC and GLP (Table 2), the training accuracy of all models was >0.90, demonstrating strong performance. However, model effects varied significantly across different band ranges. In the SWIR band range, the BPNN and ELM models performed better than those of the other models. The prediction of DT model results showed that the GLC contained significantly higher levels of polysaccharides and ergosterol compared to that of the GLP. The prediction accuracy for the GLP was below 0.43, which was insufficient for effective prediction. In the BP model, the accuracy for predicting polysaccharides in the GLP slightly exceeded that of the GLC, while the model achieved the highest accuracy for predicting ergosterol, with an R2 value of 0.94.
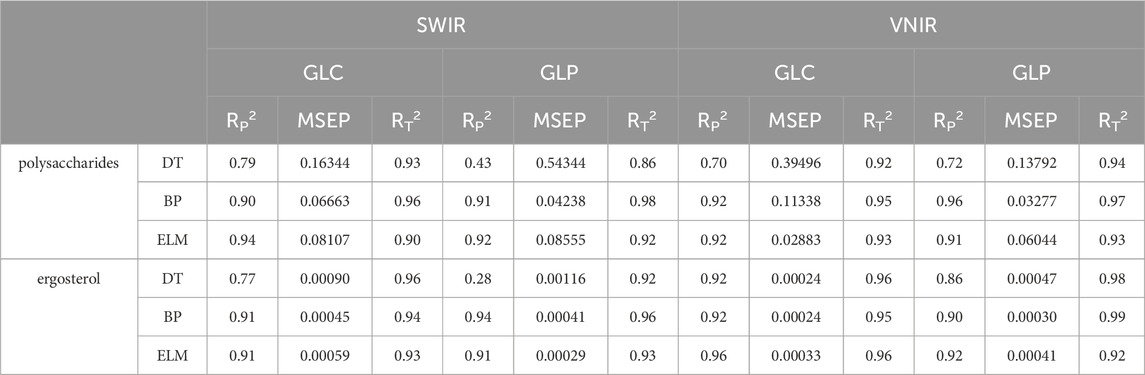
Table 2. Predictive analysis based on original spectral modeling.
In the VNIR band range, the BP model showed the optimal prediction effect for polysaccharides in the GLP, achieving an R2of 0.96. In contrast, the ELM model predicted ergosterol in the GLC with an R2 of 0.96. The performance of the DT model for GLP significantly exceeded that of the SWIR band, particularly in predicting ergosterol.
3.4 Characteristic wavelength selection
3.4.1 Result of characteristic wavelength selection
Two methods for feature-wavelength selection were proposed in this study using the GA. The first method, iterative feature selection, is conducted thrice to obtain different sets of feature wavelengths (Figure 8). The second method is voting feature selection. The second technique, voting feature selection, involves selecting 50 results with a determination coefficient >0.7. The wavelength that appears most frequently is selected as the feature wavelength, matching the count obtained from the iterative feature selection. Polysaccharides select more characteristic wavelengths than ergosterols in the VNIR band. This may be because polysaccharides are polymeric compounds composed of multiple monosaccharide molecules connected by glycosidic bonds that contain numerous functional groups (e.g., OH). Its chemical structure is complex, with various intramolecular and intermolecular interaction types, such as hydrogen bonds and van der Waals forces, which increase the overlap of the spectra. Consequently, identifying the characteristic wavelengths becomes challenging, and the number of these wavelengths is larger.
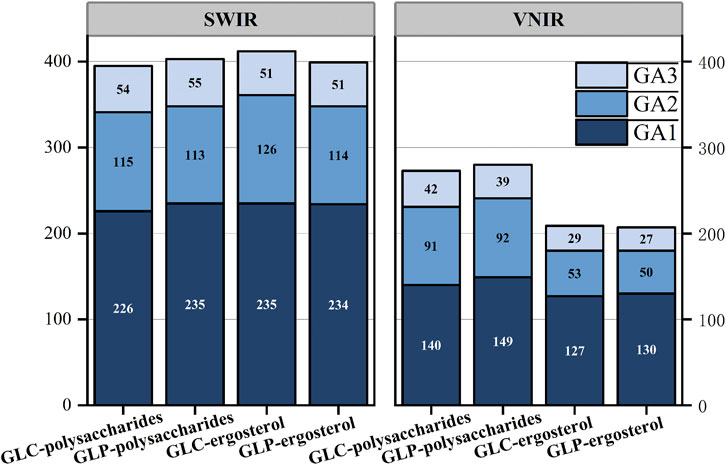
Figure 8. Number of characteristic wavelengths.
3.4.2 Characteristic wavelength modeling results
This study employed two GA to extract the characteristic wavelengths and established three models: BPNN, ELM, and DT. The first was used to predict polysaccharides (Table 3). The training accuracy of all models was >0.81, and the MSEP of the verification set was minimal, indicating good performance. When using two types of GA selection across different wavelength ranges, the prediction accuracy for GLC and GLP surpasses that of the characteristic wavelength voting method. In the SWR range, the prediction accuracy of the three models under voting conditions ranked as follows: ELM > BPNN > DT. The ELM model showed the best prediction performance for GLC and GLP, with R2 values of 0.96 and 0.95, respectively. The DT model of the GLC performed worse than the original model under two types of GA conditions. However, the prediction accuracy of iterative feature selection is significantly higher than that of voting, with R2 values > 0.61. For GLP, the prediction accuracy of the DT model was better than that of the original model when using the voting GA. Across all three models, the prediction accuracy for GLC was higher than that of GLP. In the VNIR range, the prediction accuracy of the DT model was significantly higher than that of SWIR, increasing from 0.23 to 0.90 by the third iteration of GLC. The prediction accuracies of the two GA methods were significantly higher than those of the original models. The prediction accuracy of the three models was consistent within the SWIR range. The GLC achieved the highest prediction accuracy with an R2 value of 0.96 in the ELM model under the voting GA condition. Overall, for GLC, the average R2 values were 0.82 for iterative GA selection and 0.90 for voting GA, while for GLP, the values were 0.82 and 0.88, respectively.
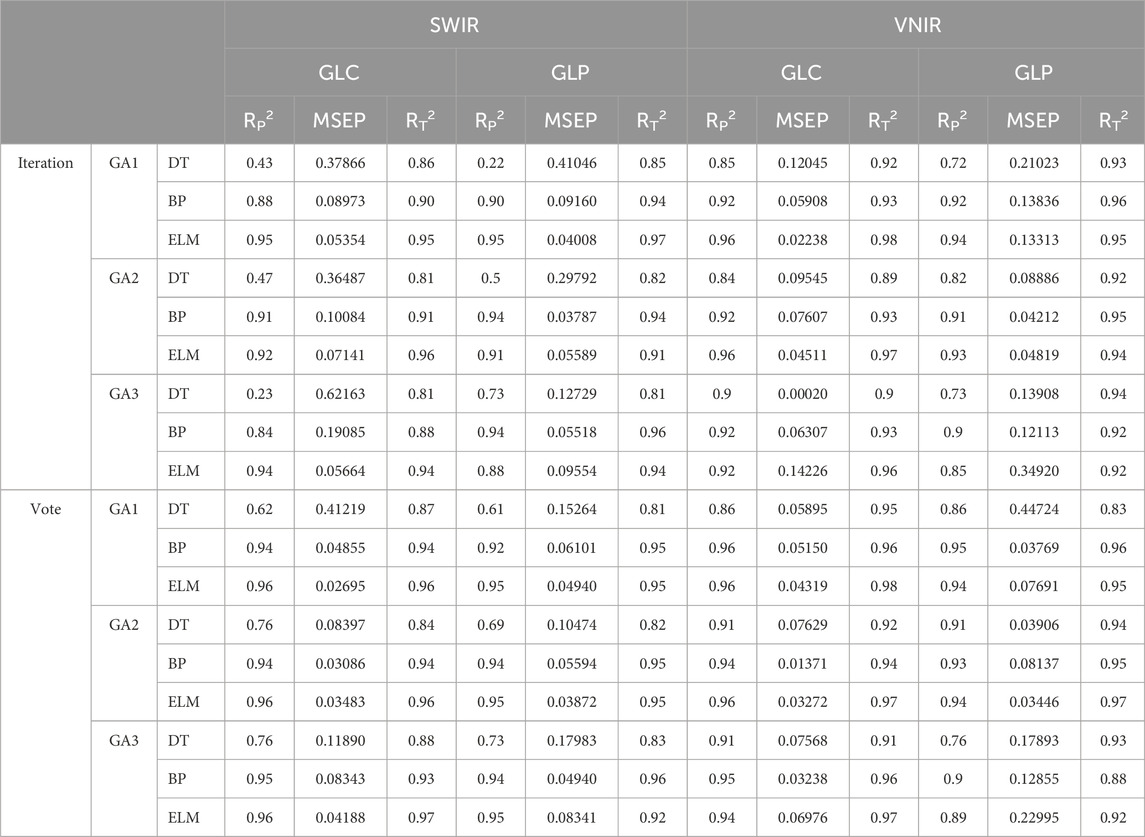
Table 3. Modeling and prediction results of polysaccharides based on different GA characteristic wavelength extraction methods.
All models for predicting ergosterol levels (Table 4) achieved a training accuracy >0.93, the MSEP of the verification set was minimal, demonstrating effective training. In the SWIR range, the DT model performs worse than that of the BPNN and ELM models. The iterative GA prediction accuracy for ergosterol in GLP was <0.54, and the accuracy of GA1 was lower than that of the original model, with an R2 value of only 0.21. The DT model selected by the three-voting GA outperformed the original model, achieving an R2 value > 0.61. In contrast, the ELM model in GA3 exhibited a lower performance compared to that of the iterative model. The prediction effect of the three models of GLC under voting GA was ranked as ELM > BPNN > DT, with the ELM achieving the highest accuracy at 0.95. In the iterative GA selection, the BPNN model performed worse than the original model inGA1andGA3, and only the DT model in GA2 outperformed the original model. In the VNIR range, the DT model developed using GLP demonstrated superior performance than that of the SWIR range. The prediction accuracy of the three models assessed in the voting GA3 was slightly lower than that of the iterative GA3. The predictive performance of the three models utilizing GLC was consistent with the SWIR findings, ranking as follows: ELM > BPNN > DT, with ELM achieving the highest prediction accuracy of 0.97. Overall, the average R2 of the iterative GA model based on the characteristic wavelengths of the GLC was 0.87; however, the voting GA model achieved 0.91. The iterative GA model using the characteristic wavelengths of GLP resulted in an R2 of 0.82, compared to an R2 of 0.87 for the voting GA model. In summary, the predictions for ergosterol and polysaccharides are consistent across different models, with the model employing characteristic wavelengths selected by voting GA being the most effective. Among them, the predictive performance of ELM in the GA1 and GA2 in the VNIR band was the highest, with R2 of 0.97.
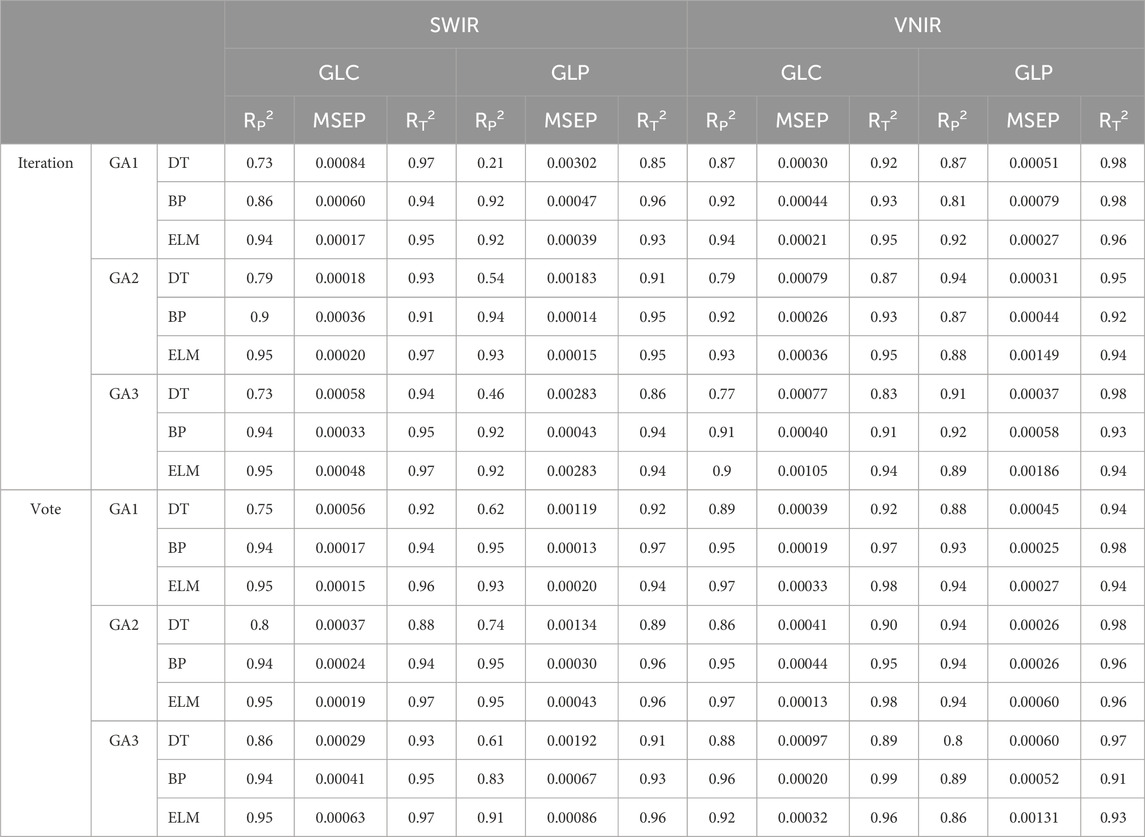
Table 4. Modeling and prediction results of ergosterol based on different GA characteristic wavelength extraction methods.
3.4.3 Variable dimension reduction
The first five principal components for analysis were retained in this study. Only the DT model in the SWIR band improved the predictions of polysaccharides and ergosterol in the fruiting body powder (Table 5), increasing R2 from 0.43 to 0.28 to 0.63 and 0.70, respectively. The predictive results from the other models were inferior to those of the original model, the ELM model achieved MSEP of 3.02734 and 2.49455 for polysaccharide prediction of GLP in SWIR and VNIR bands, respectively, probably because PCA is generally more effective for linear data; however, most hyperspectral data exhibit high-order correlations, affecting dimensionality reduction outcomes.

Table 5. Modeling and prediction results based on variable dimensionality reduction methods.
3.5 Visualization of polysaccharide and ergosterol content
We collected a complete hyperspectral image of Ganoderma lucidum with a stalk (Figure 9) and visualized the distribution of polysaccharide and ergosterol content. The results showed that the polysaccharide content of the Ganoderma lucidum stalk was significantly lower than that of the Ganoderma lucidum cap. The average levels of polysaccharide and ergosterol decreased following pulverization, which may explain why predictive accuracy for GLP was lower than that of the GLC. Additionally, pulverization improves sample homogeneity, increasing the spectral reflectance and potentially reducing prediction accuracy.
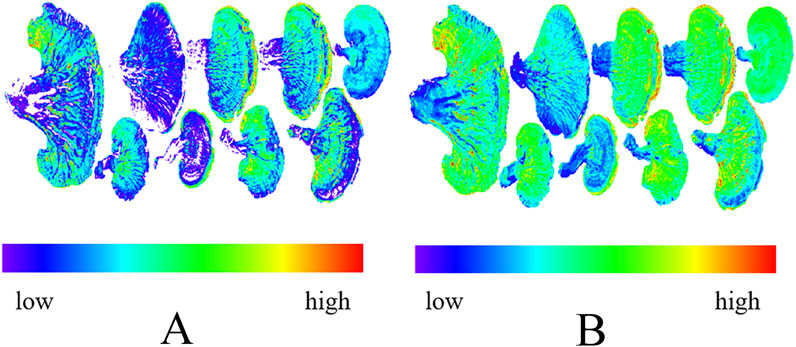
Figure 9. PCA diagram of Ganoderma lucidum. (A) Polysaccharides and (B) ergosterol.
The whole Ganoderma lucidum fruiting body maintains its natural morphology and tissue structure, which may play a role in the synthesis, storage, and release of its active components. The structural integrity allows for interactions among various compounds, creating a relatively stable system that protects active components from environmental factors, such as oxidation. In contrast, pulverizing Ganoderma lucidum disrupts this natural structure, increasing its surface area and making it more susceptible to external factors, causing the degradation of active components and affecting predictive accuracy.
4 Discussion
HSI was used in this study to predict the chemical composition of the GLP and GLC. The results showed that the average predictive ability of the GLC was better than that of GLP. HSI technology was used to determine calcium and other trace elements in wheat grains and flour (Zhang et al., 2010). The results showed that the prediction accuracy of wheat grains was higher than that of wheat flour. This is consistent with the findings of the present study, in which intact samples yielded better predictions.
In the original BPNN and ELM models, polysaccharides and ergosterols achieved high prediction accuracies, R2 > 0.9. However, in the GLP range of the SWIR band, the DT model showed a lower prediction accuracy, R2 < 0.43, particularly ergosterol, with an R2 of only 0.28. Furthermore, the predictive performance across models in the SWIR band is inferior to that in the VNIR band,and the MSEPs of the three models are significantly higher in the SWIR band. This may be attributed to the visible light and part of the near-infrared spectrum included in the VNIR band, providing extensive information on the color, texture, and chemical composition of objects. The SWIR band, while valuable, does not provide as abundant spectral information as that in the VNIR band. Common environmental substances, such as soil (Li et al., 2023a), show strong spectral responses in the VNIR band, and chlorophyll exhibits pronounced absorption features in the VNIR band (Sun et al., 2022). Additionally, the VNIR reflectance spectrum is less affected by water (Yang et al., 2023). VNIR band sensor technology is well-developed, facilitating data acquisition and processing with high spatial and spectral resolution. This technology has been extensively validated and applied in agriculture, forestry, geology, and environmental monitoring. In contrast, data from the SWIR band tends to be more complex, often resulting in large datasets that require more sophisticated algorithms to eliminate noise and manage other processing challenges. Therefore, advanced techniques are typically needed to handle SWIR data effectively. In summary, the VNIR band provides a better predictive performance than the SWIR band owing to its richer spectral content, higher data quality, and simpler processing methods, making it suitable for several applications.
In this study, characteristic wavelengths extracted through different GA methods were used to construct the predictive model. In most cases, models based on the characteristic wavelength performed better than those of the original model. The GA effectively extracts feature wavelengths, reducing noise and minimizing redundant input data, aligning with findings from other studies. Additionally, GA voting offers distinct advantages over GA iteration, probably owing to the inherent randomness in GA iteration processes, such as the initial population generation, crossover, and mutation, which may lead to inconsistent results. Each run can yield significantly different results, and the algorithm may become trapped in local optimal solution. Owing to its sequential nature, where each iteration depends on the previous results, greatly affected by the final results. In contrast, GA voting aggregates multiple independent GA results, favoring solutions that perform well across numerous runs, thus reducing the influence of randomness., This approach enhances the reliability and stability of the results, increasing the likelihood of finding a global optimal solution. The voting approach can efficiently screen for superior solutions and may achieve improved outcomes without requiring extensive iterations.
PCA dimensionality reduction often underperforms relative to the original model, likely because of its limited ability to capture the inherent structure and complexity of nonlinear data (Baytas et al., 2016). Additionally, the high sensitivity of PCA leads to deviations in the principal components, highlighting the need for data preprocessing to mitigate these deviations. Moreover, PCA reduces data dimensions by projection, potentially leading to the loss of some information. Furthermore, PCA assumes independence among input features. However, when features are highly correlated, PCA may fail to capture all data variances, negatively affecting the performance of the reduced-dimensional model.
This study examines how different feature wavelength extraction and regression algorithms perform in analyzing the chemical composition of Ganoderma lucidum in various states. The results indicate that the model combining feature wavelength extraction with machine learning algorithms effectively predicts the chemical components of Ganoderma lucidum. Among them, the ELM model built by GLC after voting feature selection was the most effective for polysaccharides and ergosterol prediction table. This study highlights the effectiveness of hyperspectral imaging in the SWIR and VNIR ranges for quickly evaluating quality parameters in Ganoderma lucidum and has potential applications in other traditional Chinese medicines. These findings offer important insights that could advance innovative approaches in this field and serve as a reference method for quality control in traditional Chinese medicines.
The application of HSI technology in traditional Chinese medicine (TCM) is well-documented and widely studied, but studies focused on Ganoderma lucidum remain limited. Despite the achievements made in this study, some limitations persist, such as a small sample size, variability in origin and strain, and the initial stages of model parameter optimization. Especially the small sample size of only 13 samples in the test set presents numerous challenges for model evaluation, generalization performance assessment, and data mining analysis. Therefore, future research should consider expanding the sample size to improve the accuracy and reliability of the results. Studies should also examine Ganoderma lucidum from diverse production areas and varieties, incorporate predictions for additional chemical components, and further refine model parameters.
HSI is a powerful analytical technology with broad application prospects and development potential. Simultaneously, the integration of artificial intelligence and big data expands the application of HSI technology, especially in fields of TCM, such as authenticity identification, quality evaluation, and origin traceability. It can also support monitoring of cultivation, harvest, and processing of TCM. HSI contributes to quality control and production process optimization, making outstanding contributions to standardizing TCMs.
Data availability statement
Data will be made available by the authors on request.
Author contributions
JR: Writing–original draft, Visualization. HX: Data curation, Writing–review and editing. ZW: Software, Writing–review and editing. WZ: Funding acquisition, Supervision, Writing–review and editing. XB: Investigation, Resources, Writing–review and editing.
Funding
The author(s) declare that financial support was received for the research, authorship, and/or publication of this article. This work was supported by the Science and Technology Development Plan Project of Jilin Province (20210204146YY), and the National Key Research and Development Program of Ministry of Science and Technology of China (2021YFD1600900, 2021YFD1600903-02).
Conflict of interest
The authors declare that the research was conducted in the absence of any commercial or financial relationships that could be construed as a potential conflict of interest.
Generative AI statement
The author(s) declare that Generative AI was used in the creation of this manuscript. Generative AI techniques were used in this study to aid in text generation. During the course of the study, we used OpenAI’s ChatGPT model to translate and polish the initial drafts. The main purpose of using generative AI was to improve writing efficiency and help us explore different ways of expression and argument construction.
Publisher’s note
All claims expressed in this article are solely those of the authors and do not necessarily represent those of their affiliated organizations, or those of the publisher, the editors and the reviewers. Any product that may be evaluated in this article, or claim that may be made by its manufacturer, is not guaranteed or endorsed by the publisher.
References
Alfaro-Mejía, E., Manian, V., Ortiz, J. D., and Tokars, R. P. (2023). A blind convolutional deep autoencoder for spectral unmixing of hyperspectral images over waterbodies. Front. Earth Sci. 11, 1229704. doi:10.3389/feart.2023.1229704
Baytas, I. M., Lin, K., Wang, F., Jain, A. K., and Zhou, J. (2016). Stochastic convex sparse principal component analysis. EURASIP J. Bioinform Syst. Biol. 2016, 15. doi:10.1186/s13637-016-0045-x
Butt, M. H. F., Ayaz, H., Ahmad, M., Li, J. P., and Kuleev, R. (2022). A fast and compact hybrid CNN for hyperspectral imaging-based bloodstain classification. Congr. Evol. Comput. 2022, 1–8. doi:10.1109/CEC55065.2022.9870277
Chen, L. T., Liu, Z. X., Lan, Y., Ma, X., and Wang, R. J. (2024). Research on rice variety identification based on hyperspectral technology and principal component analysis. J. Agric. Sci. Technol. doi:10.13304/j.nykjdb.2023.0640
Chen, Y. Y., and Wang, Z. B. (2019). Cross components calibration transfer of NIR spectroscopy model through PCA and weighted ELM-based TrAdaBoost algorithm. Chemom. Intelligent Laboratory Syst. 192, 192103824–103824. doi:10.1016/j.chemolab.2019.103824
Cör, A. D., Knez, Ž., and Knez, M. M. (2022). Antioxidant, antibacterial, antitumor, antifungal, antiviral, anti-inflammatory, and nevro-protective activity of Ganoderma lucidum: an overview. Front. Pharmacol. 13, 934982. doi:10.3389/FPHAR.2022.934982
Cui, X., Song, Q. J., Zhang, Y. Y., Xu, G., Meng, B. P., et al. (2017). Estimation of soil organic carbon content in alpine grassland using hyperspectral data. Acta Prataculturae Sin. 10, 23–32.
Dai, C., Sun, J., Huang, X., Zhang, X., Tian, X., Wang, W., et al. (2023). Application of hyperspectral imaging as a nondestructive technology for identifying tomato maturity and quantitatively predicting lycopene content. Foods 12 (15), 2957. doi:10.3390/FOODS12152957
Dai, J., Lu, J., Lin, R. C., and Liu, W. Y. (2002). Determination of nucleosides in siweilingzhi mixture by HPCE. China J. Chin. Materia Medica 09, 28–31.
Delwiche, S. R., Rodriguez, T. I., Rausch, S. R., and Graybosch, R. A. (2019). Estimating percentages of fusarium-damaged kernels in hard wheat by near-infrared hyperspectral imaging. J. Cereal Sci. 87, 18–24. doi:10.1016/j.jcs.2019.02.008
Feng, H., Chen, Y., Song, J., Lu, B., Shu, C., Qiao, J., et al. (2024). Maturity classification of rapeseed using hyperspectral image combined with machine learning. Plant Phenomics 06, 0139. doi:10.34133/PLANTPHENOMICS.0139
He, Z., and Zhou, S. (2022). BPNN-based behavioral modeling of the S-parameter variation characteristics of PAs with frequency at different temperatures. Micromachines (Basel) 13 (11), 1831. doi:10.3390/MI13111831
Hou, S., Shi, H., Cao, X., Zhang, X., and Jiao, L. (2021). Hyperspectral imagery classification based on contrastive learning. IEEE Trans. Geoscience Remote Sens. 2021 (60), 1–13. doi:10.1109/TGRS.2021.3139099
Huang, D. L., Chen, X. K., and Xu, Y. Q. (2015). Analysis of different parts of ganoderma tsugae by fourier transform infrared spectroscopy. J. Anal. Sci. 31 (01), 59–62. doi:10.13526/j.issn.1006-6144.2015.01.013
Huang, G. B., Zhu, Q. Y., and Siew, C. K. (2006). Extreme learning machine: theory and applications. Neurocomputing 70 (01), 489–501. doi:10.1016/j.neucom.2005.12.126
Huang, W. K., Huang, Q. W., Guo, Z. X., and Zhang, W. T. (2017). Determination on ganoderic acid A in ganoderma lucidum with different growth stages and different parts by HPLC. Edible Fungi China. 01, 60–62. doi:10.13629/j.cnki.53-1054.2017.01.013
Jia, Z. Z., Du, M. H., and Wang, P. X. (2024). Tool condition monitoring based on extreme learning machine and genetic algorithm. Nat. Sci. Available at: http://kns.cnki.net/kcms/detail/53.1223.N.20240424.1556.002.html.
Jiang, W., Zhou, G. S., Chen, X. P., Ye, H., Qiao, Z., Bai, G. G., et al. (2018). Content determination of polysaccharides, triterpenoids and sterols of ganoderma lucidum pieces by ultraviolet-visible spectrophotometry. China Pharm. 14, 15–18.
Li, M. Y. (2024a). Research on multi-factor stock selection model based on decision tree. Prod. Res. 02, 145–149. doi:10.19374/j.cnki.14-1145/f.2024.02.023
Li, P. X. (2024b). Research on construction cost prediction of construction Project based on extreme iearning machine. Total Corros. Control (08), 92–94. doi:10.13726/j.cnki.11-2706/tq.2024.08.084.03
Li, X., Li, Z., Qiu, H., Chen, G., and Fan, P. (2023a). Soil carbon content prediction using multi-source data feature fusion of deep learning based on spectral and hyperspectral images. Chemosphere 336, 139161. doi:10.1016/J.CHEMOSPHERE.2023.139161
Li, X., Peng, F., Wei, Z., Han, G., and Liu, J. (2023b). Non-destructive detection of protein content in mulberry leaves by using hyperspectral imaging. Front. Plant Sci. 14, 1275004. doi:10.3389/FPLS.2023.1275004
Li, X., Wei, Z., Peng, F., Liu, J., and Han, G. (2023c). Non-destructive prediction and visualization of anthocyanin content in mulberry fruits using hyperspectral imaging. Front. Plant Sci. 14, 1137198. doi:10.3389/FPLS.2023.1137198
Liu, H., Ma, D. M., Liu, X. K., and Wang, J. Y. (2016). Forecasting incidence of hand-foot-mouth disease with the ARIMA-BPNN combination model. Mod. Prev. Med. 16, 11–14+22.
Liu, J. J., Huang, W. H., Lv, M. L., Si, J. P., Guo, B. L., and Li, S. J. (2011). Determination of ergosterol in ganoderma lucidum from different varieties and cultured tree species by HPLC. J. Chin. Med. Mater. 02, 30–33. doi:10.13863/j.issn1001-4454.2011.02.007
Liu, T., Xu, T. Y., Yu, F. H., Yuan, Q. Y., Guo, Z. H., and Xu, Bo (2021a). A method combining ELM and PLSR (ELM-P) for estimating chlorophyll content in rice with feature bands extracted by an improved ant colony optimization algorithm. Comput. Electron. Agric. 186, 106177. doi:10.1016/J.COMPAG.2021.106177
Liu, X. L., Liang, G. Y., Yang, Y., Wei, F. X., Zhang, Q. H., and Deng, T. F. (2023). Analysis of inorganic elements and nutrient components in different parts of Ganoderma Lucidum from Guizhou. J. Xinyang Normal Univ. Nat. Sci. Ed. 01, 45–51.
Liu, Y., Long, Y., Liu, H., Lan, Y., Long, T., Kuang, R., et al. (2021b). Polysaccharide prediction in Ganoderma lucidum fruiting body by hyperspectral imaging. Food Chem. X 13, 100199. doi:10.1016/J.FOCHX.2021.100199
Liu, Y., Wang, L. H., Yang, L. B., and Liu, X. M. (2022). Drought prediction based on an improved VMD-OS-QR-ELM model. PLoS One 17 (01), e0262329. doi:10.1371/JOURNAL.PONE.0262329
Lu, C., Dong, Y. N., and Qiu, X. H. (2024). An online study model based on ELM algorithm. Intelligent Comput. Applications 06, 116–124. doi:10.20169/j.issn.2095-2163.240615
Pan, Z. C., Zhong, Y., Fang, L., Qi, Z. C., Xu, J., Liang, Z. S., et al. (2024). A rapid, hyperspectral-based method for determining sporoderm-broken rate of ganoderma lucidum spore powder. Chin. J. Mod. Appl. Pharm. (06), 38–44. doi:10.13748/j.cnki.issn1007-7693.20231852
Reddy, P., Panozzo, J., Guthridge, K. M., Spangenberg, G. C., and Rochfort, S. J. (2023). Single seed near-infrared hyperspectral imaging for classification of perennial ryegrass seed. Sensors (Basel) 23, 1820. doi:10.3390/S23041820
Shi, F. M., Tong, X. R., Ding, Z. M., Sun, C., and Liu, W. S. (2013). Difference analysis of active components content in different medicinal parts of three species of ganoderma lucidum. China Med. Pharm. 21, 43–45+50.
Sun, J., Yao, K., Cheng, J., Xu, M., and Zhou, X. (2024). Nondestructive detection of saponin content in Panax notoginseng powder based on hyperspectral imaging. J. Pharm. Biomed. Anal. 242, 116015. doi:10.1016/J.JPBA.2024.116015
Sun, W., Liu, S., Zhang, X., and Zhu, H. (2022). Performance of hyperspectral data in predicting and mapping zinc concentration in soil. Sci. Total Environ. 824, 153766. doi:10.1016/J.SCITOTENV.2022.153766
Wang, H., Zhu, H., Bi, L., Xu, W., Song, N., Zhou, Z., et al. (2023). Quality grading of river crabs based on machine vision and GA-BPNN. Sensors (Basel) 23 (11), 5317. doi:10.3390/S23115317
Wang, M., Liu, Y. P., Pei, L., and Li, B. (2024a). Application of nuclear magnetic resonance hydrogen spectroscopy in quality control of ganoderma polysaccharides. Edible Fungi China. 02, 91–98. doi:10.13629/j.cnki.53-1054.2024.02.014
Wang, T. T., Xu, J., and Liu, X. L. (2024b). Research progress on ganoderma cultivation. J. Fungal Res. 01, 98–106. doi:10.13341/j.jfr.2023.1678
Wang, Y. F., Zhang, L. J., and Duan, H. P. (2021). Hydraulic performance optimization of radial diffuser multistage pump based on genetic algorithm-back propagation neural network. Sci. Technol. Eng. 04, 144–150.
Xia, F. N., Guan, X. Y., Chen, S. D., Chen, Q. Y., Zhang, Y. F., and Yang, X. B. (2023). Fingerprint analysis and content determination of lipid components in ganoderma lucidum spore powder by HPLC-ELSD. Acta Edulis Fungi 06, 56–63. doi:10.16488/j.cnki.1005-9873.2023.06.006
Xiao, Q., Bai, X., Gao, P., and He, Y. (2020). Application of convolutional neural network-based feature extraction and data fusion for geographical origin identification of radix astragali by visible/short-wave near-infrared and near infrared hyperspectral imaging. Sensors (Basel) 20 (17), 4940. doi:10.3390/s20174940
Xu, J., Xu, D., Bai, X., Yang, R., and Cao, J. (2022). Non-destructive detection of moldy walnuts based on hyperspectral imaging technology. Molecules 27 (20), 6776. doi:10.3390/MOLECULES27206776
Yang, J., Xian, L., Zhong, T. S., Wei, L. N., Li, Y. R., and Fu, H. Y. (2017). Rapid identification of different kinds of Ganoderma lucidum based on near infrared spectroscopy fingerprint information. Lishizhen Med. Mater. Medica. Res. 28 (06), 1359–1361.
Yang, Y., Nan, R., Mi, T., Song, Y., Shi, F., Liu, X., et al. (2023). Rapid and nondestructive evaluation of wheat chlorophyll under drought stress using hyperspectral imaging. Int. J. Mol. Sci. 24 (6), 5825. doi:10.3390/IJMS24065825
Ye, W., Yan, T., Zhang, C., Duan, L., Chen, W., Song, H., et al. (2022). Detection of pesticide residue level in grape using hyperspectral imaging with machine learning. Foods 11, 1609. doi:10.3390/FOODS11111609
Yu, Y., and Sun, D. L. (2024). Research on corrosion rate prediction of buried pipeline based on PCA-BPNN model. J. Lanzhou Univ. Technol. 04, 66–74.
Yuan, S. Q., Shen, Y. L., Zhang, J. F., and Yuan, J. P. (2009). Performance predicting of centrifugal pumps with compound impeller based on improved BP neural network. Transactions of the Chinese Society for Agricultural Machinery 09, 31+83–86.
Zeng, F. Q., Lu, M. L., Xue, Z. W., and Peng, N. (2023). Analysis of 18 main triterpenoids in basidiomata of Ganoderma lingzhi by HPLC. Mycosystema 11, 142–152. doi:10.13346/j.mycosystema.230095
Zhang, M., Huang, Y. K., Yuan, Q. D., Zhao, H. X., Huang, L. Y., and Guo, D. L. (2024). Study on modeling and prediction of carbon paper base paper properties based on GA-BPNN algorithm. China Pulp and Pap. 43 (01), 121–127.
Zhang, M. H., Zhang, Y., Zhang, Z. Q., Da, H., Li, L., and Jia, Y. C. (2024). Permafrost distribution innortheast China based on boosting regression tree. J. Harbin Inst. Technol. Available at: http://kns.cnki.net/kcms/detail/23.1235.T.20240624.1556.014.html.
Zhang, Q. Q. (2020). Analytical study of triterpenoids from Ganoderma lingzhi fruiting bodies through infrared spectrocopy. University of Science and Technology of China. doi:10.27517/d.cnki.gzkju.2020.001539
Zhang, Q. Q., and Huang, Q. (2021). Quantitative analysis of Ganoderma polysaccharides content in fruiting bodies by near-infrared spectroscopy. Mycosystema 01, 257–265. doi:10.13346/j.mycosystema.200218
Zhang, S., Yin, Y., Liu, C., Li, J., Sun, X., and Wu, J. (2023). Discrimination of wheat flour grade based on PSO-SVM of hyperspectral technique. Spectrochim. Acta A Mol. Biomol. Spectrosc. 302, 123050. doi:10.1016/J.SAA.2023.123050
Keywords: polysaccharide, ergosterol, hyperspectral imaging, machine learning model, medicinal fungus
Citation: Ran J, Xu H, Wang Z, Zhang W and Bai X (2025) Non-destructive analysis of Ganoderma lucidum composition using hyperspectral imaging and machine learning. Front. Chem. 13:1534216. doi: 10.3389/fchem.2025.1534216
Received: 25 November 2024; Accepted: 30 January 2025;
Published: 26 February 2025.
Edited by:
Federica Aureli, National Institute of Health (ISS), ItalyReviewed by:
Sulaymon Eshkabilov, North Dakota State University, United StatesEstefania Alfaro Mejia, University of Puerto Rico at Mayagüez, Puerto Rico
Jinhuan Xu, Qilu University of Technology, China
Copyright © 2025 Ran, Xu, Wang, Zhang and Bai. This is an open-access article distributed under the terms of the Creative Commons Attribution License (CC BY). The use, distribution or reproduction in other forums is permitted, provided the original author(s) and the copyright owner(s) are credited and that the original publication in this journal is cited, in accordance with accepted academic practice. No use, distribution or reproduction is permitted which does not comply with these terms.
*Correspondence: Wei Zhang, weizcaas@126.com; Xueyuan Bai, baixy1212@163.com