 Nikita V. Penkov
- Institute of Cell Biophysics, Federal Research Center “Pushchino Scientific Center for Biological Research of the Russian Academy of Sciences”, Pushchino, Russia
In this work, the terahertz time-domain spectroscopy method analyzed solutions of bovine serum albumin (BSA) in two high concentrations (50 and 334 mg/mL) at three pH values (2.5, 6.5, 8.5) and the same solvents without protein, at 25°C. The spectra of dry BSA were also recorded. For the first time, a method for determining the complex dielectric permittivity of protein molecules in aqueous solutions, without the dielectric contribution of the aqueous phase, is proposed. It is shown that the dielectric permittivity of dissolved and dry BSA (lyophilized, in the native conformation) differ significantly in the terahertz frequency range. These differences are small near 70 cm−1, but they increase greatly with decreasing frequency. It was found that the dielectric losses of protein molecules in solution are close to the dielectric losses of the aqueous environment, which in this frequency range are determined by intermolecular relaxation processes of water. Since dielectric losses are directly related to molecular dynamics, this fact shows that the intramolecular dynamics of the protein completely adjusts to the intermolecular dynamics of the aqueous environment. It also indicates that the native conformation does not determine all the fundamental characteristics of a protein molecule, in particular, it does not determine the dynamics of the protein, which significantly depends on the water environment.
1 Introduction
Biomolecules are the molecular basis of life. But they achieve functional states only in an aqueous environment. The most extensive class of biomolecules is proteins, the native conformation of which is formed in water with the participation of hydrophobic effects (Privalov and Gill, 1988). But not only does water affect the structure of protein, protein also affects the structure of water, forming a hydrate shell (Penkov, 2023). In other words, hydrated protein is a single mutually consistent system. For a long time it was believed that the hydrate shell consists of a small number of strongly bound water molecules in one or two hydrate layers. However, in the 2000s, terahertz (THz) spectroscopy showed that the hydrate shells of proteins are much more extended—up to several nanometers (Ebbinghaus et al., 2007; Born et al., 2009; Heyden et al., 2012; Bye et al., 2014; Novelli et al., 2017; Wang et al., 2019). The more general term “dynamic hydrate shells” has emerged (Ebbinghaus et al., 2007; Born et al., 2009; Heyden et al., 2010; Conti Nibali and Havenith, 2014), which include not only the nearest strongly bound water molecules, but also more distant hydration regions with altered intermolecular dynamics. In a series of our works, the dynamic hydrate shells of various biomolecules were studied based on the analysis of the complex dielectric permittivity of their solutions in the THz range (Penkov et al., 2018; Penkov, 2021; Penkov et al., 2021; Penkova et al., 2021; Penkov et al., 2022; Penkov, 2024). An important stage of these studies was the subtraction of the dielectric contribution of biomolecules from the permittivity of solutions. For this purpose, effective medium models were used, including the model we developed theoretically (Penkov N. and Penkova N. A., 2021). Based on THz spectra using molecular dynamics simulations, it was shown that the dynamics of the hydrate shell of a protein can correlate with the intrinsic dynamics of the protein (Born et al., 2009; Heyden et al., 2010; Conti Nibali and Havenith, 2014; Pezzotti et al., 2023). Thus, THz spectroscopy has demonstrated unsurpassed sensitivity in the analysis of molecular dynamics in aqueous solutions of biomolecules, mainly proteins.
In this paper, the following question is raised: are all the properties of a protein molecule determined by its conformation? Or, besides structural characteristics, are there dynamic characteristics that are activated by the aqueous environment? The study of protein dynamics has been paid attention in many studies using various experimental techniques (Krupianskii et al., 1987; Johansson and Lindorff-Larsen, 2018; Schirò and Weik, 2019; Campitelli et al., 2020; Hodge et al., 2020; Bondar, 2022; Stingaciu, 2022). However, these studies completely ignored the possibilities of dielectric spectroscopy.
Molecular dynamics can be analyzed using complex dielectric spectra. Each intramolecular or intermolecular degree of freedom is reflected in the dielectric permittivity at characteristic frequencies. The intramolecular dynamics of macromolecules, such as proteins, is well manifested in the THz frequency range (Markelz, 2008; Wei et al., 2018). Thus, it is possible to try to answer the above question by comparing the THz dielectric spectra of the protein in dry and hydrated form. When obtaining dry protein, it is important to avoid significant changes in its structure, for example, denaturation. For small model proteins such as bovine serum albumin (BSA), this structure can be preserved by lyophilization. And measuring the spectrum of dry protein is not difficult. The analysis of hydrated protein is much more complicated. Since the dynamic hydrate shell of a protein molecule can exceed its own volume (Leitner et al., 2008; Heyden et al., 2012; Wallace et al., 2015; Wang et al., 2019), a protein can be considered fully hydrated only in an aqueous solution. Therefore, it is necessary to find a way to isolate the dielectric spectrum of a protein from the spectra of its solutions. In this paper, this problem is solved using an effective medium model that interconnects THz dielectric spectra of protein solutions of two concentrations, pure solvent and dissolved protein.
2 Methods
2.1 Preparation of samples
Solutions of BSA (>99%, Dia-M, Russia) were prepared in two concentrations: 334 and 50 mg/mL. Aqueous solutions of 150 mm NaCl at three pH values: 2.5, 6.5, 8.5 were used as solvents for protein. In total, six types of BSA solutions and three types of pure solvents were analyzed. The solvents were prepared from water MilliQ (Millipore, Germany) and NaCl (Sigma-Aldrich, United States), and the pH was set using HCl (Sigma-Aldrich, United States) and NaOH (Sigma-Aldrich, United States) additives. The protein was dissolved at room temperature with shaking on Bio Vortex V1 (Biosan, Latvia) for 15 min. During this time, the protein clots visible to the eye completely disappeared in a solution with a concentration of 334 mg/mL. After that, the solutions were degassed in a degassing station (TA Instruments, New Castle, United States) for 15 min to eliminate air bubbles that may interfere with spectral measurements (Section 2.2).
Also, dry protein samples were prepared for spectral measurements by mixing 15 mg of BSA with 150 mg of polyethylene powder (Sigma-Aldrich, United States). The mixture was evenly distributed by shaking in a test tube. No additional grinding was carried out. Since the protein is quite sticky, during the grinding process it would stick to the walls of a mortar or ball mill. This would lead to an uncontrolled loss of protein mass in the sample. A mixture of protein and polyethylene was pressed into pellets with a diameter of 13 mm at a pressure of 0.75 kbar.
Preparation of pellets is usually carried out under greater pressure to reduce the looseness of the pellets and minimize the radiation scattering in the air cavities. However, at greater pressures there is a risk of a baric change in the structure of the protein (Ceolın, 2000). During spectral measurements (Section 2.2), the possible looseness of the pellets with BSA was compensated by the similar looseness of the background pellets, which were prepared from 150 mg of pure polyethylene compressed under the same pressure. In addition, it was verified that the difference in the thickness of pellets compressed at a pressure of 0.75 and 4 kbar (typical pressure used for spectral studies of dry organic matter) does not exceed 0.25%. That is, under a pressure of 0.75 kbar, we received almost extremely dense pellets due to the softness of its components.
2.2 Obtaining complex dielectric spectra in the THz range
The terahertz time-domain spectroscopy (THz-TDS) method was used. The spectra were measured on a TPS Spectra 3000 spectrometer (Teraview, United Kingdom) in the range of 10–110 cm−1 with a spectral resolution of 4 cm−1. This method implements a procedure for coherent generation and detection of picosecond electromagnetic pulses. Picosecond pulses are characterized by a spectrum with a width of several THz, measured from the zero frequency, which allows spectral measurements to be carried out in the THz region. Without going into the details of the THz-TDS method, which can be found in the literature (Lee, 2009), it allows simultaneous measurement of the absorption spectrum
where
To obtain the spectra of dry protein, the spectra of a pellet with BSA and the background spectra of pure polyethylene pellet with a mass equal to the mass of polyethylene in pellet with BSA were recorded. To obtain the spectra of
The protein weight was 15 mg, the pellet area with a diameter of 1.3 cm was 1.33 cm2, and the BSA density was about 1.41 g/cm3 (Fischer et al., 2009). As a result, the effective thickness of the protein in the pellet was 80 µm.
Two cuvettes with windows made of Z-cut quartz were used to record the spectra of solutions. Teflon spacers with thicknesses of 50 and 100 μm were installed between the windows of these cuvettes. Since the distance between the cuvette windows may differ slightly from the thickness of the spacer, the exact distances were measured interferometrically on empty assembled cuvettes. For this purpose, a Fourier-transform infrared spectrometer Nicolet 6,700 (Thermo, United States) was used in the near infrared range, where Z-cut quartz is transparent. The technique of measuring the thickness of transparent layers using etalon effect is well known and has been used by us before (Penkov et al., 2018). The exact distances between the windows in the two cuvettes were 100.56 and 50.12 μm.
The spectrum of each solution was recorded in two specified cuvettes. The spectrum of the solution in the cuvette with larger thickness was considered the “spectrum of the sample,” and the spectrum of the same solution in the cuvette with smaller thickness was considered the “background spectrum.” Thus, the final spectra of absorption and refractive index were determined for a solution layer with a difference thickness of 50.48 μm with a complete subtraction of the contribution of the cuvette windows. This approach allows us to obtain much more accurate spectra than with the standard recording of the spectrum of an empty cell as a background. This eliminates distortions of the spectra associated with the etalon effect, as well as with the difference in the reflection coefficient of radiation from an empty and filled cuvette (Penkov et al., 2015). From the obtained solutions spectra of
All spectral measurements of the solutions were carried out in cuvettes placed in a thermostatic holder at a temperature of 25 C ± 0.2 C. The optical part of the spectrometer was purged with dried air with a steadily reduced water vapor content by more than 20 times relative to laboratory air. After installing the sample cuvette in the cuvette compartment, a pause of 5 min was maintained to stabilize the sample temperature and purge the spectrometer.
The spectra of each sample were measured at least 30 times for the possibility of averaging and statistical analysis.
2.3 Calculation of the complex dielectric permittivity spectra of a protein
Obtaining dielectric spectra of dry protein can be easily performed according to the procedure described in Section 2.2. However, determining the dielectric spectra of protein in solution is much more difficult, which is the main task of this study. From the point of view of the electrodynamics of continuous media (Landau et al., 1984), a protein solution can be considered a two-phase system consisting of a continuous aqueous medium with inclusions of protein molecules. In some cases, it is desirable to highlight the third phase of hydrate shells.
Taking into account the molecular weight of BSA of 66.5 kDa and the protein density of 1.41 g/mL, in the approximation of the sphericity of a protein globule, its diameter is 5.3 nm. On the totality of available scientific evidence we can conclude that the dynamic hydration shell of the protein has a thickness of about 1.5–2 nm (Ebbinghaus et al., 2007; Born et al., 2009; Heyden et al., 2012; Bye et al., 2014; Wang et al., 2019). Based on this, the volume of hydrated water exceeds the volume of protein by about 3–4 times. The volume fraction of BSA in a solution with a concentration of 334 mg/mL is
where
Note that there are various effective medium models, except for the Bruggeman model. However, this model has proven itself well in the analysis of two-phase systems not only with spherical inclusions, but also with randomly arranged inclusions of arbitrary shape (Choy, 1999). At the same time, the Bruggeman model does not require setting additional unknown parameters of the inclusions shape. To describe the dielectric response of heterogeneous systems in alternating fields, the Bruggeman model is applicable under the following two conditions: small inclusions compared to the wavelength of radiation and weak absorption of radiation by individual inclusions (Sihvola, 1999). Obviously, both of these conditions are fulfilled when analyzing solutions of globular proteins in the terahertz range.
From Eq. 3,
A less concentrated BSA solution (50 mg/mL) can be considered as a three-phase dielectric system consisting of protein inclusions, hydrate shells and the rest of the aqueous phase of the solution, identical to the pure solvent. For a three-phase system, the Bruggeman model is written as follows:
where
It is obvious that the dynamic hydrate shell does not have a clear outer boundary. In fact, the effect of protein on the structural and dynamic characteristics of water decreases with increasing distance from the protein surface. Therefore, the transition from hydrated to non-hydrated water is somewhat conditional. However, since we analyze the system using THz spectroscopy, which is sensitive to changes in water under the influence of protein at distances up to 1.5–2 nm, at longer distances this method will already detect undisturbed water identical to water in a pure solvent.
According to the above estimates, the dynamic hydrate shells of the protein approximately correspond to the total volume of water in a BSA solution with a concentration of 334 mg/mL. Then the volume fraction of hydrate shells
After substituting the expression (Eq. 4) for
The coefficients
3 Results and discussion
The analytical solution of Eq. 6 gives an extremely cumbersome expression, which is not given here. Due to the large number of coefficients in large degrees, the solution of this equation turns out to be very sensitive to the parameters included in it. To obtain stable values of
The analysis of Eq. 6 shows that the first term is small compared to the other two terms due to the small coefficient f. If this term is neglected, the degree of the equation decreases, and the solution becomes much more stable, so that the experimental variation of the parameters included in Eq. 6 does not significantly affect the determined values of
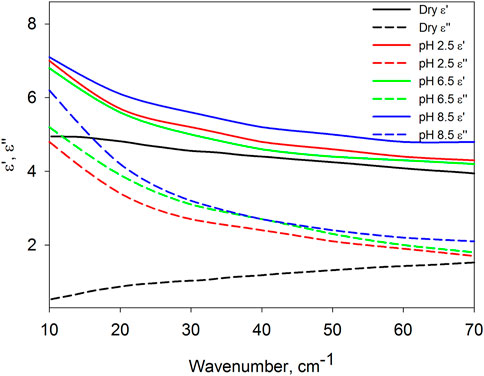
Figure 1. Averaged dielectric spectra, their real (
Figure 1 shows that the dielectric spectra of protein in solution are strikingly different from those of dry protein. The differences between the real and imaginary parts of the dielectric permittivity are small near 70 cm−1, but increase sharply with decreasing frequency. Despite the approximate nature of the spectra found, the opposite frequency dependence of the dielectric losses (
Figure 2 compares the dielectric losses of a dissolved protein with a solvent. Surprisingly, they are close to each other in the entire frequency range.
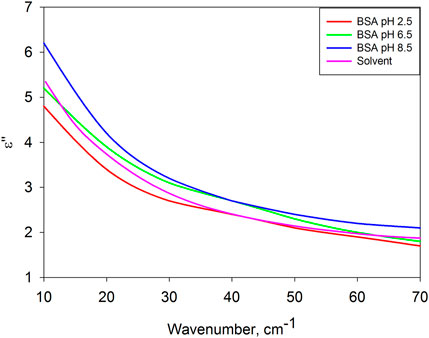
Figure 2. Dielectric losses of BSA in solutions with pH = 2.5, 6.5, 8.5 and solvent at pH 6.5 (solvent spectra at pH = 2.5 and 8.5 are practically indistinguishable from the case of pH = 6.5, therefore they are not given).
According to the dielectric characteristics, the solvents used are almost identical to water. The dielectric spectra of water in the frequency range under consideration are determined by two relaxation bands (Figure 3) due to intermolecular dynamics of bound (von Hippel, 1988a; von Hippel, 1988b; Barthel et al., 1990; Lyashchenko and Lileev, 2010) and free (Barthel et al., 1990; Yada et al., 2008; Penkov et al., 2013; Shiraga et al., 2017) water molecules. This type of molecular organization of liquid water has no common features with the protein globule. However, their dielectric response is almost the same. It is generally believed that a biomolecule, by binding water on its surface, completely determines the structure of its hydrate shell. The obtained result gives grounds to assert the opposite, but for molecular dynamics: in solution, the intramolecular dynamics of a protein molecule is slaved to the intermolecular dynamics of the aqueous environment.
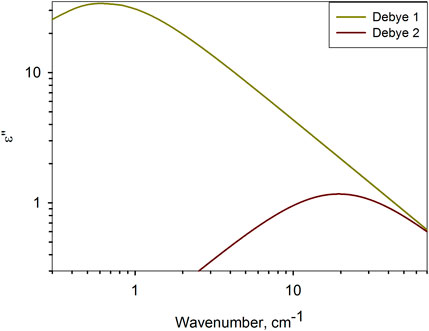
Figure 3. Relaxation bands of water at 25°C (Penkov N. V. and Penkova N., 2021), determining the dielectric response of water in the range of 10–70 cm−1. Debye 1 describes Debye relaxation (von Hippel, 1988a; von Hippel, 1988b), and Debye 2 describes high–frequency relaxation of water (Yada et al., 2008; Penkov et al., 2013).
In this work, three pH values of the solutions were selected, at which BSA takes on different conformations (Rosenoer, 1977; Cao et al., 2013): at pH 2.5, the protein has an extended form, which is formed as a result of the destruction of the inner helical part of domain I; at pH 6.5, protein is in native form; at pH 8.5, the protein passes into the basic form, in which there is also a change in the domain I. It is important that with all these conformations, the protein retains colloidal stability, does not denature and does not aggregate (Penkov et al., 2018; Penkov, 2024). Previously, we showed that the structural and dynamic characteristics of hydrate shells depend on the conformation of biomolecules (Penkov, 2021; Penkov et al., 2021; Penkova et al., 2021; Penkov et al., 2022), including proteins (Penkov et al., 2018). Based on this, it can be expected that the dynamics of the protein itself depends on its conformation. Unfortunately, the data presented in Figure 1, taking into account the proximity of the curves and the approximation of the equation solution indicated above, do not allow us to establish reliable differences in the dielectric characteristics of the protein in different conformations.
Nevertheless, the study of the conformational specificity of protein dynamics is of deep scientific interest. As it has been shown in various examples (Born et al., 2009; Ebbinghaus et al., 2012; Meister et al., 2013; Adams et al., 2021), mutations leading to changes in the rigidness of a protein molecule affect the ability of proteins to perform their biological functions. Conformational changes also lead to a change in the rigidness of the protein molecule and clearly affect the functional abilities of the protein. Any mechanical changes must be accompanied by a change in dynamic characteristics. The determination of the dependence of the protein dynamics in solution on its conformation may be of great importance for understanding the fundamental foundations of biochemistry and molecular biology, in particular the principles of enzyme functioning (Palmer and Bonner, 2007). However, to study this, it is necessary either to learn how to obtain much more accurate dielectric spectra using the THz-TDS method, or to look for other ways to determine the dynamic characteristics of proteins in solutions.
Nevertheless, in this work, in terms of dielectric permittivity, significant differences in the dynamics of BSA in dissolved and dry form are clearly shown, including for BSA of the same native conformation. Using the example of a model protein (BSA) this shows that the native conformation itself does not determine all the fundamental characteristics of protein molecules, in particular, it does not determine their dynamics. But the aqueous environment has a key influence on protein dynamics. This fact, when examined in more detail, can have far-reaching consequences for physical chemistry, biochemistry and molecular biophysics.
Data availability statement
The raw data supporting the conclusions of this article will be made available by the author, without undue reservation.
Author contributions
NP: Conceptualization, Data curation, Formal Analysis, Funding acquisition, Investigation, Methodology, Project administration, Resources, Software, Supervision, Validation, Visualization, Writing–original draft, Writing–review and editing.
Funding
The author declares that no financial support was received for the research, authorship, and/or publication of this article.
Acknowledgments
The idea of this study was born after fruitful discussions with Professor Valentin Lobyshev at the VII Congress of Russian Biophysicists in 2023. This study was performed using equipment of the Optical Microscopy and Spectrophotometry core facility of the Institute of Cell Biophysics of the Federal Research Center “Pushchino Scientific Center for Biological Research of the Russian Academy of Sciences” (http://www.ckp-rf.ru/ckp/670266/).
Conflict of interest
The author declares that the research was conducted in the absence of any commercial or financial relationships that could be construed as a potential conflict of interest.
Publisher’s note
All claims expressed in this article are solely those of the authors and do not necessarily represent those of their affiliated organizations, or those of the publisher, the editors and the reviewers. Any product that may be evaluated in this article, or claim that may be made by its manufacturer, is not guaranteed or endorsed by the publisher.
References
Adams, E. M., Pezzotti, S., Ahlers, J., Rüttermann, M., Levin, M., Goldenzweig, A., et al. (2021). Local mutations can serve as a game changer for global protein solvent interaction. JACS Au 1 (7), 1076–1085. doi:10.1021/jacsau.1c00155
Barthel, J., Bachhuber, K., Buchner, R., and Hetzenauer, H. (1990). Dielectric spectra of some common solvents in the microwave region. Water and lower alcohols. Chem. Phys. Lett. 165 (4), 369–373. doi:10.1016/0009-2614(90)87204-5
Bondar, A.-N. (2022). Graphs of hydrogen-bond networks to dissect protein conformational dynamics. J. Phys. Chem. B 126 (22), 3973–3984. doi:10.1021/acs.jpcb.2c00200
Born, B., Kim, S. J., Ebbinghaus, S., Gruebele, M., and Havenith, M. (2009). The terahertz dance of water with the proteins: the effect of protein flexibility on the dynamical hydration shell of ubiquitin. Faraday Discuss. 141, 161–173. doi:10.1039/B804734K
Bruggeman, D. A. G. (1935). Berechnung verschiedener physikalischer konstanten von heterogenen substanzen. I. Dielektrizitätskonstanten und leitfähigkeiten der mischkörper aus isotropen substanzen. Ann. Phys. 416 (7), 636–664. doi:10.1002/andp.19354160705
Bye, J. W., Meliga, S., Ferachou, D., Cinque, G., Zeitler, J. A., and Falconer, R. J. (2014). Analysis of the hydration water around bovine serum albumin using terahertz coherent synchrotron radiation. J. Phys. Chem. A 118 (1), 83–88. doi:10.1021/jp407410g
Campitelli, P., Modi, T., Kumar, S., and Ozkan, S. B. (2020). The role of conformational dynamics and allostery in modulating protein evolution. Ann. Rev. Biophys. 49 (1), 267–288. doi:10.1146/annurev-biophys-052118-115517
Cao, X.-L., Li, H.-W., Yue, Y., and Wu, Y. (2013). pH-induced conformational changes of BSA in fluorescent AuNCs@BSA and its effects on NCs emission. Vib. Spectrosc. 65, 186–192. doi:10.1016/j.vibspec.2013.01.004
Ceolin, M. (2000). Perturbed angular correlation experiments on the pressure-induced structural modification of bovine serum albumin. J. Biochem. Bioph. Methods 45 (2), 117–125. doi:10.1016/S0165-022X(00)00113-5
Choy, T. C. (1999). Effective medium theory: principle and applications. Oxford, UK: Clarendon Press.
Conti Nibali, V., and Havenith, M. (2014). New insights into the role of water in biological function: studying solvated biomolecules using terahertz absorption spectroscopy in conjunction with molecular dynamics simulations. JACS 136 (37), 12800–12807. doi:10.1021/ja504441h
Ebbinghaus, S., Kim, S. J., Heyden, M., Yu, X., Heugen, U., Gruebele, M., et al. (2007). An extended dynamical hydration shell around proteins. Proc. Nat. Acad. Sci. 104 (52), 20749–20752. doi:10.1073/pnas.0709207104
Ebbinghaus, S., Meister, K., Prigozhin, M. B., DeVries, A. L., Havenith, M., Dzubiella, J., et al. (2012). Functional importance of short-range binding and long-range solvent interactions in helical antifreeze peptides. Biophys. J. 103 (2), L20–L22. doi:10.1016/j.bpj.2012.06.013
Fischer, H., Polikarpov, I., and Craievich, A. F. (2009). Average protein density is a molecular-weight-dependent function. Protein Sci. 13 (10), 2825–2828. doi:10.1110/ps.04688204
Heyden, M., Ebbinghaus, S., and Havenith, M. (2010). “Terahertz spectroscopy as a tool to study hydration dynamics,” in Encyclopedia of analytical chemistry. Editor R. A. Meyers (John Wiley and Sons, Ltd), 1–19. doi:10.1002/9780470027318.a9162
Heyden, M., Tobias, D. J., and Matyushov, D. V. (2012). Terahertz absorption of dilute aqueous solutions. J. Chem. Phys. 137 (23), 235103. doi:10.1063/1.4772000
Hodge, E. A., Benhaim, M. A., and Lee, K. K. (2020). Bridging protein structure, dynamics, and function using hydrogen/deuterium-exchange mass spectrometry. Protein Sci. 29 (4), 843–855. doi:10.1002/pro.3790
Johansson, K. E., and Lindorff-Larsen, K. (2018). Structural heterogeneity and dynamics in protein evolution and design. Curr. Opin. Struct. Biol. 48, 157–163. doi:10.1016/j.sbi.2018.01.010
Krupianskiĭ, I. F., Shaĭtan, K. V., Gol’danskiĭ, V. I., Kurinov, I. V., and Rubin, A. B. (1987). Study of protein dynamics using Mössbauer spectroscopy. Biofizika 32 (5), 761–774. Available at: http://www.ncbi.nlm.nih.gov/pubmed/3318937.
Landau, L. D., Lifshitz, E. M., and Pitaevskii, L. P. (1984). Electrodynamics of continuous media. 2nd ed. New York: Oxford.
Leitner, D. M., Gruebele, M., and Havenith, M. (2008). Solvation dynamics of biomolecules: modeling and terahertz experiments. HFSP J. 2 (6), 314–323. doi:10.2976/1.2976661
Lyashchenko, A., and Lileev, A. (2010). Dielectric relaxation of water in hydration shells of ions. J. Chem. Eng. Data 55 (5), 2008–2016. doi:10.1021/je900961m
Markelz, A. G. (2008). Terahertz dielectric sensitivity to biomolecular structure and function. IEEE J. Sel. Top. Quantum Electron. 14 (1), 180–190. doi:10.1109/JSTQE.2007.913424
Meister, K., Ebbinghaus, S., Xu, Y., Duman, J. G., DeVries, A., Gruebele, M., et al. (2013). Long-range protein-water dynamics in hyperactive insect antifreeze proteins. Proc. Nat. Acad. Sci. 110 (5), 1617–1622. doi:10.1073/pnas.1214911110
Novelli, F., Ostovar Pour, S., Tollerud, J., Roozbeh, A., Appadoo, D. R. T., Blanch, E. W., et al. (2017). Time-domain THz spectroscopy reveals coupled protein–hydration dielectric response in solutions of native and fibrils of human lysozyme. J. Phys. Chem. B 121 (18), 4810–4816. doi:10.1021/acs.jpcb.7b02724
Palmer, T., and Bonner, P. L. (2007). Enzymes. Cambridge, United Kingdom: Woodhead Publishing Limited. doi:10.1533/9780857099921
Penkov, N., and Penkova, N. A. (2021a). Effective medium model applied to biopolymer solutions. Appl. Spectrosc. 75 (12), 1510–1515. doi:10.1177/00037028211042027
Penkov, N. V., and Penkova, N. (2021b). Key differences of the hydrate shell structures of ATP and Mg·ATP revealed by terahertz time-domain spectroscopy and dynamic light scattering. J. Phys. Chem. B 125 (17), 4375–4382. doi:10.1021/acs.jpcb.1c02276
Penkov, N. V., Shvirst, N. E., Yashin, V. A., and Fesenko, E. E. (2013). On singularities of molecular relaxation in water solutions. Biophys. Russ. Fed. 58 (6), 731–738. doi:10.1134/S000635091306016X
Penkov, N., Shvirst, N., Yashin, V., Fesenko, J. E., and Fesenko, E. (2015). Terahertz spectroscopy applied for investigation of water structure. J. Phys. Chem. B 119 (39), 12664–12670. doi:10.1021/acs.jpcb.5b06622
Penkov, N., Yashin, V., Fesenko, E., Manokhin, A., and Fesenko, E. (2018). A study of the effect of a protein on the structure of water in solution using terahertz time-domain spectroscopy. Appl. Spectrosc. 72 (2), 257–267. doi:10.1177/0003702817735551
Penkov, N. V., Yashin, V. A., and Belosludtsev, K. N. (2021). Hydration shells of DPPC liposomes from the point of view of terahertz time-domain spectroscopy. Appl. Spectrosc. 75 (2), 189–198. doi:10.1177/0003702820949285
Penkov, N. V., Penkova, N. A., and Lobyshev, V. I. (2022). Special role of Mg2+ in the formation of the hydration shell of adenosine triphosphate. Phys. Wave Phenom. 30 (5), 344–350. doi:10.3103/S1541308X22050090
Penkov, N. V. (2021). Relationships between molecular structure of carbohydrates and their dynamic hydration shells revealed by terahertz time-domain spectroscopy. Int. J. Mol. Sci. 22 (21), 11969–11988. doi:10.3390/ijms222111969
Penkov, N. V. (2023). Terahertz spectroscopy as a method for investigation of hydration shells of biomolecules. Bioph. Rev. 15 (5), 833–849. doi:10.1007/s12551-023-01131-z
Penkov, N. V. (2024). Peculiarities of the dynamical hydration shell of native conformation protein using a bovine serum albumin example. Appl. Spectrosc., 37028241261097. In print. doi:10.1177/00037028241261097
Penkova, N. A., Sharapov, M. G., and Penkov, N. V. (2021). Hydration shells of DNA from the point of view of terahertz time-domain spectroscopy. Int. J. Mol. Sci. 22 (20), 11089. doi:10.3390/ijms222011089
Pezzotti, S., König, B., Ramos, S., Schwaab, G., and Havenith, M. (2023). Liquid–liquid phase separation? Ask the water. J. Phys. Chem. Lett. 14 (6), 1556–1563. doi:10.1021/acs.jpclett.2c02697
Privalov, P. L., and Gill, S. J. (1988). Stability of protein structure and hydrophobic interaction. Adv. Protein Chem. 39, 191–234. doi:10.1016/S0065-3233(08)60377-0
Rosenoer, V. M., Oratz, M., and Rothschild, M. A. (1977). Albumin: structure, function and uses. Pergamon Press. doi:10.1016/C2013-0-02701-6
Schirò, G., and Weik, M. (2019). Role of hydration water in the onset of protein structural dynamics. J. Phys. Condens. Matter 31 (46), 463002. doi:10.1088/1361-648X/ab388a
Shiraga, K., Adachi, A., Nakamura, M., Tajima, T., Ajito, K., and Ogawa, Y. (2017). Characterization of the hydrogen-bond network of water around sucrose and trehalose: microwave and terahertz spectroscopic study. J. Chem. Phys. 146 (10), 105102. doi:10.1063/1.4978232
Sihvola, A. (1999). Electromagnetic mixing formulas and applications. London, UK: IET. doi:10.1049/PBEW047E
Stingaciu, L.-R. (2022). Study of protein dynamics via neutron spin echo spectroscopy. J. Vis. Exp. 182, 61862. doi:10.3791/61862
von Hippel, A. R. (1988a). The dielectric relaxation spectra of water, ice, and aqueous solutions, and their interpretation. I. Critical survey of the status-quo for water. IEEE Trans. Electr. Insul. 23 (5), 801–816. doi:10.1109/14.8745
von Hippel, A. R. (1988b). The dielectric relaxation spectra of water, ice and aqueous solutions, and their interpretation. II. Tentative interpretation of the relaxation spectrum of water in the time and frequency domain. IEEE Trans. Electr. Insul. 23 (5), 817–823. doi:10.1109/14.8746
Wallace, V. P., Ferachou, D., Ke, P., Day, K., Uddin, S., Casas-Finet, J., et al. (2015). Modulation of the hydration water around monoclonal antibodies on addition of excipients detected by terahertz time-domain spectroscopy. J. Pharm. Sci. 104 (12), 4025–4033. doi:10.1002/jps.24630
Wang, P., Wang, X., Liu, L., Zhao, H., Qi, W., and He, M. (2019). The hydration shell of monomeric and dimeric insulin studied by terahertz time-domain spectroscopy. Biophys. J. 117 (3), 533–541. doi:10.1016/j.bpj.2019.06.028
Wei, L., Yu, L., Jiaoqi, H., Guorong, H., Yang, Z., and Weiling, F. (2018). Application of terahertz spectroscopy in biomolecule detection. Front. Laboratory Med. 2 (4), 127–133. doi:10.1016/j.flm.2019.05.001
Keywords: protein dynamics, dielectric spectra, THz, THz-TDS, hydrate shells, native conformation, BSA
Citation: Penkov NV (2024) Water determines the intramolecular dynamics of proteins. En example of bovine serum albumin. Front. Chem. 12:1444448. doi: 10.3389/fchem.2024.1444448
Received: 05 June 2024; Accepted: 12 July 2024;
Published: 25 July 2024.
Edited by:
Gerardo Leyva-Gómez, National Autonomous University of Mexico, MexicoReviewed by:
Zichao Wei, Saint-Gobain Research North America, United StatesRosario Oliva, University of Naples Federico II, Italy
Copyright © 2024 Penkov. This is an open-access article distributed under the terms of the Creative Commons Attribution License (CC BY). The use, distribution or reproduction in other forums is permitted, provided the original author(s) and the copyright owner(s) are credited and that the original publication in this journal is cited, in accordance with accepted academic practice. No use, distribution or reproduction is permitted which does not comply with these terms.
*Correspondence: Nikita V. Penkov, bnZwZW5rb3ZAcmFtYmxlci5ydQ==