 Zidi Zhu1
 Yunan Jiang
 Changrong Xia
95% of researchers rate our articles as excellent or good
Learn more about the work of our research integrity team to safeguard the quality of each article we publish.
Find out more
ORIGINAL RESEARCH article
Front. Chem. , 19 July 2024
Sec. Electrochemistry
Volume 12 - 2024 | https://doi.org/10.3389/fchem.2024.1421125
This article is part of the Research Topic Frontiers in Chemistry: Rising Stars in China View all articles
In the field of solid oxide cells (SOC), unveiling the electrochemical reaction and transfer mechanisms in mixed ionic and electronic conducting (MIEC) electrodes is of great importance. Due to the chemical capacitance effects of MIEC materials, SOC often shows large capacitance current during electrochemical tests, which might interfere with the polarization behaviors. This work presents a numerical multiphysical model based on the transport of oxygen species, which accurately and concisely replicates the current-voltage curves of a solid oxide electrolysis cell (SOEC) with MIEC electrodes under various scanning rates. The scanning IV and electrochemical impedance spectra measurement under different SOEC working conditions are combined to enable the separation of Faradic and charging currents. Thus, both the bulk diffusion and surface gaseous diffusion of the oxygen species are encompassed, which explains how the current being generated due to intertwined chemical capacitance effects and chemical reactions in the MIEC electrodes.
Although CO2 emission significantly contributes to global warming and climate change, carbon neutralization is gradually becoming the common goal of humanity. Among the cutting-edge technologies to reduce carbon emission, the high-temperature solid oxide electrolysis cell (SOEC) has been proven to be one of the most viable and efficient approach. SOEC technology demonstrates exceptional efficiency in electrolyzing CO2 into fuel at elevated temperatures ranging from 650°C to 800°C, achieving energy conversion rates exceeding 90%. Its remarkable stability and prolonged operational lifespan establish it as a pivotal technology for the conversion of CO2 into valuable fuels. This capability aligns the SOEC with the imperative need for efficient storage and utilization of renewable energy sources (Li et al., 2023; Qiu et al., 2023). SOEC can reserve renewable electricity by electrolyzing CO2 to CO, and CO can be further converted into other useful chemicals and liquid fuels more easily compared with CO2 (Leung et al., 2014). Ceria-based materials are widely used as SOEC cathodes due to their high stability and performance under SOEC cathodic conditions. As an efficient electro-catalyst for CO–CO2 conversion, doped-ceria usually shows low area-specific polarization resistance (ASR), which is a key parameter to describe the SOEC performance (Nenning et al., 2021; Uecker et al., 2023). Ceria’s high activity in catalyzing redox reactions has been extensively studied in the literature (Zhu and Yu, 2011; Zhang et al., 2012; Sala et al., 2022; Zhang et al., 2024). Nonetheless, SOEC performance can be subject to variability due to fluctuations in temperature and overpotential (Sala et al., 2022; Hauch and Blennow, 2023; Liang et al., 2023). As such, it is necessary to develop a physical model to better understand the mechanisms of mixed ion/electron conduction during the CO2 electrolysis process.
Two schools of thought have emerged in the development of SOEC models throughout its history. The first school, rooted in the well-established tradition of classical electrochemical kinetics, focused on the observation that these electrodes tend to conform to Tafel kinetics at moderate-to-high overpotential. However, these results tend to conform to a Butler–Volmer expression, with the exchange current density and anodic and cathodic transfer coefficients obtained at moderate-to-high overpotential. Although some authors concluded that the electrode reaction must be limited by electrochemical kinetics at the interface, the limiting current behavior at high cathodic overpotential suggests otherwise (Gödickemeier et al., 1997; Hu and Liu, 1997; Okamoto et al., 1982).
Nonetheless, gas-diffusion electrodes exhibit multiple rate-determining factors, which change with overpotential or other conditions, so such electrodes deviate substantially from traditional electrochemical–kinetic behavior (Adler et al., 1996; Sala et al., 2022). Therefore, the second school of thought directs attention to the electrode’s impedance and suggests that equivalent RC circuits reveal large capacitances, which exceed the explanation provided by traditional double-layer polarization at the electrode–electrolyte interface (Bauerle, 1969). Kleitz and co-workers studied porous Pt and noble-metal catalysts on YSZ, which responded at significantly lower frequencies than traditional interfacial polarization. These frequencies are outside the scope of traditional interfacial polarization (Schouler et al., 1973). Low-frequency capacitive effects were interpreted by the authors as changes in the concentration of “neutral-O” around the three-phase boundary. Based on their findings, the authors concluded that the overpotential is likely to be a concentration overpotential, at least in part, rather than being attributed solely to electrochemical–kinetic resistance.
Electrochemical impedance spectroscopy (EIS) has emerged as a highly influential experimental technique for analyzing gas-diffusion electrodes in the current solid-state electrochemical literature. EIS measures the response of the current to a sinusoidal voltage modulation with respect to frequency and seeks to identify reaction steps via the timescale (Bauerle, 1969; Bonanos et al., 2018). EIS and current interruption experiments enabled researchers to isolate electrode polarization from the electrolyte on Pt/yttria-stabilized zirconia (YSZ) or Pt/ceria and analyze it as a function of time. However, the analysis of EIS results is still an area under active exploration. The prevalent approach in the scientific literature for fitting impedance spectra involves a connected ensemble of resistors, capacitors, and/or constant phase elements. Although this model is capable of accurately representing the characteristics of various impedance spectra, it often lacks a foundation in the governing physical laws of the system. Instead, it is a pragmatic way of parameterizing the impedance model. Physically motivated models representing equivalent circuits for MIEC have been proposed multiple times in the literature, including the works of Jamnik (2003) and that of Lai and Haile (2005), which is less general but more comprehensive. The Adler–Lane–Steele model is a mathematical model that was developed by Adler et al. (1996). Subsequently, the model has undergone substantial development and has become known as the equivalent circuit model. This model is primarily utilized for describing the kinetics of mixed conducting cathodes, and thus, it warrants careful consideration (Adler, 1998; Flura et al., 2016).
In this paper, a three-electrode system with YSZ as the electrolyte and samarium-doped cerium oxide (SDC) as the working electrode was prepared, with Pt as the counter electrode. We measured the EIS under varying overpotentials. The equivalent circuit model was used to identify chemical capacitance, and a 3D multiphysics model was established by bypassing the Butler–Volmer equation. The Nernst equation and electrochemical reaction were applied along with the detailed mass transfer process that considers chemical capacitance by accounting for gas diffusion and solid diffusion inside the electrodes. With a view toward chemical capacitance, reproducible CV curves were obtained under different scanning speeds.
The resistance of cathodes, anodes, and electrolytes determines the overpotential distribution. In addition, conductivities of these parts are often used to determine overpotential on a single electrode or electrolyte, but this approach can be empirical and problematic for separating the conductivity of individual electrodes. A three-electrode system is implemented to physically determine the exact overpotential on the cathode, as seen in Figure 1.
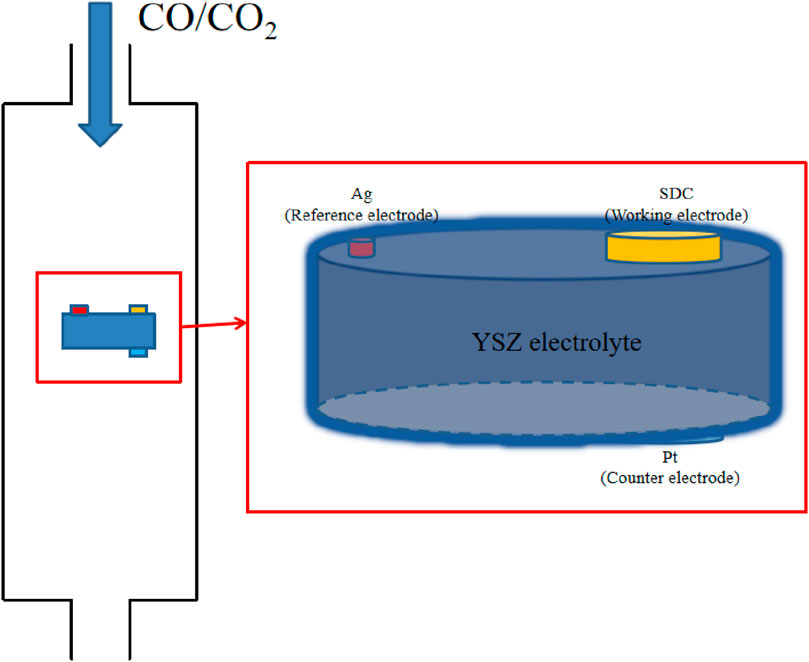
Figure 1. Schematic representation of the three-electrode system. SDC is used as the working electrode (cathode), Pt as the counter electrode (anode), and Ag as the reference electrode.
YSZ powder is ground, pressed, and sintered at 1,200°C to prepare the dense electrolyte, and the thickness and diameter of the sintered YSZ pellet are 0.5 mm and 11 mm, respectively. For the electrochemistry test in the three-electrode system, it is required that the distance separating the working electrode and the reference electrode be no less than three times the thickness of the electrolyte. The cathode material, SDC, is prepared using the glycine-nitrate combustion process, as reported in previous work (Xiang et al., 2014). The desired SDC powder is mixed with alcohol and the dispersant to prepare the SDC suspension, which is ultrasonically sprayed onto one side of YSZ to form a porous cathode with a thickness of approximately 25 μm. Platinum paste is brushed on the opposite side on the YSZ to serve as the counter electrode. Finally, an Ag reference electrode is placed on the slide of YSZ. The areas of the working and counter electrode are 0.2376 cm2. Electrochemical characterizations were performed at 750°C with CO/CO2 mixed gas of 50% of each, with inlet rates of 30 mL/min.
MIEC presents a favorable option for enhancing electrode performance. In a MIEC SOEC system, the generated electric current can be attributed to either the reduction reaction of CO2 or the variation in the concentration of oxygen anions. This relationship can be mathematically described by the following equation:
Here,
The most common form of the carbon dioxide reduction reaction is represented by the following equation:
The rate of CO2 reduction is primarily determined by the local overpotential. Additionally, the local overpotential will cause variations in the non-stoichiometry of oxygen within the MIEC. It must be stressed that these variations in local overpotential will lead to the variation in the current density with respect to the distance from the surface of the electrode (Nenning et al., 2020).
Eqs 3–7 elucidate the impact of chemical capacitance on the reaction kinetics. For the reduction reaction of CO2, jreact, the reaction current density is negative, and it can be expressed as follows:
where
The second term in Equation 1 can be equivalently written as the capacitive current density, jcap.
The electrical current is directly related to the rate at which the overpotential changes. This relationship is indicative of a capacitive current. Therefore, it is possible to introduce the concept of chemical capacitance Cchem, which measures how the concentration of oxygen anions in the MIEC depends on the overpotential. This chemical capacitance can be expressed as follows (Chueh and Haile, 2009):
By utilizing the chemical capacitance, the capacitive current density can be formulated as follows:
Consequently, the total current generated can be written as follows:
A 3D multi-physics model for SDC-YSZ is developed while fully considering the electrochemical reactions, chemical reactions, ion/electron conduction, and mass/momentum transportation. The schematic representation of the SDC-YSZ SOEC system used in the multi-physics model is shown in Figure 2. The electrode has a surface area of 0.2 cm2. Its electrolyte and cathode have thicknesses of 500 µm and 25 μm, respectively.
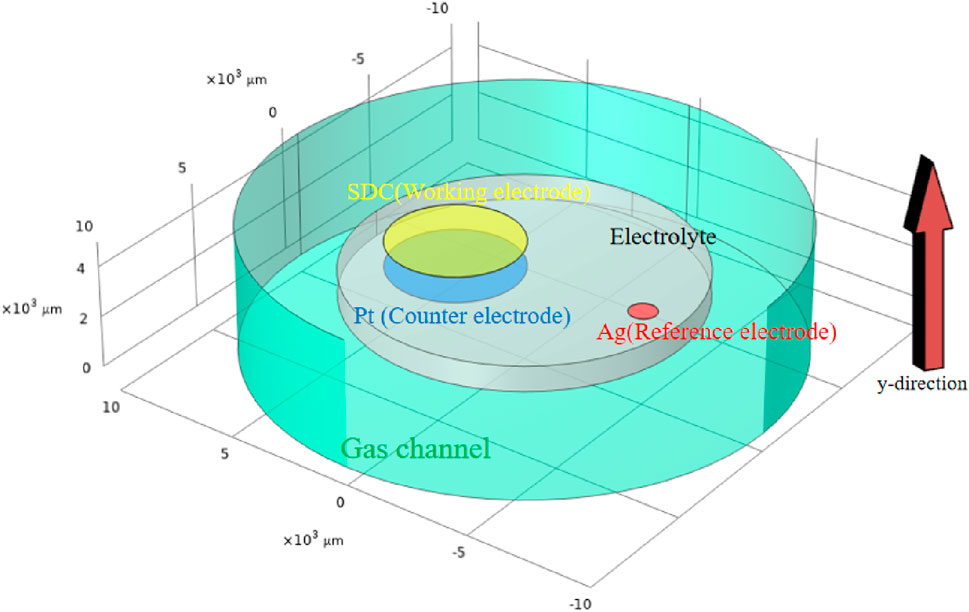
Figure 2. 3D model applied in the multi-physical model, with the area and height exactly as in the real situation. The Y-direction is designated as the local distance measured from the electrolyte to the electrode surface.
In operation, CO2 is introduced into the cathode. Gaseous CO2 molecules diffuse into the porous electrode, where adsorption occurs simultaneously with diffusion. CO2 then dissociates with oxygen vacancy on the surface, forming into CO and lattice oxygen. The lattice oxygen will be transported to anodes and get oxidized. As the electrode is a MIEC, dissociation can occur at both the triple-phase and two-phase boundary sites.
The governing equation in the gas channel is expressed in Eq. 8:
The governing equation in the porous electrode is expressed in Eq. 9:
where ci is the concentration of the reactant; Di and
The diffusion coefficient of lattice oxygen is determined as 7.59 ∗ 10−9 m2/s from the reference (Endler-Schuck et al., 2015).
The mechanism of electrolyzing CO2 for SDC as a cathode is concluded in Eqs 10 and 11:
where dissociation is the determination step (Feng et al., 2015).
In many articles, the classical Butler–Volmer equation has been applied to determine the reaction current densities. However, some articles argue that the capacitance effect on the electrodes cannot be neglected, and the Tafel method does not apply. Hence, the Butler–Volmer equation may not apply as well. To avoid the problem, assuming that CO will not accumulate at the surface of the electrodes and that the reverse reaction is neglected, the reaction rate is determined by bypassing the Butler–Volmer equation, as demonstrated in Eq. 12.
where k is the surface exchange coefficient. It is determined based on the results in Bouwmeester et al. (1994); Adler et al. (1996) as
In this step, electrons are provided by Ce. Under the of CO2/CO mixture atmosphere, Ce4+ can be reduced to Ce3+, leading to more
where K is the Boltzmann constant, T is the absolute temperature,
where
In addition, according to the reference, at 750°C, the relation between non-stoichiometric and partial pressure of oxygen is delineated by Eq. 15 (Chueh and Haile, 2009):
The partial pressure of oxygen can be determined under different overpotentials, and the non-stoichiometric pressure can be determined with the partial pressure of oxygen. Hence, the concentration of oxygen vacancy
It is noteworthy that the transmission line type has revealed that the overpotential along the y direction is not constant but coordinate-dependent. Its relation is derived in Nenning et al. (2014) as Eq. 16:
where the variable “y” represents the position along the electrode, with 0 indicating the top of the electrode and L indicating the interface with the electrolyte. Moreover, U0 denotes the total overpotential experienced across the electrode.
The reaction current and capacitive current, as shown in Eq. 7, are determined by the following equations:
where
where
Hence, the transportation process of charges inside the electrode is linked with the porosity of the electrode. The total captured current is determined by adding the reaction current and the charging current, as delineated in Eq. 20. It is notable that for negative-direction scanning, the electrode is charging and the captured current is smaller than the reaction current and vice versa for positive-direction scanning.
The overpotential E is defined as
It is imperative to emphasize that the parameters in the multi-physical model are acquired through the EIS method at various overpotentials. Consequently, as far as we know, this is the first time that the two most crucial electrochemical experimental methods of the SOEC cathode are linked, bridging together the two schools of thought for analyzing the cathode of SOECs.
EIS results of the three-electrode system at different overpotentials are presented in Figure 3. The ohmic, polarization, and total resistances obtained are summarized in Table 1.
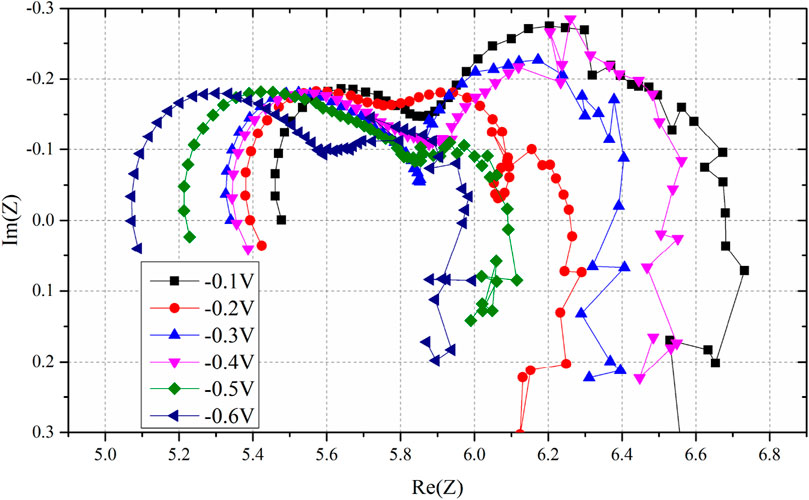
Figure 3. EIS results of overpotential from −0.1V to −0.6V; it is noteworthy that the ohmic resistance decreases with decreasing overpotential.
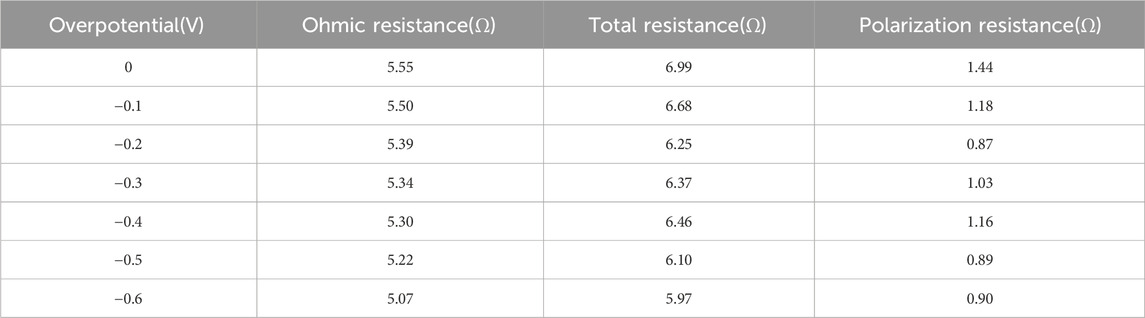
Table 1. Ohmic, polarization, and total resistances at different overpotentials.
In this paper, to better understand the process in the single-phase MIEC of SDC, an equivalent circuit model is applied. It consists of differentially thin electrode slices connected in a transmission-line-type circuit. Figure 4 depicts the model.
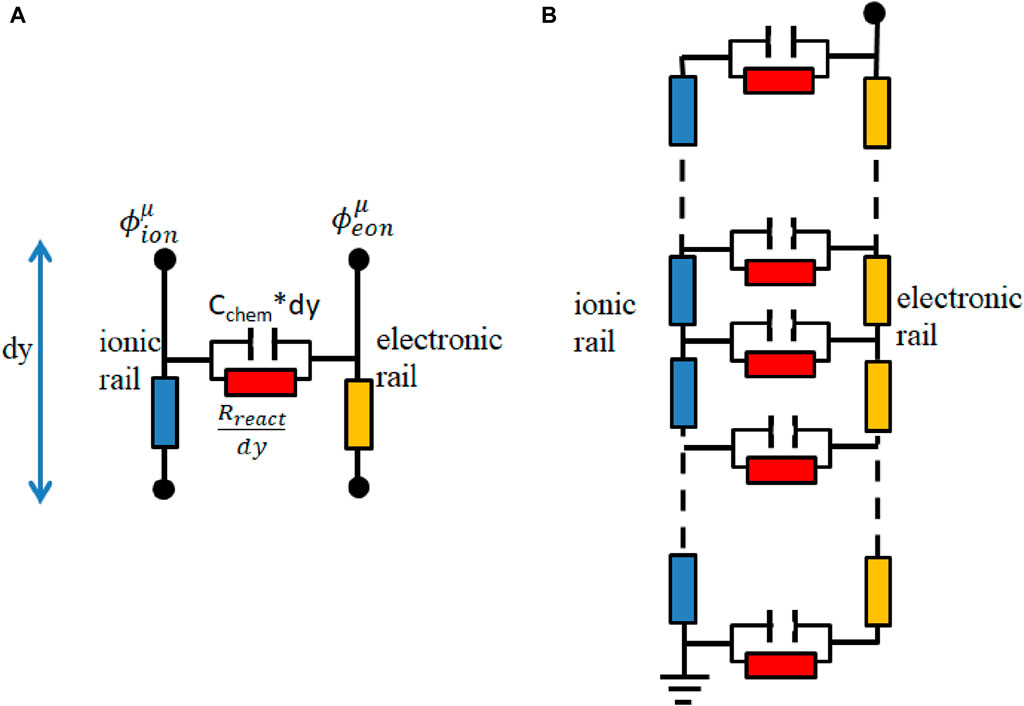
Figure 4. (A) Thin film of the electrode with infinitesimal thickness (dy); (B) equivalent circuit model.
The circuit model comprises two rails serving as a representation of ion and electron conduction. The differences in voltage present at the rails correspond to the potentials of ions and electrons and are influenced by the spatial distance along the y-direction, and y is the local distance to the electrolyte.
Rion, Reon, Rreact, and Cchem,eff are ion conduction resistance, electron conduction resistance, reaction resistance, and effective chemical capacitance of the porous electrode, respectively. The electrochemical reactions connect the ion and electron currents and are symbolized by the horizontal elements, Rreact and Cchem,eff.
The impedance of the equivalent circuit model has been mathematically deducted by Bisquert et al. (1999), although the resulting equation is rather complex.
where
Figure 5 presents the resultant circuit utilized for fitting the data. In Figure 5, Lwire and RYSZ represent wire inductance and the electrolyte resistance, respectively. CPEint,ele and CPEint,gas, as constant phase elements, represent interfacial capacitance between the electrodes and the electrolyte and that between the electrodes and the gas, respectively. Moreover, the circuit also incorporates Rint,ele and Rint,gas, representing interfacial resistance between the electrodes and the electrolyte and that between the electrodes and the gas, respectively (Nenning et al., 2020).
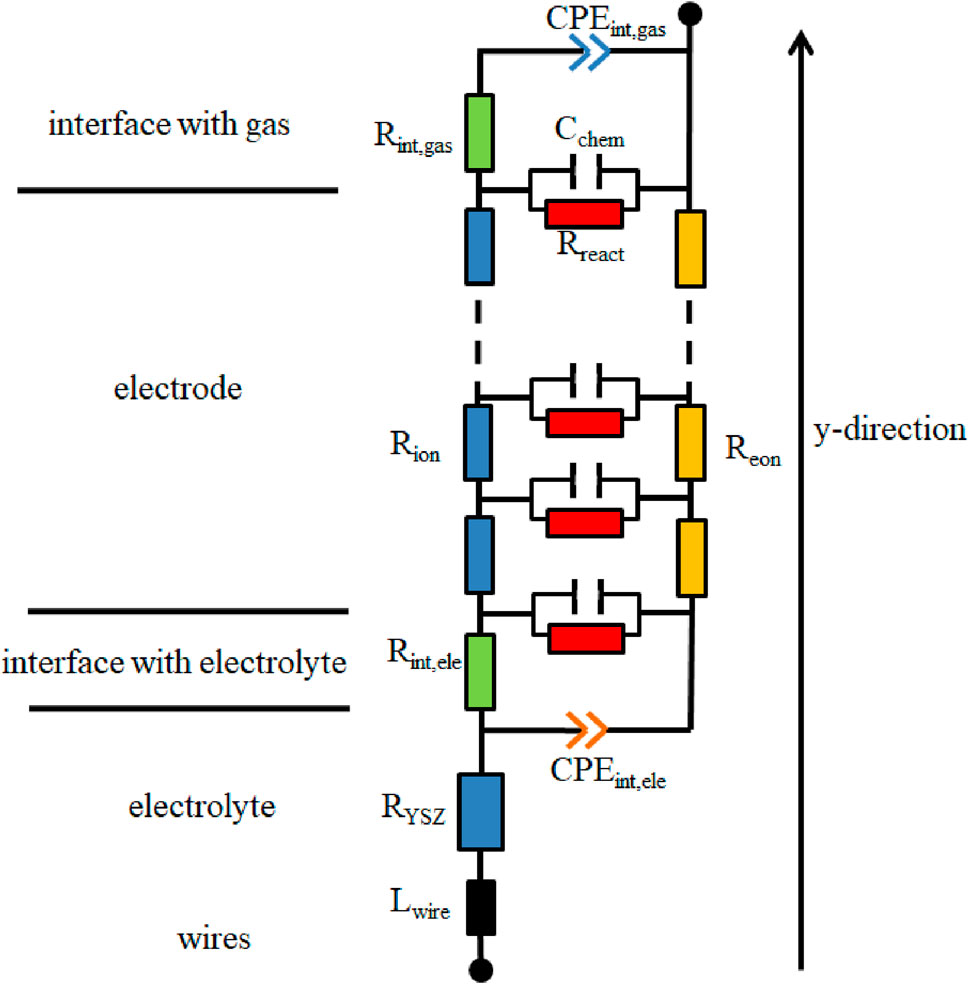
Figure 5. Circuit model used to fit impedance spectra.
The effective ASR of the electrode arc is articulated in Eq. 23
Figure 6 illustrates the mathematically identical circuit model used in Z-View software, and Table 2 shows the relationship between the fitting parameters in Z-View.
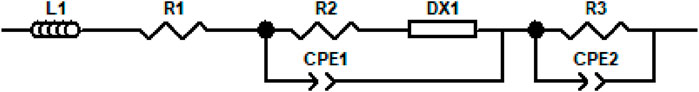
Figure 6. Circuit model applied in Z-View.
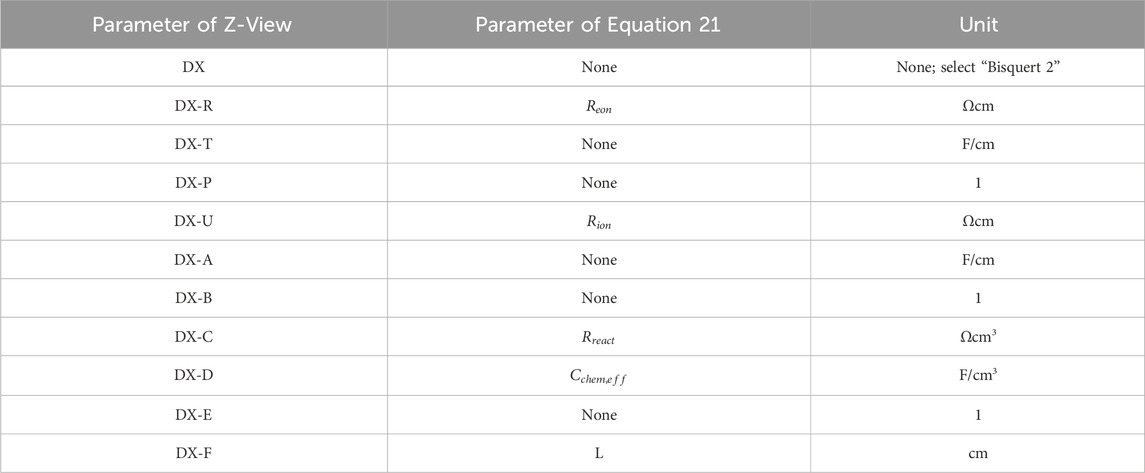
Table 2. Relationship between the fitting parameters of Z-View and the parameters of Equation 17.
The ohmic resistance decreases with increasing overpotential. Ohmic resistance is the sum of the resistance of the cathode, anode, and electrolyte. The resistance of the anode, electrolyte, and ionic resistance of the cathode are considered constant (Wu et al., 2014). This finding supports the circuit model, which suggested that
By employing Z-View software to analyze the transmission-line-type equivalent circuit, crucial parameters such as
As an example of fitting the equivalent circuit model, the EIS at −0.1 V is used. Table 3 shows the obtained parameters. Notably, the parameter names in Table 1 and Table 3 remain consistent. For instance, “DX1-R” in Table 3 corresponds to “DX-R” in Table 1, as specified in Equations 21, 22. Additionally, the “1” in “DX1-R” signifies its representation of values in the DX1 element in Figure 6. Figure 7 shows experiment and Z-View fit results of EIS at an overpotential of −0.1 V. The obtained chemical resistance (DX-D) shows consistency with the results reported in Chueh and Haile (2009). The maximum error in the impedance module is 0.9% at the same frequency, while the error in the imaginary part is 7.89% at the same frequency.
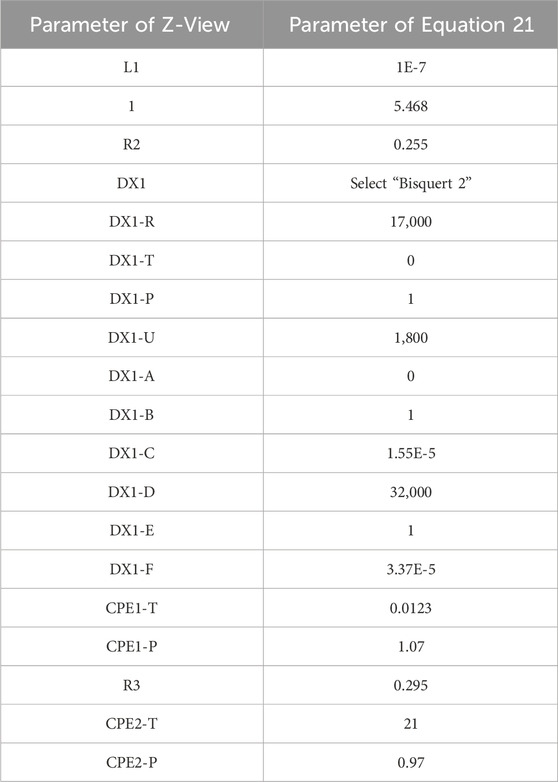
Table 3. Parameters applied in Z-View at an overpotential of −0.1 V.
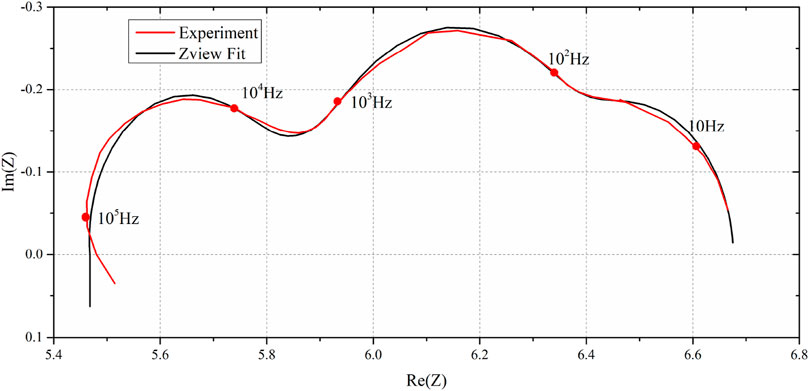
Figure 7. Experiment and Z-View fit results of EIS at an overpotential of −0.1 V.
The most critical parameter,
The IV curves are obtained for different scanning rates, including 50 mV/s and 20 mV/s. The obtained IV curves are compared with the simulation results shown in Figure 8 with respect to (a) voltage and (b) time. The IV curves were first obtained in the negative direction and then immediately turned to the positive direction using the same scanning rate.
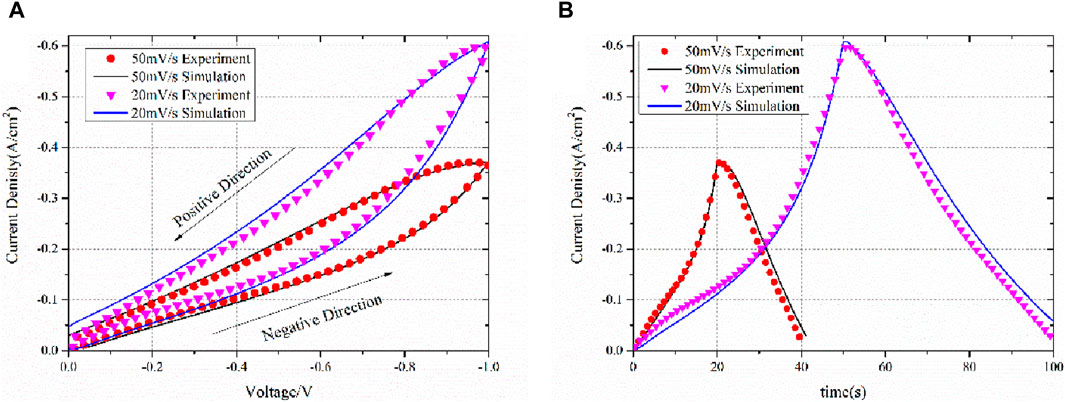
Figure 8. Experiment and simulation IV results of scanning rates of 50 mV/s and 20 mV/s with respect to (A) voltage and (B) time.
The simulated IV curves are consistent with the experimental results, thus confirming the validity of the equivalent circuit model theory. It is important to reiterate that the model does not employ the Butler–Volmer equation. Determining the kinetic parameters of the Butler–Volmer equation proves challenging. For numerous models, the exchange current density is derived from assumptions, and the transfer coefficient is typically assumed to be 0.5 for both anodes and cathodes (Xu et al., 2018; Yang et al., 2018; Wang et al., 2020). However, in the case of several electrodes, particularly porous ones, the transfer coefficient deviates from 0.5 due to the influence of the electrode’s topology (Yan et al., 2015).
As shown in Figure 8, after changing the scanning direction, the current exhibits a slight increase followed by a decrease. This phenomenon is well-reproduced in simulations, even at different scanning rates. As previously indicated, the chemical capacitance strongly affects the current. During the negative scanning direction, the capacitance will be charged, resulting in a smaller current than normal. During the positive scanning direction, the capacitance will be discharged, causing a larger than normal current. Following the reversal of the scanning direction, the electrode is fully charged as a body capacitance, and the amount of charged particles is quite large. This results in a very large discharge current, which can even be greater than the reaction current, making the current greater than the peak of the negative direction scanning. This phenomenon is, however, unsustainable, and the current subsequently drops as the overpotential scan proceeds in the positive direction.
The current density at IV is higher for a scanning rate of 20 mV/s than for a scanning rate of 50 mV/s, and this is due to the chemical capacitance. At lower scanning rates, charge has more time to charge the capacitance. At the end of the negative scanning at 20 mV/s, the charge amount in the whole electrode is larger than that at 50 mV/s. According to Equation 28, the captured current density is higher at 20 mV/s than at 50 mV/s. This phenomenon has been reported in previous studies, such as Jacobsen et al. (2001).
It is crucial to acknowledge that while electrochemical impedance spectroscopy (EIS) was conducted up to −0.6 V, the current–voltage (IV) curve simulation extended to −1.0 V. Conducting EIS at high overpotentials, such as −1.0 V, poses a potential risk of damaging the electrode, especially in a three-electrode system where the overall cell potential can exceed −2 V. Given that the normal operating potential of the SDC working electrode is lower, EIS data collected within the range of 0 V to −0.6 V are adequate to establish the relationship between impedance and overpotential. However, the scanning IV curve enables a broader potential range to be explored rapidly, with a minimal risk of electrode damage. This wider potential range covered by the IV curve simulation further validates the robustness of our model and offers valuable insights into the electrochemical behavior across a broader operating range.
One of the primary advantages of simulation is its ability to effectively separate each physical process. Figure 9 presents the current contributed by the reaction and chemical capacitance. The chemical reaction remains nearly identical, regardless of the scanning direction. However, the current density due to the chemical capacitance significantly varies depending on the scanning direction. The maximum difference in chemical capacitance can reach 72.15% of the reaction current at the same overpotential. The concept of chemical capacitance can also elucidate the phenomenon where the current is zero at the beginning but not zero when scanning back to zero overpotential. This occurs because, at the start, there is no charged lattice oxygen. However, when scanning back to zero overpotential, the discharge process is slower than the reduction of overpotential, and thus, the charged lattice oxygen remains in the entire electrode, leading to a non-zero capacitance current. Consequently, even though the reaction current becomes zero, the current associated with chemical capacitance persists. At this point, the total current primarily consists of the chemical capacitance current.
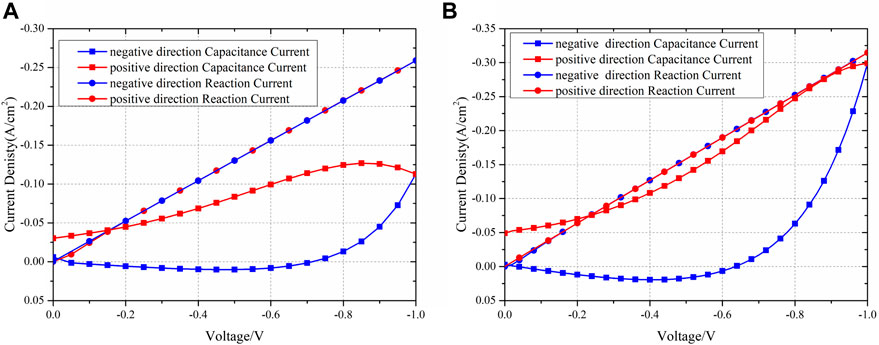
Figure 9. Experiment and simulation IV results of the separated reaction and capacitance currents of scanning rates of (A) 50 mV/s and (B) 20 mV/s.
It is important to note that the capacitive current is higher at a scan rate of 20 mV/s compared to that at 50 mV/s at −1 V. This difference can be attributed to the calculation of the capacitive current using Equation 18, where at a certain overpotential, all parameters except
Thus, it can be concluded that the difference in current observed during the scanning process in different directions is primarily caused by the chemical capacitance. Additionally, the various current densities at different scanning rates are also attributable to the chemical capacitance.
The study employed a three-electrode system to determine the precise overpotential on the SDC, and the corresponding EIS and scanning IV were measured. The transmission-line-type model was adopted to determine the kinetic parameters of a single-phase MIEC. To verify the validity of the calculated parameters, a multi-physical model based on the transport of oxygen species was established and the current–voltage curves of SOECs with MIEC electrodes under various scanning rates were accurately and concisely replicated. Our study of the single-phase SDC cathodes link the EIS method and scanning IV together for the first time, leading us to conclude that chemical capacitance significantly affects the reaction and transportation processes of the SOEC’s MIEC, and the Butler–Volmer equation may not always be necessary to describe MIEC behavior. Furthermore, for the first time, the separation of Faradaic and charging currents on SOEC cathodes was achieved.
The original contributions presented in the study are included in the article/Supplementary Material; further inquiries can be directed to the corresponding author.
ZZ: data curation, formal analysis, investigation, software, validation, writing–original draft, and writing–review and editing. YJ: conceptualization, methodology, supervision, and writing–review and editing. LZ: formal analysis and writing–review and editing. HH: methodology and writing–review and editing. AL: resources and writing–review and editing. CX: funding acquisition, resources, and writing–review and editing.
The author(s) declare that financial support was received for the research, authorship, and/or publication of this article.
The authors acknowledge with gratitude the financial support from Anhui Estone Materials Technology Co., Ltd. for their generous financial support, which has been instrumental in facilitating their research endeavors.
Authors YJ and CX were employed by Anhui Estone Materials Technology Co., Ltd.
The remaining authors declare that the research was conducted in the absence of any commercial or financial relationships that could be construed as a potential conflict of interest.
All claims expressed in this article are solely those of the authors and do not necessarily represent those of their affiliated organizations, or those of the publisher, the editors, and the reviewers. Any product that may be evaluated in this article, or claim that may be made by its manufacturer, is not guaranteed or endorsed by the publisher.
Adler, S. B. (1998). Mechanism and kinetics of oxygen reduction on porous La1−Sr CoO3−oO3Sr Co an. Solid State Ionics 111 (1-2), 125–134. doi:10.1016/s0167-2738(98)00179-9
Adler, S. B., Lane, J., and Steele, B. (1996). Electrode kinetics of porous mixed-conducting oxygen electrodes. J. Electrochem. Soc. 143 (11), 3554–3564. doi:10.1149/1.1837252
Bauerle, J. E. (1969). Study of solid electrolyte polarization by a complex admittance method. J. Phys. Chem. Solids 30 (12), 2657–2670. doi:10.1016/0022-3697(69)90039-0
Bisquert, J., Garcia-Belmonte, G., Fabregat-Santiago, F., and Compte, A. (1999). Anomalous transport effects in the impedance of porous film electrodes. Electrochem. Commun. 1 (9), 429–435. doi:10.1016/s1388-2481(99)00084-3
Bonanos, N., Steele, B. C. H., Butler, E. P., Ross Macdonald, J., William, B., and Wayne, L. (2018). Applications of impedance spectroscopy. Cedar Knolls, NJ, USA: Willey.
Bouwmeester, H., Kruidhof, H., and Burggraaf, A. (1994). Importance of the surface exchange kinetics as rate limiting step in oxygen permeation through mixed-conducting oxides. Solid state ionics 72, 185–194. doi:10.1016/0167-2738(94)90145-7
Chueh, W. C., and Haile, S. M. (2009). Electrochemical studies of capacitance in cerium oxide thin films and its relationship to anionic and electronic defect densities. Phys. Chem. Chem. Phys. 11 (37), 8144–8148. doi:10.1039/b910903j
Dan, X., Xiaomei, L., Chengjun, Z., Wang, D., Yan, D., Wang, D., et al. (2008). Study on rare earth electrolyte of SDC-LSGM. J. Rare Earths 26 (2), 241–244. doi:10.1016/s1002-0721(08)60073-3
Endler-Schuck, C., Joos, J., Niedrig, C., Weber, A., and Ivers-Tiffée, E. (2015). The chemical oxygen surface exchange and bulk diffusion coefficient determined by impedance spectroscopy of porous La0. 58Sr0. 4Co0. 2Fe0. 8O3− δ (LSCF) cathodes. Solid State Ionics 269, 67–79. doi:10.1016/j.ssi.2014.11.018
Feng, Z. A., Machala, M. L., and Chueh, W. C. (2015). Surface electrochemistry of CO 2 reduction and CO oxidation on Sm-doped CeO 2− x: coupling between Ce 3+ and carbonate adsorbates. Phys. Chem. Chem. Phys. 17 (18), 12273–12281. doi:10.1039/c5cp00114e
Flura, A., Nicollet, C., Vibhu, V., Zeimetz, B., Rougier, A., Bassat, J. M., et al. (2016). Application of the adler-lane-steele model to porous La2NiO4+δ SOFC cathode: influence of interfaces with gadolinia doped ceria. J. Electrochem. Soc. 163 (6), F523–F532. doi:10.1149/2.0891606jes
Gödickemeier, M., Sasaki, K., Gauckler, L., and Riess, I. (1997). Electrochemical characteristics of cathodes in solid oxide fuel cells based on ceria electrolytes. Electrochem. Soc. 144, 1635–1646. doi:10.1149/1.1837653
Hauch, A., and Blennow, P. (2023). Solid oxide electrolysis cells–Interplay between operating conditions, fuel electrode overpotential and degradation. Solid State Ionics 391, 116127. doi:10.1016/j.ssi.2022.116127
Hu, H., and Liu, M. (1997). Interfacial polarization characteristics of PtǀBaCe0.8Gd0.2O3ǀPt Cells at Intermediate Temperatures. J. Electrochem. Soc. 144.
Jacobsen, T., Zachau-Christiansen, B., Bay, L., and JøRGENSEN, M. J. (2001). Hysteresis in the solid oxide fuel cell cathode reaction. Electrochimica Acta 46 (7), 1019–1024. doi:10.1016/s0013-4686(00)00689-7
Jamnik, J. (2003). Impedance spectroscopy of mixed conductors with semi-blocking boundaries. Solid State Ionics 157 (1-4), 19–28. doi:10.1016/s0167-2738(02)00183-2
Ju, J., Chen, F., and Xia, C. (2014). Ionic conductivity of impregnated samaria doped ceria for solid oxide fuel cells. Electrochimica Acta 136, 422–429. doi:10.1016/j.electacta.2014.05.113
Lai, W., and Haile, S. M. (2005). Impedance spectroscopy as a tool for chemical and electrochemical analysis of mixed conductors: a case study of ceria. J. Am. Ceram. Soc. 88 (11), 2979–2997. doi:10.1111/j.1551-2916.2005.00740.x
Leung, D. Y. C., Caramanna, G., and Maroto-Valer, M. M. (2014). An overview of current status of carbon dioxide capture and storage technologies. Renew. Sustain. Energy Rev. 39, 426–443. doi:10.1016/j.rser.2014.07.093
Liang, Z., Wang, J., Wang, Y., Ni, M., and Li, M. (2023). Transient characteristics of a solid oxide electrolysis cell under different voltage ramps: transport phenomena behind overshoots. Energy Convers. Manag. 279, 116759. doi:10.1016/j.enconman.2023.116759
Li, Y., Zhang, L., Yu, B., Zhu, J., and Wu, C. (2023). CO2 high-temperature electrolysis technology toward carbon neutralization in the chemical industry. Engineering 21, 101–114. doi:10.1016/j.eng.2022.02.016
Nenning, A., Bischof, C., Fleig, J., Bram, M., and Opitz, A. K. (2020). The relation of microstructure, materials properties and impedance of SOFC electrodes: a case study of Ni/GDC anodes. Energies 13 (4), 987. doi:10.3390/en13040987
Nenning, A., Holzmann, M., Fleig, J., and Opitz, A. K. (2021). Excellent kinetics of single-phase Gd-doped ceria fuel electrodes in solid oxide cells. Mater. Adv. 2 (16), 5422–5431. doi:10.1039/d1ma00202c
Nenning, A., Opitz, A. K., Huber, T. M., and Fleig, J. (2014). A novel approach for analyzing electrochemical properties of mixed conducting solid oxide fuel cell anode materials by impedance spectroscopy. Phys. Chem. Chem. Phys. 16 (40), 22321–22336. doi:10.1039/c4cp02467b
Okamoto, H., Kawamura, G., and Kuto, T. (1982). Study of oxygen adsorption on platinum through observation of exchange current in a solid electrolyte concentration cell. Journail Sci. 28 (3), 379–382. doi:10.1016/0013-4686(83)85137-8
Qiu, P., Li, C., Liu, B., Yan, D., Li, J., and Jia, L. (2023). Materials of solid oxide electrolysis cells for H 2 O and CO 2 electrolysis: a review. J. Adv. Ceram. 12 (8), 1463–1510. doi:10.26599/jac.2023.9220767
Sala, E. M., Mazzanti, N., Mogensen, M. B., and Chatzichristodoulou, C. (2022). Current understanding of ceria surfaces for CO2 reduction in SOECs and future prospects–A review. Solid State Ionics 375, 115833. doi:10.1016/j.ssi.2021.115833
Schouler, E., Giroud, G., and Kleitz, M. (1973). Applications selon Bauerle du tracé des diagrammes d’admittance complexe en électrochimie des solides-II.—Étude de la conductivité de la zircone stabilisée à l’yttrium. J. de chimie physique 70, 1309–1316. doi:10.1051/jcp/1973701309
Uecker, J., Unachukwu, I. D., Vibhu, V., Vinke, I., Eichel, R. A., and de Haart, L. B. (2023). Electrochemical activity and stability of pure gadolinium doped ceria as fuel electrode in solid oxide electrolysis cells. ECS Trans. 111 (6), 1785–1793. doi:10.1149/11106.1785ecst
Wang, Y., Zu, B., Zhan, R., Du, Q., Ni, M., and Jiao, K. Three-dimensional modeling and performance optimization of proton conducting solid oxide electrolysis cell▴. Fuel Cells, 2020, 20(6): 701–711. doi:10.1002/fuce.201900246
Wu, W., Guan, W. B., Wang, G. L., and Wang, F. (2014). In-situ investigation of quantitative contributions of the anode, cathode, and electrolyte to the cell performance in anode-supported planar SOFCs. Adv. Energy Mater. 4 (10), 1400120. doi:10.1002/aenm.201400120
Xiang, M., Su, C.-W., Feng, L., Yuan, M., and Guo, J. (2014). Rapid synthesis of high-cycling performance LiMgxMn2–xO4 (x≤ 0.20) cathode materials by a low-temperature solid-state combustion method. Electrochimica Acta 125, 524–529. doi:10.1016/j.electacta.2014.01.147
Xu, H., Chen, B., Tan, P., Cai, W., He, W., Farrusseng, D., et al. (2018). Modeling of all porous solid oxide fuel cells. Appl. Energy 219, 105–113. doi:10.1016/j.apenergy.2018.03.037
Yang, Z., Xu, H., Chen, B., Tan, P., Zhang, H., and Ni, M. (2018). Numerical modeling of a cogeneration system based on a direct carbon solid oxide fuel cell and a thermophotovoltaic cell. Energy Convers. Manag. 171, 279–286. doi:10.1016/j.enconman.2018.05.100
Yan, W., Wang, L., Chen, C., Zhang, D., Li, A. J., Yao, Z., et al. (2015). Polystyrene microspheres-templated nitrogen-doped graphene hollow spheres as metal-free catalyst for oxygen reduction reaction. Electrochimica Acta 188, 230–239. doi:10.1016/j.electacta.2015.11.146
Zhang, L., Jiang, Y., Zhu, K., Shi, N., Rehman, Z. U., Peng, R., et al. (2024). Fe-Doped ceria-based ceramic cathode for high-efficiency CO2 electrolysis in solid oxide electrolysis cell. Small Methods, 2301686. doi:10.1002/smtd.202301686
Zhang, W., Yu, B., and Xu, J. (2012). Investigation of single SOEC with BSCF anode and SDC barrier layer. Int. J. hydrogen energy 37 (1), 837–842. doi:10.1016/j.ijhydene.2011.04.049
Keywords: solid oxide electrolysis cell, mixed ionic and electronic conducting electrodes, electrochemical impedance spectroscopy, chemical capacitance, numerical simulation
Citation: Zhu Z, Jiang Y, Zhang L, Han H, Li A and Xia C (2024) The CO2 electrolysing mechanism in single-phase mixed-conducting cathode of solid oxide cell. Front. Chem. 12:1421125. doi: 10.3389/fchem.2024.1421125
Received: 21 April 2024; Accepted: 13 June 2024;
Published: 19 July 2024.
Edited by:
Zhijun Chen, Northeast Forestry University, ChinaReviewed by:
Ziqing Wang, The University of Texas at Austin, United StatesCopyright © 2024 Zhu, Jiang, Zhang, Han, Li and Xia. This is an open-access article distributed under the terms of the Creative Commons Attribution License (CC BY). The use, distribution or reproduction in other forums is permitted, provided the original author(s) and the copyright owner(s) are credited and that the original publication in this journal is cited, in accordance with accepted academic practice. No use, distribution or reproduction is permitted which does not comply with these terms.
*Correspondence: Yunan Jiang, amlhbmd5dW5hbkB1c3RjLmVkdS5jbg==
Disclaimer: All claims expressed in this article are solely those of the authors and do not necessarily represent those of their affiliated organizations, or those of the publisher, the editors and the reviewers. Any product that may be evaluated in this article or claim that may be made by its manufacturer is not guaranteed or endorsed by the publisher.
Research integrity at Frontiers
Learn more about the work of our research integrity team to safeguard the quality of each article we publish.