 Waheed Khalid
 Shamaila Yousaf
- Department of Mathematics, University of Gujrat, Gujrat, Pakistan
This study investigates the quantitative structure–property relationship (QSPR) modeling of guar gum biomolecules, focusing on their structural parameters. Guar gum, a polysaccharide with diverse industrial applications, exhibits various properties such as viscosity, solubility, and emulsifying ability, which are influenced by its molecular structure. In this research,
1 Introduction
Guar gum, an innovative agrochemical, is derived from the endosperm of cluster beans. The species Cyamopsis tetragonoloba, belonging to the Leguminosae family, produces the seeds used in guar gum production, and these seeds are resistant to drought (Prem et al., 2005). The concept of transdomestication was introduced by Hymowitz, although the exact origins of this practice are still a matter of dispute. Further information on the subject can be found in Whistler (1948) and BeMiller (2009). Guar gum has recently piqued the curiosity of several experts for numerous reasons. Guar gum powder serves as a thickener, stabilizer, and health management tool in various industries. It consists of galactomannan polysaccharides and can be derived from different sources, including algae, plants, microorganisms, and animals (Hovgaard and Brondsted, 1996). These polysaccharides are characterized by their stability, non-toxicity, hydrophilicity, and biodegradability. Its unique properties, such as high viscosity, solubility, and stability, make it a versatile ingredient with a wide range of applications in industries like food, pharmaceuticals, cosmetics, and oil drilling. Additionally, guar gum is known for its biocompatibility and non-toxic nature, making it suitable for various biomedical and pharmaceutical applications. By studying guar gum, researchers can explore its potential uses, optimize its properties, and develop innovative products with improved performance and functionality. Overall, the selection of guar gum for research offers opportunities to advance knowledge in various fields and contribute to the development of sustainable and high-performing materials and products.
Various derivatives of guar gum exist, such as carboxymethyl guar
Chemical graph theory is an interdisciplinary field that links chemistry and mathematics. Graph modeling, originating from early chemical experiments, is a crucial aspect of theoretical chemistry. The subfield of cheminformatics analyzes quantitative structure–activity relationships
The
where mst(Γ) is the number of edges νυ ∈ E(Γ) such that {dν, dυ} = {s, t}.
Table 1 contains some degree-based TIs and the
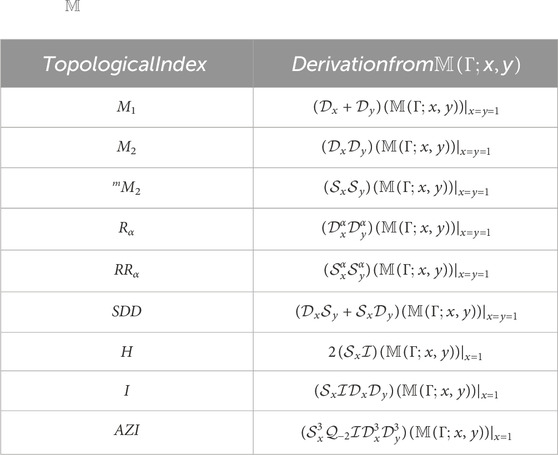
Table 1.
The topological index, frequently known as the connectedness index, was introduced in 1947 as a result of Weiner’s research (Consonni and Todeschini, 2010b). The earliest and most extensively researched topological index was the Wiener index [for further information, see (Wiener, 1947; Gutman et al., 1986)]. One of the earliest topological indices, the Randi
In 1998, Bollobs and Erds (1998) and Amic et al. (1998) independently proposed the general Randi
and
Many papers and books, such as Kier and Hall (1976) and Kier and Hall (1986), have been produced on this topological index. For drug design, the Randi
The symmetric division index (SDD) is particularly useful in determining the total surface area for polychlorobiphenyls (Gupta et al., 2016) based on the discrete Adriatic indices. The symmetric division index of a connected graph G is defined as
The harmonic index is an additional Randi
There is a relationship between graph eigenvalues and the harmonic index (Favaron et al., 1993). Using MathChem, the elegant structure of extremal graphs is used to generate the inverse sum index (Balaban, 1982), a significant predictor of the octane isomer total surface area.
Furtula et al. (2010) is credited for the augmented Zagreb index AZI, which is characterized as
Graph invariant AZI has higher prediction power than the atom-bond connectivity index (Furtula et al., 2010) and is a useful predictive measure for analyzing the heat of formation in octanes and heptanes (for more detail, see (Estrada et al., 1998; Das, 2010)). A few well-known degree-based topological indices (which are defined in Eqs 1–7) with
2 Methodology
Molecular graphs and vertex and edge partitions are used to modify the molecular structure of guar gum and its chemical derivatives (Figure 1). Topological indices are derived using
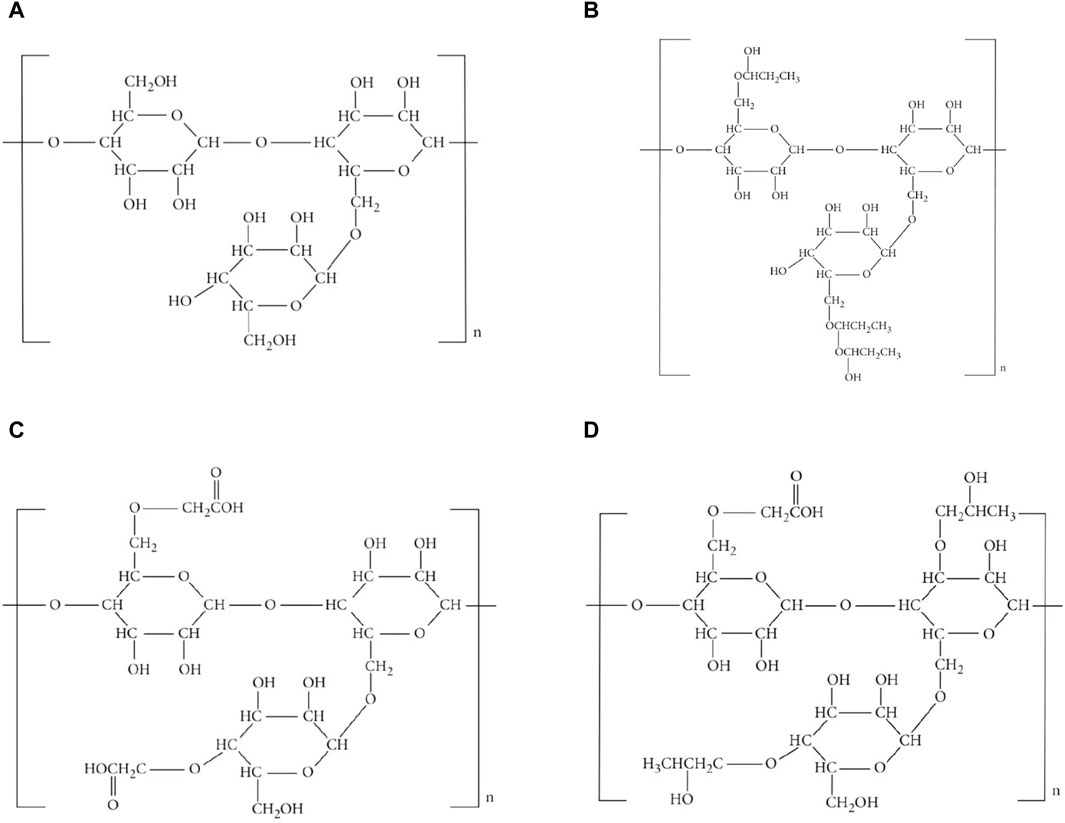
Figure 1. Molecular structure. (A) guar gum, (B) HPG, (C) CMG, and (D) CMHPG.
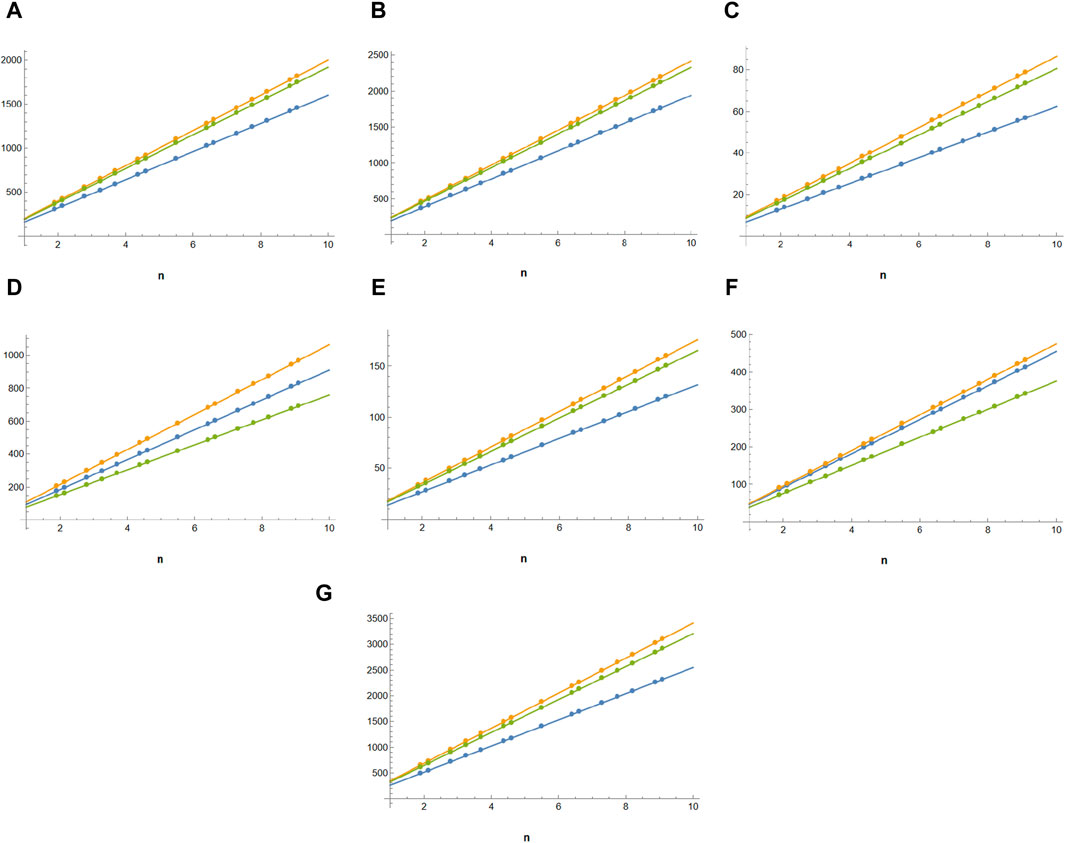
Figure 2. Comparison of topological indices of guar gum in blue,
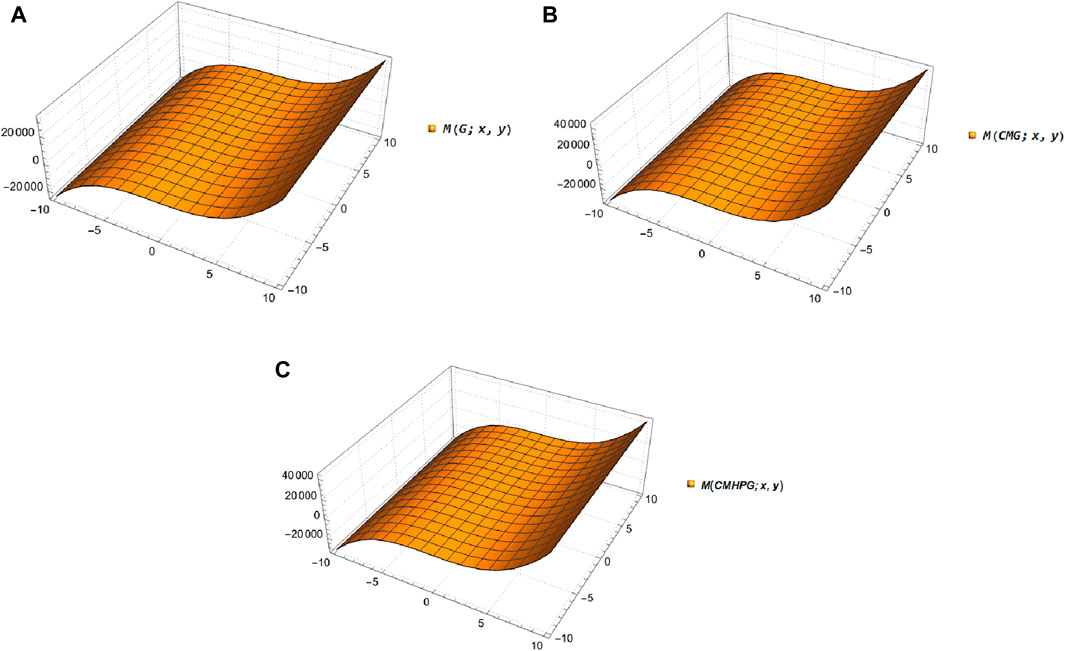
Figure 3. 3D plots of
3 Main results and discussions
This section outlines our primary analytical findings and subdivides the material into three sections: guar gum, hydroxypropyl guar, and carboxymethyl guar. The
3.1 Guar gum
This section uses various topological indices to analyze the molecular graph of guar gum. Figure 4 shows the vertex and edge partitioning of guar gum.
such that |E{1,2}| = 1, |E{1,3}| = 7n + 1, |E{2,2}| = 2n, |E{2,3}| = 14n − 1, and |E{3,3}| = 9n.
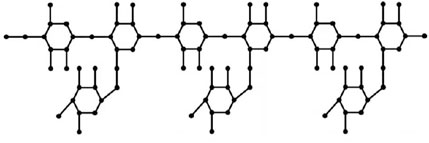
Figure 4. Guar gum molecular graph for n = 3.
Theorem 3.2. Consider a molecular graph Γ for guar gum. Then,
Proof. Using the
Proposition 3.3. Consider a molecular graph Γ for guar gum. Then,
Proof: From the edge partitioning of guar gum and using the definition
From Table 1, we obtain the following equation:
Proposition 3.4. Consider a molecular graph Γ for guar gum. Then,
Proof: From the edge partitioning of guar gum and using the definition
From Table 1, we obtain the following equation:
3.2 Results of
When the chemical derivatives of guar gum, such as
such that |E{1,2}| = 2n + 1, |E{1,3}| = 7n + 1, |E{2,2}| = 4n, |E{2,3}| = 14n − 1, and |E{3,3}| = 12n.
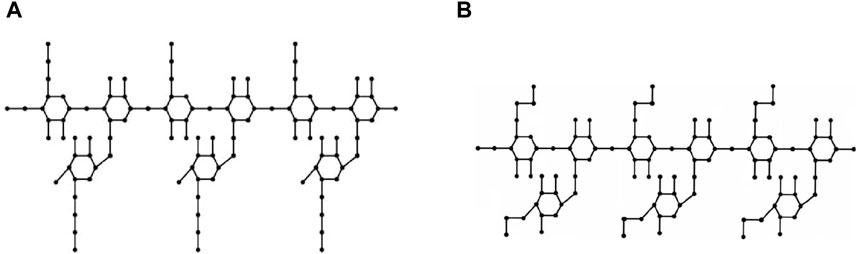
Figure 5. Molecular graph for n = 3: (A) HPG and (B) CMG.
Theorem 3.6. Consider a molecular graph Γ for hydroxypropyl Guar and carboxymethyl guar. Then,
Proof: From the edge partitioning of
Proposition 3.7. Consider a molecular graph Γ for hydroxypropyl guar and carboxymethyl guar. Then,
Proof: From the edge partitioning of
From Table 1, we obtain the following equation:
Proposition 3.8. Consider a molecular graph Γ for hydroxypropyl guar and carboxymethyl guar. Then,
Proof: From the edge partitioning of
From Table 1, we obtain the following equation:
3.3 Results for the
In the carboxymethyl hydroxypropyl guar molecular graph shown in Figure 6, for the vertices and edges, we obtain the following equation:
such that |E{1,2}| = 3n + 1, |E{1,3}| = 6n + 1, |E{2,2}| = 5n, |E{2,3}| = 15n − 1, and |E{3,3}| = 12n.
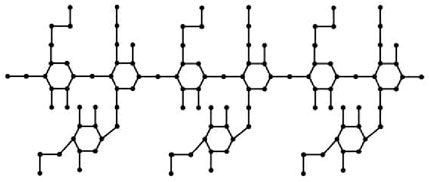
Figure 6. Molecular graph of
Theorem 3.10. Consider a molecular graph Γ for carboxymethyl hydroxypropyl guar. Then,
Proof: From the edge partitioning of
Proposition 3.11. Consider a molecular graph Γ for carboxymethyl hydroxypropyl guar. Then,
Proof: From the edge partitioning of
From Table 1, we obtain the following equation:
Proposition 3.12. Consider a molecular graph Γ for carboxymethyl hydroxypropyl guar. Then,
1. H(Γ) = 17.5n + 0.76
2. I(Γ) = 47.5n + 0.22
3. AZI(Γ) = 340.95n + 3.4
Proof: From the edge partitioning of
From Table 1, we obtain the following equation:
4 Molecular structures and computations of topological indices for different carbohydrates
Carbohydrates are organic molecules made up of carbon, hydrogen, and oxygen. They come in three main types: monosaccharides, disaccharides, and polysaccharides. These sugars or polymers can be aldehydes or ketones and serve various purposes in various species. Exoskeletons, found on arthropods, are made of chitin, a nitrogen-containing polymer. Guar gum, a non-ionic polysaccharide derived from the cluster bean endosperm, is a new agrochemical. Polysaccharides are polymers formed when several monomer units are linked together through condensation. They are the most common type of biomolecules and are found in various sources, including algal, plant, microbial, and animal sources. The structural parameters of polysaccharides typically define its chemical compositions, molecular weights, molecular structure, degree of substitution, viscosity, solubility, and particle size, contributing to their structural and chemical properties. These parameters collectively determine the functionality and performance of guar gum in various applications, making it a versatile ingredient in numerous industries. They are highly stable, secure, non-toxic, hydrophilic, and biodegradable as natural biomaterials.
This section examines eight carbohydrate molecules: arabinose, galactose, maltose, sucrose, sorbose, ribose, hydroxymethyl furfural, and raffinose. Their molecular structures are depicted in Figure 7, and their physical and chemical properties are listed in Table 2. Table 3 includes consideration of topological indices through vertex and edge partitioning, as defined in Tables 4–11.
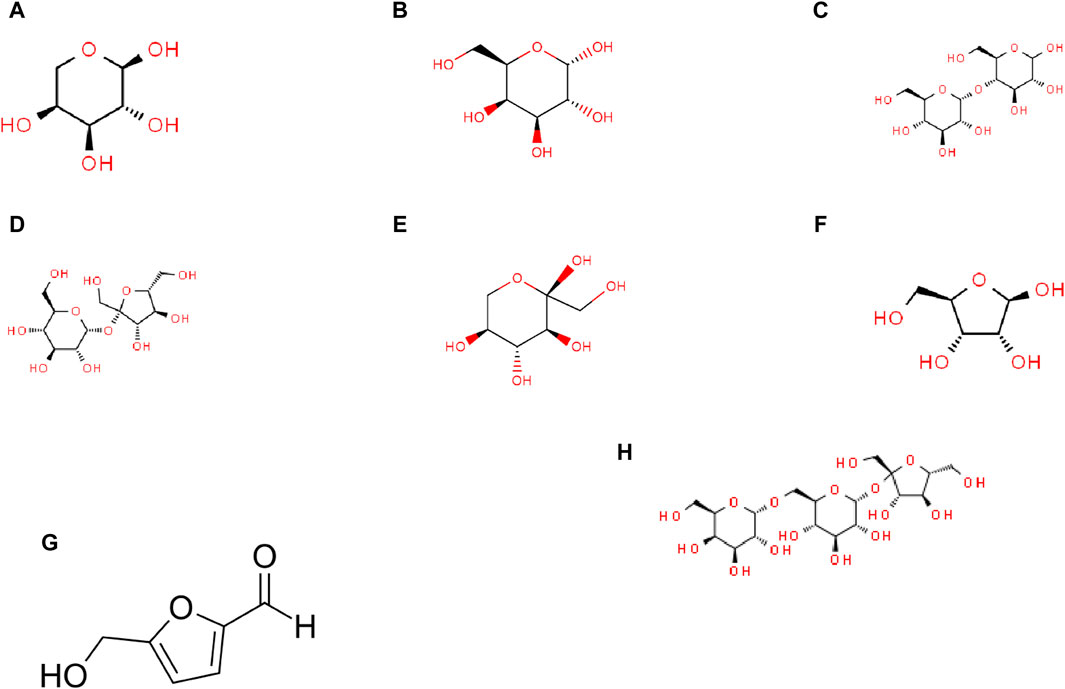
Figure 7. Molecular structures of carbohydrates: (A) arabinose, (B) galactose, (C) maltose, (D) sucrose, (E) sorbose, (F) ribose, (G) hydroxymethyl furfural (HMF), and (H) raffinose.
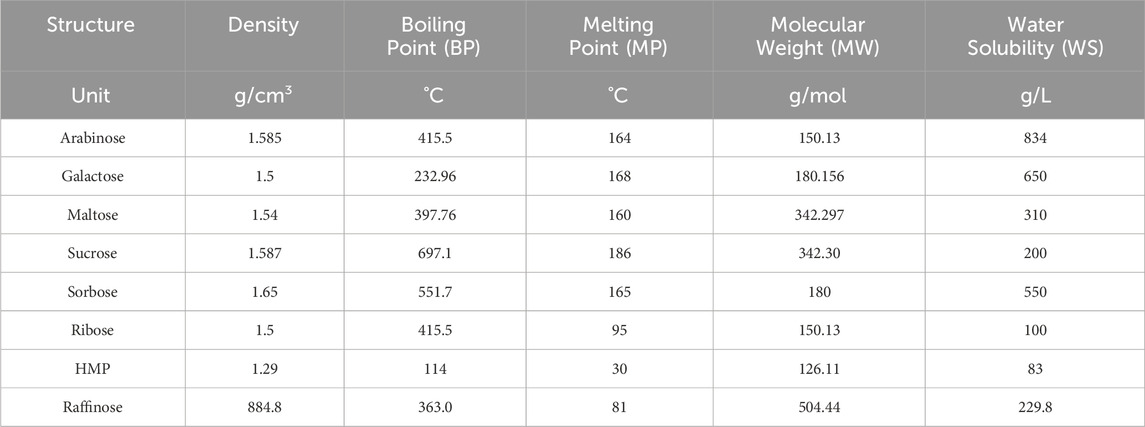
Table 2. Properties of aforementioned structures.
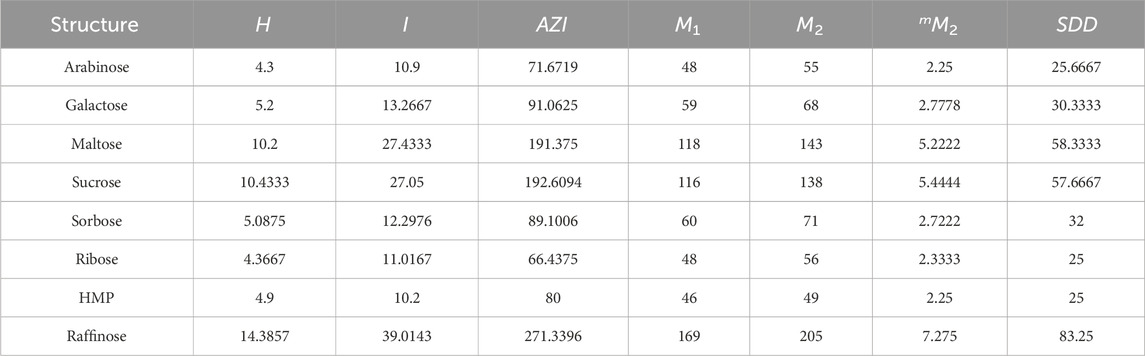
Table 3. Computation of topological indices.
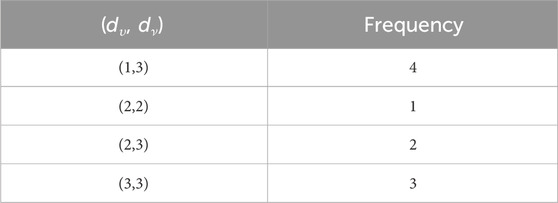
Table 4. Vertex and edge partitioning of arabinose.

Table 5. Vertex and edge partitioning of galactose.
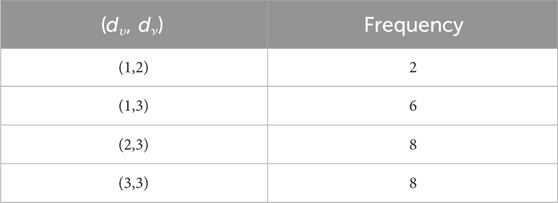
Table 6. Vertex and edge partitioning of maltose.
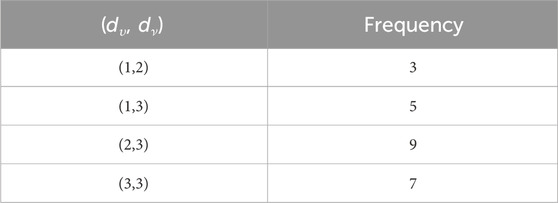
Table 7. Vertex and edge partitioning of sucrose.
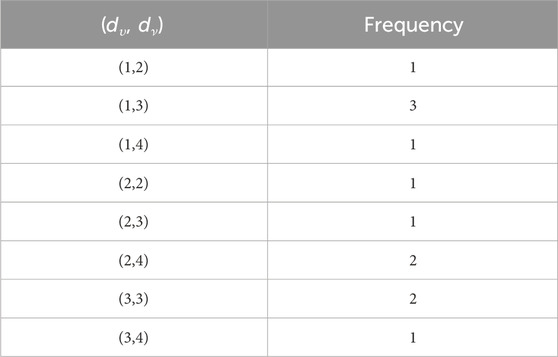
Table 8. Vertex and edge partitioning of sorbose.
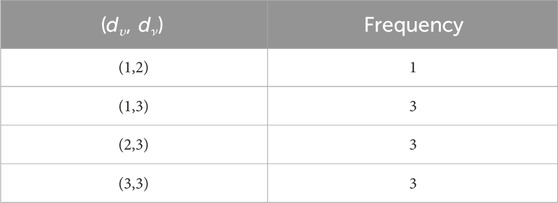
Table 9. Vertex and edge partitioning of ribose.
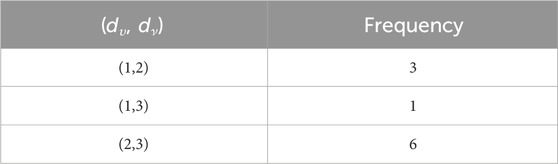
Table 10. Vertex and edge partitioning of HMP.
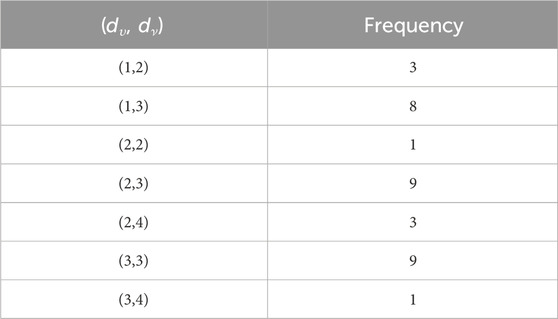
Table 11. Vertex and edge partitioning of raffinose.
5 Regression models
This section discusses linear, quadratic, and logarithmic regression models. Linear regression predicts the value of one variable based on another, while quadratic models modify variables. Log-regression models linearize variables and test the significance level between topological indices and molecular structures. The mathematical expressions for the linear, quadratic, and logarithmic regression models are as follows:
where
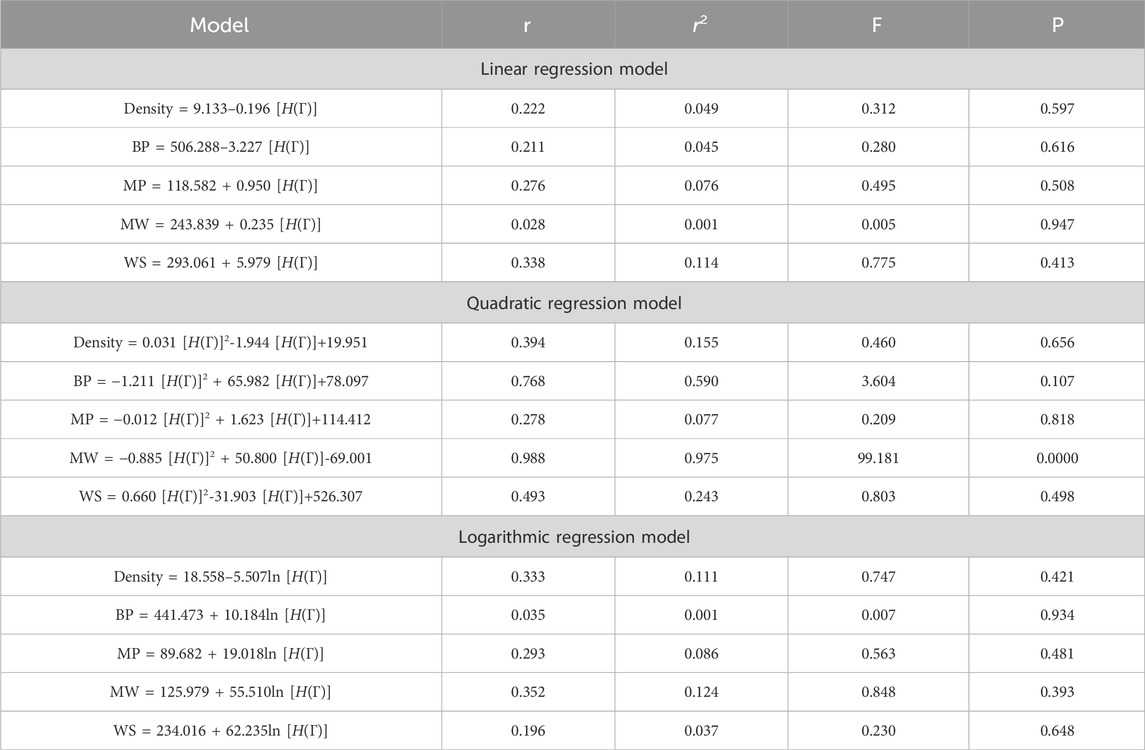
Table 12. Statistical parameters for H(Γ).
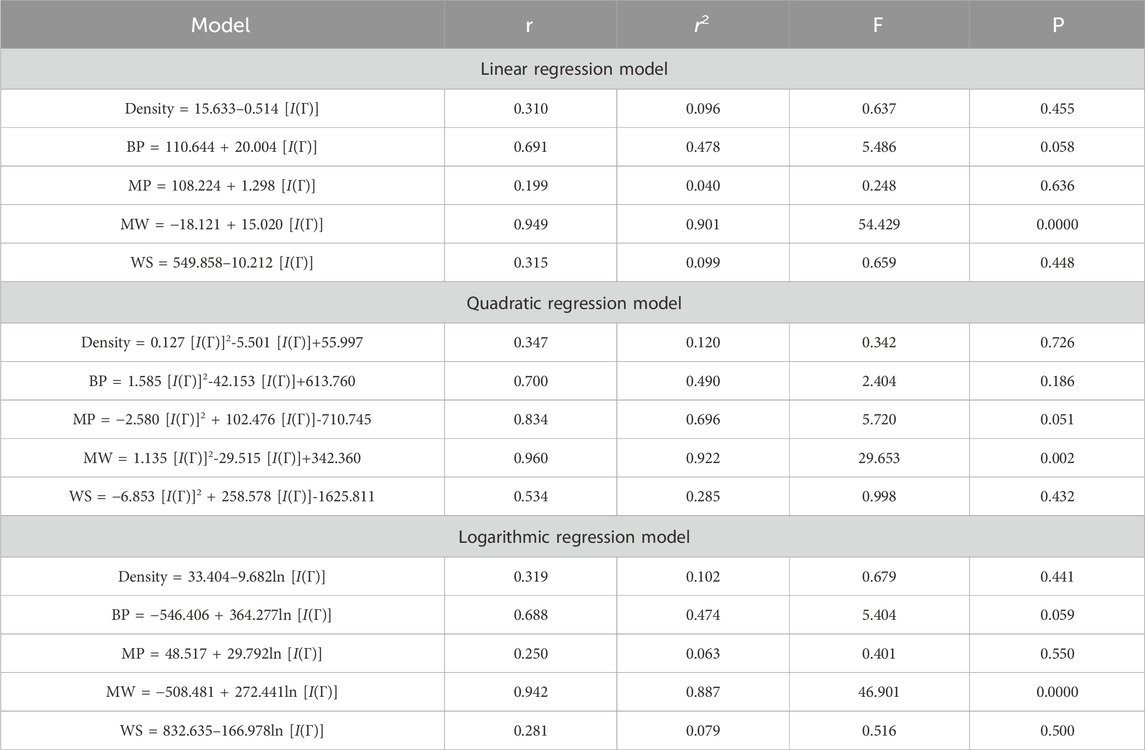
Table 13. Statistical parameters for I(Γ).
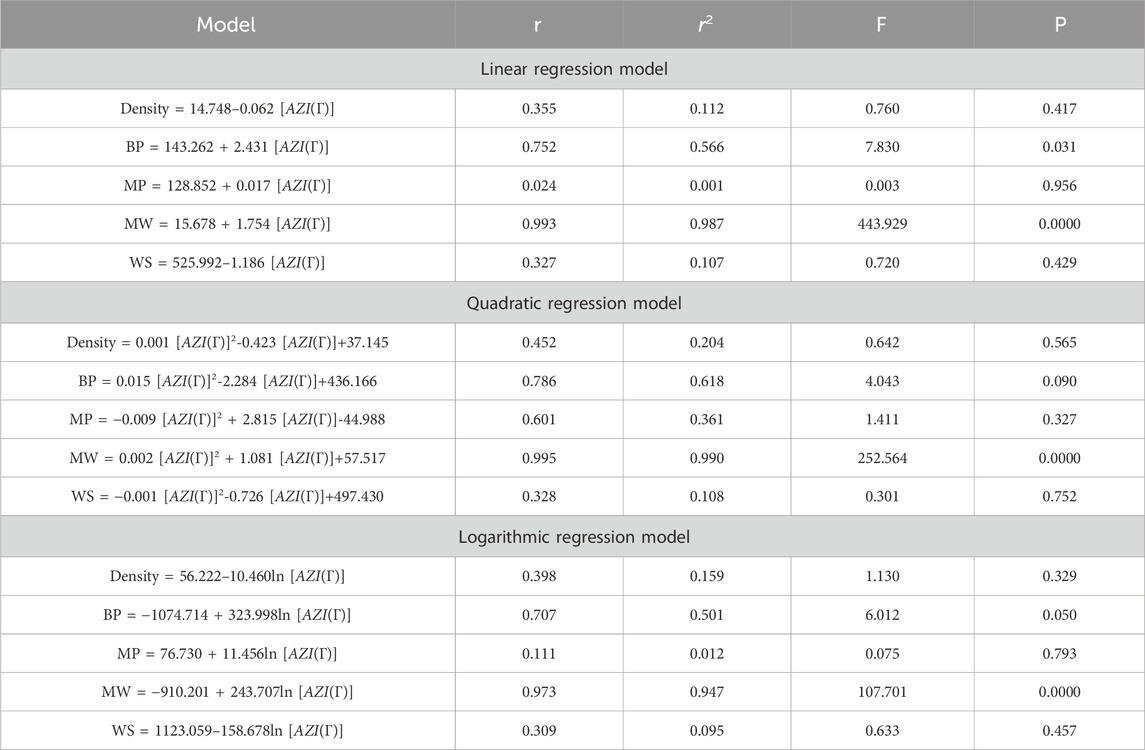
Table 14. Statistical parameters for AZI(Γ).
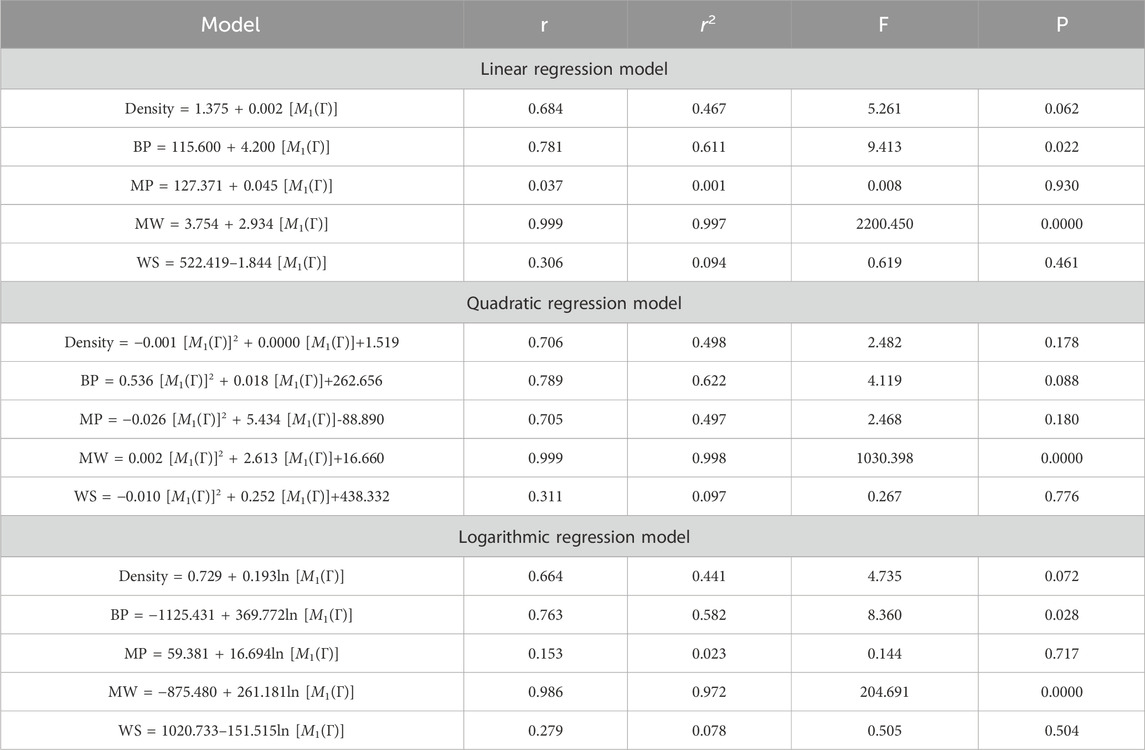
Table 15. Statistical parameters for M1(Γ).
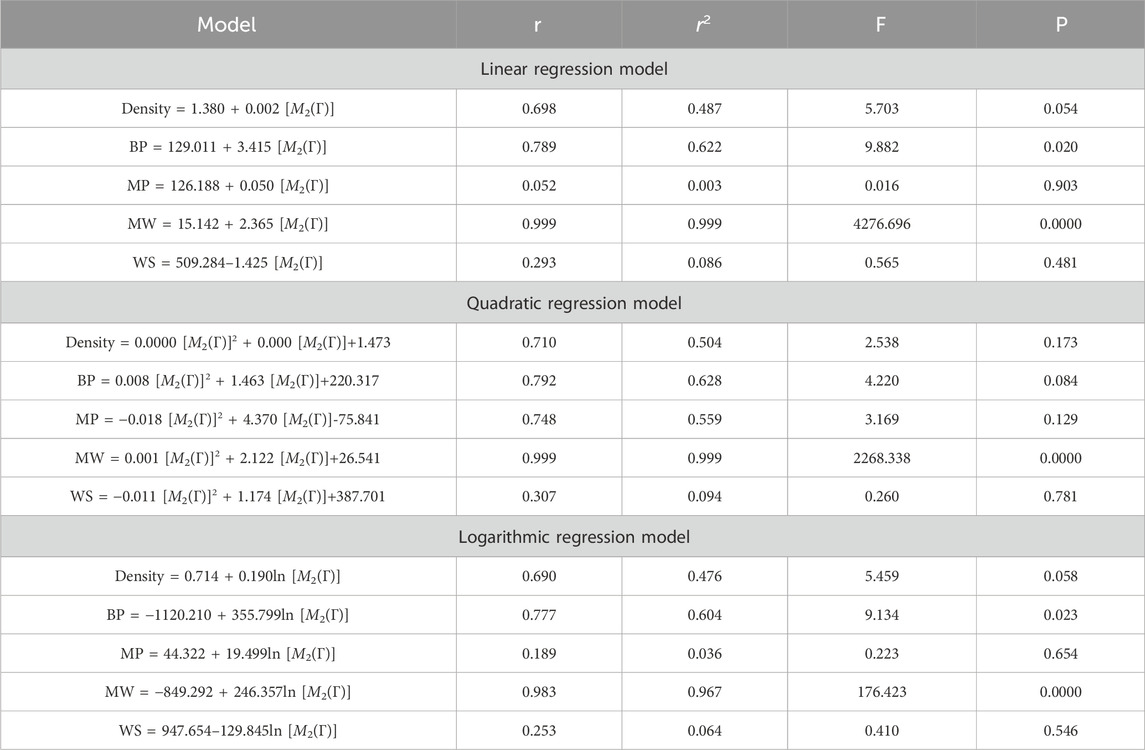
Table 16. Statistical parameters for M2(Γ).
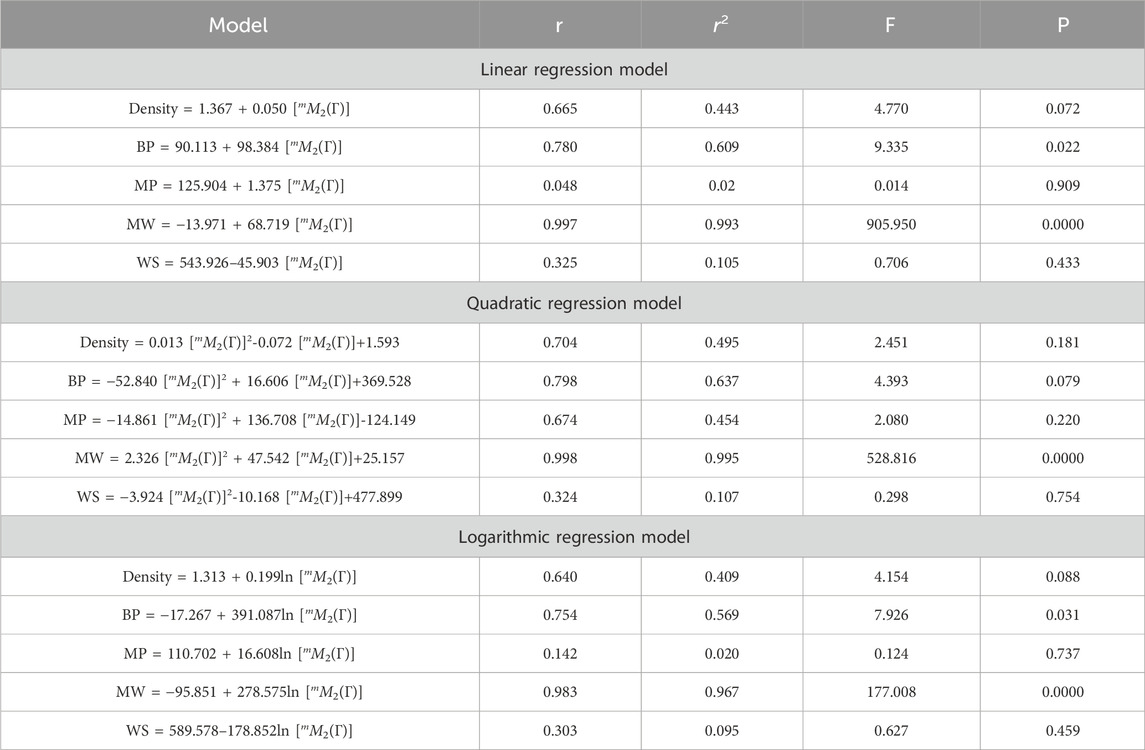
Table 17. Statistical parameters for mM2(Γ).
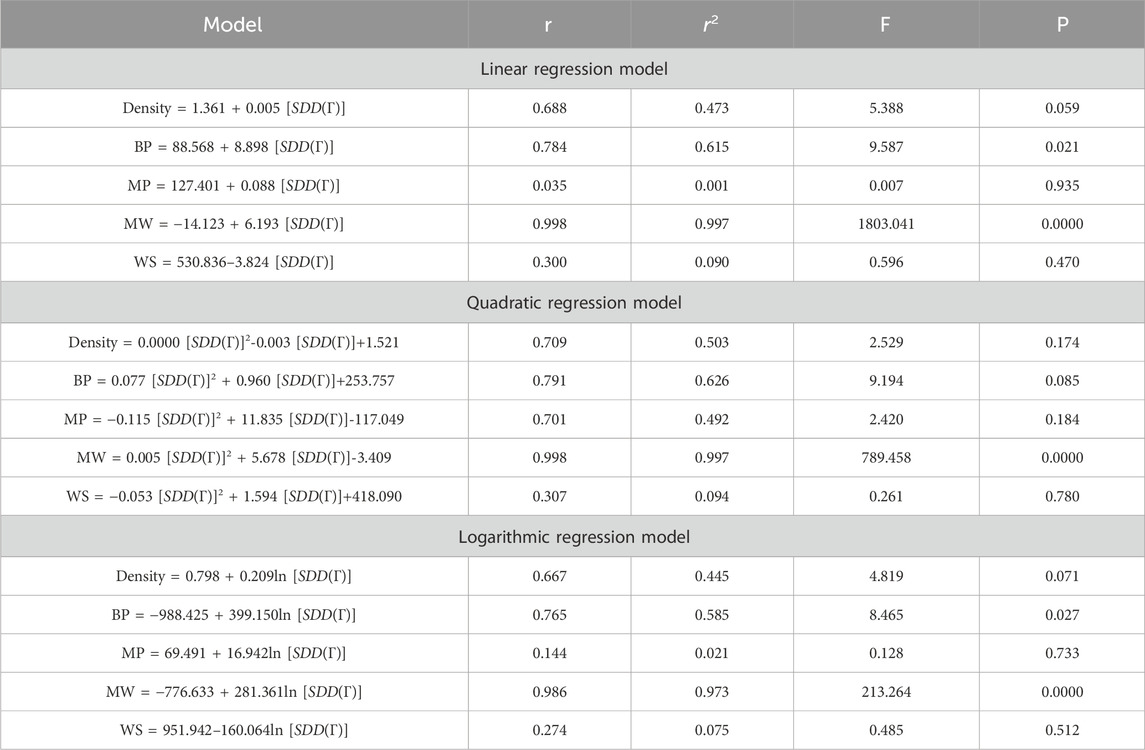
Table 18. Statistical parameters for SDD(Γ).
6 Discussion
A regression model is a statistical technique used to predict the value of a continuous target variable based on input features. Four metrics are crucial in regression analysis: correlation coefficient (r), R-squared (r2), F-statistic, and p-value. The R-squared value measures how well the independent variables predict the dependent variable, with a higher R-squared indicating a stronger linear relationship. The F-statistic tests the overall significance of the model, with a significant F-statistic indicating a non-zero effect of at least one independent variable on the dependent variable. A small p-value indicates statistical significance, indicating that at least one independent variable has a significant effect on the dependent variable.
This study employs linear, quadratic, and logarithmic regression models to predict five physical and chemical properties of various carbohydrates, considering topological indices as independent and properties as dependent variables. It has been observed that two properties, namely, molecular weight and boiling point, give the best predicted value by each regression model (as the value of R is greater than 0.68 in each case except for linear and logarithmic regressions of the topological index H). Linear, quadratic, and logarithmic models and their four important metric values are shown in Tables 12–18. The study focuses on the significance of topological descriptors in predicting the molecular structures of gaur gum and its derivatives, which are crucial in predicting the molecular weight of carbohydrates. Quantitative structure–property relationship (QSPR) methodology is a powerful approach used in the field of drug design, material science, environmental chemistry, cheminformatics, and computational chemistry. QSPR methodology focuses on establishing mathematical relationships between the chemical structure of compounds and their properties, allowing for the prediction of properties based on molecular features. One notable difference is that QSPR specifically targets physical and chemical properties of compounds, while QSAR often focuses on biological activities. Additionally, molecular modeling techniques may involve more complex simulations and calculations to predict molecular behavior. Finally, QSPR methodology offers a systematic and quantitative approach to predict physicochemical properties of chemical compounds based on their molecular structure, distinct from other methodologies such as QSAR, MD simulation, DFT, machine learning models, and hybrid QSAR/QSPR models, each with its own advantages and limitations depending on the specific application and research goals.
7 Conclusion
This study focuses on the analysis of the polysaccharide guar gum and its chemical variants, namely,
Furthermore, these results can help in the design and optimization of guar gum-based products and formulations. By correlating the topological indices with the performance of guar gum in various applications, researchers can tailor its properties to meet specific requirements in industries such as food, pharmaceuticals, cosmetics, and agriculture. Overall, these results can contribute to a better understanding of its structure–property relationships and facilitate the development of innovative products and technologies in diverse fields.
8 Future work
The authors will investigate the polysaccharide guar gum and its chemical variants with respect to the generalized reverse degree for future work.
Data availability statement
The original contributions presented in the study are included in the article/Supplementary Material; further inquiries can be directed to the corresponding author.
Author contributions
WK: writing–original draft and writing–review and editing. SY: writing–original draft and writing–review and editing.
Funding
The author(s) declare that no financial support was received for the research, authorship, and/or publication of this article.
Conflict of interest
The authors declare that the research was conducted in the absence of any commercial or financial relationships that could be construed as a potential conflict of interest.
Publisher’s note
All claims expressed in this article are solely those of the authors and do not necessarily represent those of their affiliated organizations, or those of the publisher, the editors, and the reviewers. Any product that may be evaluated in this article, or claim that may be made by its manufacturer, is not guaranteed or endorsed by the publisher.
References
Ajmal, M., Nazeer, W., Munir, M., Kang, S. M., and Jung, C. Y. (2017). The M-polynomials and topological indices of generalized prism network. Int. J. Math. analysis 11 (6), 293–303. doi:10.12988/ijma.2017.7118
Amic, D., Belo, D., Lucic, B., Nikolic, S., and Trinajstic, N. (1998). The vertex-connectivity index revisited. J. Chem. Inf. Comput. Sci. 38 (5), 819–822. doi:10.1021/ci980039b
Arockiaraj, M., Greeni, A. B., and Kalaam, A. R. A. (2023b). Comparative analysis of reverse degree and entropy topological indices for drug molecules in blood cancer treatment through QSPR regression models. Polycycl. Aromat. Compd., 1–18. doi:10.1080/10406638.2023.2271648
Arockiaraj, M., Greeni, A. B., and Kalaam, A. R. A. (2023c). Linear versus cubic regression models for analyzing generalized reverse degree based topological indices of certain latest corona treatment drug molecules. Int. J. Quantum Chem. 123 (16), e27136. doi:10.1002/qua.27136
Arockiaraj, M., Paul, D., Clement, J., Tigga, S., Jacob, K., and Balasubramanian, K. (2023a). Novel molecular hybrid geometric-harmonic-Zagreb degree based descriptors and their efficacy in QSPR studies of polycyclic aromatic hydrocarbons. Sar. QSAR Environ. Res. 34 (7), 569–589. doi:10.1080/1062936x.2023.2239149
Balaban, A. T. (1982). Highly discriminating distance-based topological index. Chem. Phys. Lett. 89, 399–404. doi:10.1016/0009-2614(82)80009-2
BeMiller, J. N. (2009). One hundred years of commercial food carbohydrates in the United States. J. Agric. food Chem. 57 (18), 8125–8129. doi:10.1021/jf8039236
Caporossi, G., Gutman, I., Hansen, P., and Pavlovic, L. (2003). Graphs with maximum connectivity index. Comput. Biol. Chem. 27 (1), 85–90. doi:10.1016/s0097-8485(02)00016-5
Consonni, V., and Todeschini, R. (2010a). Molecular descriptors. Recent advances in QSAR studies: methods and applications, 29–102.
Consonni, V., and Todeschini, R. (2010b). Molecular descriptors. Recent advances in QSAR studies: methods and applications. Berlin, Germany: Springer, 29–102.
Das, K. C. (2010). Atom-bond connectivity index of graphs. Discrete Appl. Math. 158 (11), 1181–1188. doi:10.1016/j.dam.2010.03.006
Das, K. C., and Gutman, I. (2004). Some properties of the second Zagreb index. MATCH Commun. Math. Comput. Chem. 52 (1), 3–1.
Deutsch, E., and Klavar, S. (2014). M-polynomial and degree-based topological indices. Available at: https://arxiv.org/abs/1407.1592.
Estrada, E., Torres, L., Rodriguez, L., and Gutman, I. (1998). An atom-bond connectivity index: modelling the enthalpy of formation of alkanes. Indian J. Chem. 37A.
Favaron, O., Maheo, M., and Sacle, J. F. (1993). Some eigenvalue properties in graphs (conjectures of Graffiti — II). Discrete Math. 111 (1-3), 197–220. doi:10.1016/0012-365x(93)90156-n
Furtula, B., Graovac, A., and Vukicevic, D. (2010). Augmented zagreb index. J. Math. Chem. 48, 370–380. doi:10.1007/s10910-010-9677-3
Gupta, C. K., Lokesha, V., Shwetha, S. B., and Ranjini, P. S. (2016). On the symmetric division deg index of graph. Southeast asian Bull. Math. 40 (1).
Gutman, I., and Das, K. C. (2004). The first Zagreb index 30 years after. MATCH Commun. Math. Comput. Chem. 50 (1), 83–92.
Gutman, I., and Furtula, B. (2008). Recent results in the theory of Randic index. Kragujevac: Univ. Kragujevac.
Gutman, I., Polansky, O. E., Gutman, I., and Polansky, O. E. (1986). Chemical graphs. Math. Concepts Org. Chem., 19–22. doi:10.1007/978-3-642-70982-1_4
Hovgaard, L., and Brondsted, H. (1996). Current applications of polysaccharides in colon targeting. Crit. Rev. Ther. drug Carr. Syst. 13, 185–223. doi:10.1615/critrevtherdrugcarriersyst.v13.i3-4.10
Hu, Y., Li, X., Shi, Y., Xu, T., and Gutman, I. (2005). On molecular graphs with smallest and greatest zeroth-order general Randic index. MATCH Commun. Math. Comput. Chem. 54 (2), 425–434.
Kier, L. B., and Hall, L. H. (1976). Molecular connectivity ill chemistry and drug research. Amsterdam, Netherlands: Elsevier.
Kier, L. B., and Hall, L. H. (1986). Molecular connectivity in structure-activity analysis. Hoboken, New Jersey, United States: Wiley. (No Title).
Li, X., Gutman, I., and Randi, M. (2006). Mathematical aspects of Randic-type molecular structure descriptors. Serbia: University of kragujevac, Faculty of Science.
Li, X., and Shi, Y. (2008a). A survey on the Randic index. MATCH Commun. Math. Comput. Chem. 59 (1), 127–156.
Li, X., and Shi, Y. (2008b). Some new results on a conjecture about the randic index, mathematical chemistry monographs No. 6. Recent results in the theory of randic index. Kragujevac, 57–72.
Milicevic, A., Nikolic, S., and Trinajstic, N. (2004). On reformulated Zagreb indices. Mol. Divers. 8, 393–399. doi:10.1023/b:modi.0000047504.14261.2a
Munir, M., Nazeer, W., Rafique, S., and Kang, S. M. (2016a). M-polynomial and related topological indices of nanostar dendrimers. Symmetry 8 (9), 97. doi:10.3390/sym8090097
Munir, M., Nazeer, W., Rafique, S., and Kang, S. M. (2016b). M-polynomial and degree-based topological indices of polyhex nanotubes. Symmetry 8 (12), 149. doi:10.3390/sym8120149
Munir, M., Nazeer, W., Rafique, S., and Kang, S. M. (2016c). M-polynomial and degree-based topological indices of polyhex nanotubes. Symmetry 8 (12), 149. doi:10.3390/sym8120149
Munir, M., Nazeer, W., Shahzadi, Z., and Kang, S. M. (2016d). Some invariants of circulant graphs. Symmetry 8 (11), 134. doi:10.3390/sym8110134
Nikolic, S., Kovacevic, G., Milicevic, A., and Trinajstic, N. (2003). The Zagreb indices 30 years after. Croat. Chem. acta 76 (2), 113–124.
Prem, D., Singh, S., Gupta, P. P., Singh, J., and Kadyan, S. P. S. (2005). Callus induction and de novo regeneration from callus in Guar (Cyamopsis tetragonoloba). Plant Cell, tissue organ Cult. 80, 209–214. doi:10.1007/s11240-004-0738-9
Randi, M. (2001). The connectivity index 25 years after. J. Mol. Graph. Model. 20 (1), 19–35. doi:10.1016/s1093-3263(01)00098-5
Randi, M. (2008). On history of the Randi index and emerging hostility toward chemical graph theory. MATCH Commun. Math. Comput. Chem. 59 (1), 5–124.
Randic, M. (1975). Characterization of molecular branching. J. Am. Chem. Soc. 97 (23), 6609–6615. doi:10.1021/ja00856a001
Shanmukha, M. C., Usha, A., Siddiqui, M. K., Fufa, S. A., and Praveen, B. M. (2022). Degree-based molecular descriptors of guar gum and its chemical derivatives. J. Chem. 2022, 1–14. doi:10.1155/2022/7371538
Trinajstic, N., Nikolic, S., Milicevic, A., and Gutman, I. (2010). About the zagreb indices. Kem. u Ind. Cas. Kem. i Kem. Inz. Hrvat. 59 (12), 577–589.
Vukicevic, D., and Graovac, A. (2004). Valence connectivity versus Randic, Zagreb and modified Zagreb index: a linear algorithm to check discriminative properties of indices in acyclic molecular graphs. Croat. Chem. acta 77 (3), 501–508.
Whistler, R. L., and Hymowitz, T. (1979). Guar: agronomy, production, industrial use, and nutrition. West Lafayette, Indiana, United States: Purdue University Press.
Keywords: chemical graph theory, QSPR, physicochemical properties, M-polynomials, topological indices, guar gum
Citation: Khalid W and Yousaf S (2024) Elucidating structure–property relationships of guar gum biomolecules: insights from
Received: 02 April 2024; Accepted: 20 May 2024;
Published: 09 July 2024.
Edited by:
Sudip Pan, Jilin University, ChinaReviewed by:
Nasarul Islam, Government of Jammu & Kashmir, IndiaAbhishek Kumar, University of Lucknow, India
Micheal Arockiaraj, Loyola College, India
Copyright © 2024 Khalid and Yousaf. This is an open-access article distributed under the terms of the Creative Commons Attribution License (CC BY). The use, distribution or reproduction in other forums is permitted, provided the original author(s) and the copyright owner(s) are credited and that the original publication in this journal is cited, in accordance with accepted academic practice. No use, distribution or reproduction is permitted which does not comply with these terms.
*Correspondence: Shamaila Yousaf, c2h1bWFpbGEueW91c2FmQHVvZy5lZHUucGs=