 Mounir Maafi
- Leicester School of Pharmacy, De Montfort University, Leicester, United Kingdom
Since the dawn of photochemistry 150 years ago, photoreactions have been conducted under polychromatic light. However, despite the pivotal role that photokinetics should naturally play for such reactive photosystems, the literature lacks a comprehensive description of that area. Indeed, one fails to identify explicit model integrated rate laws for these reactions, a characteristic type for their kinetic behavior, or their kinetic order. In addition, there is no consensus in the community on standardized investigative tools to evaluate the reactivity of these photosystems, nor are there venues for the discussion of such photokinetic issues. The present work is a contribution addressing some of these knowledge gaps. It proposes an unprecedented general formula capable of mapping out the kinetic traces of photoreactions under polychromatic light irradiation. This article quantitatively discusses several reaction situations, including the effects of initial reactant concentration and the presence of spectator molecules. It also develops a methodology for standardizing actinometers and defines and describes both the spectral range of highest reactivity and the photonic yield. The validity of the model equation has been proven by comparing its results to both theoretical counterparts and those generated by fourth-order Runge–Kutta numerical calculations. For the first time, a confirmation of the
1 Introduction
Green chemistry, sustainability, atom-, and circular economies are among the main scientific challenges of the twenty-first century for which photochemistry is expected to play an essential role. Indeed, the availability and ubiquity of cheap sunlight, as well as the potential for harvesting it in many innovative ways and the accessibility to a variety of cheap LED lights, have promoted photochemistry to be viewed as an important gateway toward bridging the gaps between the current situation and future aspirations. A large variety of photoprocesses and photosystems have already been studied for that purpose, including solar thermal energy storage (Gimenez-Gomez et al., 2022), artificial molecular machines (Andreoni et al., 2021), photomicroreactors powered by direct sunlight (Cambié et al., 2019), photoresponsive materials (Li et al., 2019), water-splitting (Han et al., 2014), pharmaceuticals (Holland et al., 2020; Le Basle et al., 2020), manufacturing chemicals with light (Poliakoff and George, 2020), flow photochemistry (Williams and Kappe, 2020; Buglioni et al., 2022), micro and mesostructured photoreactors (Kayahan et al., 2020), environmental impact (Vione and Scozzaro, 2019), polymer mechanochemistry (McFadden et al., 2023), a variety of potential industrial applications (Griesbeck et al., 2012), and a range of flexible materials (Yamada and Yagai, 2019).
The investigations directed toward innovative processes have seldom used monochromatic light but are typically driven by natural or artificial polychromatic light. This type of light variably affects phototransformations due to the many parameters that impact photoreactivity. Better control, quantification, and reproducibility of such processes are, therefore, only possible with an adequate description of their photokinetics. Unfortunately, a standard and comprehensive photokinetic approach for reactions performed under polychromatic light has been lacking in the field (Mauser et al., 1998; Tonnesen, 2004; Griesbeck et al., 2012; Yamada and Yagai, 2019; Montalti et al., 2020). The kinetics of these photoreactions has no equivalent counterparts for the basic concepts of thermal chemical kinetics, such as established reaction kinetic orders and/or identified integrated rate laws. This situation might not seem awkward if we consider the complexity of the mathematical framework that describes the photokinetics of these reactions compared to that encountered in thermal chemical kinetics. Simply put, the rate laws of reactions under polychromatic light cannot be solved analytically. Therefore, neither the integrated rate laws nor the kinetic orders of these photoreactions are accessible. However, one must keep in mind that even if analytical solutions are not reachable for the rate laws of reactions driven by polychromatic light, it is not excluded that these reactions possess a specific kinetic behavior, unlike those observed for thermal reactions.
Despite these hurdles, several investigations have used different approaches to deal with the photokinetics of reactions exposed to polychromatic light. Thermal kinetic equations (characterizing zeroth,- first-, and second-order kinetics) have been applied to photoreaction data (Yassine et al., 2018; Trawinski and Skibinski, 2019; Dolinina et al., 2020; Grande et al., 2020). However, there is no simple interpretation of the obtained parameters (e.g., the reaction rate constant) given the complexity of the integro-differential rate law describing the real physical system (vide infra Eq. (1)). Another strategy used a power series expansion of the rate law to simplify the latter to an integrable form. This process is too approximative to deliver accurate results (usually using only the first-order expansion of the power series) (Tonnesen, 2004). One approach introduces a simplifying hypothesis to derive an explicit formula to fit the experimental data. The applicability of such an equation is, however, limited to the specific reactive system and experimental conditions it was developed for (Lehóczki et al., 2013; Józsa et al., 2018; Frigoli et al., 2020; Maafi and Al Qarni, 2022a; Maafi and Al Qarni, 2022b). A relatively popular method promotes the use of a high enough initial reactant concentration to ensure that the impinging polychromatic light is fully absorbed by the reactive medium (where the absorbance value of the reactive medium ought to be no less than 2) (Amouroux et al., 2019). In these conditions, the rate of the photoreaction is assumed to reach a limit (become constant), and its mathematical formulation resembles that of the zeroth-order thermal kinetics (Zepp, 1978; Stranius and Borjesson, 2017; Stadler et al., 2018). In another perspective, quantification of reactivity by initial reaction-velocity has been performed by using a polynomial probe function to fit the experimental kinetic traces (Pino-Chamorro et al., 2016).The fitting of photoreaction data has also been performed by applying numerical integration methods to the rate law, including the Runge–Kutta (Chernyshev et al., 2018) and Euler methods (Lente and Espenson, 2004; Michnyóczki et al., 2021). A discussion of the efficiency of numerical methods specifically for the elucidation of photokinetics showed the limitation of such methods owing to the occurrence of identifiability and/or distinguishability issues (Maafi, 2023). Overall, experimental data were well-fitted by the above individual techniques. One can also hint at some variability in the mathematical formulation of the rate law describing a photosystem under polychromatic light (Lente and Espenson, 2004; Aillet et al., 2014; Rochatte et al., 2017; Józsa et al., 2018), including the radiative transfer equation (Zalazar et al., 2005; Braslavsky et al., 2011).
The above information, succinctly reviewing the most commonly used photokinetic options for the treatment of reaction data obtained under polychromatic light-irradiation, strongly suggests the lack of a consensus over a standardized photokinetic approach and the absence of an explicit formula to map out the kinetic traces of such photoreactions. In addition to these knowledge gaps, there are also no clear quantitative descriptions for the effects of the initial concentration, spectator molecules, or incident radiation intensity on the reactivity of such photoreactions. These aspects are worth addressing in order to standardize photokinetic investigation. The present work contributes to that effort.
2 Experimentals
The
The phototransformation mechanisms studied in the present contribution are worked out from the
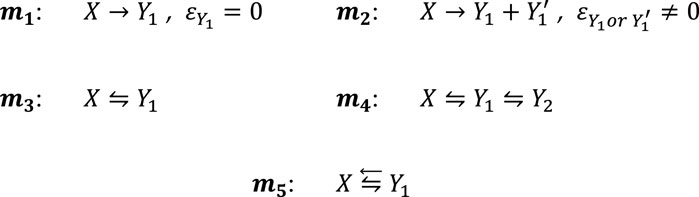
Scheme 1. Most prominent examples of photoreaction mechanisms governing organic actinometers.
In Scheme 1, the mechanisms correspond to the primary photoprocess with either a transparent photoproduct (m1, e.g., the diarylethene colored photoproduct only (Yamada and Yagai, 2019)) or an absorbing photoproduct, either or both
The kinetic traces corresponding to the temporal variation of the species concentration induced by a polychromatic light,
The number of photons entering the reactor (
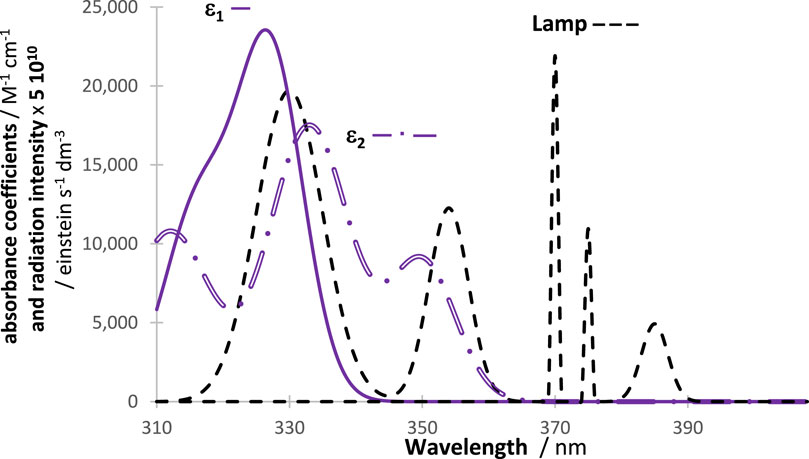
Figure 1. A general example of a disposition of an actinometer and investigated species absorption spectra (either
The traces obtained by RK calculations (for reactant
The number (
In the present work, the rate laws correspond to a slab-shaped, vigorously, and continuously stirred reactive medium exposed to a collimated polychromatic light beam. These equations also consider that the concentrations of all species, at all times, fall within the linearity ranges of the respective calibration graphs of the species (e.g., the absorbance of the medium is less than a value of 0.5 at any reaction time and within the OSIA).
3 Results and discussion
3.1 The integro-differential equation of the rate law
The differential equation that describes the variation of the concentration,
The sum under the integral accounts for the individual
with the dimensionless total absorbance (
In Eq. (2),
The dimensions of the right- (
The quantum yield (Eq. (1)), as well as all the parameters in Eq. (2), are considered here to be wavelength-dependent. In addition, the rate and the concentration in Eq. (1) are labeled by both the wavelength range of the OSIA (
It is interesting to observe that the right-hand side of Eq. (1) accounts only for the non-zero (
Unfortunately, solving Eq. (1) analytically is impossible except for very scarce (mostly hypothetical) cases that impose particular conditions on the shapes of the mathematical functions that map out the variations of the parameters of Eq. (1) with wavelength. In contrast to some well-known formulations of integro-differential equations that can be analytically solved (Brunner, 2017; Lewis et al., 2022), the type of Eq. (1) has not, as far as we are aware, benefited from even a standard numerical integration method able to evaluate such an equation. This might be, at least in part, due to the fact that the explicit formulae giving the parameters under the integral as functions of the wavelength (
One way to circumvent this hurdle and achieve numerical integration is to replace the integration over the wavelength by a summation with a 1-nm-interval step (Eq. (4)). Such an approximation, using the Euler numerical method, has proved satisfactory to replicate experimental data (Lente and Espenson, 2004; Fabian and Lente, 2010). Accordingly, a fourth-order Runge–Kutta method has been implemented in the subsequent sections for the evaluation of the integro-differential equation (Eq. (4)) in various reaction conditions.
The initial reactant rate (
3.2 The global integrated rate law model
As discussed above, it is a matter of fact that the literature provides neither an explicit equation for the kinetics traces of photoreactions driven by polychromatic light nor an analytical solution to the integro-differential rate equation (Eq. (1)). However, a qualitative observation of the overall shape of experimental and RK-calculated traces of such photoreactions indicates that they do not seem to substantially differ from those recorded for reactions subjected to monochromatic light (Lente and Espenson, 2004; Fabian and Lente, 2010; Roibu et al., 2018; Volfova et al., 2019; Yutani et al., 2019; Maafi and Al Qarni, 2022a; Maafi and Al Qarni, 2022b; Weingartz et al., 2023). This observation allows one to conjecture that the kinetics under polychromatic light may well be of
The parameters in Eq. (6) mirror those previously defined for the monochromatic light equation, except that they are now defined for the OSIA wavelength range,
The differentiation of Eq. (6) yields the general expression of the rate of
The initial reaction rate (Eq. (8)) is derived from Eq. (7) and serves as a metric to quantify the reactivity of
Similarly, the general equation describing a total absorption of the medium measured at both a given observation wavelength
with a general initial rate for the total absorbance trace being
3.3 Specification of reaction intrinsic parameters and incident light
Prior to verifying the validity of the global equation (Eq. (6)) for the description of the output RK-data of reaction photokinetics (see Sections 3.4–3.9), we ought to ask how to proceed with the determination of the values of essential quantities required for RK-calculations at each
The unique way to determine the values of the intrinsic parameters (
3.4 Validation of the global equation
More than 250 kinetic traces were RK-calculated for various reactions and reaction conditions. They are considered a representative sample of photoreactions exposed to polychromatic light. The selected reactions differed by the photomechanisms, the intrinsic features (variation over the wavelength of both species quantum yield patterns and values and absorption coefficient for each species), and the experimental conditions, including the lamp profile/intensity and the irradiation and observation optical path lengths. These traces, as well as those corresponding to the total absorption of the reaction medium, were fitted by Eqs. (6)–(9) of adequate numbers
In all cases, an excellent fit of the traces by the model equations was found. High (>0.999) correlation coefficient values were found for RK-simulated vs. Eqs. (6)–(9) data, and relatively low values were found for the sums of squared errors (SSE <10−10) and root-mean-square errors (RMSE <10−9 for Eq. (6) and slightly higher, or 10−5, for Eq. (9) characterized the fit of each trace. Figure 2 shows an example of the profiles of quantum yields, absorptivities, and a lamp. The photomechanism corresponds to a cyclic reaction involving four species interlinked by six photoreaction steps. The traces of the species are fitted by Eq. (6) (Figure 3), each involving two mono-
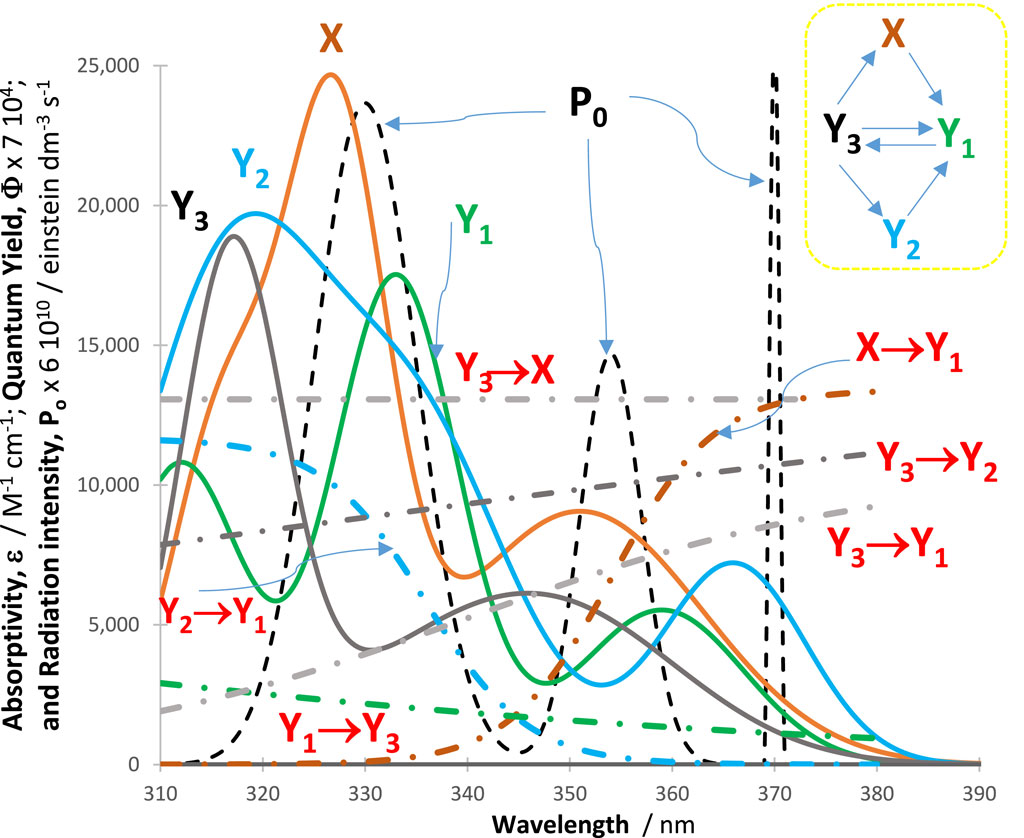
Figure 2. Intrinsic parameters
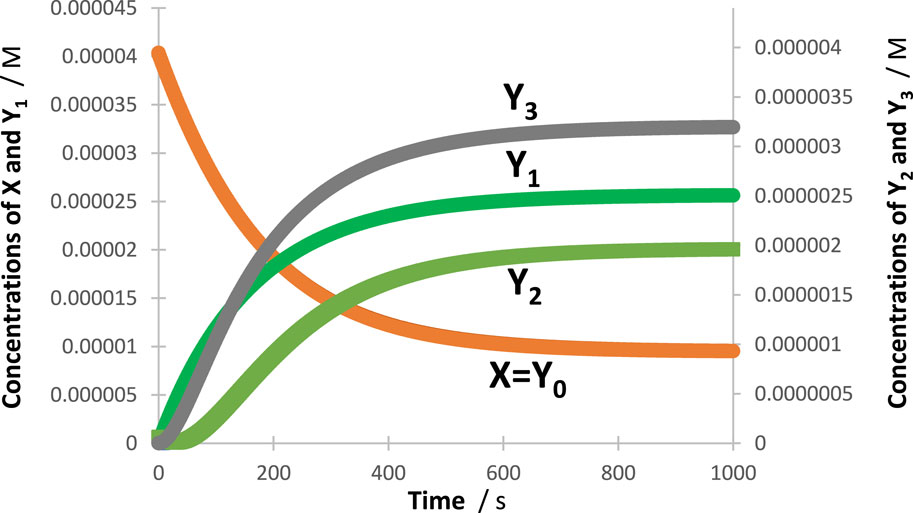
Figure 3. An illustration of the excellent fit of the RK-calculated traces (circles) of the tetramolecular cyclic reaction (shown in the inset of Figure 2) by the corresponding Eq. 6 (lines).
These findings indicate that the
From a practical viewpoint, it is relevant to mention that, on the one hand, using Eq. (6) (and Eq. (9)) does not necessarily require a priori knowledge of the specific photomechanism governing the reaction. On the other hand, using these equations will unavoidably lead to the occurrence of an identifiability issue. As previously discussed for reactions driven by monochromatic light irradiation (Maafi, 2023), the identifiability issue corresponds to the situation where different sets of fitting parameter values (
However, for a given kinetic trace, the initial reaction rate remains a useful metric because its value does not change for the different fitting parameter sets that emerge from the identifiability issue (a similar situation was observed for monochromatic irradiation (Maafi, 2023)). In addition, the initial rate has the unique advantage of being worked out by three independent means: a) theoretically,
In this context, linear relationships between, for instance,
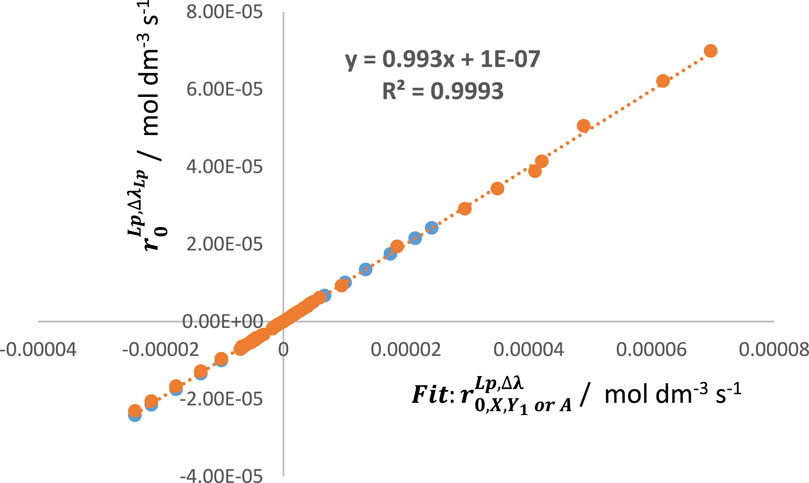
Figure 4. An excellent linear correlation between the values of
3.5 An LED light is not monochromatic
It is now established that both polychromatic and monochromatic light equally induce
Many examples of LED light profiles have been published (Volfova et al., 2019; Williams and Kappe, 2020). The data show that even if the mid-height width of the light bands produced by LEDs is much narrower than some of those recorded for classical lamps, it is, nonetheless, clear that their lights are far from being monochromatic. In addition, most blue LEDs are reported to emit a broad spectrum (Bonfield et al., 2020). Strictly speaking, an LED produces a polychromatic beam centered around a specific wavelength. In the visible region, this confers a particular uniform color to the emitted light that might mislead the observer to consider this light as monochromatic. Accordingly, the rate law for reactions performed under LED light exposure should take the form of the integro-differential equation (Eq. (1)). The latter is a sum of rates at individual wavelengths, which means that approximating the LED light to being monochromatic will certainly lead to errors. We shall see in Section 3.12 that there is little possibility of reliably evaluating the quantum yield when polychromatic light is employed. Hence, there is arguably no need for the monochromaticity of LEDs approximation. Incidentally, the quantum yield might well be wavelength-dependent even over the wavelength section covered by the relatively narrow light band of the LED (Maafi and Al Qarni, 2022a).
3.6. Spectator molecules’ impact on photoreactivity
In real-life situations, photoreactions may be performed in a medium that includes spectator molecules (SPMs) that do not directly contribute to the photoreaction investigated (they are both thermally and photochemically inert). Such molecules might be additives (excipient, dyes … etc.) fulfilling a purpose in the formulation or the reactive medium.
SPMs will have an impact on the photoreactivity of a reactive system driven by polychromatic light if they happen to absorb in the OSIA wavelength range of the species investigated. Such an absorption implies a necessary modification of the rate law of the reaction. The contribution of spectator molecules is mathematically expressed by including the absorption of SPMs into the total absorption of the reactive medium. This follows from the fact that SPMs, which are both thermally and photochemically unreactive, only impact the kinetics by competing for the available light over the OSIA. Hence, at every wavelength,
As a consequence, for a given initial concentration of the reactant, the higher the SPM absorption over
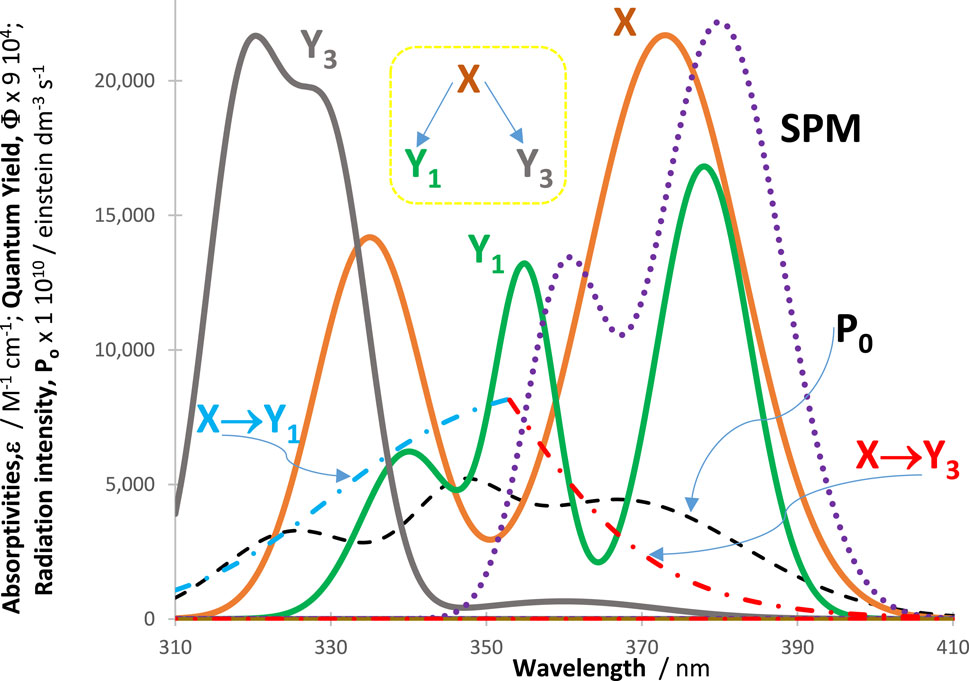
Figure 5. Absorptivities (
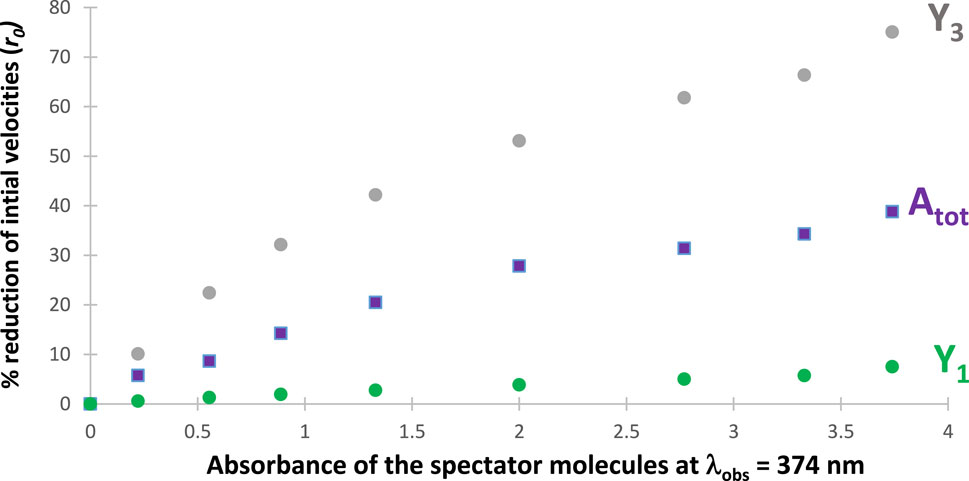
Figure 6. Percentage reduction of the initial speeds of both reaction products
It is remarkable that the initial rate of
The reduction of photoreactivity by introducing SPMs in the medium was also confirmed for many RK-simulated reactive photosystems under polychromatic light irradiation. This behavior is an expansion to multiwavelength irradiation of a similar effect of SPMs that has been confirmed by RK calculations and experimentally for photoreactions exposed to monochromatic light (Maafi, 2023). The quantification for our example can proceed by monitoring the rate of decrease of the initial products (
3.7 Auto-photostabilization due to initial reactant concentration
Except for photoreactions, where the reactant is the only absorbing species in the reactive medium, changing the magnitude of the initial concentration of the reactant,
Conceptually, the above pattern is preserved when the radiation type changes from monochromatic to polychromatic light because, as seen in Section 3.4, the
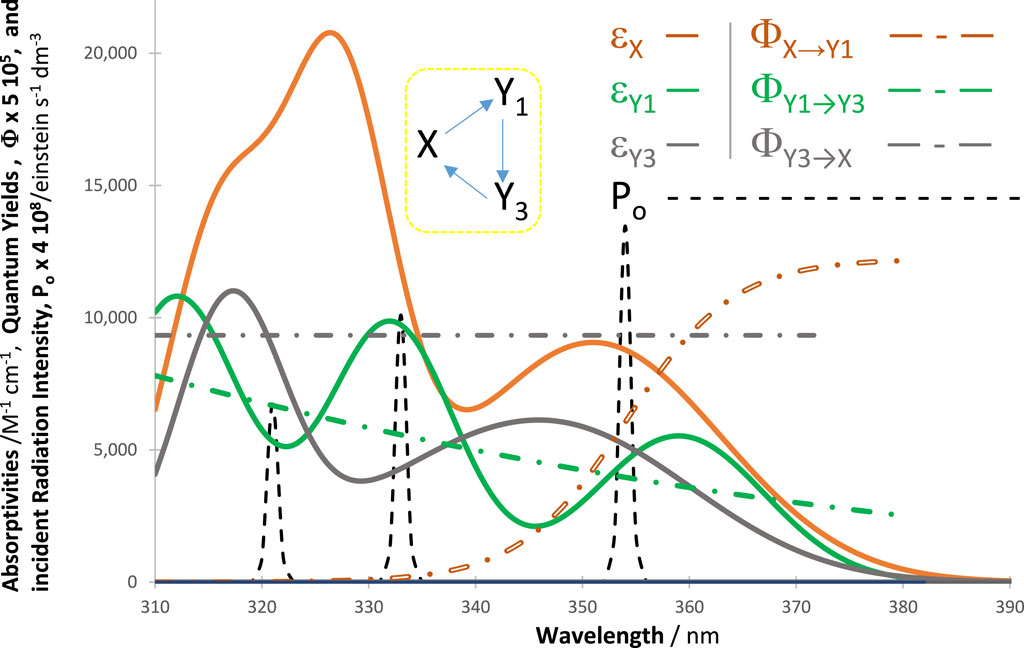
Figure 7. Properties (
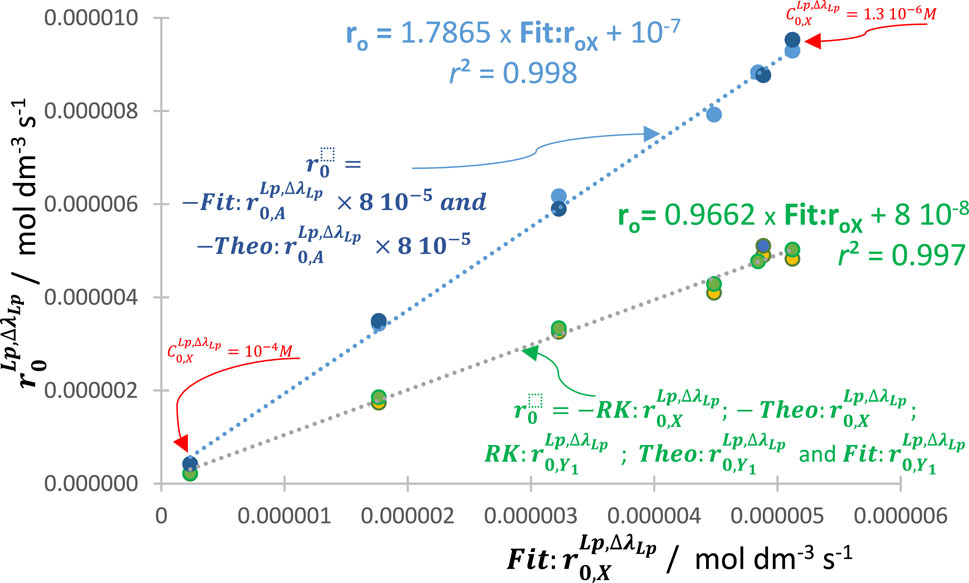
Figure 8. Variation of the initial rates of reactant (of the reaction shown in Figure 7),
Such effects prove the occurrence of an auto-photostabilization of the reaction by higher values of the initial concentration of the reactant when polychromatic radiation drives the reactive medium. Notice that this conclusion is only valid when the concentrations of the light-absorbing reactive species fall within their respective spectrophotometric linearity ranges of the calibration graphs (i.e., where Eq. (1) is consistent and is the basis for the RK numerical calculations).
In analogy with the monochromatic irradiation results (Maafi, 2023), constant ratios, invariant with
A similar decrease/increase of the reaction rate to that shown above with higher/lower values of
The auto-photostabilization phenomenon and its quantification is an additional proof for i) the validity of the general model equation, Eqs (6), ii) the usefulness of
The correlation of
3.8 Reactivity causative wavelength region
The polychromaticity of the lamp over a wavelength range
In the case of the
For given reaction conditions, the value of
Nonetheless, notice that the last term of Eq. (12) indicates that individual wavelength
Incidentally, the above discussion clearly shows that it is not accurate to claim that the rate of the reaction should be maximal at the maximum of either the absorption (
Hence, it is predicted that the patterns of
In order to prove this point, we consider, for illustration, a tetramolecular cyclic reaction (Scheme 2), successively under irradiation by a series of

Scheme 2. The tetramolecular cyclic reaction used to illustrate the evaluation of the WROR region.
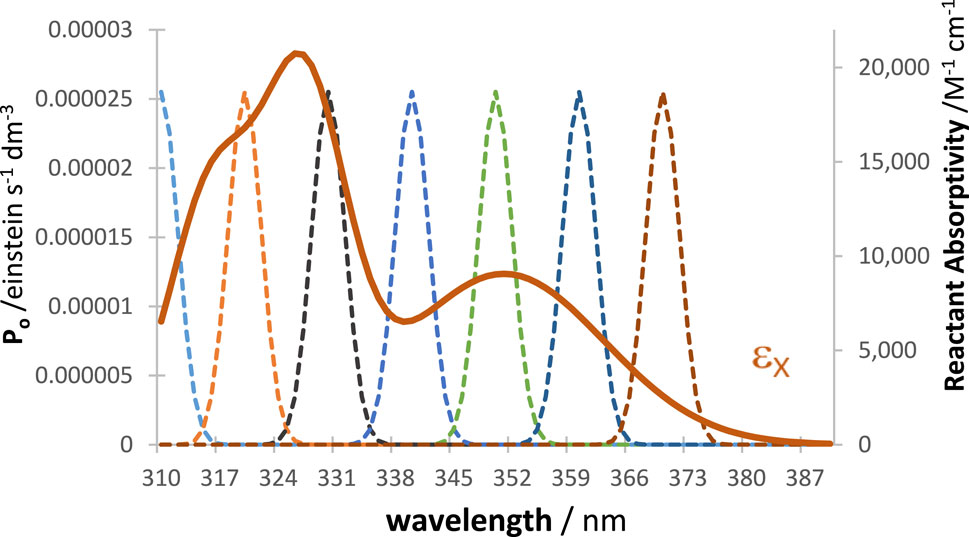
Figure 9. The absorption coefficient of the reactant (
RK traces of the reactive species and of the total absorbance at 325 nm were calculated for every LED shown in Figure 9, and each trace was fitted with an Eq. 6 involving four mono-
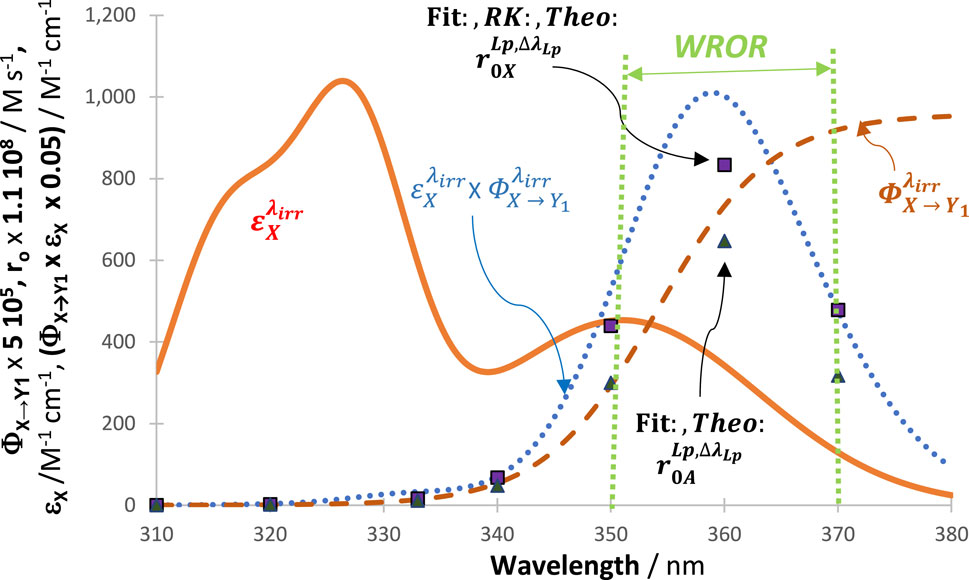
Figure 10. Variation of reactivity of the system (measured by the negative values of
In Sections 3.6 and 7, it was shown that, on the one hand, the highest relative values attained by the rate of the reactant, among those recorded during reaction time, are precisely the values of
It is also interesting to look at the shape of the kinetic traces of the total absorbance when the maximum of the LED-like lamps (Figure 9) is gradually displaced within the absorption region of the investigated reaction (Scheme 2) while keeping the observation wavelength the same at 325 nm. In the case of our cyclic reaction, it turns out that
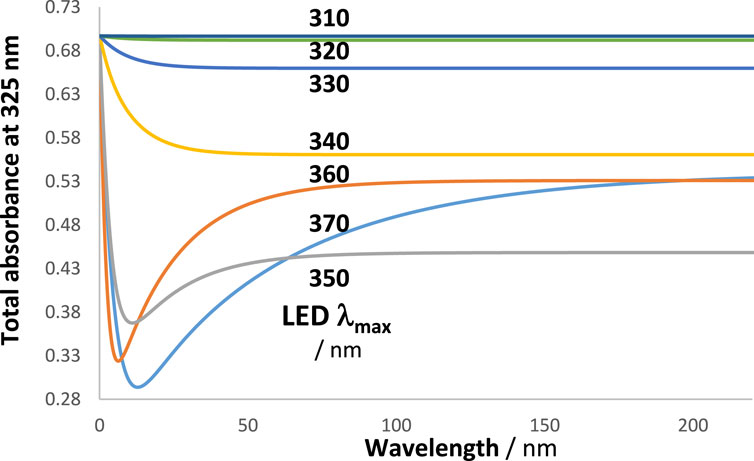
Figure 11. The kinetic trace pattern changes with the LED used. The traces correspond to the total absorbance measured at 325 nm (Figure 9). The maxima of the LED lights are indicated.
As a general statement, the shape of the kinetic trace of a reaction is lamp-dependent, and the trace of its total absorbance is dependent on the observation wavelength. This corroborates a similar conclusion reached in experiments with diarylethene, dacarbazine, and nifedipine (Maafi and Al Qarni, 2022a; Maafi and Al Qarni, 2022b).
These results underline potential risks associated with directly comparing the kinetic traces and other kinetic outputs of reactions without carefully specifying all the conditions of the experiment and those relative to the acquisition of the kinetic data. This is one possible explanation for the difficulties experienced in the field when comparing photokinetic results, especially those obtained in different laboratories.
It is also straightforward to infer, from the above discussion, that for a given lamp, the kinetics of different reactions and/or molecules will not be directly comparable due to differences in their respective intrinsic parameters and their
The above findings lead us to conclude that the OSIA is practically easy to determine but does not give a precise account of the spectral region where the absorption of photons translates into a photokinetic change. The best way to specify such a region is to consider the wavelength span where the product
3.9 Kinactinometry
Actinometry measures the incident light flux per area and volume of the sample exposed to the light beam. When chemical actinometry is achieved on the basis of a photokinetic method, it is called “kinatinometry” (Maafi, 2023). This is the case of using Eq. 6 to determine the total amount of photons delivered by lamp
Practically, we ought to consider a few situations that determine the amount of photons that are counted relative to the reaction use. This requires considering the light-source profile (
In principle, the emitted light-source photons (over
When chemical actinometry is used, it is required to take into account the actinometer (OSIAact) and the reaction (OSIAsp) absorption domains relative to the light-source profile (
Accordingly, the number of photons measured by chemical actinometry for sit1 and sit3 are not coherent with Eq. (1). This undeniably will introduce errors in the determination of any photokinetic feature (including but not limited to the evaluation of the “quantum yield” and any built actinometric methods).
In this context, using Eq. (6) ensures that only the true reaction/lamp OSIA is accounted for (i.e., photons outside such an OSIA do not contribute to the experimentally observed or RK-simulated traces), hence conforming with Eq. (1). Therefore, a kinactinometric methodology developed on the basis of Eq. (6) offers greater reliability than existing actinometric methods.
The RK-simulations of reactive systems under polychromatic irradiation of increasing magnitude, for all the above situations, have shown an acceleration of the reaction as predicted from Eqs (1), (4). The kinetic traces of both concentration and total absorbance were readily fitted by Eq. (6) (adequate to the system investigated). The changes in photokinetics were quantified by the initial velocity. By varying the radiation intensity of the light source, a proportional (linear) increase of
These findings lead to a straightforward kinactinometric methodology for the standardization of an actinometer,
(i) Chose a lamp
(ii) Irradiate the sample with
(iii) Determine the values of the
(iv) Record the n traces of the species concentrations or the total absorbance at a selected observation wavelength,
(v) Fit each of the traces available by Eq. (6) or Eq. (9)
(vi) Calculate the n initial rates (
(vii) Draw the linear graph, for example,
(viii) Work out the unknown intensity
(ix) if the OSIA and the profile of the lamp are known, calculate the n
The linearity of the plots in both cases where
Hence, for a given lamp,
and
Such an analysis clearly shows that actinometric measurements can be performed whether or not the profile of the lamp partially covers the electronic absorption spectrum of the actinometer. When the lamp emission profile is equal to or less than the actinometer’s absorption wavelength span,
The demonstrated usefulness of the factors
The kineactinometric methodology presented above applies to the most commonly used organic actinometers in the field (
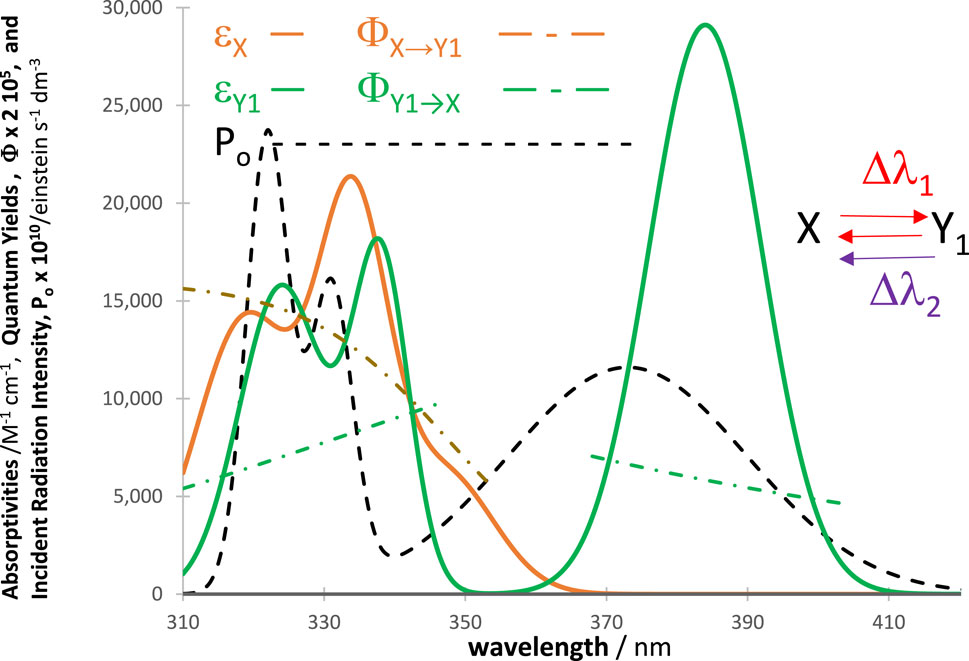
Figure 12. Profiles of absorptivities, quantum yields, and light-source intensities of a typical reaction of diarylethenes. The photomechanism (
The RK-generated traces for the photosystem depicted in Figure 12 were fitted by an Eq. (6) (and Eq. (9)) that encompasses a single mono-
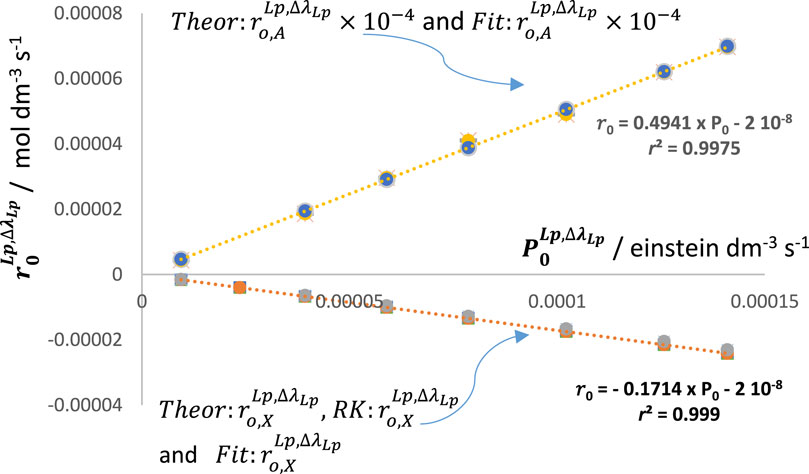
Figure 13. Linear relationships between the initial velocity values worked out from the traces of both the reactant (
Practically, in general, actinometry will only deliver the values
Henceforward, and beyond the series shown in Scheme 1, the present kinactinometric methodology may be applied to any photoreactive system (provided that it involves a single reactant). This represents an unprecedented performance in actinometry.
For practicality, it might be useful to consider the whole set of photons produced by the lamp for actinometric standardization (
3.10 Specificity of the lamp, actinometer, and reaction conditions
A standardized actinometer is a powerful tool in photokinetics that, according to the general assumption, can be used to determine the photons amount,
Likewise, if different actinometers are exposed to the same lamp and deliver the same total number of photons in each case, it is expected that the resulting actinometric calibration lines of the actinometers will be different due to the actinometers’ attributes (their intrinsic parameters
Another observation has an additional indirect but still important consequence on experimental photochemistry. Indeed, it is common to consider that the value obtained by chemical actinometry for the radiation intensity entering the reactive medium is to be directly used for the calculations of photokinetic parameters of the investigated system. This implicitly supposes two assumptions. On the one hand, the number of photons determined by using a given actinometer is valid for the lamp and reaction used, and on the other hand, the same number of photons will be absorbed by both the actinometer and the reaction being studied, that is,
Hence, we must admit that the classical method of making actinometric measurements using a given actinometer that was standardized by a specific lamp is not necessarily useful for investigating the reaction at hand. Consequently, one concludes that the best actinometer would be the investigated reaction itself. However, this remains a dream target for actinometry under polychromatic light.
To turn the reactant into an actinometer (let us label it
3.11 Some observations relative to the ferrioxalate actinometer
In principle, the non-universality of actinometers discussed in the previous section should also apply to ferrioxalate actinometry. In this case, the number of photons recorded by this actinometer is given by the number of ferrous ions produced in solution (via photoreduction of the ferric ions initially present in the medium). However, because the number of ferrous ions produced necessarily depends on both the wavelength-dependent quantum yield of this actinometer (Montalti et al., 2020) and on the profile of the actual lamp used, it is predictable that two different lamps will most likely generate different numbers of ferrous ions. Incidentally, such two hypothetical lamps are most likely different from the light sources used in the original study (Hatchard and Parker, 1956) to calibrate this actinometer. In any case, in ferrioxalate actinometry, the number of photons absorbed by this actinometer is experimentally determined by a global number of ferrous ions produced in solution.
Usually, ferrioxalate actinometry is used to determine the number of photons reaching the actinometric solution, in order to determine the quantum yield of the molecule (reactant) investigated by the use of the differential quantum yield expression.
The number of ferrous ions produced in a ferrioxalate solution will correspond to the photons emitted by the lamp over its whole spectral range if unfiltered (except, perhaps, for
Each time an unfiltered lamp emission domain is larger than the absorption spectrum of the species studied, the measured number of photons is higher than that corresponding to the photons absorbed by that species. So, for unfiltered lamps, ferrioxalate actinometry measures
The latter observation also discards an implicit assumption belonging to the ferrioxalate actinometry procedure, by which it is held that all photons absorbed by this actinometer are also absorbed by the species studied (whose quantum yield is sought). The inequality
In addition, one can relay another observation about the ferrioxalate procedure: the necessary consideration of the investigated species’ quantum yield invariance with wavelength in order to apply the differential quantum yield equation (as discussed in Section 3.12). This remains an approximation until otherwise proven experimentally (which can only be implemented by using strictly monochromatic lights at different wavelengths where the species absorbs (Maafi, 2023)). It is very rare that published works perform screening of irradiations at individual wavelengths preceding investigations with polychromatic light. Therefore, an imposed
As a matter of fact, the above observations are most often overlooked in the literature. Taking them into account and specifying the details of the experiment becomes a necessity for future research.
The kinactinometry methodology presented in Sections 3.9, 10, and 11 avoids such limitations of ferrioxalate and classical actinometries and allows determination of both the number of photons absorbed by the organic actinometer within its OSIA, as well as the total number of photons emitted by the lamp that reached the actinometric solution.
3.12 Polychromatic light irradiation and quantum yield
It is interesting to explore the possibilities of evaluating a quantum yield for a reaction subjected to polychromatic light. In principle, such an evaluation should not be envisaged according to the IUPAC (Braslavsky, 2007; Braslavsky et al., 2011). The IUPAC definition of quantum yield considers that the term is valid only for strictly monochromatic irradiation. Instead, for polychromatic light within a given wavelength range, the IUPAC indicates that either terms of photonic yield or quantum efficiency are more convenient. In this context, the quantum yield refers to the number of monochromatic photons absorbed, whereas the photonic yield refers to the number of monochromatic photons over a given
From the point of view of photokinetics, a single value for the quantum yield when the light is polychromatic does not make physical sense when the quantum yield is wavelength dependent. Furthermore, Eq. (4) shows the complexity of that issue, where an individual rate equation of a given species
Eq. (16) resembles a differential quantum yield equation but considerably differs from those classically proposed for that purpose for reactions under monochromatic (Braslavsky, 2007) or polychromatic (Braslavsky et al., 2011) light. It is, however, close to that proposed previously for the general quantum yield equation of the same reaction (
Despite the simplifying conditions considered here (
Photokinetically, under the conditions
For the general case (
The commonly used photonic yield (
Or, when
The
Because the incident radiation intensity entering the reactor can be determined either as
Remarkably, the photonic yield of a reactant (or a product, Eq. (18) and Eq. (19)) is time-dependent because the reaction of
Similarly,
In line with our use of initial velocity as a metric for quantification of photokinetic events, let us introduce Eq. (20) for the evaluation of the efficiency of a photoreaction under polychromatic light (
In the case of measuring the effect of the variation of the radiation intensity on the reaction efficiency,
3.13 Does photokinetics work for high initial reactant concentrations?
A concentration is considered high when it falls beyond the higher limit of the linearity range of the species’ calibration graphs (otherwise, the case conforms to both the framework developed in the present study for polychromatic light and that dedicated to monochromatic light (Maafi, 2023)). The obvious consequence of employing a high initial concentration is a deviation from the linearity of the species calibration graph. Such a deviation is proof of the limit of applicability of the Beer–Lambert law and the likelihood of the occurrence of phenomena other than simply a quantitative absorption of the light by the species under study. A full explanation for the observed curvature of the calibration graph is not yet available in the literature. However, several tentative interpretations have been proposed.
Buijs and Maurice (1969) proposed that such behavior had physical, chemical, and/or instrumental causes. The study introduced a procedure to distinguish between these three types of effects but did not derive an alternative to the Beer–Lambert law. The authors have suggested that such deviations from linearity can be attributed to three main causes: the light source being far from monochromatic, the concentrations of analytes being very high, and/or the medium being highly scattering.
One practical attempt focused on mapping the curved shape of the non-linear calibration graph by a Gaussian regression analysis that led to absorbance/absorbent concentration relationships (Young, 2015) but did not investigate possible causes of the curvature. Similarly, more sophisticated mathematical methods, such as random forests, support vector regression, neural networks, PLS, and PCR, have also been applied for such practical purposes (Wu et al., 1996; Santana et al., 2019; Mekonnen et al., 2020; Mamouei et al., 2021).
Recently, a finer analysis using Maxwell’s wave equation derived Beer’s law from dispersion theory and showed it to be a limiting law (Mayerhofer et al., 2019). The indices of absorption and molar attenuation coefficients, including absorption cross sections, were found not to be properties of the material. The latter can, per se, not be additive (while they are supposed to be both properties of molecules and additive in the Beer–Lambert law). In this model, the deviation from linearity was found to scale up with oscillator strengths, that is, with local electric fields and nearfield effects. A particular finding of the study indicated that the parameters emerging from this derivation do not exactly match with those of the formulation of the Beer–Lambert law.
A more extensive overview of the deviation of the Beer–Lambert law (Mayerhofer et al., 2020) has advanced an understanding of the optical spectra and their quantitative interpretation based on oscillator positions, strengths, and damping constants. By using the electromagnetic theory, the study showed that it was possible to reach a better quantification of band shift and intensity variation of the absorption spectrum and to conclude that the actual formula of the Beer–Lambert law (proportionality of absorbance with absorbent concentration) is an ideal absorption law that is only valid for relatively low concentration domains (i.e., the linear section of the calibration curve).
In addition to these variations of the absorption coefficients, the possible absorption of the light by other emerging species in the medium due to high concentration (e.g., complexes (Tonnesen, 2004), quenching (Menzel et al., 2021)… etc.), has also been proposed.
In summary, if the concentration value falls outside the linearity range of the calibration graph, then the Beer–Lambert law ceases to apply, and the absorption coefficient values of a species will change from those recorded when its concentration belongs to the linearity range. Unfortunately, often such new values of
A popular procedure in experimental photochemistry bases the evaluation of the reactant quantum yield on the usage of a high reactant concentration (when the reactant depletes by a single reaction step,
In this procedure, the quantum yield is then determined by the ratio
Despite the fact that the above procedure is widely used in the literature, it seems important to clarify that Eq. (21) cannot be established without imposing at least four conditions: i) the rate law applies at high concentration (as it does at low concentrations), ii) the total light absorbed serves specifically the photochemical transformation of the reactant (at least up to time,
Practically, there is no need to work at high concentrations because Eq. (17) provides such a quantum yield value (under the stated conditions). Otherwise, this value can be determined by successively exposing a low-concentration solution to a monochromatic light (Maafi, 2023). The procedure used in the literature to determine the quantum yield when the initial concentration of the reactant is high corresponds rather to that of a photonic yield (
Incidentally, the applicability of the high-concentration method for the quantum yield determination, has one serious limitation. Indeed, it is not applicable to those reactive systems that reach a phototostationary state, including the simplest photoreversible reaction (for which other approaches are proposed).
4 Conclusion
The Runge–Kutta numerical integration method has shown an excellent aptitude to model the photokinetics of complex photosystems subjected to polychromatic light. It has achieved a comprehensive account of such systems considered in various situations and reaction conditions. Numerical integration represents an efficient tool to prospect and predict photokinetics under both mono- and polychromatic lights.
The general model equation (Eq. (6)) consistently mapped out the photokinetic traces of photoreactions. This represented the first example of this kind in the literature on photochemistry. It proved that photokinetics is well-described by
The initial rate of the reactant was confirmed as a very useful metric for the quantification of photokinetic behaviors. It was pivotal to evaluating auto-photo-stabilization due to an increasing initial reactant concentration, the reaction slowdown caused by the presence of spectator molecules, increasing the speed of photoreactions with higher radiation intensity, defining of the optimal wavelength region of reactivity (WROR), development of actinometers for polychromatic light, and determining the photonic yield (
The findings of the present study have shown that quantification of reaction performance in different conditions does not necessarily require the knowledge of the photoreaction mechanism in play. Fitting Eq. (6) or Eq. (9) to the reaction data at hand is sufficient to obtain the metric value (i.e., the initial rate), which in turn allows us to quantitatively assess the reaction or effects of reaction conditions. This is a remarkable tool in photokinetic investigation and an advantage for the study of complex reactions whose mechanisms are often not easily unraveled.
When using polychromatic light, the present study has shown both the inconsistency of seeking the determination of the absolute quantum yield (a constant property of a molecule at a specific, single wavelength) and the utility of determining the photonic yield (
The present work on polychromatic light complements a previous study on monochromatic light, and both contribute to comprehensively describing and standardizing photokinetics in homogenous media, which is an area that has received little attention in the literature.
Work is now in progress to map out other light sensitive reactions (e.g., photothermal reactions) using a similar strategy.
Data availability statement
The raw data supporting the conclusions of this article will be made available by the authors, without undue reservation.
Author contributions
MM: conceptualization, data curation, formal analysis, funding acquisition, investigation, methodology, project administration, resources, software, supervision, validation, visualization, writing–original draft, writing–review and editing.
Funding
The author(s) declare that financial support was received for the research, authorship, and/or publication of this article. This work received financial support from De Montfort University.
Conflict of interest
The author declares that the research was conducted in the absence of any commercial or financial relationships that could be construed as a potential conflict of interest.
Publisher’s note
All claims expressed in this article are solely those of the authors and do not necessarily represent those of their affiliated organizations, or those of the publisher, the editors, and the reviewers. Any product that may be evaluated in this article, or claim that may be made by its manufacturer, is not guaranteed or endorsed by the publisher.
Supplementary material
The Supplementary Material for this article can be found online at: https://www.frontiersin.org/articles/10.3389/fchem.2024.1367276/full#supplementary-material
References
Aillet, T., Loubiere, K., Dechy-Cabaret, O., and Prat, L. (2014). Accurate measurement of the photon flux received inside two continuous flow microphotoreactors by actinometry. Int. J. Chem. React. Eng. 12, 257–269. doi:10.1515/ijcre-2013-0121
Amouroux, B., Roux, C., Micheau, J.-C., Gauffre, F., and Coudret, C. (2019). A photochemical determination of luminescence efficiency of upconverting nanoparticles. Beilstein J. Org. Chem. 15, 2671–2677. doi:10.3762/bjoc.15.260
Andreoni, L., Baroncini, M., Groppi, J., Silvi, S., Taticchi, C., and Credi, A. (2021). Photochemical energy conversion with artificial molecular machines. Energy fuels. 23, 18900–18914. doi:10.1021/acs.energyfuels.1c02921
Bochet, C. G. (2006). Photochemical release of various functional groups. Pure Appl. Chem. 78, 241–247. doi:10.1351/pac200678020241
Bonfield, H. E., Knauber, T., Lévesque, F., Moschetta, E. G., Susanne, F., and Edwards, L. J. (2020). Photons as a 21st century reagent. Nat. Commun. 11, 804. doi:10.1038/s41467-019-13988-4
Braslavsky, S. E. (2007). Glossary of terms used in photochemistry, 3rd edition (IUPAC Recommendations 2006). IUPA. Pure Appl. Chem. 79, 293–465. doi:10.1351/pac200779030293
Braslavsky, S. E., Braun, A. M., Cassano, A. E., Emeline, A. V., Litter, M. I., Palmisano, L., et al. (2011). Glossary of terms used in photocatalysis and radiation catalysis (IUPAC Recommendations 2011). Pure Appl. Chem. 83, 931–1014. doi:10.1351/PAC-REC-09-09-36
Brunner, H. (2017). Volterra integral equations. Cambridge: Cambridge University Press. doi:10.1017/9781316162491
Buglioni, L., Raymenants, F., Slattery, A., Zondag, S. D. A., and Noël, T. (2022). Technological innovations in photochemistry for organic synthesis: flow chemistry, high-throughput experimentation, scale-up, and photoelectrochemistry. Chem. Rev. 122, 2752–2906. doi:10.1021/acs.chemrev.1c00332
Buijs, K., and Maurice, M. J. (1969). Some considerations on apparent deviations from lambert-beer's law. Anal. Chim. Acta. 47, 469–474. doi:10.1016/S0003-2670(01)95647-8
Cambié, D., Dobbelaar, J., Riente, P., Vanderspikken, J., Shen, C., Seeberger, P. H., et al. (2019). Energy-efficient solar photochemistry with luminescent solar concentrator based photomicroreactors. Angewante Chem. Int. Ed. 40, 14374–14378. doi:10.1002/anie.201908553
Chernyshev, A. V., Voloshin, N. A., Rostovtseva, I. A., Solov'eva, E. V., Gaeva, E. B., and Metelitsa, A. V. (2018). Polychromogenic molecular systems based on photo- and ionochromic spiropyrans. Dyes Pig 158, 506–516. doi:10.1016/j.dyepig.2018.05.040
Corrigan, N., and Boyer, C. (2019). 100th anniversary of macromolecular science viewpoint: photochemical reaction orthogonality in modern macromolecular science. ACS Macro Lett. 8, 812–818. doi:10.1021/acsmacrolett.9b00292
Dolinina, E. S., Akimsheva, E. Y., and Parfenyuk, E. V. (2020). Development of novel silica-based formulation of α-lipoic acid: evaluation of photo and thermal stability of the encapsulated drug. Pharmaceutics 12, 228. doi:10.3390/pharmaceutics12030228
Fabian, I., and Lente, G. (2010). Light-induced multistep redox reactions: the diode-array spectrophotometer as a photoreactor. Pure Appl. Chem. 82, 1957–1973. doi:10.1351/PAC-CON-09-11-16
Frigoli, M., Jousselin-Oba, T., Mamada, M., Marrot, J., Zangarelli, A., Pannacci, D., et al. (2020). Synthesis and photochromic behaviour of a series of benzopyrans bearing an N-phenyl-carbazole moiety: photochromism control by the steric effect. Photochem. Photobiol. Sci. 19, 1344–1355. doi:10.1039/D0PP00202J
Gimenez-Gomez, A., Magson, L., Peñin, B., Sanosa, N., Soilán, J., Losantos, R., et al. (2022). A photochemical overview of molecular solar thermal energy storage. Photochem 2, 694–716. doi:10.3390/photochem2030045
Grande, F., Ragno, G., Muzzalupo, R., Occhiuzzi, M. A., Mazzotta, E., De Luca, M., et al. (2020). Gel formulation of nabumetone and a newly synthesized analog: microemulsion as a photoprotective topical delivery system. Pharmaceutics 12, 423. doi:10.3390/pharmaceutics12050423
A. Griesbeck, M. Oelgemoller, and F. Ghetti (2012). Handbook of organic photochemistry and photobiology. 3rd Ed. (Boca Raton, New York, London: CRC Press). ISBN 9781439899335.
Han, L., Abdi, F. F., Van de Krol, R., Lui, R., Huang, Z., Lewerenz, H.-J., et al. (2014). Efficient water-splitting device based on a bismuth vanadate photoanode and thin-film silicon solar cells. ChemSusChem 10, 2832–2838. doi:10.1002/cssc.201402456
Hatchard, C. G., and Parker, C. A. (1956). A new sensitive chemical actinometer. II. Potassium ferrioxalate as a standard chemical actinometer. Proc. R. Soc. Lond. Ser. A, Math. Phys. Sci. 235 (1203), 518–536. doi:10.1098/rspa.1956.0102
Holland, J. P., Gut, M., Klingler, S., Fay, R., and Guillou, A. (2020). Photochemical reactions in the synthesis of protein–drug conjugates. Chem. Eur. J. 26, 33–48. doi:10.1002/chem.201904059
Jakusová, K., Cigáň, M., Donovalová, J., Gáplovský, M., Sokolík, R., and Gáplovský, A. (2014). Light initiated E–Z and Z–E isomerization of isatinphenylsemicarbazones: tautomeric equilibrium effect. J. Photochem. Photobiol. A Chem. 288, 60–69. doi:10.1016/j.jphotochem.2014.05.004
Józsa, E., Kiss, V., and Ősz, K. (2018). Photochemical processes of 1,4-benzoquinones in aqueous medium. J. Photochem. Photobiol. A. Chem. 360, 166–173. doi:10.1016/j.jphotochem.2018.04.024
Kayahan, E., Jacobs, M., Braeken, L., Thomassen, L. C., Kuhn, S., van Gerven, T., et al. (2020). Dawn of a new era in industrial photochemistry: the scale-up of micro- and mesostructured photoreactors. Beilstein J. Org. Chem. 16, 2484–2504. doi:10.3762/bjoc.16.202
Kuhn, H. J., Braslavsky, S. E., and Schmidt, R. (2004). Chemical actinometry (IUPAC technical report). Pure Appl. Chem. 76, 2105–2146. doi:10.1351/pac200476122105
Kumar, G. S., Sha, M. S., Yempally, S., Cabibihan, J. J., and Sadasivuni, K. K. (2023). A practical perspective for chromatic orthogonality for implementing in photolithography. Sci. Rep. 13, 694. doi:10.1038/s41598-023-27869-w
Le Basle, Y., Chennell, P., Tokhadze, N., Astier, A., and Sautou, V. (2020). Physicochemical stability of monoclonal antibodies: a Review. J. Pharm. Sci. 1, 169–190. doi:10.1016/j.xphs.2019.08.009
Lehóczki, T., Józsa, E., and Ősz, K. (2013). Ferrioxalate actinometry with online spectrophotometric detection. J. Photochem. Photobiol. A Chem. 251, 63–68. doi:10.1016/j.jphotochem.2012.10.005
Lente, G. (2015). Deterministic kinetics in chemistry and systems biology: the dynamics of complex reaction networks. Cham, Heidelberg, New York, Dordrecht, London: Springer. doi:10.1007/978-3-319-15482-4
Lente, G., and Espenson, J. H. (2004). Photoreduction of 2,6-dichloroquinone in aqueous solution. J. Photochem. Photobiol. A Chem. 163, 249–258. doi:10.1016/j.jphotochem.2003.12.005
Lewis, B. J., Onder, E. N., and Prudil, A. A. (2022). Advanced mathematics for engineering students. United Kingdom: Butterworth-Heinemann, Elsevier. doi:10.1016/B978-0-12-823681-9.00002-2
Li, L., Scheiger, J. M., and Levkin, P. A. (2019). Design and applications of photoresponsive hydrogels. Adv. Mater. 31, 1807333. doi:10.1002/adma.201807333
Maafi, M. (2023). On photokinetics under monochromatic light. Front. Chem. 11, 1233151. doi:10.3389/fchem.2023.1233151
Maafi, M., and Al-Qarni, M. A. (2022a). Mono- and polychromatic light diarylethene-actinometer for the visible range. Dyes pigments 198, 109942. doi:10.1016/j.dyepig.2021.109942
Maafi, M., and Al-Qarni, M. A. (2022b). Photokinetics of Dacarbazine and Nifedipine under polychromatic light irradiation and their application as new reliable actinometers for the ultraviolet range. Sci. Rep. 12, 7622. doi:10.1038/s41598-022-11570-5
Mamouei, M., Budidha, K., Baishya, N., Qassem, M., and Kyriacou, P. A. (2021). An empirical investigation of deviations from the Beer–Lambert law in optical estimation of lactate. Sci. Rep. 11, 13734. doi:10.1038/s41598-021-92850-4
H. Mauser, G. Gauglitz, R. G. Compton, and G. Hancock (1998). Comprehensive chemical kinetics, photokinetics: theoretical fundamentals and applications (Amesterdam: Elsevier), 36.
Mayerhofer, T. G., Hofer, S., and Popp, J. (2019). Deviations from Beer's law on the microscale – nonadditivity of absorption cross sections. Phys. Chem. Chem. Phys. 21, 9793–9801. doi:10.1039/C9CP01987A
Mayerhofer, T. G., Pahlow, S., and Popp, J. (2020). The bouguer-beer-lambert law: shining light on the obscure. ChemPhysChem 21, 2029–2046. doi:10.1002/cphc.202000464
McFadden, M. E., Barber, R. W., Overholts, A. C., and Robb, M. J. (2023). Naphthopyran molecular switches and their emergent mechanochemical reactivity. Chem. Sci. 14, 10041–10067. doi:10.1039/D3SC03729K
Mekonnen, B. K., Yang, W., Hsieh, T. H., Liaw, S. K., and Yang, F. L. (2020). Accurate prediction of glucose concentration and identification of major contributing features from hardly distinguishable near-infrared spectroscopy. Biomed. Signal Process. Control. 59, 101923. doi:10.1016/j.bspc.2020.101923
Menzel, J. P., Noble, B. B., Blinco, J. P., and Barner-Kowollik, C. (2021). Predicting wavelength-dependent photochemical reactivity and selectivity. Nat. Commun. 12, 1691. doi:10.1038/s41467-021-21797-x
Michnyóczki, J., Kiss, V., and Ősz, K. (2021). A kinetic study of the photooxidation of water by aqueous cerium(IV) in sulfuric acid using a diode array spectrophotometer. J. Photochem. Photobiol. A Chem. 408, 113110. doi:10.1016/j.jphotochem.2020.113110
Montalti, M., Credi, A., Prodi, L., and Gandolfi, M. T. (2020). Handbook of photochemistry. 3rd Ed. Florida, United States: CRC Press, 1251.
Pino-Chamorro, J. A., Ditrói, T., Lente, G., and Fábián, I. (2016). A detailed kinetic study of the direct photooxidation of 2,4,6-trichlorophenol. J. Photochem. Photobiol. A Chem. 330, 71–78. doi:10.1016/j.jphotochem.2016.07.025
Poliakoff, M., and George, M. W. (2020). Manufacturing chemicals with light: any role in the circular economy? Phil. Trans. R. Soc. A 378, 20190260. doi:10.1098/rsta.2019.0260
Reinfelds, M., Hermanns, V., Halbritter, T., Wachtveitl, J., Braun, M., Slanina, T., et al. (2019). A robust, broadly absorbing fulgide derivative as a universal chemical actinometer for the UV to NIR region. ChemPhotoChem 3, 441–449. doi:10.1002/cptc.201900010
Reiß, B., Hu, Q., Riedle, E., and Wagenknecht, H.-A. (2021). The dependence of chemical quantum yields of visible light photoredox catalysis on the irradiation power. ChemPhotoChem 5, 1009–1019. doi:10.1002/cptc.202100090
Rochatte, V., Dahi, G., Eskandari, A., Dauchet, J., Gros, F., Roudet, M., et al. (2017). Radiative transfer approach using Monte Carlo Method for actinometry in complex geometry and its application to Reinecke salt photodissociation within innovative pilot-scale photo(bio)reactors. Chem. Eng. J. 308, 940–953. doi:10.1016/j.cej.2016.08.112
Roibu, A., Fransen, S., Leblebici, M. E., Meir, G., Van Gerven, T., and Kuhn, T. (2018). An accessible visible-light actinometer for the determination of photon flux and optical pathlength in flow photo microreactors. Sci. Rep. 8, 5421. doi:10.1038/s41598-018-23735-2
Saltiel, J., Krishnan, S. B., Gupta, S., Hernberg, E. A., and Clark, R. J. (2022). Photochemistry and photophysics of cholesta-5,7,9(11)-trien-3β-ol: a fluorescent analogue of cholesterol. Photochem Photobiol. Sci. 21, 37–47. doi:10.1007/s43630-021-00131-w
Santana, F. B., Neto, W. B., and Poppi, R. J. (2019). Random forest as one-class classifier and infrared spectroscopy for food adulteration detection. Food Chem. 293, 323–332. doi:10.1016/j.foodchem.2019.04.073
Stadler, E., Eibel, A., Fast, D., Freißmuth, H., Holly, C., Wiech, M., et al. (2018). A versatile method for the determination of photochemical quantum yields via online UV-Vis spectroscopy. Photochem. Photobiol. Sci. 17, 660–669. doi:10.1039/C7PP00401J
Stranius, K., and Borjesson, K. (2017). Determining the photoisomerization quantum yield of photoswitchable molecules in solution and in the solid state. Sci. Rep. 7, 41145. doi:10.1038/srep41145
Trawinski, J., and Skibinski, R. (2019). Photodegradation study of Sertindole by UHPLC-ESI-Q-TOF and influence of some metal oxide excipients on the degradation process. Pharmaceutics 11, 299. doi:10.3390/pharmaceutics11070299
Vione, D., and Scozzaro, A. (2019). Photochemistry of surface fresh waters in the framework of climate change. Environ. Sci. Technol. 53, 7945–7963. doi:10.1021/acs.est.9b00968
Volfova, H., Hu, Q., and Riedle, E. (2019). Determination of reaction quantum yields: LED based setup with better 5 % precision. Eur. Photochem. Ass. Newslett. 96, 51–69.
Walden, S. L., Carroll, J. A., Unterreiner, A.-N., and Barner-Kowollik, C. (2023). Photochemical action plots reveal the fundamental mismatch between absorptivity and photochemical reactivity. Adv. Mater. 11, 2306014. doi:10.1002/advs.202306014
Weingartz, T., Nagorny, S., Adams, J., Eitzeroth, A., Schewe, M., Rembe, C., et al. (2023). Bis(thienyl)ethenes with α-methoxymethyl groups. Syntheses, spectroscopic Hammett plots, and stabilities in PMMA films. RSC Adv. 13, 25704–25716. doi:10.1039/D3RA04444K
Williams, J. D., and Kappe, C. O. (2020). Recent advances toward sustainable flow photochemistry. Curr. Opin. Green Sustain. Chem. 25, 100351. doi:10.1016/j.cogsc.2020.05.001
Wu, W., Walczak, B., Massart, D. L., Heuerding, S., Erni, F., Last, I. R., et al. (1996). Artificial neural networks in classification of NIR spectral data: design of the training set. Chemom. Intell. Lab. Syst. 33, 35–46. doi:10.1016/0169-7439(95)00077-1
Yamada, H., and Yagai, S. (2019). Light-active functional organic materials (Dubai, U.A.E: Jenny Stanford Publishing).
Yassine, M., Fuster, L., Dévier, M. H., Geneste, E., Pardon, P., Grélard, A., et al. (2018). Photodegradation of novel oral anticoagulants under sunlight irradiation in aqueous matrices. Chemosphere 193, 329–336. doi:10.1016/j.chemosphere.2017.11.036
Young, J. C. O. ’C. (2015). A Gaussian accommodation of beer’s law deviations. Chem. Educ. 20, 206–213. doi:10.1333/s00897152648a,20150206
Yutani, R., Haku, R., Teraoka, R., Tode, C., Koide, T., Kitagawa, S., et al. (2019). Comparative evaluation of the photostability of carbamazepine polymorphs and cocrystals. Crystals 9, 553. doi:10.3390/cryst9110553
Zalazar, C. S., Labas, M. D., Martin, C. A., Brandi, R. J., Alfano, O. M., and Cassano, A. E. (2005). The extended use of actinometry in the interpretation of photochemical reaction engineering data. Chem. Eng. J. 109, 67–81. doi:10.1016/j.cej.2005.03.011
Zepp, R. G. (1978). Quantum yields for reaction of pollutants in dilute aqueous solution. J. Am. Chem. Soc. 12, 327–329. doi:10.1021/es60139a010
Zhang, J. Y., Boyd, I. W., and Esrom, H. (1997). UV intensity measurement for a novel 222 nm excimer lamp using chemical actinometer. Appl. Surf. Sci. 109/110, 482–486. doi:10.1016/S0169-4332(96)00789-1
Glossary
Keywords: polychromatic light, photokinetics, Φ-order kinetics, actinometry, reactivity–wavelength range, Runge–Kutta
Citation: Maafi M (2024) On photokinetics under polychromatic light. Front. Chem. 12:1367276. doi: 10.3389/fchem.2024.1367276
Received: 08 January 2024; Accepted: 12 March 2024;
Published: 22 April 2024.
Edited by:
Katsuyuki Shizu, Kyoto University, JapanCopyright © 2024 Maafi. This is an open-access article distributed under the terms of the Creative Commons Attribution License (CC BY). The use, distribution or reproduction in other forums is permitted, provided the original author(s) and the copyright owner(s) are credited and that the original publication in this journal is cited, in accordance with accepted academic practice. No use, distribution or reproduction is permitted which does not comply with these terms.
*Correspondence: Mounir Maafi, bW1hYWZpQGRtdS5hYy51aw==