- 1U.S. Naval Research Laboratory, Materials Science and Technology Division, Washington, DC, United States
- 2American Society for Engineering Education (ASEE), Washington, DC, United States
Introduction: Dilutely doped ferroelectric materials are of interest, as engineering these materials by introducing point defects via doping often leads to unique behavior not otherwise achievable in the undoped material. For example, B-site doping with transition metals in barium titanate (BaTiO3, or BTO) creates defect dipoles via oxygen vacancies leading enhanced polarization, strain, and the ability to tune dielectric properties. Though defect dipoles should lead to dielectric property enhancements, the effect of grain size in polycrystalline ferroelectrics such as BTO plays a significant role in those properties as well.
Methods: Herein, doped BTO with 1.0% copper (Cu), iron (Fe), or cobalt (Co) was synthesized using traditional solid-state processing to observe the contribution of both defect-dipole formation and grain size on the ferroelectric and dielectric properties.
Results and discussion: 1.0% Cu doped BTO showed the highest polarization and strain (9.3 μC/cm2 and 0.1%, respectively) of the three doped BTO samples. While some results, such as the aforementioned electrical properties of the 1.0% Cu doped BTO can be explained by the strong chemical driving force of the Cu atoms to form defect dipoles with oxygen vacancies and copper’s consistent +2 valency leading to stable defect-dipole formation (versus the readily mixed valency states of Fe and Co at +2/+3), other properties cannot. For instance, all three Tc values should fall below that of undoped BTO (typically 120°C–135°C), but the Tc of 1.0% Cu BTO actually exceeds that range (139.4°C). Data presented on the average grain size and distribution of grain sizes provides insight allowing us to decouple the effect of defect dipoles and the effect of grain size on properties such as Tc, where the 1.0% Cu BTO was shown to possess the largest overall grains, leading to its increase in Tc.
Conclusion/future work: Overall, the 1% Cu BTO possessed the highest polarization, strain, and Tc and is a promising dopant for engineering the performance of the material. This work emphasizes the challenge of extricating one effect (such as defect-dipole formation) from another (grain size modification) inherent to doping polycrystalline BTO.
1 Introduction
Engineering ferroelectric ceramics by purposefully introducing point defects has a profound effect on the material’s behavior, such as unusual ferroelectric properties and high electric field induced strain (Zhao et al., 2019). Examples of point defects include dopant or impurity ions as well as vacancies, which can lead to defect dipoles arising from oxygen vacancies and ionized acceptors (Ren, 2004; Maier et al., 2015). For perovskites (ABO3 structure), dilute doping at the B site leads to a distribution of oxygen vacancies to achieve charge neutrality, which form defect complexes with the doped acceptor ion (Vani and Kumar, 2012; Maier et al., 2015). The oxygen vacancies have an intrinsic mobility, which is affected by the dopant itself, the concentration of dopant, and the transition metal’s valence state. Barium titanate (BaTiO3, BTO) is a ubiquitous ferroelectric oxide with low dielectric loss, chemical stability, and is lead-free with low toxicity, and has been widely and commonly doped at the Ti4+ site with various transition metals, including iron (Fe), manganese (Mn), cobalt (Co), and copper (Cu) (Rani et al., 2016). Although there are a multitude of studies on such dopants, these works focus on dopant concentrations that lead to hexagonal BTO, do not include polarization/strain curves in addition to permittivity and loss measurements, study ferromagnetic or optical properties, are processed under different thermal profiles, and do not attempt to directly compare three different dopants in the same work (Langhammer et al., 2003; Cheng et al., 2005; Dang et al., 2011; Deka et al., 2014; Langhammer et al., 2015; Langhammer et al., 2016; Rani et al., 2016; Krimech and Sayouri, 2020; Althobaiti, 2023).
In perovskites, such as dilutely doped BTO, both the ionic radius and valency of the dopant is highly important in determining the site of doping (either A or B site). This is closely related to how effective the particular dopant will be at trapping oxygen vacancies, which is highly influenced by the valence state and the charge neutrality conditions of the composition (Eichel, 2008; Schie et al., 2014). In addition, the concentration of oxygen vacancies is influenced by the concentration and specific element chosen as the dopant (Huang et al., 2014). B-site dopants with a lower valency than Ti4+ (i.e. 2+ or 3+) can then form stable defect dipoles with oxygen vacancies along the <001> direction, the same direction as the spontaneous polarization direction (Zhao et al., 2019). These particular defect-dipole complexes have been shown to have a profound effect on the ferroelectric and piezoelectric behavior of materials such as barium titanate. The moment of the defect dipole induces an internal bias field, which can increase the polarization of the material by producing large crystal field anisotropy in the vicinity of the dopant and, when poled in the direction of the defect dipole, can also increase the strain experienced in the material (Maier et al., 2015). The orientation of the dipoles takes place during oxygen vacancy diffusion on the scale of several unit cells, which occurs at room temperature and leads to a recoverable domain wall configuration and “pinched” hysteresis loops with decreased remnant polarization (Kamel and de With, 2008; Zhao et al., 2019). Overall, a dopant cation has a direct effect over the range of several unit cells on the association and migration energies, i.e., the energies of oxygen vacancy—dopant association and activation energy of vacancy motion away from the dopant, respectively (Schie et al., 2014). This can significantly impact the formation of these complexes and thus the bulk ferroelectric properties.
Although our previous work (Patterson et al., 2023) and several other works discussed above focus on single crystals, for polycrystalline samples another important influence on the ferroelectric and piezoelectric properties of both doped and undoped BTO is grain size. It has been reported that several electrical properties such as the piezoelectric constant (d33), polarization, and relative permittivity are affected by grain size, typically with a decrease in these properties with a decrease in grain size as grains approach the nanometer scale (Zhao et al., 2004; Guo et al., 2012; Huan et al., 2014). This is predicted to be due to a change in domain density and non-uniformities at grain boundaries (Huan et al., 2014). It has also been observed that non-uniformities such as aluminum segregation at grain boundaries can be partially responsible for ferroelectric aging behavior even when no second phase is detected, separate from impacts of volume of domain walls (Carl and Hardtl, 1977). Overall, domain configuration has a large impact on macroscopic dielectric properties, which in turn is substantially affected by the microstructure (Eichel, 2008). However, it is imperative to attempt to separate the effects of microstructure and intrinsic effects on the dielectric properties of polycrystalline ferroelectrics.
In this work, dielectric materials properties will be investigated (polarization, strain, and relative permittivity/loss) and reported with respect to polycrystalline BTO ceramics doped with 1.0 mol% of Fe, Co or Cu, synthesized via traditional solid-state processing. These results will then be discussed with respect to the grain size, determined from cross-sectional scanning electron microscopy (SEM) images. Comparisons between the dielectric properties of the three different doped BTO samples show the importance of considering all of the various contributions from the dopant that can affect the dielectric properties. These can be due to defect-dipole formation, grain growth/growth inhibition, oxygen vacancy diffusion, or a complex contribution from a subset or all of these. The challenge of extricating one effect from the other will be emphasized, along with the need for these in-depth studies.
2 Materials and methods
Ceramic powders of BaTi1-xMexO3 (with Me = Fe, Co, or Cu) were prepared using traditional solid state synthesis methods with x = 0.01 mol. Precursor oxides of BaCO3, TiO2, Fe2O3, CoCO3, and CuO (99.9+%) were mixed in ethanol and ball milled for 8 h with proper stoichiometric amounts of the Fe, Co or Cu precursor added. The mixed powders were dried and then calcined at 1,150°C for 2 h and milled and dried again as before. Pellets of each composition were then uniaxially pressed in a 12.7 mm diameter die after mixing the calcined powder with 4-5 wt% binder (Paraloid B-72 resin mixed with acetone). The pressed pellets were sintered at 1,250°C in air for 4 h. The density of the sintered pellets was greater than 91% theoretical density for all samples in this study. The phase of the pellets was confirmed with X-ray diffraction (XRD) using a Rigaku SmartLab Rigaku X-ray powder diffractometer with Cu Kα radiation at 40 kV and 200 mA for a 2θ range from 20° to 80° with a 0.02° step size.
The sintered pellets were then ground down to a thickness of approximately 800 µm and masked and sputtered with gold electrodes for synchronous ferroelectric and piezoelectric measurements, which were performed with a self-constructed Sawyer-Tower system and a linear variable differential transformer (LVDT) connected to a lock-in amplifier. The electrical measurements were performed on samples in three different states with increasing applied voltages from 0.1 kV up to 1.4 kV at 1 Hz (all data shown in this work is at 1.4 kV) as the properties are well-understood to strongly depend on the defect configuration, which can be modified through temperature or electric field. Therefore, the thermal and electrical history of the sample are important factors in discussing the dielectric behavior. The three states to be measured are referred hereafter as: as-sintered, aged, and poled. All samples were thermally reset at 300°C for 4 h after the initial sintering and allowed to cool to room temperature. This default “as-sintered” state was then tested. The “aged” subset of these samples were then aged at 80°C for 24 h to allow for diffusion of oxygen vacancies prior to characterization. Finally, the “poled” subset of samples were poled at a DC bias of 1.5 kV for 1 h at room temperature and tested.
Simultaneous capacitance and tan δ measurements were performed using two different methods in order to determine the relative permittivity and dielectric loss of the samples under different conditions. All samples for these measurements were tested in the “as-sintered state.” First, an Agilent E4980A precision LCR meter was used to sweep between frequencies of 200 Hz and 2 MHz to determine the permittivity and loss at room temperature. Second, a Thermal Product Solutions (TPS) Tenney Environmental Test Chamber was used to measure the capacitance and loss from −30°C to 155°C at four different frequencies: 0.1, 1, 10, and 100 kHz. The frequency was generated from an HP 4284A Precision LCR meter, which also measured the capacitance and loss at each frequency over the temperature range. A self-assembled LCR test interface was used to connect the LCR meter to the sample holder inside the environmental test chamber, which was accompanied by a National Instruments thermocouple placed close to the sample to more accurately monitor temperature.
Cross-sectional scanning electron microscopy (SEM) images were taken of the polished, fractured surface of each composition using a Thermo Scientific Quattro S at an accelerating voltage of 10 keV. Images were taken across different regions of the cross-section, and were analyzed by ImageJ software. Ten images were used to determine the average grain size via the linear intercept method, whereby five lines were drawn per image to obtain an average grain size for one image, resulting in 50 total lines drawn with ten average values of grain size for each particular sample.
3 Results and discussion
3.1 X-ray diffraction
Sintered pellets of 1% Fe, Co, and Cu-doped BTO were analyzed via XRD to determine if the concentration of Fe affected the presence of the expected ferroelectric, tetragonal phase, as some studies have observed the formation of the hexagonal phase at as low as 1% Fe (Langhammer et al., 2020). Figure 1 shows that across the three samples, the calcined powders are of the ferroelectric tetragonal phase with no other phases present, demonstrating that doping in this study with Fe, Co, or Cu does not induce a detectable phase change at x = 1%. The lattice parameters and c/a ratios obtained from a whole pattern fit of each diffraction pattern (indexed with respect to tetragonal BTO, PDF# 04-012-8129) is included in Table 1. The c/a ratio of undoped BTO, 1.01, is slightly higher than that of the Co, Fe, and Cu-doped BTO samples (1.008, 1.007, and 1.008, respectively). Doping with 1% Co and Fe has been shown to slightly decrease the c/a ratio, which was observed here for all three dopants (Buscaglia et al., 2000).
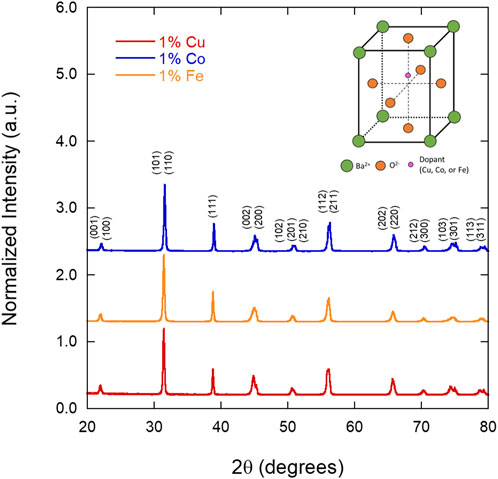
FIGURE 1. X-ray diffraction patterns of the 1% Fe, Co, and Cu-doped BTO powders measured after calcination at 1150°C, showing the tetragonal phase of BTO and no evidence of a hexagonal phase impurity (indexed with respect to PDF# 04-012-8129). The crystal structure of tetragonal BTO is shown in the top right corner.
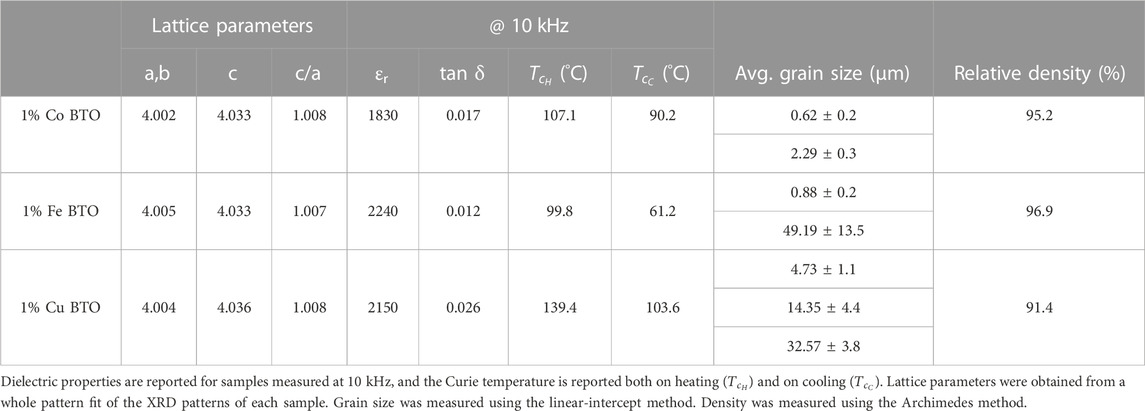
TABLE 1. Lattice parameters, dielectric properties, average grain sizes, and densities for the three doped BTO samples.
3.2 Ferroelectric and piezoelectric testing
Polarization and strain of the three compositions in all three conditions were measured at 1.4 kV, which translates to a field of approximately 1.5 kV/mm. Figure 2 shows polarization (Figure 2A) and strain loops (Figure 2B) for the “as-sintered” condition measured at 1.4 kV. Note that all samples were tested at applied voltages between 0.1 and 1.4 kV at 1 Hz, but only the 1.4 kV results are shown here. The polarization and strain loops for the samples that were aged (80°C, 24 h) and poled (1.5 kV, 1 h at 2.4 kV) can be found in the Supplementary Material (Supplementary Figures S1, S2). Measuring samples after aging and poling was performed to determine the extent that temperature and field cycling affects the polarization and strain of these differently doped materials. The 1.0% Fe-doped BTO sample showed an increase in strain from ∼0.025% to ∼0.04% after aging, and the 1.0% Cu BTO sample showed a decrease in polarization from ∼9 to ∼5 μC/cm2 (Supplementary Figure S1). In order to fully realize the effect on the polarization and strain after poling, the poled samples were measured at 2.4 kV (Supplementary Figure S2), showing multiple changes in polarization and strain behaviour. It is important to not compare their maximum values without considering that the field level is nearly twice as high as in the as-sintered and aged state. With that in mind, the 1.0% Cu BTO sample displayed no further enhancement compared to the “as-sintered” value of polarization and the pinched portion of the polarization hysteresis loop disappears in favor of a traditional ferroelectric shape. The strain also takes on a more butterfly shape with negative strain at the coercive field. Additionally, the polarization loops of the 1.0% Co and Fe samples have become asymmetric, indicating a high internal electric field (Supplementary Figure S2A). This is supported by the offset in the field of the 1.0% Co and Fe BTO strain loops (Supplementary Figure S2B). The poled strain loops also show a general improvement of strain for all three samples that approaches 0.1%, albeit at higher fields as mentioned. Aging and poling can have extreme effects on the polarization and strain behaviour of ferroelectric materials via domain/defect-dipole orientations (Kamel and de With, 2008). While the effects that both aging or poling have on the polarization and strain of the material via an external, post-processing method are quite large, in these samples they were found to be repeatably reversible following a 300°C heat treatment. Importantly, the hysteresis loops always returned to the “as-sintered” state, so it is from this baseline condition that comparisons will be focused on in this discussion.
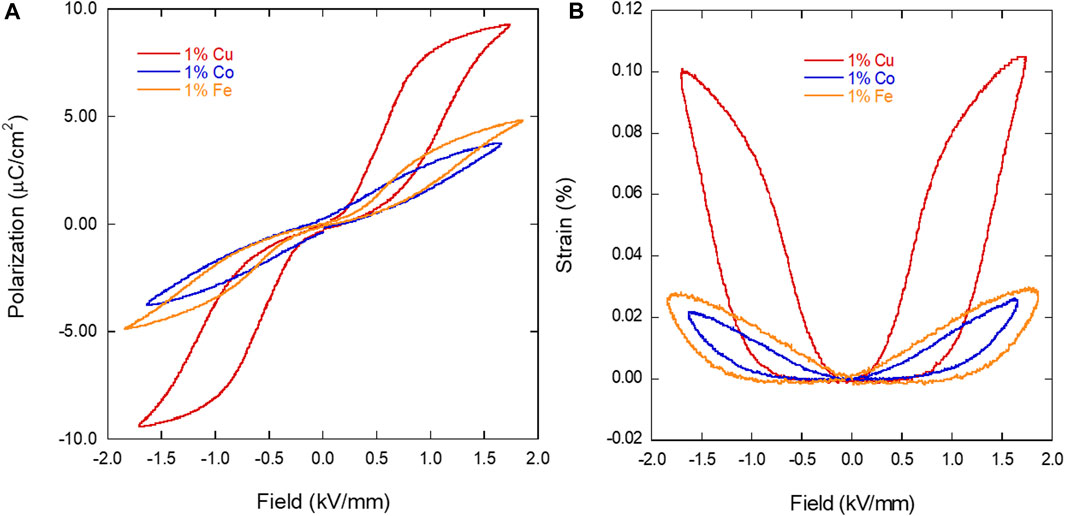
FIGURE 2. Polarization (A) and strain (B) loops for the thermally reset (300°C) 1% Fe, Co and Cu-doped BTO samples measured at 1.4 kV.
In the “as-sintered” state, the 1.0% Cu-doped BTO yields the highest polarization (∼9.3 μC/cm2) and strain (∼0.1%) when compared to the 1.0% Fe and Co-doped BTO, with polarizations of 4.8 and 3.7 μC/cm2 and strains of 0.03% and 0.025%, respectively. In comparison, undoped BTO sintered at similar conditions yield polarizations between 15 and 18 μC/cm2 (Tan et al., 2015; Malyshkina et al., 2020). Additionally, Figure 2B shows that all three dopants yielded little to no negative strain, showing recoverable strain across each dopant. The presence of the pinched polarization loops of the 1.0% Fe and Cu-doped BTO samples (Figure 2A) is a good indication of defect dipole formation pinning domain walls in those samples.
There is an obvious improvement in the ferroelectric properties with respect to the 1.0% Cu-doped BTO when compared to the 1.0% Fe and Co. Looking at each dopant, however, it does not seem at first glance that ionic radius plays a part, as the difference between the ionic radii for the various oxidation states of each transition metal are relatively similar when compared to Ti4+ (0.61) (listed in Å): 0.75 (Co2+), 0.55 (Co3+), 0.77 (Cu+), 0.73 (Cu2+), 0.78 (Fe2+), and 0.65 (Fe3+) (Shannon, 1976). Therefore, doping with any of these three elements for Ti4+ should not play a role in one composition more than another. It is important to note, however, that the valence state of the incorporated ion is dependent on a number of factors, such as initial precursors and the oxidizing/reducing conditions during synthesis. Therefore, we should expect a mix of these valence states for some if not all of the dopants chosen in this work.
While the valence states of the incorporated dopants will not significantly distort the lattice, the valency of the ions can influence the intrinsic ferroelectric behaviour. Co and Fe are both stable at a 2+ or 3+ state, while Cu is commonly found in a 2+ state. The mixed valence of the Co and Fe may play a role in achieving charge neutrality (via different amounts of oxygen vacancies and other free charges) which then affects the ferroelectric and piezoelectric properties of the material. This difference in valence is proposed to directly affect the establishment of defect-dipoles, formed between the dopant and induced oxygen vacancies. Using Kröger-Vink notation, the defect-dipole complexes for the three different dopants are the following:
3.3 Other dielectric measurements
3.3.1 Relative permittivity (εr)/tan δ vs. frequency (room temperature)
The relative permittivity (εr) and loss tangent (tan δ) of as-sintered samples of each composition were measured at room temperature with respect to frequency, shown in Figure 3 and reported in Table 1. When compared to the typical relative permittivity of barium titanate (εr∼3,000-6,000), all three of the doped BTO samples exhibit a lower value than undoped BTO, which is due to the fact that in comparison to Ti4+, all three dopants (Co3+, Cu2+, and Fe3+) are more conductive and less polarizable, decreasing the relative permittivity, as expected (Rani et al., 2016). More specifically, undoped BTO at similar processing conditions yields a relative permittivity similar to the reported ranged of BTO, ranging from ∼3,000 to 6,500 at 1 kHz (Hoshina et al., 2008; Tan et al., 2015). However, the permittivity of all three doped BTO samples remains fairly constant up to 2 MHz, due to the failure of the dipoles to follow the fast alternating electric field (Rani et al., 2016). With regards to tan δ at 10 kHz, each doped sample exhibited a loss of ∼0.01, a relatively low value of loss due to the dopant’s ability to reduce leakage current in the sample (Imai et al., 2002). All samples showed an increase in loss in the MHz, frequency range and the 1% Cu doped BTO sample nominally yielded the highest loss at 2 MHz. The Cu doped sample, however, showed the most frequency-stable loss at the intermediate to lower frequencies (with the increase starting at 100 kHz).
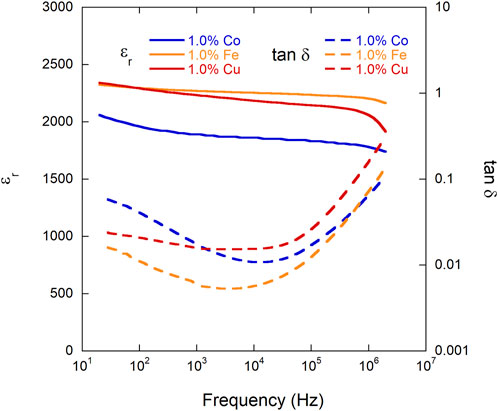
FIGURE 3. Relative permittivity (εr) (solid lines) and loss tangent (tan δ) (dashed lines) of each composition (1% Co, Cu, and Fe BTO) measured at room temperature with respect to frequency after samples were thermally reset at 300°C for 4 h.
3.3.2 Relative permittivity (εr)/tan δ vs. temperature (variable frequency)
As-sintered samples of 1% Co, Cu, and Fe doped BTO were loaded into an LCR test interface and the εr and tan δ were measured between −30°C and 155°C at 0.1, 1, 10, and 100 kHz. Data from the cooling curves for each sample at 10 kHz are shown in Figure 4 with Curie temperatures measured both on heating (
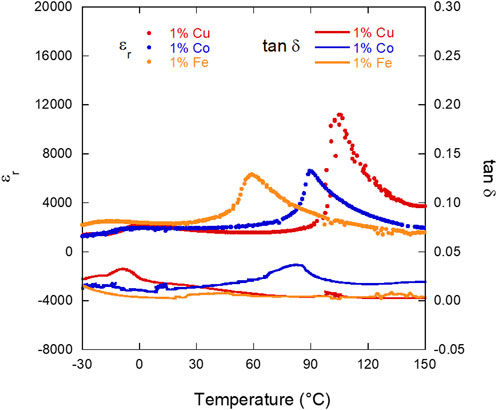
FIGURE 4. Relative permittivity (εr) (solid lines) and loss tangent (tan δ) (dashed lines) of each composition (1% Co, Cu, and Fe BTO) with respect to temperature, measured at 10 kHz in the “as-sintered” state (thermally reset at 300°C for 4 h after sintering). Only the cooling curves are shown in this plot.
With respect to the
3.4 Grain size measurement
In order to measure the grain sizes of the three samples, cross-sections of a pellet of each dopant were polished and then imaged via SEM. Grain size was then determined by the linear intercept method, utilizing ten SEM images to obtain average grain sizes for the different grain size distributions within each sample. Schematics of each sample illustrating the grain structure of each sample can be seen in Figures 5A, B, F for Co, Fe and Cu dopants, respectively. Micrographs from different sub-sections of these representative cross-section schematics are also included in Figures 5C–E, G–I. The average grain size values can be found in Table 1.
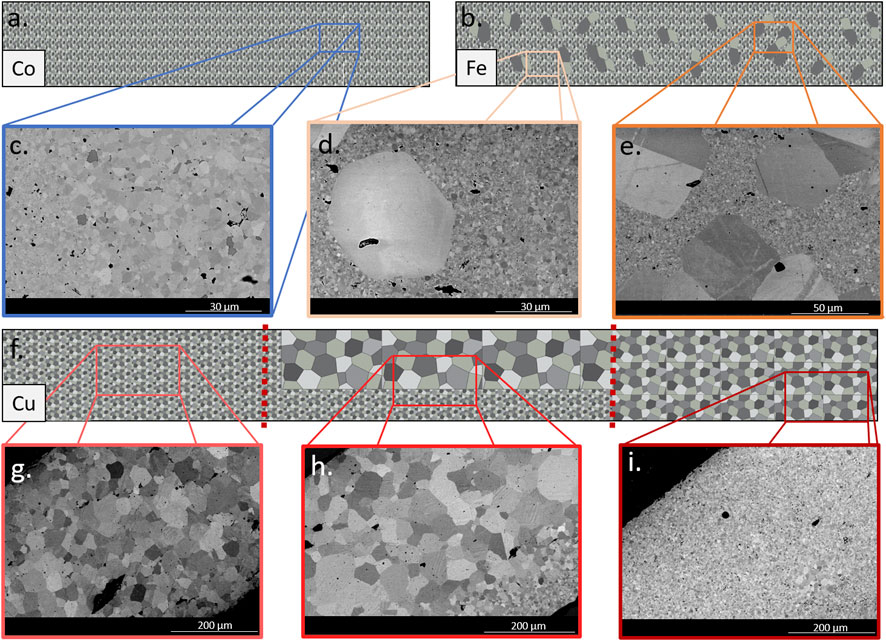
FIGURE 5. Schematics illustrating the grain structure of cross sections of 1.0% Co BTO (A), 1.0% Fe BTO (B) and 1.0% Cu BTO (F) samples. Magnified areas are SEM images from each sample [1.0% Co (C), 1.0% Fe (D,E), and 1.0% Cu (G–I)] showing the grain structure and size distribution along the length of the cross section.
The cross-section of the 1.0% Co sample (Figures 5A, C) had a minor but distinctly bimodal distribution of grains (0.62 ± 0.2 and 2.29 ± 0.3 µm), revealing a population of submicron grains. These two groups of grains were equally distributed throughout the cross-section of the sample, as illustrated in Figure 5A. Next, the 1.0% Fe sample (schematically shown in Figure 5B) also had a bimodal distribution of grains (0.88 ± 0.2 and 49.19 ± 13.5 µm), but here the subset of larger grains were substantially bigger compared to the Co sample. For clarity, it is important to note that the larger grains of this sample were measured individually (measuring 175 grains to obtain the average), while the smaller grains were measured by the linear intercept method. Unlike 1.0% Co BTO, 1.0% Fe BTO had clusters of these large grains surrounded by the smaller, submicron grains, shown in the SEM images in Figures 5D, E, which are representative of what was observed along the entirety of the cross-section. Finally, the 1.0% Cu sample (illustrated in Figure 5F) had three distinct areas along the cross-section (Figures 5G–I) and three different populations of grain sizes (4.73 ± 1.1, 14.35 ± 4.4, and 32.57 ± 3.8 µm). Overall, 1.0% Cu had the largest grains of the three different dopants, albeit not distributed evenly over the cross-section. Upon electron dispersive spectroscopy (EDS) analysis, there was a lack of apparent dopant segregation into grain boundaries or secondary phases in the cross-sections of the doped samples. Undoped BTO sintered under similar conditions have grains averaging approximately 4 µm in diameter, the size of which is very dependent on the sintering temperature and time (Hoshina et al., 2008; Tan et al., 2015; Malyshkina et al., 2020). The choice of dopant itself is likely driving the observed differences in grain sizes between the three samples, since they were sintered intentionally under the same conditions to achieve similar high density (>91%) rather than optimizing the sintering conditions to create a specific grain size. In previous doping studies, for instance, Co has been used to control grain sizes in ceramics to ∼1 µm by inhibiting grain growth, and Cu was added as a sintering aid to encourage grain growth (Cheng et al., 2005; Mahmoudi et al., 2019).
This grain size analysis, then, can potentially inform some of the differences in dielectric properties between the three samples. Although doping should theoretically decrease the Curie temperature, this was not observed in the 1.0% Cu sample. This increase in Tc could then be contributed, in part, to the larger average grain size, as it has been shown that Tc increases as grain size increases (Tewatia et al., 2021). Additionally, although there are larger grains present in 1.0% Fe BTO, the dominant small grains of this sample and that of the 1.0% Co sample could explain the lower Tc, polarization, and strain values when compared to 1.0% Cu BTO. The permittivity values do not follow this trend, as the 1.0% Cu and Fe samples have similar values, while the 1.0% Co BTO possesses the lowest εr. However, since these values are not vastly different (Table 1) and do fall below that of undoped BTO (ranging from 3,000 to 6,000), it may not be a significant indicator of the dependence of this value on either dopant or grain size alone. This analysis, though, does highlight the importance of considering both the defect dipole and grain size effects on dielectric properties. Although some dopants are typically classified as more or less effective than others, such as if a dopant’s valency and/or quantity added should lead to positive enhancements via defect dipole formation, the effect of grain size can outweigh the benefit of the defect dipoles with respect to dielectric properties.
4 Conclusion
In this work, we have studied the dielectric properties of polycrystalline B-site doped BTO with 1.0% copper (Cu), iron (Fe), and cobalt (Co), synthesized using traditional solid-state processing, to observe the contribution of both defect-dipole formation and grain size on the ferroelectric and dielectric properties. 1.0% Cu doped BTO showed the highest polarization and strain (9.3 µC/cm2 and 0.1%, respectively) of the three dopants in and a very clearly pinched hysteresis and recoverable strain behavior in the as-sintered state, with some changes in polarization and strain to all three doped samples after aging or poling. Additionally, 1.0% Cu BTO showed the highest Curie temperature (Tc) (139.4°C). With respect to defect dipole formation, these results suggested that the strong chemical driving force of the Cu atoms to form defect dipoles with charge neutrality induced oxygen vacancies leads to improved polarization and strain. However, since this would not explain the high Tc of the 1.0% Cu; the average grain size and distribution of grain sizes provided insight for this parameter instead. The 1.0% Cu BTO possessed the largest overall grains, which leads to an increased Tc. Grain size cannot be the only contributor to the improvement of properties, though, as the larger grain size would not account for the type of pinching in the polarization loop and increased strain, which we attribute to defect-dipole formation. Overall, this work emphasizes the challenge attributing a singular contribution, such as defect dipole formation via doping or grain size to dielectric properties of polycrystalline, doped BTO. Instead, it is critical to obtain a more comprehensive view of the material as a whole in order to inform causation and conclusions.
Data availability statement
The raw data supporting the conclusion of this article will be made available by the authors, without undue reservation.
Author contributions
SM carried out the majority of the experiments outlined in the manuscript, EP also contributed to the experimental efforts. SM, EP, and MS conceived of the ideas, and SM and MS were in charge of overall planning. SM drafted the manuscript with support from EP and MS. All authors contributed to the article and approved the submitted version.
Funding
This work was supported by the Office of Naval Research through the Naval Research Laboratory’s Basic Research Program.
Conflict of interest
The authors declare that the research was conducted in the absence of any commercial or financial relationships that could be construed as a potential conflict of interest.
Publisher’s note
All claims expressed in this article are solely those of the authors and do not necessarily represent those of their affiliated organizations, or those of the publisher, the editors and the reviewers. Any product that may be evaluated in this article, or claim that may be made by its manufacturer, is not guaranteed or endorsed by the publisher.
Supplementary material
The Supplementary Material for this article can be found online at: https://www.frontiersin.org/articles/10.3389/fchem.2023.1249968/full#supplementary-material
References
Althobaiti, S., Alghamdi, M., Alamri, B., and Madani, A. (2023). Structural and optical investigations of Nd and Cu doped BaTiO3 prepared by solid state reaction. Optik 275, 170534. doi:10.1016/j.ijleo.2023.170534
Buscaglia, M. T., Buscaglia, V., Viviani, M., and Nanni, P. (2001). Atomistic simulation of dopant incorporation in barium titanate. J. Am. Ceram. Soc. 84, 376–384. doi:10.1111/j.1151-2916.2001.tb00665.x
Buscaglia, M. T., Buscaglia, V., Viviani, M., Nanni, P., and Hanuskova, M. (2000). Influence of foreign ions on the crystal structure of BaTiO3. J. Eur. Ceram. Soc. 20 (12), 1997–2007. doi:10.1016/S0955-2219(00)00076-5
Carl, K., and Hardtl, K. H. (1977). Electrical after-effects in Pb(Ti,Zr)O3 ceramics. Ferroelectrics 17, 473–486. doi:10.1080/00150197808236770
Cheng, B. L., Button, T. W., Gabbay, M., Fantozzi, G., and Maglione, M. (2005). Oxygen vacancy relaxation and domain wall hysteresis motion in cobalt-doped barium titanate ceramics. J. Am. Ceram. Soc. 88, 907–911. doi:10.1111/j.1551-2916.2005.00167.x
Dang, N. V., Thanh, T. D., Hong, L. V., Lam, V. D., and Phan, T.-L. (2011). Structural, optical and magnetic properties of polycrystalline BaTi1−x FexO3 ceramics. J. Appl. Phys. 110, 043914. doi:10.1063/1.3625235
Deka, B., Ravi, S., Perumal, A., and Pamu, D. (2014). Ferromagnetism and ferroelectricity in Fe doped BaTiO3. Phys. B Condens. Matter 448, 204–206. doi:10.1016/j.physb.2014.03.069
Eichel, R.-A. (2008). Characterization of defect structure in acceptor-modified piezoelectric ceramics by multifrequency and multipulse electron paramagnetic resonance spectroscopy. J. Am. Ceram. Soc. 91, 691–701. doi:10.1111/j.1551-2916.2008.02303.x
Erhart, P., Eichel, R.-A., Träskelin, P., and Albe, K. (2007). Association of oxygen vacancies with impurity metal ions in lead titanate. Phys. Rev. B 76, 174116. doi:10.1103/PhysRevB.76.174116
Guo, Y. Y., Yan, Z. B., Zhang, N., Cheng, W. W., and Liu, J.-M. (2012). Ferroelectric aging behaviors of BaTi0.995Mn0.005O3 ceramics: Grain size effects. Appl. Phys. A 107, 243–248. doi:10.1007/s00339-011-6750-0
Hoshina, T., Takizawa, K., Li, J., Kasama, T., Kakemoto, H., and Tsurumi, T. (2008). Domain size effect on dielectric properties of barium titanate ceramics. Jpn. J. Appl. Phys. 47, 7607–7611. doi:10.1143/JJAP.47.7607
Huan, Y., Wang, X., Fang, J., and Li, L. (2014). Grain size effect on piezoelectric and ferroelectric properties of BaTiO3 ceramics. J. Eur. Ceram. Soc. 34, 1445–1448. doi:10.1016/j.jeurceramsoc.2013.11.030
Huang, F., Jiang, Z., Lu, X., Ti, R., Wu, H., Kan, Y., et al. (2014). Nonmonotonic variation of aging behavior in Fe-doped BaTiO3 ceramics. Appl. Phys. Lett. 105, 022904. doi:10.1063/1.4890383
Imai, K., Takeno, S., and Nakamura, K. (2002). Effect of Fe doping of thin (Ba,Sr)TiO3 films on increase in dielectric constant. Jpn. J. Appl. Phys. 41, 6060–6064. doi:10.1143/JJAP.41.6060
Kamel, T. M., and de With, G. (2008). Poling of hard ferroelectric PZT ceramics. J. Eur. Ceram. Soc. 28, 1827–1838. doi:10.1016/j.jeurceramsoc.2007.11.023
Krimech, F., and Sayouri, S. (2020). Structure and dielectric behavior of Cu-doped BaTiO3 ceramics. Mater. Today Proc. 30, 909–917. doi:10.1016/j.matpr.2020.04.349
Langhammer, H. T., Böttcher, R., Müller, T., Walther, T., and Ebbinghaus, S. G. (2015). Defect properties of cobalt-doped hexagonal barium titanate ceramics. J. Phys. Condens. Matter 27, 295901. doi:10.1088/0953-8984/27/29/295901
Langhammer, H. T., Müller, T., Böttcher, R., and Abicht, H.-P. (2003). Crystal structure and related properties of copper-doped barium titanate ceramics. Solid State Sci. 5, 965–971. doi:10.1016/S1293-2558(03)00087-6
Langhammer, H. T., Müller, T., Walther, T., Böttcher, R., Hesse, D., Pippel, E., et al. (2016). Ferromagnetic properties of barium titanate ceramics doped with cobalt, iron, and nickel. J. Mater. Sci. 51, 10429–10441. doi:10.1007/s10853-016-0263-3
Langhammer, H. T., Walther, T., Böttcher, R., and Ebbinghaus, S. G. (2020). On the incorporation of iron into hexagonal barium titanate: II. Magnetic moment, electron paramagnetic resonance (EPR) and optical transmission. J. Phys. Condens. Matter 32, 385702. doi:10.1088/1361-648X/ab9345
Mahmoudi, P., Nemati, A., and Maleki Shahraki, M. (2019). Grain growth kinetics and electrical properties of CuO doped SnO2-based varistors. J. Alloys Compd. 770, 784–791. doi:10.1016/j.jallcom.2018.08.201
Maier, R. A., Pomorski, T. A., Lenahan, P. M., and Randall, C. A. (2015). Acceptor-oxygen vacancy defect dipoles and fully coordinated defect centers in a ferroelectric perovskite lattice: Electron paramagnetic resonance analysis of Mn2+ in single crystal BaTiO3. J. Appl. Phys. 118, 164102. doi:10.1063/1.4934505
Malyshkina, O. V., Shishkov, G. S., Martyanov, A. A., and Ivanova, A. I. (2020). Effect of sintering temperature on dielectric properties of barium titanate ceramics and composite. Mod. Electron. Mater. 6, 141–146. doi:10.3897/j.moem.6.4.65576
Patterson, E. A., Finkel, P., Cain, M. G., Thompson, P., Lucas, C., and Staruch, M. (2023). Rejuvenation of giant electrostrain in doped barium titanate single crystals. Apl. Mater 11, 041109. doi:10.1063/5.0142103
Rani, A., Kolte, J., Vadla, S. S., and Gopalan, P. (2016). Structural, electrical, magnetic and magnetoelectric properties of Fe doped BaTiO3 ceramics. Ceram. Int. 42, 8010–8016. doi:10.1016/j.ceramint.2016.01.205
Ren, X. (2004). Large electric-field-induced strain in ferroelectric crystals by point-defect-mediated reversible domain switching. Nat. Mater. 3, 91–94. doi:10.1038/nmat1051
Schie, M., Waser, R., and De Souza, R. A. (2014). A simulation study of oxygen-vacancy behavior in strontium titanate: Beyond nearest-neighbor interactions. J. Phys. Chem. C 118, 15185–15192. doi:10.1021/jp504436t
Shannon, R. D. (1976). Revised effective ionic radii and systematic studies of interatomic distances in halides and chalcogenides. Acta Cryst. 32, 751–767. doi:10.1107/S0567739476001551
Tan, Y., Zhang, J., Wu, Y., Wang, C., Koval, V., Shi, B., et al. (2015). Unfolding grain size effects in barium titanate ferroelectric ceramics. Sci. Rep. 5, 9953. doi:10.1038/srep09953
Tewatia, K., Sharma, A., Sharma, M., and Kumar, A. (2021). Factors affecting morphological and electrical properties of barium titanate: A brief review. Mater. Today Proc. 44, 4548–4556. doi:10.1016/j.matpr.2020.10.813
Vani, K., and Kumar, V. (2012). Influence of defect mobility on electrostrain in acceptor-doped Ba0.80Sr0.20TiO3. AIP Adv. 2, 042177. doi:10.1063/1.4770325
Wang, Y., Liu, X., Burton, J. D., Jaswal, S. S., and Tsymbal, E. Y. (2012). Ferroelectric instability under screened coulomb interactions. Phys. Rev. Lett. 109, 247601. doi:10.1103/PhysRevLett.109.247601
Zhao, D., Lenz, T., Gelinck, G. H., Groen, P., Damjanovic, D., de Leeuw, D. M., et al. (2019). Depolarization of multidomain ferroelectric materials. Nat. Commun. 10, 2547. doi:10.1038/s41467-019-10530-4
Keywords: barium titanate, doping, ferroelectric, grain size, ceramic processing
Citation: Mills SC, Patterson EA and Staruch ML (2023) Effect of sub-micron grains and defect-dipole interactions on dielectric properties of iron, cobalt, and copper doped barium titanate ceramics. Front. Chem. 11:1249968. doi: 10.3389/fchem.2023.1249968
Received: 29 June 2023; Accepted: 28 August 2023;
Published: 14 September 2023.
Edited by:
Tao Wei, University of Erlangen Nuremberg, GermanyReviewed by:
Lakshmi Narayanan Mosur Saravana Murthy, Intel, United StatesSubodh G., University of Kerala, India
Peiwen Lv, Chinese Academy of Sciences (CAS), China
Copyright © 2023 Mills, Patterson and Staruch. This is an open-access article distributed under the terms of the Creative Commons Attribution License (CC BY). The use, distribution or reproduction in other forums is permitted, provided the original author(s) and the copyright owner(s) are credited and that the original publication in this journal is cited, in accordance with accepted academic practice. No use, distribution or reproduction is permitted which does not comply with these terms.
*Correspondence: Sara C. Mills, sara.mills@nrl.navy.mil
 Sara C. Mills