
95% of researchers rate our articles as excellent or good
Learn more about the work of our research integrity team to safeguard the quality of each article we publish.
Find out more
ORIGINAL RESEARCH article
Front. Chem. , 22 June 2023
Sec. Photocatalysis and Photochemistry
Volume 11 - 2023 | https://doi.org/10.3389/fchem.2023.1197961
This article is part of the Research Topic Semiconducting Materials for Photoelectrochemical Water Splitting View all 4 articles
 Krishnaprasanth Alageshwaramoorthy1
 Pandian Mannu2
 Seetha Mahalingam1*
 Ta Thi Thuy Nga2Han-Wei Chang3,4Yoshitake Masuda5
 Chung-Li Dong2*
In this work, the novel CuTa2O6 phase was successfully synthesized by the hydrothermal and followed by the calcination process. The X-ray diffraction pattern confirms the formation of different phases. At a low temperature, CuTa2O6 exhibits the orthorhombic phase, whereas, at a higher temperature, it underwent a phase transition to a cubic crystal structure. X-ray photoelectron spectroscopic results suggest the presence of all the elements (Cu, Ta, and O). The optical studies were carried out using a UV-Vis DRS spectrophotometer. FESEM images confirm the spherical-shaped particles for the sample annealed at a high temperature. The local atomic and electronic structures around Cu and the contribution of the Cu oxidation state in the CuTa2O6 system were determined by X-ray absorption spectroscopy. To investigate the effective usage of CuTa2O6 in treating wastewater, its photocatalytic activity was investigated by evaluating its use in the photodegradation of MO dye under visible light irradiation. Moreover, the prepared CuTa2O6 photocatalyst exhibits significant photocatalytic activity in the degradation of MO dye and shows excellent stability; it is therefore a promising material for potential use in a practical photocatalyst. The CuTa2O6 photocatalyst suggests an alternative avenue of research into effective photo-catalysts for solar hydrogen water splitting.
Rapid population and industrial growth have made the environment a serious problem globally. Clean water is important for global and economic development, and the agricultural, industrial, and domestic sectors require huge quantities of unpolluted water. Over the last few decades, polluted water has caused major problems, especially for aquatic organisms, animal ecosystems, and humans (Gheytanzadeh et al., 2022). Notably, the dyes from textile, leather, fabric, paper, cosmetics, pulp, food, dye synthesis, plastics, and pharmaceuticals generate wastewater that emerges as threatening pollutants to the environment (Oyewo et al., 2022). Just a few layers of dye on the surface of the water blocks sunlight and disturb the photosynthesis of aquatic species below (Abdelrahman et al., 2019). Primary techniques such as coagulation, filtration, reverse osmosis, and flocculation can be used to remove dye from wastewater. Instead of degrading the pollutants; these techniques simply convert the pollutants from one form to another, causing secondary pollution (Ajmal et al., 2014). Therefore, many methods have been employed for wastewater treatment such as chlorination, flocculation, ozonation, adsorption, photocatalysis, chemical oxidation, and biodegradation (Hodges et al., 2018; Yang et al., 2020; Sahoo et al., 2022). Among, advanced oxidation processes (AOPs) such as H2O2/UV processes, and photodegradation are commonly used for clean energy and biodegradable catalysts for the removal of pollutants. Additionally, the photocatalyst includes the whole mineralization of organic pollutants into carbon dioxide and water without any harmful by-products is being as the most promising technique (Yang et al., 2020) (Sahoo et al., 2022).
Heterogeneous photocatalysis using semiconductors is a broad field that involves dye photodegradation from wastewater (Majhi et al., 2021; Louis et al., 2022). TiO2 is a well-known photocatalyst whose crystalline structure can be modified to increase its photocatalytic activity in water treatment. However, the large bandgap of anatase TiO2 (3.2 eV) limits its efficiency under solar light: it uses only 4% of the total solar spectrum (Rose et al., 2022). Therefore, a more efficient, chemically stable photocatalyst that is active in the visible light region must be developed. Various semiconductors like ZnO, Bi2O3, and SnO2, as well as also metal-chalcogenides like Cds, CdSe, CdTe, and Pbs have been investigated for this purpose (Djurišić et al., 2014; Ramchiary, 2020; Li et al., 2023). Several strategies have been used to improve their photocatalytic activity, doping or coupling of low bandgap semiconductors with suitable materials can effectively improve photocatalytic activity under visible light (Zhang et al., 2006; Zhou et al., 2009; Xu et al., 2012a). It is well known that copper-based metal oxides are p-type semiconductors, commonly used in solar energy applications owing to their narrow band gap of ∼ 1.2 eV. Compared to other regularly used p-type materials like NiO, it exhibits higher charge carrier motilities (100 cm2v−1s-1) while NiO has (0.53 cm2v−1s-1). They are more stable in aqueous media than Group III-V or II-VI semiconductors (Sullivan et al., 2016). The narrow band gap and good stability of copper make it suitable for photocatalytic applications (Sibhatu et al., 2022).
On the other hand, great interest has been shown in the photocatalytic activity of Tantalum-based materials that include Ta2O5, TaON, and Ta3N5 (Zhang et al., 2014; Suzuki et al., 2017; Gomes et al., 2018). Apart from these materials, transition metal tantalates and antimonates (general formula M′M″ 2O6, where: M′ = Cu/Zn, and M′′ = Ta/Sb) emerging in various research due to their excellent magnetic, electrical, optical, thermoluminescence and more importantly the catalytic properties (Nguyen et al., 1996; Kato et al., 2002; Dutta et al., 2013; Noto et al., 2013). These composites represent an important group of semiconductors, characterized by high thermal stability (above 1,000 °C) and ease of modification of their physicochemical properties. Therefore, among these materials, CuTa2O6 has been a promising candidate in fundamental research and numerous applications (Nguyen et al., 1996; Kato et al., 2002; Dutta et al., 2013; Noto et al., 2013). Available literature suggests that the CuTa2O6 compound is formed in the binary system of CuO-Ta2O5 oxides (Golubev et al., 2017). Moreover, CuTa2O6 also occurs in two polymorphic varieties which include monoclinic and tetragonal (Krabbes and Langbein, 1996). Some authors reported that there is an orthorhombic variety of this CuTa2O6 compound as well (Vincent et al., 1978). Even though many studies have been carried out on CuTa2O6 that include high dielectrics, exceptional photoelectric performance, and chemical stability, there are only limited investigations done on the photocatalytic properties of CuTa2O6.
This work demonstrates the fundamental parameters involved in the photocatalytic activity of copper tantalite, which can be used as a water-splitting material due to its promising properties. To the best of the authors’ knowledge, photodegradation of MO dye under visible light irradiation on the CuTa2O6 phase has not been previously investigated. Thus, a novel CuTa2O6-based photocatalyst is prepared by a hydrothermal and calcination process, and its photocatalytic performance under visible light irradiation is studied.
All of the chemical reagents including copper nitrate trihydrate (Cu (NO3).3H2O) and tantalum chloride (TaCl5), were purchased from Sigma Aldrich (United States) and used without further purification. De-ionized water was used as a solvent throughout the experiment and ethanol was used to wash the prepared photocatalyst. Methyl orange (MO) dye was purchased from Merck and used as a model pollutant.
In a typical synthesis procedure, an equal amount (0.1M) of tantalum chloride and copper nitrate trihydrate was dissolved in 30 mL of de-ionized water, which was then stirred continuously at room temperature to yield a homogeneous solution. Then, this solution was transferred to a 50 mL Teflon-lined beaker and kept in a stainless-steel autoclave at 180°C for 8 h. After attaining room temperature, the obtained product was washed several times with de-ionized water and ethanol followed by drying at 80°C for an hour. The dried powder was collected and annealed at 500°C, 700°C, and 900°C.
The crystal structure and the phase purity of the prepared samples were confirmed by X-ray diffraction (Shimadzu 6,000) with Cu-Kα radiation, λ = 1.5406 Å. The surface morphology was analyzed using a field emission scanning electron microscope (FESEM model—CARLZEISS SIGMA HV). The chemical composition analysis was studied by Thermo Scientific K-Alpha X-ray Photoelectron Spectroscopy (using ESCA-3400 XPS from Kratos Analytical, Shimazu). The optical band gap was estimated from UV-Vis diffused reflectance spectra using the JASCO V-670 double-beam spectrophotometer model. Synchrotron X-ray absorption spectra (Cu K-edge), including X-ray absorption near edge structure (XANES) and extended X-ray absorption fine structure (EXAFS) spectra, were obtained at BL17C of the National Synchrotron Radiation Research Center (NSRRC), Taiwan. The specific surface area was calculated from N2 adsorption-desorption isotherms measured using the ANTON PAAR NOVATOUCH LX2 (Graz, Austria), using the Brunauer–Emmett–Teller (BET) equation.
The photodegradation of MO dye was examined in the presence of the prepared CuTa2O6 photocatalyst. In a typical experiment, 50 mg of the photocatalyst was added to 100 mL of aqueous MO with an initial concentration of 10 mg/L. Before irradiation, the mixture was continuously stirred at room temperature in the dark for 30 min to achieve an adsorption/desorption equilibrium. Then, the mixed solution was irradiated with visible light using a 75 W high-pressure mercury vapor lamp. During the irradiation, about 2 mL of the suspension was taken at regular intervals (10 min) and analyzed using the UV-Vis spectrophotometer to determine the concentration of MO dye; the characteristic absorption of MO was about 464 nm (Mageshwari et al., 2013).
Figure 1 shows XRD patterns of the prepared CuTa2O6 at different annealing temperatures. The diffraction peak reveals the polycrystalline nature of the prepared CuTa2O6 phase. The sample annealed at 500°C exhibits the orthorhombic phase of CuTa2O6 and agrees with JCPDS card no: 87–0,357. Then, increasing the annealing temperature to 700°C led to the formation of a different phase. The observed diffraction peaks are associated with the cubic phase of CuTa2O6, which agrees with JCPDS card 70–0,611. Further increase in the annealing temperature to 900°C did not modify the phase formation. Therefore, increasing the annealing temperature significantly affects the phase formation of CuTa2O6. The intensity of the diffraction peaks is higher, and the full width at half maximum (FWHM) is also slightly increased with an increase in the annealing temperature. The average crystallite size was calculated using the Debye-Scherer formula D =
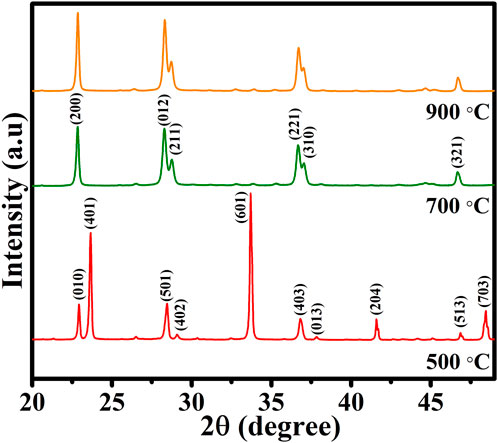
FIGURE 1. XRD patterns of CuTa2O6 annealed at different temperatures (500°C, 700°C, and 900°C).
The difference in the XRD peak width is small between 700°C and 900°C. However, the actual variation is shown in Supplementary Figure S1 (supporting information), which evidences the increased value for full width at half maximum (FWHM). The intensity of the diffraction peaks and the FWHM) also increased as the temperature increased. The higher the FWHM, the smaller the crystallite according to the Debye-Scherer formula. Therefore, the calculated average crystallite size is found to be 32.28 nm, 29.79 nm, and 28.13 nm for the samples that were annealed at 500°C, 700°C, and 900°C respectively. An increase in the annealing temperature reduces the crystallite size, this could be due to the higher annealing temperature which might produce a relatively large temperature gradient within the submicrosheres, resulting in the formation of solid/liquid biphase core-shell structures through the non-equilibrium heating process (Tao et al., 2013). As heterogeneous nucleation only needs a low activation energy, the co-existence of heterogeneous phases can be helpful for the crystalline nucleation of CuTa2O6. Also, it is believed that the more generated nuclei, the smaller the crystallite size.
Figure 2A displays the nearly spherical shaped structure and uniform in size for the sample annealed at 500°C. It seems an increase in the annealing temperature to 700°C lead to agglomeration of these particles, as shown in Figure 2B. Further increase in the annealing temperature (900°C) produces more agglomerated spherical-shaped particles with irregular distribution throughout the surface. As a result of the higher temperature, irregular particle shapes are fused via adhesion.
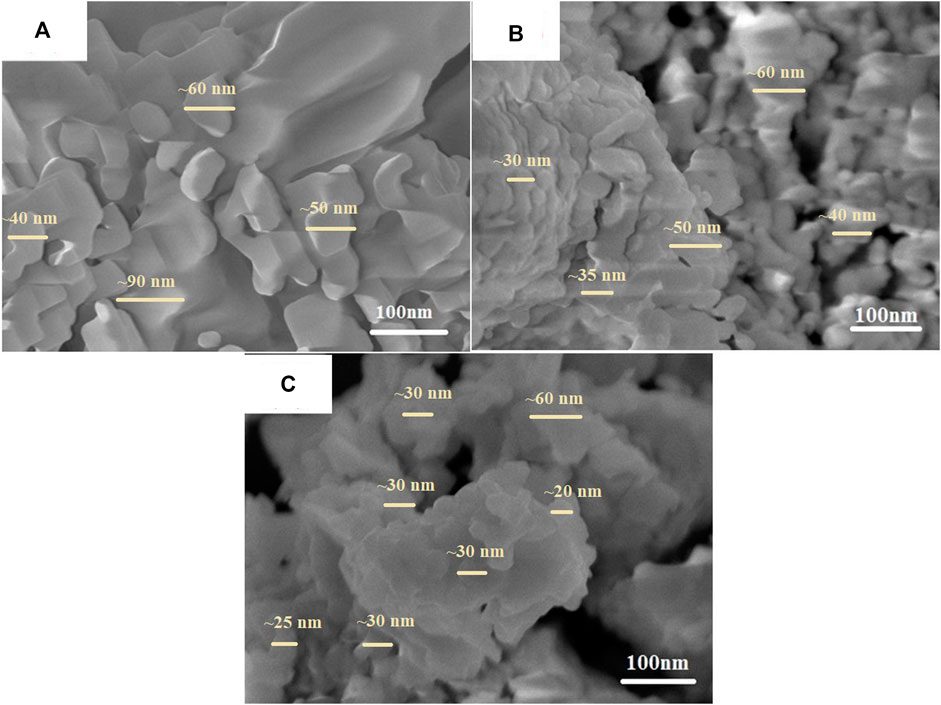
FIGURE 2. FESEM images of CuTa2O6 samples annealed at (A) 500°C, (B) 700°C, and (C) 900°C.
Similar to the estimated average crystallite size from the XRD results, the particle is also assumed to be smaller in the sample annealed at 900°C as the particles may be composed of an agglomeration of many crystallites (as marked in Figure 2), which results in the formation of irregular and deformed particle shapes at higher annealing temperatures. Consequently, the smaller the crystallite size, the smaller the particle size. From Figures 2A–C, it seems the grains are dissimilar in different regions. Therefore, the particle size is likely to be different among the samples annealed at 500°C, 700°C, and 900°C as pointed out in Figure 2. For more evidence, the estimated average grain size is about 70 nm for a 500°C annealed sample. Then, it seems the average grain size gets reduced to ∼40 nm at 900°C and is smaller than the sample annealed at 700°C (∼50 nm). This implies that these particles/grains observed in the SEM image are composed of many crystallites/grains. Further, it is believed that the SEM image of the sample annealed at 900°C has composed of small size particles/grains than the other annealed samples.
The elemental composition and valence state of the prepared samples were determined by the XPS technique. Figure 3 shows the recorded XPS data of the sample that was annealed at 900°C. The peak features a, b, and c are deconvoluted from the recorded C 1s spectra as shown in Figure 3A. The characteristic feature at 284.6 eV is sp2-hybridized carbon (C-C) that was adsorbed on the surface of the prepared sample (Khalid et al., 2013). Additionally, peaks at 286.2 eV, and 288.1 eV are related to the hydroxyl carbon (C-O), and carboxyl carbon (O=C-O), respectively (Liang et al., 2017). The measured O 1s spectra were deconvoluted into three peaks (Features d, e, and f), as shown in Figure 3B. The presence of various oxygen ions in CuTa2O6 with potentially different coordination environments (more Cu-coordinated or more Ta-coordinated), accounts for the deconvolution of the O 1s signals into multiple components. A peak at 529.6 eV (feature d) could be related to the CuO lattice oxygen peak as the binding energy of the lattice oxygen for the bulk samples was frequently found to be slightly higher than that for the nanostructures (Svintsitskiy et al., 2013). Furthermore, the peaks at 530.6 eV and 531.7 eV (features e and f) are associated with Ta−O and Ta=O, respectively. This main peak (feature f) could be attributed to the bulk oxygen ions affected by charge imbalance due to the presence of oxygen vacancy. An additional shoulder peak at 533.0 eV (feature g) is attributed to an oxygen species that is coupled to hydroxyl or hydrated molecules. Consequently, the prepared CuTa2O6 phases may contain O-H groups (Chennakesavulu and Ramajaneya Reddy, 2015). The high-resolution pattern of Cu 2p as displayed in Figure 3C exhibits the characteristic peaks at 934.2 eV (a1 feature) and 954.1 eV (c1 feature) that correspond to Cu 2p3/2 and Cu 2p1/2, respectively, confirming the presence of Cu2+. The two other peaks at 943.1 eV (b1 feature) and 962.3 eV (d1 feature) are identified as shake-up satellite peaks of Cu 2p3/2 and Cu 2p1/2 respectively. The shake-up peaks may have arisen from an unfilled Cu 3d9 shell, suggesting the presence of Cu2O and Cu2+ in the prepared sample (Chennakesavulu and Ramajaneya Reddy, 2015) (Muthu Gnana Theresa Nathana et al., 2018). Figure 3D shows two peaks of Ta 4f7/2 (a2 feature) and Ta 4f5/2 (b2 feature) at 28.2 eV and 29.5 eV indicate the presence of tantalum in the Ta5+ oxidation state (Wang et al., 2012).
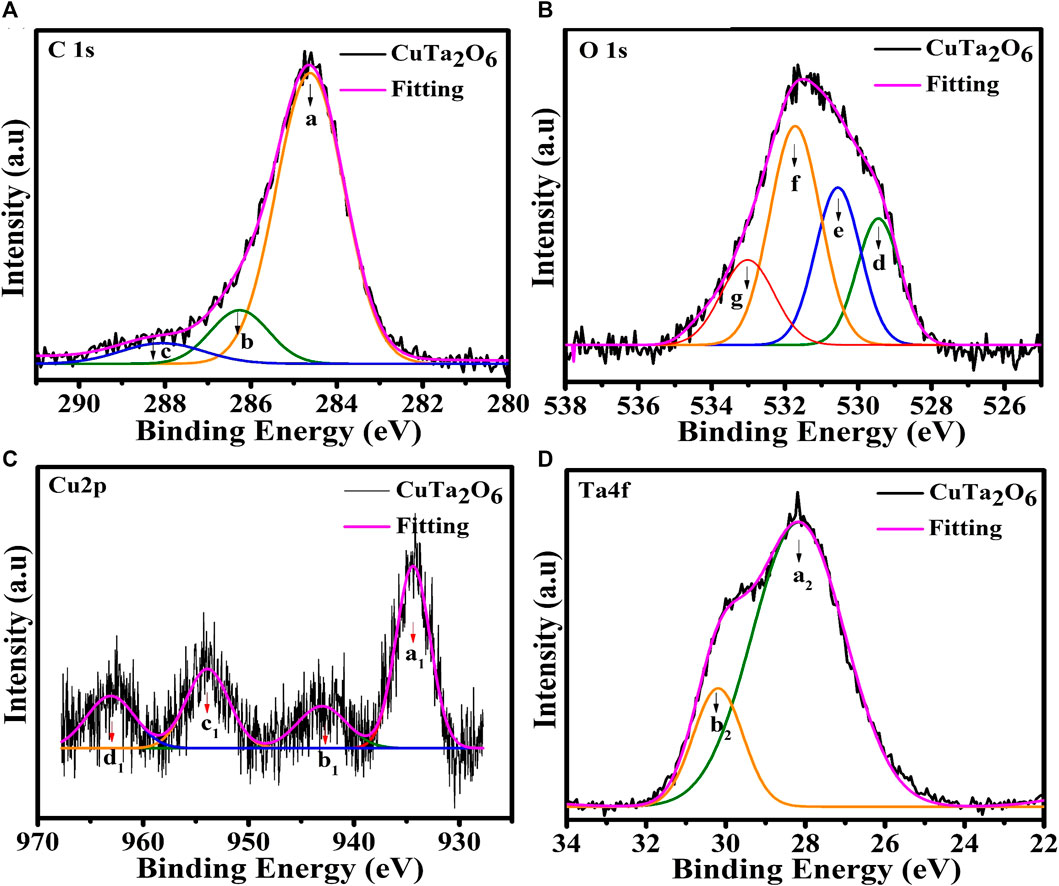
FIGURE 3. XPS analysis of CuTa2O6 annealed at 900°C (A) C 1s, (B) O 1s, (C) Cu2p, and (D) Ta4f.
Figure 4A compares the Cu K-edge XANES spectra of the 500°C-, 700°C-, and 900°C-annealed CuTa2O6 phase with those of CuO (+1 oxidation state) and Cu2O (+2 oxidation state) references. The rising-edge peak at ∼8,980 eV for Cu2O reveals the oxidation state of Cu1+ (Kau et al., 1987). The absence of a pre-edge peak appears in the Cu K-edge XANES spectra is consistent with previous reports (Bera et al., 2002) (Khemthong et al., 2013). The main absorption peak around ∼9,000 eV reveals the 1s-4p transition, which merges into the continuum states (Khemthong et al., 2013). A shoulder peak (feature A) in the energy range 8,985–8,990 eV is attributed to the 1s → 4pz transition (shakedown). The energy shift of this feature (feature A) from Cu2O to CuO is about 4.34 eV suggesting the valence state change from Cu1+ to Cu2+. The Cu K-edge spectra of CuTa2O6 have two regions that include a shoulder peak and a main absorption peak (feature A and feature B). It seems the peak feature (feature A) of all the annealed CuTa2O6 is close to that of CuO, revealing the oxidation state of Cu2+ (Kau et al., 1987) (Lim et al., 2019). Then, the main absorption peak (feature B) of annealed at 500°C is also similar to those CuO reference samples again confirming the oxidation state of Cu2+. However, the main absorption peak (feature B) of annealed 900°C shows a higher intensity compared to the annealed 700 °C suggesting the existence of more oxidation state of Cu2+. Also, this main absorption peak of located at a higher energy than the sample that was annealed at 500°C (feature B) so it is believed to have a more oxidation state.
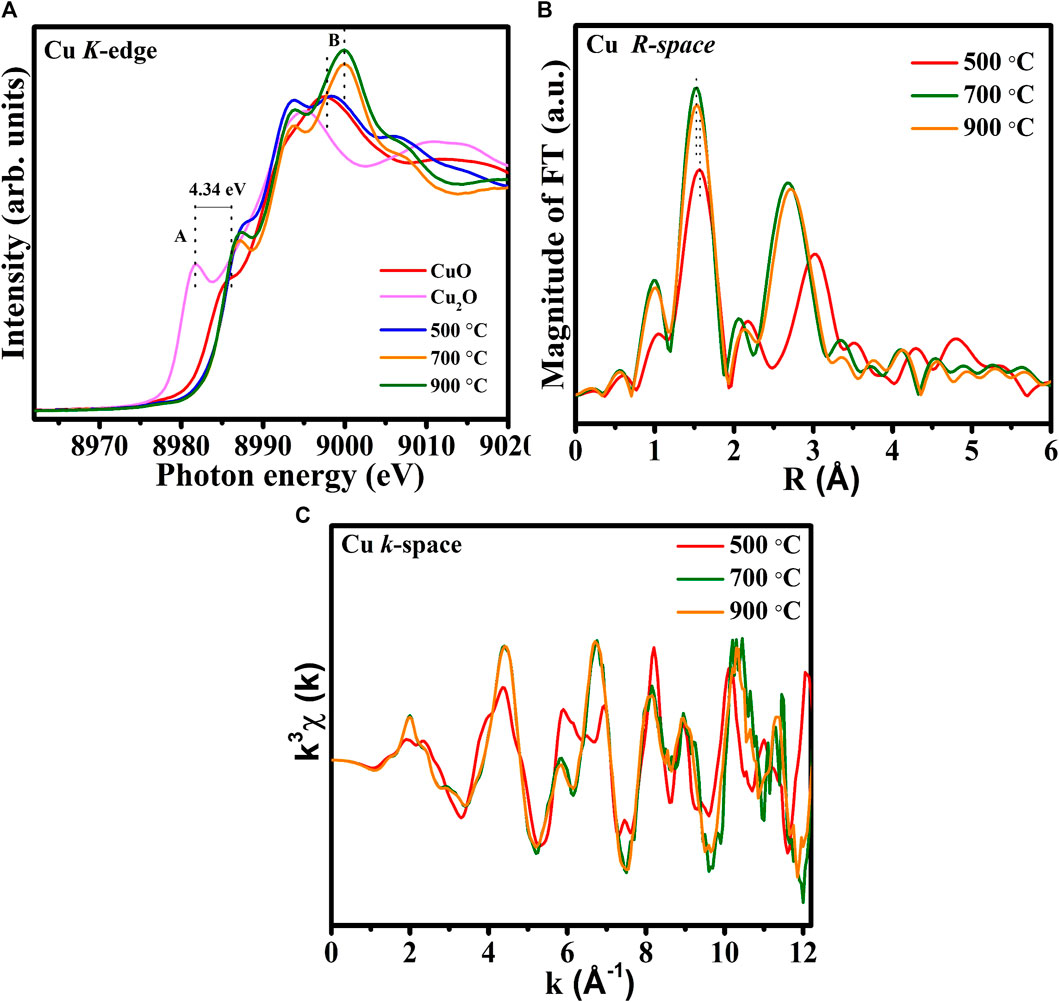
FIGURE 4. (A) Normalized Cu K-edge spectra of CuTa2O6 annealed at 500°C, 700°C, and 900°C, (B) corresponding Fourier-transformed EXAFS spectra, (C) EXAFS oscillations with k3-weighted χ(K) functions.
To determine variations in the local atomic environment around Cu in the CuTa2O6 catalysts, the Fourier-transformed k3-weighted Cu K-edge spectra were obtained, as shown in Figure 4B. From the 500°C-annealed CuTa2O6, the major peaks at 1.56 Å and 3.01 Å correspond to Cu-O and Cu-Cu bonds, respectively (Nasir et al., 2017). The slight contraction in Cu-O bond length and the <comment > shortening in Cu-Cu/Ta bond at </comment>900°C indicates the presence of more oxygen vacancies and cationic vacancies. Commonly, the contracted bond lengths are associated with an increase in the oxidation state. Therefore, the slight contraction in the Cu-O bond at 900°C compared to the 500°C, is also accompanied by the increased oxidation state of Cu. This contraction in the Cu-O bond also suggests the higher coordination number in Cu-O first shell. It is believed that this contraction in Cu-O bond length could be due to the strong interfacial interaction among the Cu-O-Ta materials. It is assumed that the oxidation state of Ta is also to be different in these samples. Particularly, an increase in annealing temperature might lead to an alteration in the valence state of the absorbing atoms in the sample annealed at 900°C. This considerable variation in the coordination of Cu-O and Cu-Cu/Ta suggests the phase transformation of CuTa2O6, as evident from the structural analysis. The FT-EXAFS oscillations of the CuTa2O6 catalysts exhibit different profiles specifically for sample annealed at 500°C, suggesting dissimilar coordination environments of the Cu-O sites as presented in CuTa2O6 in Figure 4C.
The UV-Vis DRS of the prepared CuTa2O6 phase was analyzed and is shown in Figure 5. All the prepared samples present a broad absorption range in the visible light region. The redshift that was observed with an increase in annealing temperature suggests that annealing increases sensitivity to visible light. The bandgap energy (Eg) of each prepared catalyst was estimated using the relation Eg = 1,240/λg (eV), where λg is the absorption edge, which was obtained from the intercept between the tangent of the absorption curve and the abscissa. The estimated band gap energy of the samples that were annealed at 500°C, 700°C, and 900°C corresponds to 3.85 eV, 3.66 eV, and 3.26 eV, respectively. A decrease in the bandgap energy is observed for the sample annealed at a higher temperature (900°C). This could be attributed to the transition of the band from Cu 3d+ O 2p orbital to Ta 5d orbital as Cu 3d10 state may contribute to the valence band of the semiconductor, as similar behavior also reported on the materials such as metal oxides and sulfide photocatalysts (Xu et al., 2012b).
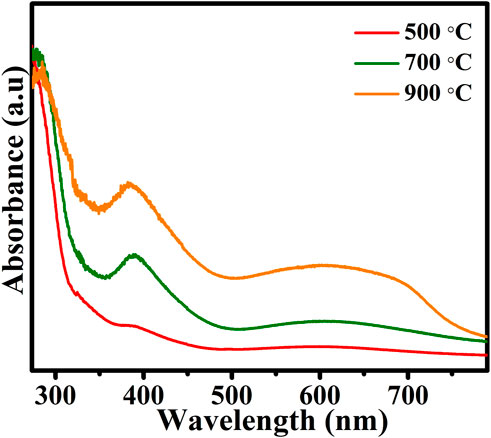
FIGURE 5. UV-Vis DRS analysis of CuTa2O6 annealed at different temperatures.
Methyl orange dye was used as a model pollutant. The UV-Vis DRS analysis demonstrated that the prepared CuTa2O6 phase was active in the visible region. The photocatalytic process was carried out under visible light irradiation. Figure 6 shows the time-dependent UV-Vis absorption spectra of MO dye solution without and with the addition of H2O2 for the samples annealed at different temperatures (a) 500°C, (b) 700°C, and (c) 900°C. The UV-Vis DRS spectra of the MO dye solution show a characteristic peak at 464 nm. From Figure 6; Figure 7, the intensity of this characteristic peak gets decreases as the duration of exposure to light increases. At 90 min of exposure, the intensity of the peak was significantly reduced in comparison with 0 min, and the aqueous solution was colorless, indicating the decomposition of the dye molecules. The continuous disappearance of the absorption band suggests that the functional group of the MO dye is broken down (Xu et al., 2012b).
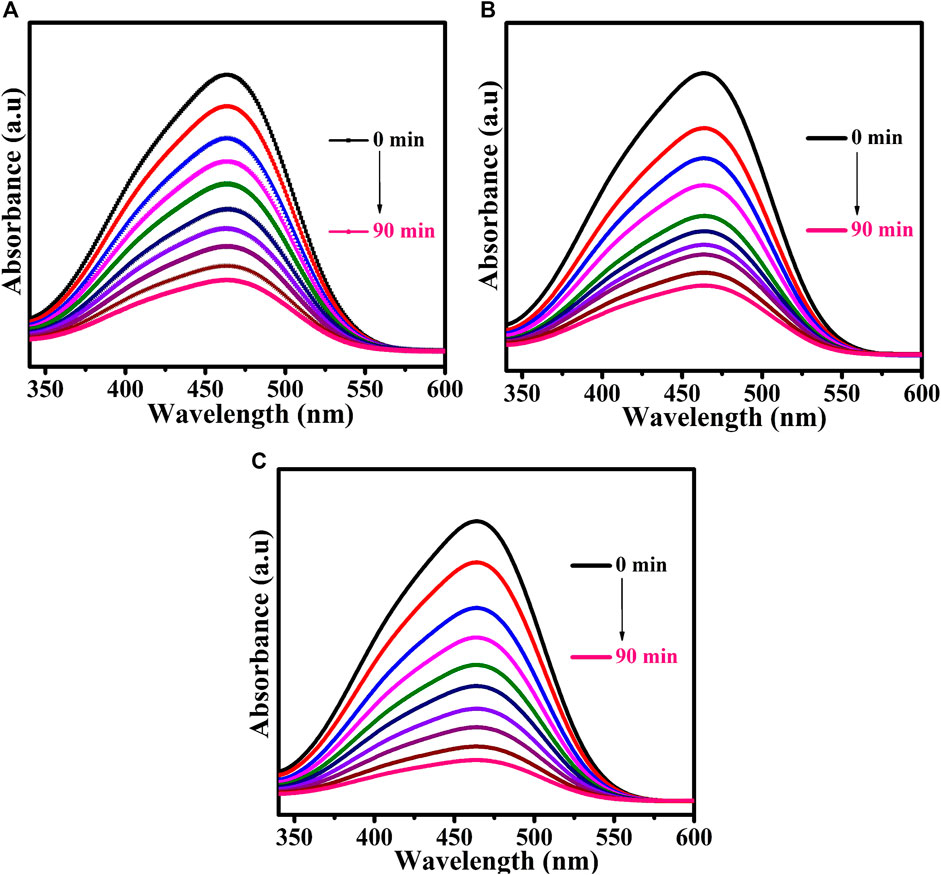
FIGURE 6. Time-dependent UV-Vis absorption spectra of MO dye solution without the addition of H2O2 for samples annealed at (A) 500°C, (B) 700°C, and (C) 900°(C).
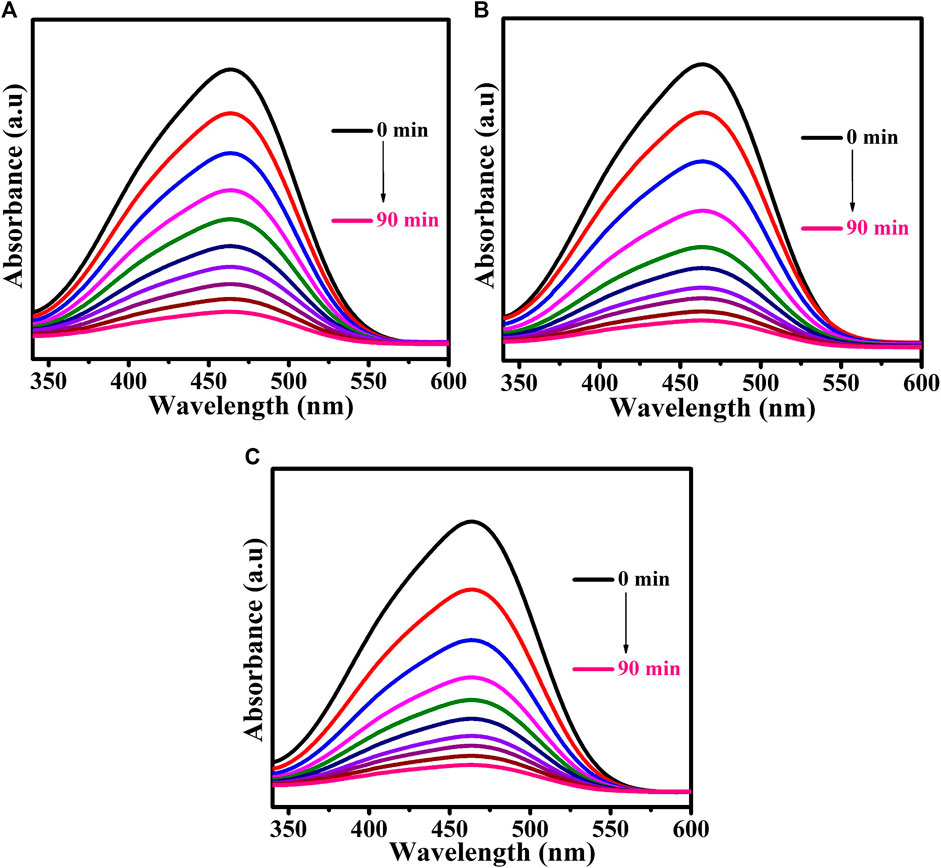
FIGURE 7. Time-dependent UV-Vis absorption spectra of MO dye solution for samples annealed at (A) 500°C, (B) 700°C, and (C) 900°C following the addition of H2O2.
Figure 8A displays the estimated degradation efficiency of MO dye in the absence of H2O2. The percentage degradation efficiency was calculated as,
where C0 is the initial concentration of MO dye and C is the concentration of the dye following irradiation for time t. The graph in Figure 8A displays the degradation efficiencies of the samples annealed at 500°C, 700°C, and 900°C were found to 70.4%, 74.37%, and 81.3%, respectively. The sample annealed at 900°C shows the highest degradation efficiency revealing its superior photocatalytic activity. The increase in photodegradation efficiency can be attributed to a decrease in crystallite size, as agrees with the XRD results. Crystallite shrinkage increases the surface area-to-volume ratio of the catalyst, increasing the number of reactive sites and surface hydroxyl groups (Li et al., 2011). A large surface-area-to-volume ratio favors the reaction/interaction between the photocatalyst and the dye molecules, resulting in higher degradation efficiency. XRD results evidences that the samples annealed at 700°C and 900°C have similar phase structures and crystallinities. However, the sample annealed at 900°C exhibit a better photocatalytic performance whoci could be due to the existence of smaller crystallite size and more surface defects in materials. Smaller crystallite size corresponds to a larger total number of atoms with unsaturated coordinates on the surface, and these atoms have significantly improved photocatalytic activity. Additionally, the recombination of electrons and holes decreases as the crystallite size reduces, and thus the generated electrons and holes are transferred readily to the surface of the catalyst, favoring the process (Mageshwari et al., 2013).
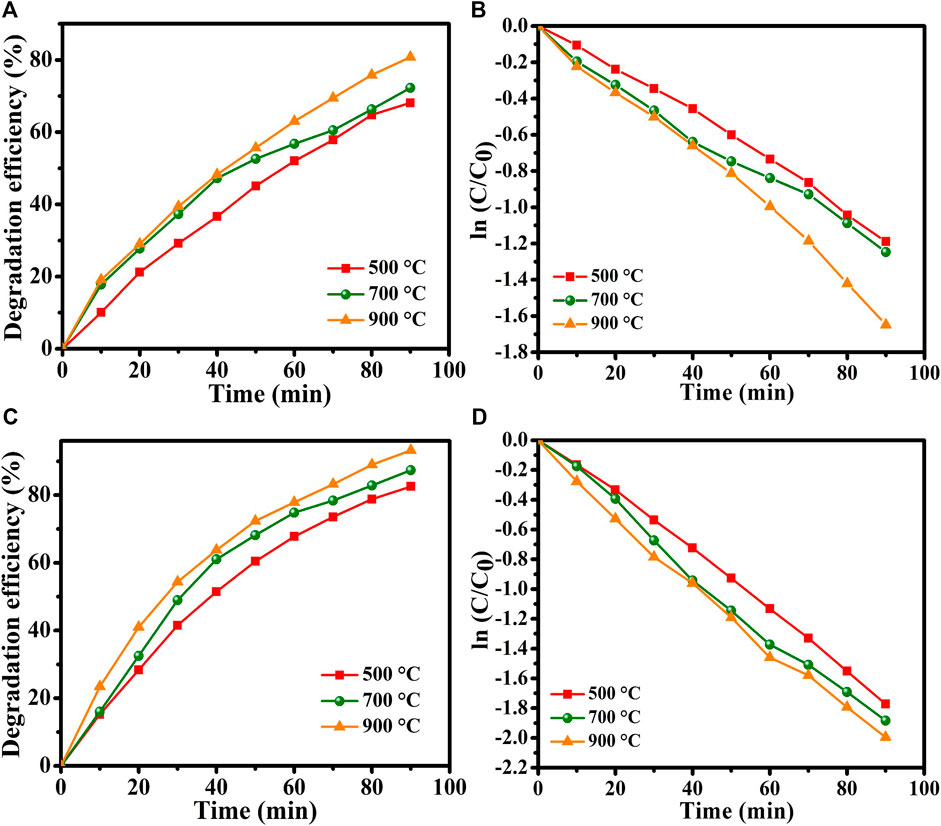
FIGURE 8. (A) Degradation efficiency of MO dye without H2O2, (B) photodegradation rate. (C) Degradation efficiency of MO dye with H2O2, (D) photodegradation rate.
To examine the surface area and porous structure of the prepared CuTa2O6 samples, BET surface analysis was carried out using nitrogen isothermal adsorption-desorption. Supplementary Figures S2A–C displays the isotherm curves of CuTa2O6 at different annealed temperatures along with the estimated pore-size distribution using the BJH method (Supplementary Figures S2D–F). The calculated specific surface area and BJH desorption Pore volume are presented in Supplementary Table S1. Generally, the surface area to volume ratio of nanomaterial plays a substantial role in influencing the material’s properties (Xia et al., 2012). When the particle size decreases, there is an enhancement in the surface area-to-volume ratio (Liu et al., 2015). Consequently, the sample annealed at 900°C shows a higher BET surface area (10.96 m2/g) than the other samples (9.07 m2/g for 500°C and 7.56 m2/g for 700°C), indicating a greater number of existing active sites. We, therefore, believe that the large specific surface area benefits better access and diffusion of liquid and gaseous reactants, which is beneficial for photocatalytic reactivity. The increased pore size distribution in the BJH desorption process is also likely to improve the photocatalytic performance of the materials (Supplementary Figures S2D–F).
The kinetics of the process importantly affect the rate at which pollution is removed. The kinetics of photocatalysis were determined from experimental data using the Langmuir—Hinshelwood model.
Here, Kr is the degradation rate constant and t is the degradation time. The degradation rate constant Kr is calculated from the slope of the kinetic plot of the natural logarithm of the concentration ratio ln (C/C0) versus the irradiation time t in minutes. Figure 8B plots this curve for MO dye in the absence of H2O2. The concentration ratio varies linearly with time suggest that the photodegradation of MO dye follows first-order kinetics. The degradation rate constants Krt for the samples that were annealed at 500°C, 700°C, and 900°C are calculated to be 0.01751 min-1, 0.01333 min-1, and 0.01107 min-1, respectively.
To enhance the photocatalytic activity of the prepared CuTa2O6, H2O2 (0.6 mL) was added as a green additive. Figure 8C shows the degradation efficiency of the samples with the addition of H2O2; they have higher degradation efficiencies than those achieved without H2O2. Therefore, the addition of H2O2 substantially enhanced photocatalytic activity. Then, Figure 8D displays the linear increase in the degradation rate. The degradation efficiencies of the samples that were annealed at 500°C, 700°C, and 900°C with added H2O2 are calculated to be 82.5%, 87.3%, and 94.7% with estimated rates constants of 0.01251 min-1, 0.01129 min-1 and 0.00866 min-1, respectively. Hence, the addition of H2O2 achieves the efficient photodegradation of MO in the presence of copper tantalum oxide.
The high-performance activity as a result of adding H2O2 can be explained as follows. H2O2 acts as a good electron acceptor, accelerating the reaction by increasing the formation of oxidizing radicals, which rapidly degrade the dye molecules. When the photons are incident upon the semiconductor, the photogenerated holes react with H2O or OH− and produce hydroxyl radicals (•OH) while the superoxide (O2−•) and (•OH) radicals are generated by the electrons in the conduction band (eCB−). The produced O2−• radicals further form hydroperoxy (OOH•) and •OH radicals, which destroy the organic contaminants. The possible chemical reactions for the degradation of organic dyes are as follows.
To investigate the stability and reusability of the catalysts, an experiment on the recycling of the samples that were annealed at 500°C and 900°C was conducted. The catalyst sample annealed at 900°C underwent little change or deactivation, as shown in Figure 9A. The sample annealed at 500°C exhibits a considerable decrease in the efficiency of photodegradation, as shown in Figure 9B. Notably, the photodegradation efficiency experiences a rapid decline as early as the second and third runs. Therefore, it is believed that the cubic phase of CuTa2O6 is more stable for the photodegradation of MO dye than the orthorhombic phase (sample that was annealed at 500°C).
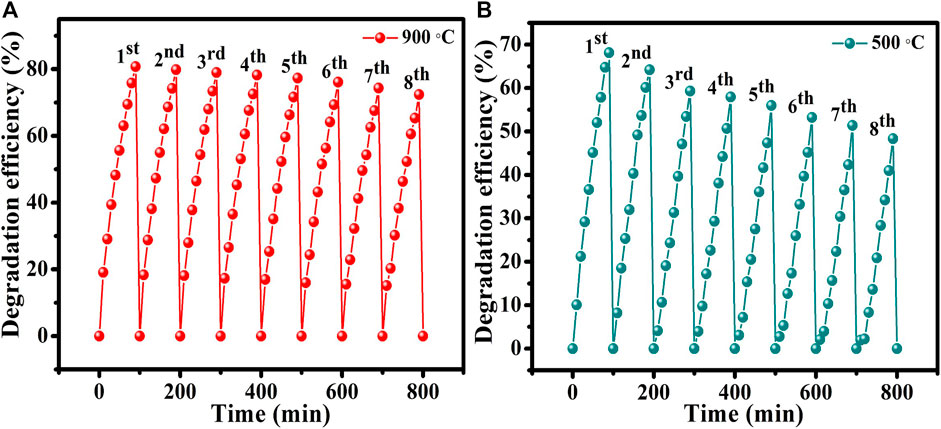
FIGURE 9. Recycling experiment of samples annealed at (A) 900°C and (B) 500°C.
This work demonstrates the photocatalytic activity of the CuTa2O6 phase prepared at different annealing temperatures. The structure, morphology, optical properties, and elemental composition were studied using XRD, FESEM, UV-Vis DRS, and XPS. Structural studies confirmed the phase change from orthorhombic to cubic as the temperature of annealing increased. Both phases had the same morphology and exhibited significant visible light absorption. The cubic phase of CuTa2O6 supported a higher MO dye degradation efficiency than the orthorhombic phase. The local atomic and electronic structures around Cu and the oxidation state of Cu in the CuTa2O6 system were determined by X-ray absorption spectroscopy. The effect of the addition of H2O2 to the prepared samples was determined. The above results demonstrate that CuTa2O6 can be used as photocatalysts for environmental remediation. The prepared CuTa2O6 phase exhibits significant photocatalytic activity and could be a promising photocatalyst in water-splitting applications.
The original contributions presented in the study are included in the article/Supplementary Material, further inquiries can be directed to the corresponding authors.
Conceptualization: AK and SM Data curation: AK, PM, TT, H-WC, and YM Formal analysis: AK, PM, SM, TT, H-WC, and YM Investigation: AK and SM; Methodology: AK and SM; Supervision: SM; Visualization: SM and C-LD; Writing—original draft: AK, SM, and PM; Writing—review and editing: SM and C-LD. All authors contributed to the article and approved the submitted version.
The authors would like to thank the National Science and Technology Council, Taiwan, for financially supporting this research under contracts MOST 110-2112-M-032-013-MY3. The authors are grateful to the support from the beamline staff at BL17C at Taiwan Light Source.
The authors declare that the research was conducted in the absence of any commercial or financial relationships that could be construed as a potential conflict of interest.
All claims expressed in this article are solely those of the authors and do not necessarily represent those of their affiliated organizations, or those of the publisher, the editors and the reviewers. Any product that may be evaluated in this article, or claim that may be made by its manufacturer, is not guaranteed or endorsed by the publisher.
The Supplementary Material for this article can be found online at: https://www.frontiersin.org/articles/10.3389/fchem.2023.1197961/full#supplementary-material
Abdelrahman, E. A., Hegazey, R., Kotp, Y. H., and Alharbi, A. (2019). Facile synthesis of Fe2O3 nanoparticles from Egyptian insecticide cans for efficient photocatalytic degradation of methylene blue and crystal violet dyes. Spectrochimica Acta Part A Mol. Biomol. Spectrosc. 222, 117195. doi:10.1016/j.saa.2019.117195
Ajmal, A., Majeed, I., Malik, N., Idriss, H., and Nadeem, M. A. (2014). Principles and mechanisms of photocatalytic dye degradation on TiO2 based photocatalysts: A comparative overview. RSC Adv. 4, 37003–37026. doi:10.1039/c4ra06658h
Bera, P., Priolkar, K., Sarode, P., Hegde, M., Emura, S., Kumashiro, R., et al. (2002). Structural investigation of combustion synthesized Cu/CeO2 catalysts by EXAFS and other physical techniques: Formation of a Ce1-xCuxO2-δ solid solution. Chem. Mater. 14, 3591–3601. doi:10.1021/cm0201706
Chennakesavulu, K., and Ramajaneya Reddy, G. (2015). Synthesis and characterization of carbon microtube/tantalum oxide composites and their photocatalytic activity under visible irradiation. RSC Adv. 5, 56391–56400. doi:10.1039/c5ra06812f
Djurišić, A. B., Leung, Y. H., and Ching Ng, A. M. (2014). Strategies for improving the efficiency of semiconductor metal oxide photocatalysis. Mater. Horizons. 1, 400. doi:10.1039/c4mh00031e
Dutta, D. P., Ballal, A., Fulekar, M. K., and Tyagi, A. K. (2013). Multifunctionality of rare Earth doped nano ZnSb2O6, CdSb2O6 and BaSb2O6: Photocatalytic properties and white light emission. Dalton Trans. 42, 16887–16897. doi:10.1039/c3dt51966j
Gheytanzadeh, M., Baghban, A., Habibzadeh, S., Jabbour, K., Esmaeili, A., Mohaddespour, A., et al. (2022). An insight into tetracycline photocatalytic degradation by MOFs using the artificial intelligence technique. Sci. Rep. 12, 6615–6711. doi:10.1038/s41598-022-10563-8
Golubev, A., Dinnebier, R. E., Schulz, A., Kremer, R. K., Langbein, H., Senyshyn, A., et al. (2017). Structural and magnetic properties of the trirutile-type 1D-Heisenberg anti-ferromagnet CuTa2O6. Inorg. Chem. 56, 6318–6329. doi:10.1021/acs.inorgchem.7b00421
Gomes, L. E., da Silva, M. F., Goncalves, R. V., Machado, G., Alcantara, G. B., Caires, A. R., et al. (2018). Synthesis and visible-light-driven photocatalytic activity of Ta4+ self-doped gray Ta2O5 nanoparticles. J. Phys. Chem. C 122 (11), 6014–6025. doi:10.1021/acs.jpcc.7b11822
Hodges, B. C., Cates, E. L., and Kim, J. (2018). Challenges and prospects of advanced oxidation water treatment processes using catalytic nanomaterials. Nat. Nanotechnol. 13, 642–650. doi:10.1038/s41565-018-0216-x
Kato, M., Ishii, T., Kajimoto, K., Yoshimura, K., Kosuge, K., Nishi, M., et al. (2002). Magnetic properties of CuSb2-xTaxO6 with tri-rutile structure. J. Phys. Chem. Solid. 63, 1129–1132. doi:10.1016/s0022-3697(02)00026-4
Kau, L. S., Spira-Solomon, D. J., Penner-Hahn, J. E., Hodgson, K. O., and Solomon, E. I. (1987). X-ray absorption edge determination of the oxidation state and coordination number of copper. Application to the type 3 site in Rhus vernicifera laccase and its reaction with oxygen. J. Am. Chem. Soc. 109, 6433–6442. doi:10.1021/ja00255a032
Khalid, N. R., Ahmed, E., Hong, Z., Ahmad, M., Zhang, Y., and Khalid, S. (2013). Cu-doped TiO2 nanoparticles/graphene composites for efficient visible-light photocatalysis. Ceram. Int. 39, 7107–7113. doi:10.1016/j.ceramint.2013.02.051
Khemthong, P., Photai, P., and Grisdanurak, N. (2013). Structural properties of CuO/TiO2 nanorod in relation to their catalytic activity for simultaneous hydrogen production under solar light. Int. J. hydrogen energy 38, 15992–16001. doi:10.1016/j.ijhydene.2013.10.065
Krabbes, I., and Langbein, H. (1996). Herstellung von CuTa2O6 von der Trirutil-zur Perowskit- Struktur. Zeit. Naturf. 51, 1605–1610. doi:10.1515/znb-1996-1113
Li, J., Sun, F., Gu, K., Wu, T., Zhai, W., Li, W., et al. (2011). Applied Catalysis A: General Preparation of spindly CuO micro-particles for photodegradation of dye pollutants under a halogen tungsten lamp. Appl. Catal. A, Gen. 406, 51–58. doi:10.1016/j.apcata.2011.08.007
Li, M., Zhang, H., Zhao, Z., Wang, P., Li, Y., and Zhan, S. (2023). Inorganic ultrathin 2D photocatalysts: Modulation strategies and environmental/energy applications. Acc. Mater. Res. 4 (1), 4–15. doi:10.1021/accountsmr.2c00172
Liang, P., Zhang, C., Sun, H., Liu, S., Tade, M., and Wang, S. (2017). Solar photocatalytic water oxidation and purification on ZIF-8-derived C–N–ZnO composites. Energy & Fuels 31, 2138–2143. doi:10.1021/acs.energyfuels.6b02057
Lim, H., Thomas, K. E., Hedman, B., Hodgson, K. O., Ghosh, A., and Solomon, E. I. (2019). X-Ray absorption spectroscopy as a probe of ligand noninnocence in metallocorroles: The case of copper corroles. Inorg. Chem. 58, 6722–6730. doi:10.1021/acs.inorgchem.9b00128
Liu, H., Gou, X., Wang, Y., Du, X., Quan, C., and Qi, T. (2015). Cauliflower-like Co3O4/three-dimensional graphene composite for high performance supercapacitor applications. J. Nanomater. 2015, 1–9. doi:10.1155/2015/874245
Louis, J., Padmanabhan, N. T., Jayaraj, M. K., and John, H. (2022). Crystal lattice engineering in a screw-dislocated ZnO nanocone photocatalyst by carbon doping. Mater. Adv. 3 (3), 4322–4333. doi:10.1039/d2ma00098a
Mageshwari, K., Sathyamoorthy, R., and Patil, P. S. (2013). Template-free synthesis of MgO nanoparticles for effective photocatalytic applications. Powder Technol. 249, 456–462. doi:10.1016/j.powtec.2013.09.016
Majhi, D., Mishra, A. K., Das, K., Bariki, R., and Mishra, B. G. (2021). Plasmonic Ag nanoparticle decorated Bi2O3/CuBi2O4 photocatalyst for expeditious degradation of 17α-ethinylestradiol and Cr(VI) reduction: Insight into electron transfer mechanism and enhanced photocatalytic activity. Chem. Eng. J. 413, 127506. doi:10.1016/j.cej.2020.127506
Muthu Gnana Theresa Nathana, D., Jacob Melvin Boby, S., Basu, P., Mahesh, R., Harish, S., Joseph, S., et al. (2018). One-pot hydrothermal preparation of Cu2O-CuO/rGO nanocomposites with enhanced electrochemical performance for supercapacitor applications. Appl. Surf. Sci. 449, 474–484. doi:10.1016/j.apsusc.2017.12.199
Nasir, M., Patra, N., Ahmed, M. A., Shukla, D. K., Kumar, S., Bhattacharya, D., et al. (2017). Role of compensating Li/Fe incorporation in Cu0.945Fe0.055-xLixO: Structural, vibrational and magnetic properties. RSC Adv. 7, 31970–31979. doi:10.1039/c7ra03960c
Nguyen, H., Petitbon, F., and Fabry, P. (1996). Investigations on the mixed conductivity of copper tantalate. Solid State Ionics 92, 183–192. doi:10.1016/s0167-2738(96)00492-4
Noto, L. L., Chitambo, M. L., Ntwaeaborwa, O. M., and Swart, H. C. (2013). Photoluminescence and thermoluminescence properties of Pr3+ doped ZnTa2O6 phosphor. Powder Technol. 247, 147–150. doi:10.1016/j.powtec.2013.07.012
Oyewo, O. A., Ramaila, S., Mavuru, L., and Onwudiwe, D. C. (2022). Enhanced photocatalytic degradation of methyl orange using Sn-ZnO/GO nanocomposite. J. Photochem. Photobiol. 11, 100131. doi:10.1016/j.jpap.2022.100131
Ramchiary, A. (2020). “Metal-oxide semiconductor photocatalysts for the degradation of organic contaminants,” in Handbook of smart photocatalytic materials (Elsevier), 23–38.
Rose, A., Hofmann, A., Voepel, P., Milow, B., and Marschall, R. (2022). Photocatalytic activity and electron storage capability of TiO2 aerogels with an adjustable surface area. ACS Appl. Energy Mater. 5, 14966–14978. doi:10.1021/acsaem.2c02517
Sahoo, D., Shakya, J., Ali, N., Yoo, W. J., and Kaviraj, B. (2022). Edge rich ultrathin layered MoS2 nanostructures for superior visible light photocatalytic activity. Langmuir 38 (4), 1578–1588. doi:10.1021/acs.langmuir.1c03013
Sibhatu, A. K., Weldegebrieal, G. K., Sagadevan, S., Tran, N. N., and Hessel, V. (2022). Photocatalytic activity of CuO nanoparticles for organic and inorganic pollutants removal in wastewater remediation. Chemosphere 300, 134623. doi:10.1016/j.chemosphere.2022.134623
Sullivan, I., Zoellner, B., and Maggard, P. A. (2016). Copper(I)-Based p-type oxides for photoelectrochemical and photovoltaic solar energy conversion. Chem. Mater. 28 (17), 5999–6016. doi:10.1021/acs.chemmater.6b00926
Suzuki, T. M., Saeki, S., Sekizawa, K., Kitazumi, K., Takahashi, N., and Morikawa, T. (2017). Photoelectrochemical hydrogen production by water splitting over dual-functionally modified oxide: p-Type N-doped Ta2O5 photocathode active under visible light irradiation. Appl. Catal. B Environ. 202, 597–604. doi:10.1016/j.apcatb.2016.09.066
Svintsitskiy, D. A., Chupakhin, A. P., Slavinskaya, E. M., Stonkus, O. A., Stadnichenko, A. I., Koscheev, S. V., et al. (2013). Study of cupric oxide nanopowders as efficient catalysts for low-temperature CO oxidation. J. Mol. Catal. A Chem. 368, 95–106. doi:10.1016/j.molcata.2012.11.015
Tao, C., Xu, L., and Guan, J. (2013). Well-dispersed mesoporous Ta2O5 submicrospheres: Enhanced photocatalytic activity by tuning heating rate at calcination. Chem. Eng. J. 229, 371–377. doi:10.1016/j.cej.2013.06.012
Vincent, H., Bochu, B., Aubert, J. J., Joubert, J. C., and Marezio, M. (1978). Structure cristalline de CuTa2O6. J. Solid State Chem. 24, 245–253. doi:10.1016/0022-4596(78)90016-6
Wang, Z., Wang, J., Hou, J., Huang, K., Jiao, S., and Zhu, H. (2012). Facile synthesis of efficient photocatalytic tantalum nitride nanoparticles. Mater. Res. Bull. 47, 3605–3611. doi:10.1016/j.materresbull.2012.06.054
Xia, H., Wang, Y., Lin, J., and Lu, L. (2012). Hydrothermal synthesis of MnO2/CNT nanocomposite with a CNT core/porous MnO2 sheath hierarchy architecture for supercapacitors. Nanoscale Res. Lett. 7, 33. doi:10.1186/1556-276x-7-33
Xu, L., Li, C., Shi, W., Guan, J., and Sun, Z. (2012b). Visible light-response NaTa1-xCuxO3 photocatalysts for hydrogen production from methanol aqueous solution. J. Mol. Catal. A, Chem. 360, 42–47. doi:10.1016/j.molcata.2012.04.006
Xu, L., Steinmiller, E. M., and Skrabalak, S. E. (2012a). Achieving synergy with A potential photocatalytic Z-scheme: Synthesis and evaluation of nitrogen-doped TiO2/SnO2 composites. J. Phys. Chem. C 116, 871–877. doi:10.1021/jp208981h
Yang, X., Zhang, S., Li, P., Gao, S., and Cao, R. (2020). Visible-light-driven photocatalytic selective organic oxidation reactions. Mater. Chem. A 8, 20897–20924. doi:10.1039/d0ta05485b
Zhang, L. S., Wang, W. Z., Yang, J., Chen, Z. G., Zhang, W. Q., Zhou, L., et al. (2006). Sonochemical synthesis of nanocrystallite Bi2O3as A visible-light-driven photocatalyst. Appl. Catal. A Gen. 308, 105–110. doi:10.1016/j.apcata.2006.04.016
Zhang, P., Zhang, J., and Gong, J. (2014). Tantalum-based semiconductors for solar water splitting. Chem. Soc. Rev. 43, 4395–4422. doi:10.1039/C3CS60438A
Keywords: phase transition, photocatalytic activity, dye degradation, X-ray absorption spectroscopy (XAS), visible light irradiation
Citation: Alageshwaramoorthy K, Mannu P, Mahalingam S, Nga TTT, Chang H-W, Masuda Y and Dong C-L (2023) Synthesis and characterization of visible-light-driven novel CuTa2O6 as a promising practical photocatalyst. Front. Chem. 11:1197961. doi: 10.3389/fchem.2023.1197961
Received: 03 April 2023; Accepted: 12 June 2023;
Published: 22 June 2023.
Edited by:
Da-Hua Wei, National Taipei University of Technology, TaiwanReviewed by:
Zhelong Jiang, Stanford University, United StatesCopyright © 2023 Alageshwaramoorthy, Mannu, Mahalingam, Nga, Chang, Masuda and Dong. This is an open-access article distributed under the terms of the Creative Commons Attribution License (CC BY). The use, distribution or reproduction in other forums is permitted, provided the original author(s) and the copyright owner(s) are credited and that the original publication in this journal is cited, in accordance with accepted academic practice. No use, distribution or reproduction is permitted which does not comply with these terms.
*Correspondence: Seetha Mahalingam, c2VldGhhLnBoeUBnbWFpbC5jb20=; Chung-Li Dong, Y2xkb25nQG1haWwudGt1LmVkdS50dw==
Disclaimer: All claims expressed in this article are solely those of the authors and do not necessarily represent those of their affiliated organizations, or those of the publisher, the editors and the reviewers. Any product that may be evaluated in this article or claim that may be made by its manufacturer is not guaranteed or endorsed by the publisher.
Research integrity at Frontiers
Learn more about the work of our research integrity team to safeguard the quality of each article we publish.