 Fuguo Hou1†
 Xuehua Fan1†
 Xinjing Gui1,2,3,4,5†
 Han Li1Haiyang Li1Yanli Wang2,3,4,5Junhan Shi2,3,4,5Lu Zhang2,3,4,5Jing Yao2,3,4,5Xuelin Li2,3,4,5*
 Ruixin Liu2,3,4,5,6*
- 1School of Pharmacy, Henan University of Chinese Medicine, Zhengzhou, China
- 2Department of Pharmacy, The First Affiliated Hospital of Henan University of Chinese Medicine, Zhengzhou, China
- 3Henan Province Engineering Research Center for Clinical Application, Evaluation and Transformation of Traditional Chinese Medicine, Zhengzhou, China
- 4Co-Construction Collaborative Innovation Center for Chinese Medicine and Respiratory Diseases by Henan & Education Ministry of China, Henan University of Chinese Medicine, Zhengzhou, China
- 5Henan Key Laboratory for Clinical Pharmacy of Traditional Chinese Medicine, Zhengzhou, China
- 6Engineering Research Center for Pharmaceutics of Chinese Materia Medica and New Drug Development, Ministry of Education, Beijing, China
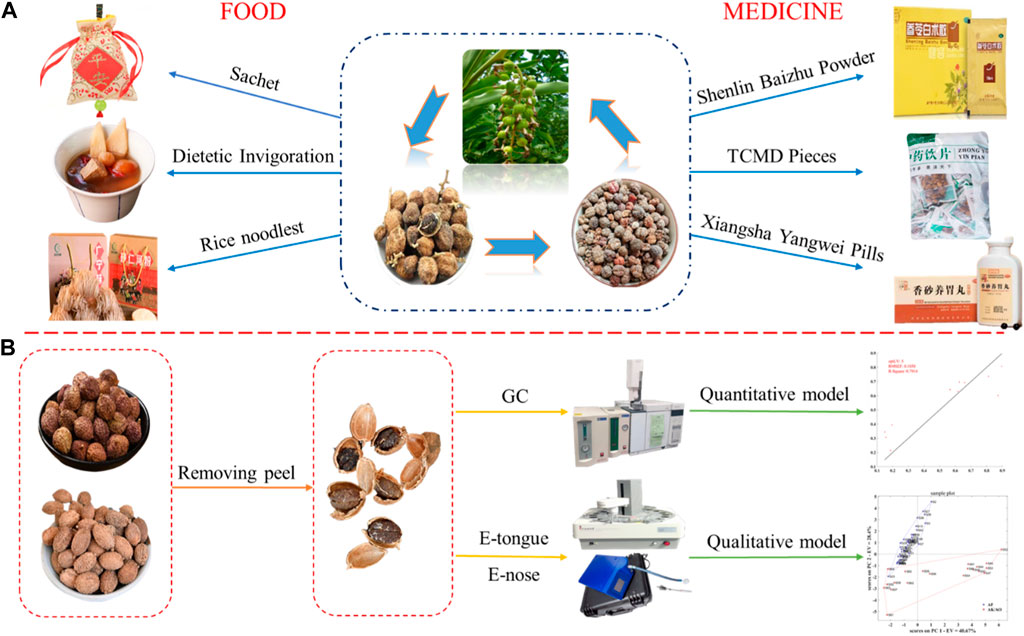
Amomi fructus is rich in volatile components and valuable as a medicine and edible spice. However, the quality of commercially available A. fructus varies, and issues with mixed sources and adulteration by similar products are common. In addition, due to incomplete identification methods, rapid detection of the purchased A. fructus quality is still an issue. In this study, we developed qualitative and quantitative evaluation models to assess the variety and quality of A. fructus using GC, electronic tongue, and electronic nose to provide a rapid and accurate variety and quality evaluation method of A. fructus. The models performed well; the qualitative authenticity model had an accuracy of 1.00 (n = 64), the accuracy of the qualitative origin model was 0.86 (n = 44), and the quantitative model was optimal on the sensory fusion data from the electronic tongue and electronic nose combined with borneol acetate content, with R2 = 0.7944, RMSEF = 0.1050, and RMSEP = 0.1349. The electronic tongue and electronic nose combined with GC quickly and accurately evaluated the variety and quality of A. fructus, and the introduction of multi-source information fusion technology improved the model prediction accuracy. This study provides a useful tool for quality evaluation of medicine and food.
1 Introduction
Amomi fructus, also known as Sharen in China, is the dried fruit of Amomum villosum Lour. and A. villosum Lour. var.xanthioides T.L.Wu et Senjen and Amomum longiligulare T.L.Wu (Chinese Pharmacopoeia Commission, 2020). The fruits are harvested in summer and autumn when they are ripe and dried in the Sun or at low temperatures using air blast drying box. Amomum villosum is a tropical plant that prefers the warm and humid climate of the southern subtropical monsoon rainforest and is grown in Guangdong, Yunnan and Hainan provinces in China and in Myanmar, Vietnam, and Thailand.
Amomi fructus contains rich volatile oil components including borneol acetate, camphor, borneol, camphene, α-pinene, and β-pinene (Chen et al., 2021; Huang et al., 2021). These components have applications in the pharmaceutical and food industries, earning the fruit the name “medicine food homology”. Amomi fructus has been used for thousands of years as an important traditional Chinese medicine with a wide range of pharmacological effects such as anti-ulcer (Liu et al., 2022), anti-inflammatory, analgesic, anti-diarrheal and anti-bacterial (Li et al., 2015). It has significant effects in the treatment of diseases such as functional digestive disorders, gastritis, Helicobacter pylori infection in children, and acute lung injury (Suo et al., 2018; Zhao et al., 2022) and it has significant potential for scientific research and new drug development. It is used in proprietary Chinese medicines such as the Xiangsha Yangwei Pill, Jianpi Pill, and Shenling Baizhu Granules (Zhang et al., 2020; Zu et al., 2022), and directly used when mashed in the form of a traditional Chinese medicine decoction (Nie et al., 2018). Amomi fructus is also a food and can be used as a spice which is finely ground into a sachet or aromatherapy. The complete fruit or seed can be used as a seasoning, with common A. fructus meals including A. fructus stew ribs, A. fructus crucian soup (Yu and Gao, 2017), and A. fructus porridge (Xue, 2019; Zhao, 2020), etc. In addition, a series of A. fructus by-products such as A. fructus wine, A. fructus honey, and A. fructus rice noodles have been developed in recent years.
The variety and quality of commercially available A. fructus vary greatly due in part to the easy mixing of sources and doping of similar varieties (Hou et al., 2015). Due to the lack of identification of some samples sold and incomplete identification methods, the quality of commercial A. fructus is uncertain. The traditional identification methods of A. fructus, include tasting, sniffing, and visual inspection (Hou et al., 2015), and although the identification speed is fast, the resulting description is relatively vague, subjective, and lacks objective quantitative criteria, which limits its practical applications. Modern identification methods include GC (Xu et al., 2018), GC-MS(Wang et al., 2021a; Gu et al., 2022), and DNA barcoding (Huang et al., 2017; Lu et al., 2021) which have accurate and reliable results; however, the sample pretreatment is cumbersome, time-consuming and has high technical operational requirements. Therefore, a rapid and accurate quality identification method for A. fructus is urgently needed (Gui et al., 2023).
Bionic sensory technologies such as e-tongue and e-nose (Weng et al., 2022; Gui et al., 2023), can be used to objectify the trait characteristics of medicine or food. The integration of bionic sensory and modern analysis instrumental yields the advantages of both “fast” sensory response and “quantitative” instrumental analysis, affording fast analysis, high sensitivity, strong reliability, good repeatability, and strong integrity (Xie et al., 2016). Multi-source Information Fusion (MIF) technology was first used by the U.S. Navy in the military field, and has become an emerging multidisciplinary approach that can combine and optimize data from multiple bionic sensory sources to obtain more detailed and accurate reasoning than an individual source, and it is now being used in the quality evaluation of medicine and food (Dai et al., 2018; Xu et al., 2019; Lan et al., 2020; Jiang et al., 2021; Jing et al., 2022).
This study aims to qualitatively and quantitatively evaluate the variety and quality of A. fructus using the combination of GC, e-tongue, and e-nose to establish a rapid and accurate method to evaluate the variety and quality of A. fructus and to provide a reference for the quality evaluation of other foods and medicines.
2 Materials and methods
2.1 Drugs and reagents
A total of 44 batches of A. fructus from four origins were collected in this study, including AF-1 for Yunnan A. fructus from China (S1-S21), AF-2 for Guangdong A. fructus from China (S22-S34), AF-3 for Hainan A. fructus from China (S35-S39), and AF-4 for Myanmar A. fructus (S40-S44). In addition, 10 batches of each of Alpiniae katsumadai semen (AK) and Alpiniae oxyphyllae fructus (AO) were collected as counterfeit of A. fructus, with AK for S45-S54 and AO for S55-S64.
Camphor, borneol, and borneol acetate were purchased from Shanghai Yuanye Bio-Technology Co., Ltd. (Shanghai, China). Anhydrous ethanol (analytical purity, Tianjin Yongda Chemical Reagent Co., Ltd.); tartaric acid, potassium chloride (reference solution); potassium chloride, pure water, potassium hydroxide (positive cleaning solution); anhydrous ethanol, concentrated hydrochloric acid (negative cleaning solution).
2.2 The percentage of peel analysis
Appropriate amounts of each batch of A. fructus samples were taken, their peels and seeds were separated and weighed, and the peel percentage by weight was calculated and recorded.
2.3 Volatile component content analysis
Control solutions of camphor, borneol, and borneol acetate at concentrations of 0.942 mg mL-1, 0.870 mg mL-1, and 2.000 μL mL-1, respectively, were made through dissolving and dilution by anhydrous ethanol.
A 1 g sample of A. fructus seed/peel powder was added to a conical flask with 25 mL anhydrous ethanol and extracted with ultrasonic waves at 40 kHz for 30 min. After cooling to room temperature, the processed samples were shaken well and centrifuged at 5,000 r·min-1 for 15 min. Finally, the solution was filtered using a 0.45 μm filter membrane to obtain the seed/peel sample solution.
The GC system included an Agilent 7890A instrument (Agilent Technologies Co., Ltd. United States of America) with a flame ionization detector (FID): GC conditions: Agilent HP-5 column (0.25 μm, 0.32 mm × 30 m). Nitrogen was used as the carrier gas at a constant flow rate of 1.1 mL/min. The column was heated to 63 C, then increased at a rate of 5°C/min to 130°C and held for 5 min. The temperature was then further increased at a rate of 20 C/min to 230°C and held for 5 min. The column oven temperature was 300°C and the injection volume was 1 μL.
2.4 Bionic sensory analysis
2.4.1 Measurement of bionic taste data by e-tongue
To prepare the positive electrode cleaning solution, 7.46 g of potassium chloride was accurately weighed and dissolved with 500 mL of distilled water. Then 300 mL of absolute ethanol solution and 0.56 g of potassium hydroxide were added while stirring. After dissolving, the solution was transferred to a 1,000 mL volumetric flask and the volume was adjusted to 1,000 mL.
The negative electrode cleaning solution was prepared by mixing 300 mL of absolute ethanol with 500 mL of distilled water by shaking, then mixing in 8.3 mL of concentrated hydrochloric acid followed by transferring to a 1,000 mL volumetric flask and adjusting the volume to 1,000 mL.
The glass electrode immersion maintenance solution was prepared by adding 248.2 g potassium chloride in 900 mL distilled water, dissolving it completely by ultrasound, and adjusting the volume to 1,000 mL.
The reference solution was prepared by first weighing 0.18 g tartaric acid and 8.946 g potassium chloride in a 1 L volumetric flask, then adding distilled water to fix the volume. Next, the solution was shaken and poured into a 4 L container. Finally, add 3 L of distilled water to the 4 L container with the volumetric flask.
The sample was prepared by taking 3 g of powder sample, adding 100 mL of reference solution to dissolve, shaking for 10 min, sonicating for 10 min, filtering through, then placing in a special beaker (about 35 mL) for measurement by the e-tongue.
The SA402 B e-tongue (Intelligent Sensor Technology, Inc., Japan) was used to test the bionic taste data of each sample. The e-tongue included eight sensors: C00, AE1, CA0, CT0, AAE, AN0, BT0 and GL1 (Table 1). A total of 11 taste information values are output from 8 sensors, each representing a different type of taste information, and the difference between the different taste information is indicated by the level of the response value. The type of measurement adopted in e-tongue is potentiometric measurement. First, the sensors were cleaned for 90 s in a cleaning solution, followed by 120 s with a reference solution, and continued with another reference solution for 120s. The sensors were zeroed in the equilibrium position for 30 s. After reaching the equilibrium condition, the test started with a test time of 30 s, and the sensors outputted the first taste value. Then, the sensors were briefly cleaned in the two groups of reference solutions for 3 s, and the sensors were inserted into the new reference solution to test the aftertaste for 30 s. It was cycled 4 times. The result of the first cycle was removed, and the average value of the last 3 times was considered the test result. Among them, the sweet taste sensor GL1 was tested for 5 times, and the first cycle and the last cycle were removed, and the average data of the middle three times were taken as the test results. Each cleaning, equilibrating, and testing of the sensors were performed in different sample cups (Liu et al., 2014; Li et al., 2023). The total test time per sample was approximately 90 min when all types of sensors were used.
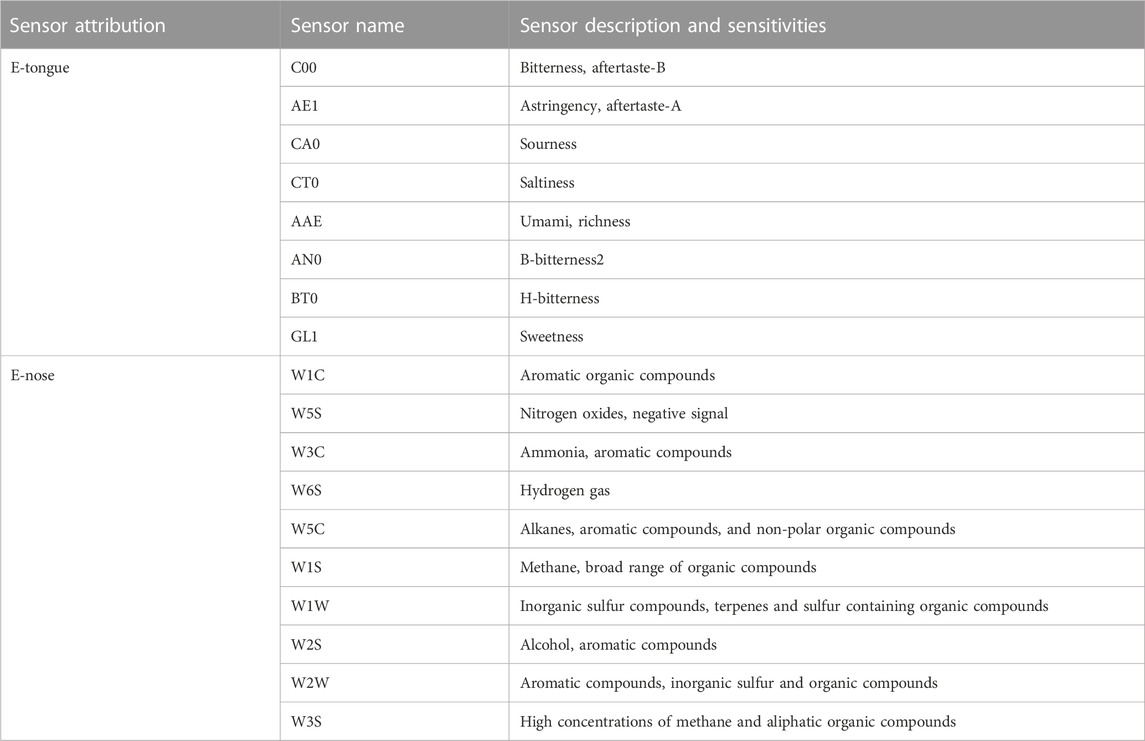
TABLE 1. Sensors information.
2.4.2 Measurement of bionic olfactory data by e-nose
The PEN3.5 e-nose (AIRSENSE Analytics GmbH, Germany) included ten sensors: W1C, W5S, W3C, W6S, W5C, W1S, W1W, W2S, W2W, W3S (Table 1). Different sensors can detect different types of chemicals and indicate the level of compound content by the level of response value. The type of measurement adopted in e-nose is resistance measurement. The sample was weighed 3 g and placed in a 50 mL centrifuge tube and sealed with a sealing film. The sample odor information was collected by static headspace sampling method and the headspace generation time was 30 min.
After connecting the PEN3.5 e-nose to the computer, we ran its supporting software and set the e-nose parameters for each test, including sampling and cleaning time. We selected a folder and path to save the results and the name of each sample to be tested and started the test. The sample inlet flow rate was set to 400 mL and the sampling time was 100 s. Three parallel measurements were taken, and the data at 80 s inlet time was taken as the results. The experiment was conducted at room temperature of about 24 C and relative humidity of about 82%. The total time of measurements for each sample is about 3 min.
2.5 Statistical analysis
A comparative analysis of the peel and seed samples was conducted using Origin 2022. Principal Component Analysis (PCA) was conducted using SIMCA 14.1, which is one of the most frequently used unsupervised chemometric tools. It allowed the projection of data from a higher to a lower-dimensional space so that it simplifies the interpretation of variables between the samples (Barbosa et al., 2020). Orthogonal Partial Least Square Discriminant Analysis (OPLS-DA) (Wang et al., 2021b) was conducted using SIMCA 14.1, Principal Component Analysis Discriminant Analysis (PCA-DA) and Partial Least Squares Discriminant Analysis (PLS-DA) were conducted using the MATLAB R2016B software, which a supervised discriminant analysis statistical method, and it is very beneficial to finding relevant information related with particular samples and variables of a dataset (Zhang et al., 2022). Partial Least Squares Regression (PLSR) (Htet et al., 2021) was also conducted using the MATLAB R2016B software, which is to find a linear regression model by projecting predictive variables and observed variables into a new space.
3 Results and discussion
3.1 The percentage of peel analysis
The percentage of peel results from the Yunnan, Guangdong, Hainan, and Myanmar A. fructus are reported in Figure 1. The peel percentage of A. fructus from Yunnan and Guangdong were around 0.2, while the peel percentage of Hainan and Myanmar A. fructus was around 0.3, which represented a significant difference (p < 0.05). Compared to Yunnan and Guangdong A. fructus, the peels of Hainan and Myanmar A. fructus are shrunken and thicker, consistent with the measurement results.
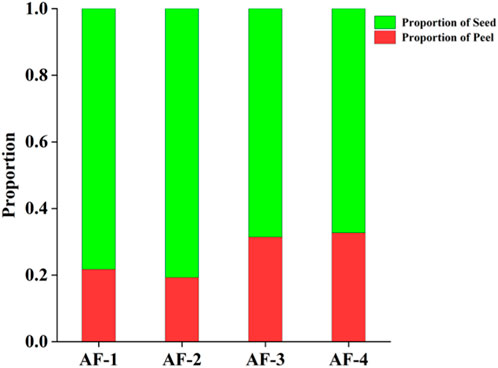
FIGURE 1. The percentage of peel in Yunnan, Guangdong, Hainan and Myanmar Amomi fructus.
3.2 Volatile component content analysis
3.2.1 Establishment and analysis of GC fingerprints
The GC fingerprints and common patterns of 44 batches of A. fructus seeds and peels are illustrated in Figure 2. A total of 6 common peaks were extracted from the seed fingerprints. Among these peaks, 3 common peaks were identified by comparison to the reference fingerprint, with peak 4 being camphor, peak 5 being borneol, and peak 6 being borneol acetate. A total of 8 common peaks were extracted from the peel fingerprints, two of which, peak 6 (camphor) and peak 7 (borneol acetate), were identified by comparison to the reference fingerprint. The fingerprints of seeds and peels were analyzed for similarity analysis with their common patterns, revealing that in both seeds and peels the fingerprints of Yunnan and Guangdong A. fructus significantly differed from those of Hainan and Myanmar (p < 0.01). The average fingerprint similarity was above 0.9 for Yunnan and Guangdong A. fructus and below 0.7 for Hainan and Myanmar A. fructus.
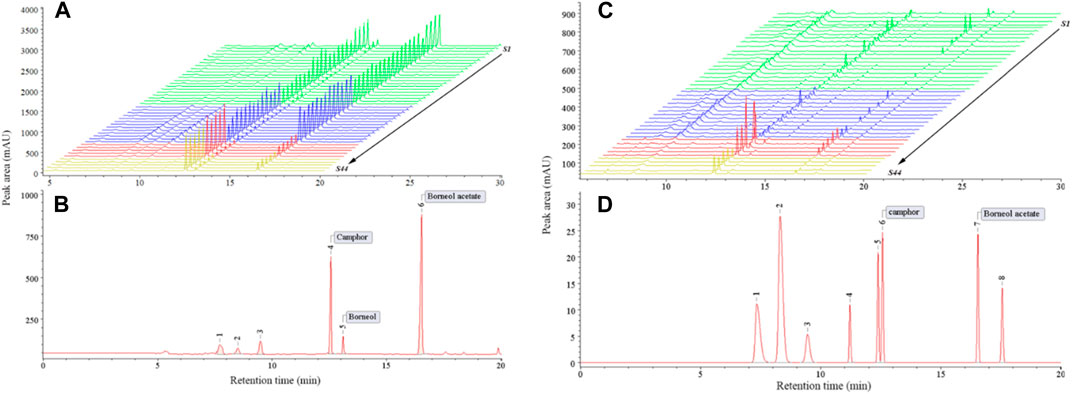
FIGURE 2. GC fingerprints of 44 batches of Amomi fructus seed (A) and peel (C), common mode characteristic chromatogram of seed (B) and peel (D).
3.2.2 Comparative analysis of the content of volatile components of seeds and peels
The volatile component content in seeds was significantly higher than in peels (p < 0.01) (Figure 3). The content of borneol acetate in the seeds of the Guangdong A. fructus was significantly higher than in the A. fructus from Yunnan, Hainan and Myanmar (p < 0.05), and the content of borneol acetate in the Yunnan A. fructus seeds was higher than in those from Hainan and Myanmar (p < 0.01). There was no significant difference in seed-borneol content across the four origins (p > 0.05). The camphor content in the seeds from Hainan and Myanmar was significantly higher than those from Yunnan and Guangdong (p < 0.01). The content of all three volatile components in the peels was higher in the sample from Yunnan than from Hainan (p < 0.05), and the peel camphor and borneol contents were higher in the Guangdong sample than in the Hainan sample (p < 0.01).
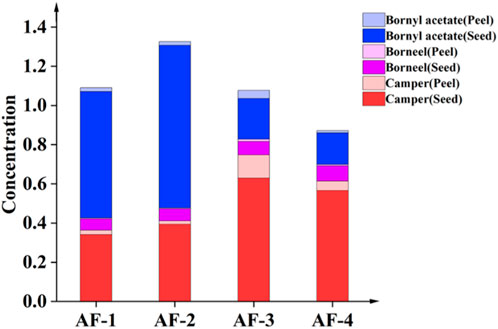
FIGURE 3. Contents of volatile components in Amomi fructus seed and peel.
Given the differences in the edible and medicinal parts of A. fructus, in some cases, the intact fruits are used directly, and in other cases, only the seeds are used after peeling. When using different parts and varieties of A. fructus, the component content of seeds and peels as well as peel percentage should be taken into account for dosage calculations.
3.2.3 OPLS-DA of the seed components
To further investigate the quality differences among A. fructus seeds from the four origins, OPLS-DA was performed using the data of six common peaks extracted from the GC fingerprints of the seeds as variables (Figure 4A). The model prediction parameter R2Y is the explanation rate of the proposed model for the Y-matrix, and Q2 is the predictive power of the model, and the closer their values are to 1 indicates a better fit of the model. The model predicted parameters R2Y (0.526) and Q2 (0.395) indicated that the model was stable and had some predictive ability. The Yunnan and Guangdong A. fructus seeds are in one category and the rest are grouped together (Figure 4A), consistent with the similarity analysis results. To verify whether the model was overfitted, a 200X permutation test was conducted using SIMCA 14.1 (Figure 4B). The model is valid when all Q2 and R2 values on the left are lower than the original point on the right, or when the blue regression line of Q2 intersects the vertical axis (on the left) at or below zero. The intercepts of the model validation parameters R2 and Q2 were 0.045, and −0.210, respectively. The regression curve of Q2 intersected the Y-axis below zero, indicating that the model was not overfitted. Subsequently, VIP (Variable Importance for the Projection) analysis was performed, and the larger VIP value indicated that the difference of the peak has a greater impact on the quality of A. fructus from different origins. Using a VIP value greater than 1 as the screening criterion, a total of 4 common peaks were screened. The order of influence on sample quality among the peaks was peak 4> peak 3> peak 2 > peak 1.
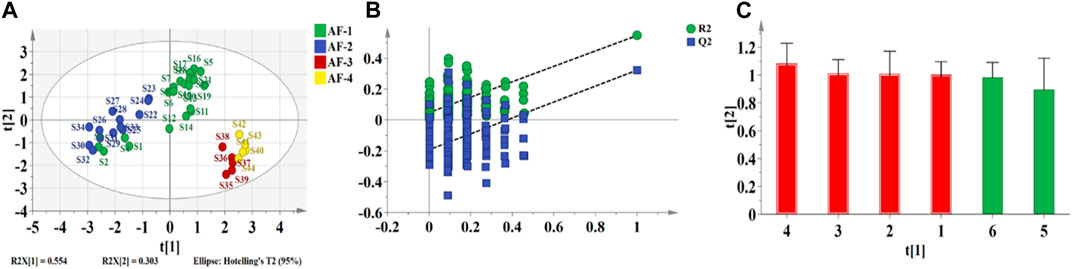
FIGURE 4. OPLS-DA analysis of Seed. Score plot (A) 200X permutation tests (B); VIP (C).
3.3 Bionic sensory analysis
3.3.1 Establishing qualitative models of Amomi fructus authenticity and origin with e-tongue
3.3.1.1 Output information of taste sensor
A total of 11 bionic taste response values were obtained from the measured samples, including B-bitterness2, H-bitterness, Sweetness, Sourness, Bitterness, Astringency, Aftertaste-B, and Aftertaste-A (Figures 5A). The response values of Bitterness, Umami, Richness, and Saltiness for all samples and Sweetness, Aftertaste-A, and Aftertaste-B for some samples were greater than 0. And compared to the rest of the bionic taste response values that were less than 0, these had more practical significance and reference value. The response values of B-bitterness2 and Sourness were significantly higher for S61, which was the only A. oxyphyllae fructus from Guangdong, and lower for Umami compared to the other A. oxyphyllae fructus from Guangxi or Hainan. Whether this data is a coincidence or not needs to be further verified by using more samples from Guangdong, and this finding may also provide an idea for the origin identification of A. oxyphyllae fructus.
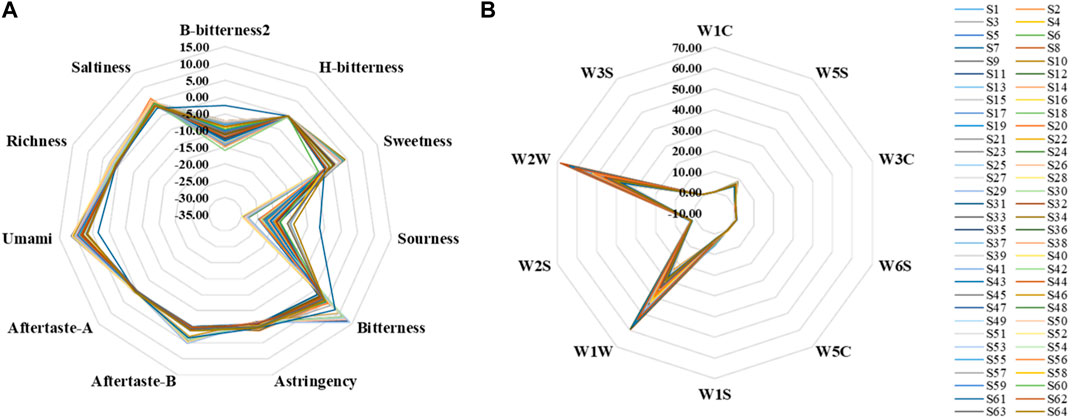
FIGURE 5. Electronic tongue (A), electronic nose (B) output information radar charts.
3.3.1.2 Establishing qualitative models of Amomi fructus authenticity
PCA is an unsupervised data dimensionality reduction method that does not consider sample group information. The dimensionality reduction function of PCA is often used to discover its potential inter-group differentiation trends and to make a basis for subsequent multivariate statistical analysis for classification or prediction (Se et al., 2018). Figure 6A shows a plot of the sample principal component scores created using the taste response values. The first two principal components could explain 69.1% of the variance information of the original data. The two-dimensional plot shows that except for S23, 44 batches of A. fructus, 10 batches of A. katsumadai semen and 10 batches of A. oxyphyllae fructus can be clustered into one category each.
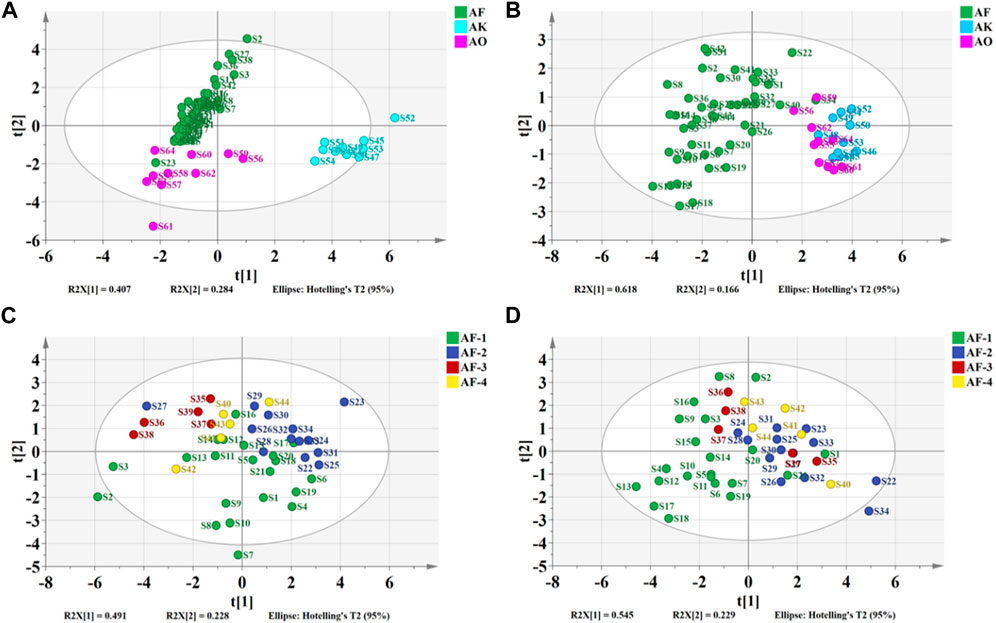
FIGURE 6. Plots of PCA of the electronic tongue-Authenticity (A), electronic nose-Authenticity (B), electronic tongue-Origin (C), electronic nose-Origin (D).
Using the taste response values of the above samples as the independent variable X) and the species classification of the samples as the dependent variable Y), the PCA-DA and PLS-DA authenticity discrimination models of A. fructus were established and validated through leave-one-out cross-validation (Figures 7A, B). The A. fructus samples are labeled ‘AF’ and the remaining samples as ‘AK/AO’. By preferring the number of principal components to build a qualitative analysis model with better performance of PLS-DA/PCA-DA, the two-dimensional plot shows that the first two principal components can explain 69.07% and 78.39% of the sample information, respectively. The accuracy of both models was 1.00 and there were no assigned samples (Table 2). It shows that the developed model can completely distinguish whether the sample isAmomi fructus or not, and the model performs well.
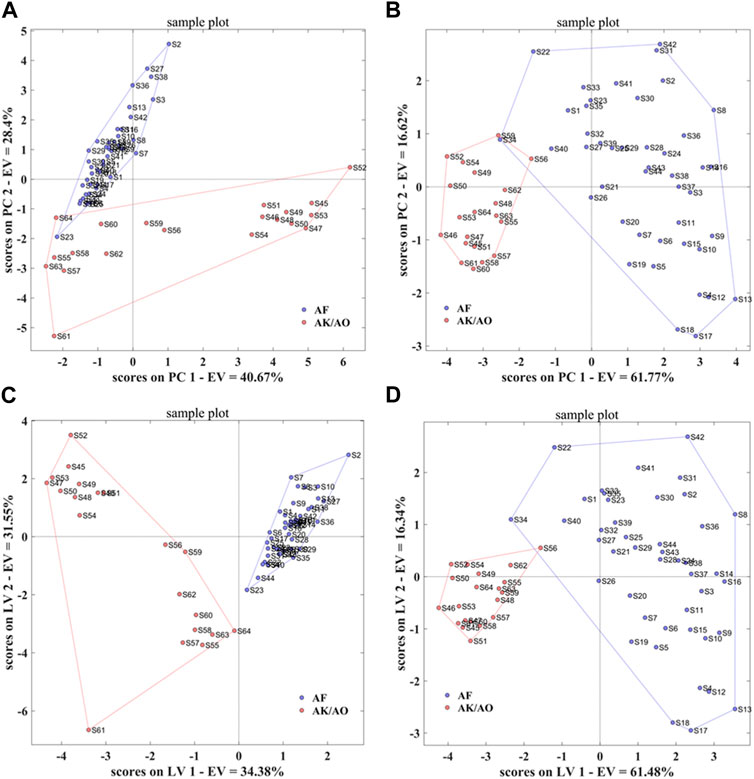
FIGURE 7. PCA-DA models of the electronic tongue-Authenticity (A), electronic nose-Authenticity (C), PLS-DA models of the electronic tongue-Authenticity (B), electronic nose-Authenticity (D).
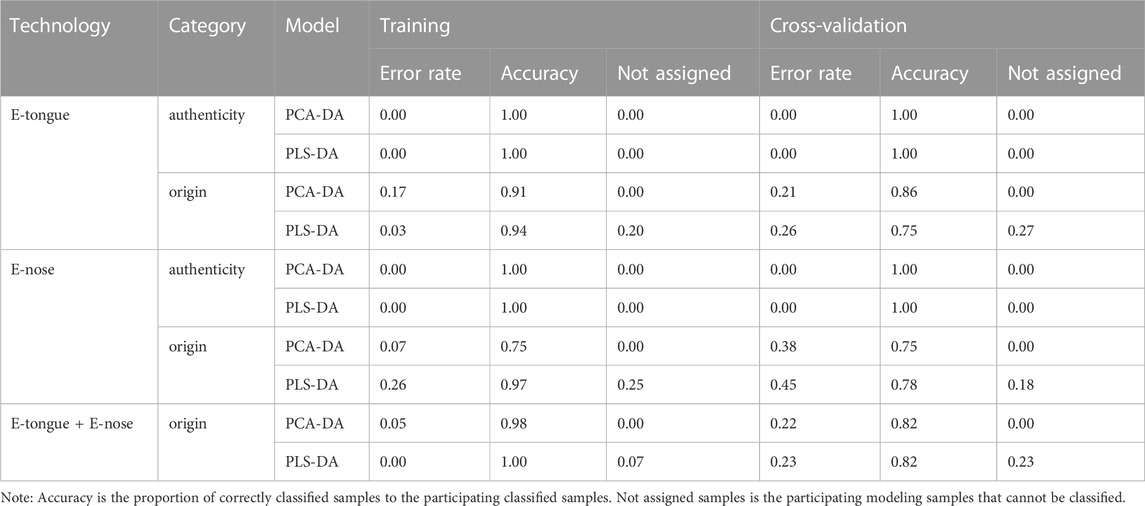
TABLE 2. Parameters of each model.
3.3.1.3 Establishing qualitative models of Amomi fructus origin
PCA was performed on the taste response values of 21 batches of A. fructus from Yunnan, 13 from Guangdong, 5 from Hainan, and 5 from Myanmar. The first two principal components could explain 71.9% of the variance information of the original data. The results showed that A. fructus of each origin could not be clearly clustered into a single category (Figures 6C), indicating that the A. fructus taste information across origins was relatively similar, and it was impossible to distinguish them effectively through PCA alone.
Using the taste response values of the above samples as the independent variable X) and the origin classification of the samples as the dependent variable Y), the PCA-DA and PLS-DA origin discrimination models of the A. fructus were established and validated using leave-one-out cross-validation (Figures 8A, B). The A. fructus from Yunnan were labeled as ‘AF-1’, from Guangdong as ‘AF-2’, from Hainan as ‘AF-3’, and from Myanmar as ‘AF-4’. The accuracies of the PCA-DA and PLS-DA models were 0.86 and 0.75, respectively, but there were more unassigned samples in the PLS-DA model (Table 2). The performance of the PCA-DA model established by the taste response values was relatively good as it was generally able to accurately distinguish A. fructus of different origins.
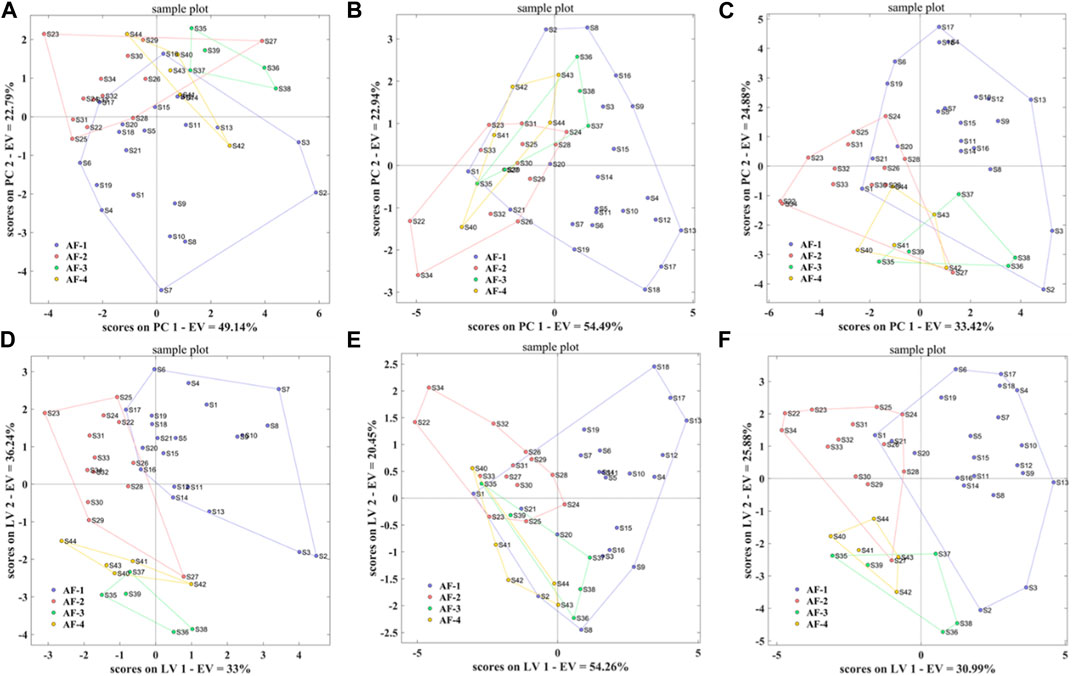
FIGURE 8. PCA-DA models of the electronic tongue-Origin (A), electronic nose-Origin (C) and two-source fusion-Origin (E), PLS-DA models of the electronic tongue-Origin (B), electronic nose-Origin (D) and two-source fusion-Origin (F).
3.3.2 Establishing the qualitative models of Amomi fructus authenticity and origin by e-nose
3.3.2.1 Output information of olfactory sensor
A total of 10 bionic olfactory response values were obtained from the measured samples, including W1C, W5S, W3C, W6S, W5C, W1S, W1W, W2S, W2W, W3S (Figure 5B). The sensor response values for all samples were all greater than 0, and the response values of W1W and W2W were larger, indicating that the samples contained more inorganic sulfur compounds, terpenes, sulfur-containing organic compounds, aromatic compounds, and more organic compounds.
3.3.2.2 Establishing the qualitative models of Amomi fructus authenticity
The PCA on the olfactory response values of 44 batches of A. fructus, 10 batches of A. katsumadai semen, and 10 batches of A. oxyphyllae fructus showed that the A. fructus were clustered into one category except for S34, and A. katsumadai semen and A. oxyphyllae fructus were clustered into one category (Figure 6B). The first two principal components could explain 78.4% of the variance information of the original data.
Using the olfactory response values of the above samples as the independent variable X) and the species classification of the samples as the dependent variable Y), the PCA-DA and PLS-DA authenticity discrimination models of the A. fructus were established and validated using leave-one-out cross-validation (Figures 7C, D). The two-dimensional plot shows that the first two principal components can explain 65.93% and 77.82% of the sample information, respectively. The A. fructus samples were labeled ‘AF’ and the remaining samples were labeled ‘AK/AO’. The accuracy of both models was 1.00 and there were no unassigned samples (Table 2), indicating that the established models could completely distinguish between A. fructus and the others.
3.3.2.3 Establishing qualitative models of Amomi fructus origin
The PCA model of the olfactory response values showed that the A. fructus of each origin could not be clearly clustered into one category each. This indicated that the A. fructus olfactory information, as with the taste information, was similar across origins so their origins could not be effectively distinguished by unsupervised PCA alone.
Using the olfactory response values of the above samples as the independent variable X), and the origin classification of the samples as the dependent variable Y), the PCA-DA and PLS-DA origin discrimination models of the A. fructus were established and validated using leave-one-out cross-validation (Figures 8C, D). The accuracies of the PCA-DA and PLS-DA models were 0.75 and 0.78, respectively, but there were more unassigned samples in the PLS-DA model (Table 2). The PCA-DA model established by the olfactory response values was generally able to accurately distinguish the A. fructus of different origins.
3.3.3 Establishing qualitative models of Amomi fructus origin using e-tongue and e-nose
The accuracy of the qualitative models of A. fructus authenticity established by a single type of bionic sensory data all reached 1.00, while the accuracy of the qualitative origin models was relatively low. In order to improve data utilization and model performance, the PCA-DA and PLS-DA origin identification models were established by fusing the above two types of bionic sensory data, taking the fused data as the independent variable X) and the A. fructus origin classification as the dependent variable Y). The accuracy of the PCA-DA and PLS-DA models was 0.82 (Figures 8E, F), and there were still unassigned samples in the PLS-DA model. Compared to the qualitative origin model established by bionic taste data, the accuracy of the PCA-DA model was reduced, while the number of unassigned samples in the PLS-DA model was reduced. Compared with the qualitative origin model established by bionic olfactory data, the accuracy of both types of models was improved, while the number of unassigned samples in the PLS-DA model was increased.
3.3.4 Establishing quantitative models of Amomi fructus using volatile component content and bionic sensory data
A PLSR analysis of A. fructus was carried out with the fusion of two types of bionic sensory data as the independent variable X), and the contents of camphor, borneol, and bornyl acetate in A. fructus as the dependent variable Y). Samples were divided into a training set of 33 and a test set of 11. With an R2 of 0.7914, the fusion model outperformed the PLSR models established by a single type of bionic sensory data (Figure 9). The parameters of PLSR models are reported in Table 3. This result illustrated the strong correlation between borneol acetate and bionic sensory data. This model can be used to evaluate the quality of A. fructus and highlights the importance of borneol acetate in the variety and quality evaluation of A. fructus.
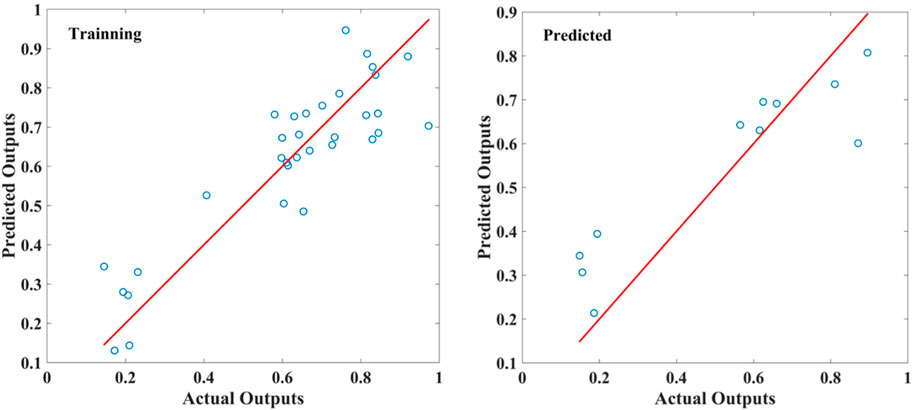
FIGURE 9. Predicted and actual values of PLSR models for two-source fusion + bronyl acetate.
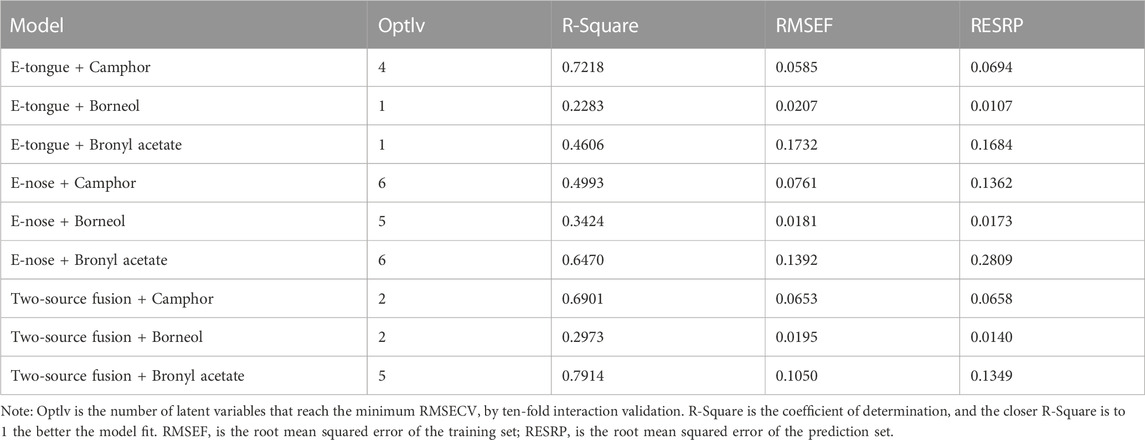
TABLE 3. Parameters of PLSR models.
4 Conclusion
The qualitative models of A. fructus authenticity were the optimal model with an accuracy of 1.00. The qualitative origin model using the PCA-DA established by the e-tongue was optimal, with an accuracy of 0.86. The PLSR model established by two types of sensory fusion data combined with bornyl acetate content was optimal, with an R2 of 0.7914. Our study reveals that the use of e-tongue and e-nose combined with GC can be used to evaluate the variety and quality of A. fructus quickly and accurately, and the introduction of MIF technology can improve the prediction accuracy of the model to some extent. This study provides a potential tool for the rapid and accurate evaluation of the variety and quality of A. fructus and also provides a promising method for evaluating the variety and quality of other traditional Chinese medicines and foods.
Data availability statement
The original contributions presented in the study are included in the article/Supplementary Material, further inquiries can be directed to the corresponding authors.
Author contributions
Conceptualization, RL and XG; methodology, XF; software, FH and XF; validation, XL; formal analysis, YL, HL, YW and JS; investigation, LZ and JY; resources, RL; data curation, FH and XF; writing—original draft preparation, FH and XF; writing—review and editing, FH and XF; visualization, XG; supervision, RL and XL; project administration, RL and XL; funding acquisition, RL and XL FH and XF and XG contributed equally to this work. RL and XL reviewed and critically revised the manuscript, and agree to be accountable for all aspects of the work. All authors contributed to the article and approved the submitted version.
Funding
This work was supported by the National Key R&D Program of China (2017YFC1703400), National Natural Science Foundation of China (81001646, 81774452, 81773892), Henan Province Top Talent Training Project of Traditional Chinese Medicine (2019ZYBJ07), Henan Province High-level Talents Special Support ‘Central Plains Thousands Plan’ Project (ZYQR201912158), Henan Province Health Youth Discipline Leader Special (HNSWJW-2020014), Key R&D and promotion projects in Henan Province (222102310377), Henan University of Chinese Medicine 2022 graduate research innovation ability promotion plan (2022KYCX027), Special Scientific Research Project of National Clinical Research Base of Traditional Chinese Medicine of Henan Provincial Administration of traditional Chinese Medicine (2018JDZX087), and Special Research Project for Traditional Chinese Medicine of Henan Province (2023ZY2034).
Conflict of interest
The authors declare that the research was conducted in the absence of any commercial or financial relationships that could be construed as a potential conflict of interest.
Publisher’s note
All claims expressed in this article are solely those of the authors and do not necessarily represent those of their affiliated organizations, or those of the publisher, the editors and the reviewers. Any product that may be evaluated in this article, or claim that may be made by its manufacturer, is not guaranteed or endorsed by the publisher.
References
Barbosa, S., Saurina, J., Puignou, L., and Núñez, O. (2020). Classification and authentication of paprika by UHPLC-HRMS fingerprinting and multivariate calibration methods (PCA and PLS-DA). Foods 9, 486. doi:10.3390/foods9040486
Chen, X., Xiao, X., Qian, C., Song, J., and Xiang, Z. (2021). Analysis of volatile oil components in Amomum villosum from different producing areas by full two-dimensional gas chromatography-quadrupole time-of-flight mass spectrometry. China Condiment 46, 142–148.
Chinese Pharmacopoeia Commission (2020). Pharmacopoeia of the people’s Republic of China. Beijing: China Medical Science Press.
Dai, S., Lin, Z., Xu, B., Wang, Y., Shi, X., Qiao, Y., et al. (2018). Metabolomics data fusion between near infrared spectroscopy and high-resolution mass spectrometry: A synergetic approach to boost performance or induce confusion. J. Talanta 189, 641–648. doi:10.1016/j.talanta.2018.07.030
Gu, W., Li, L., Rui, W., Diao, Z., Zhuang, G., Chen, X., et al. (2022). Non-targeted metabolomic analysis of variation of volatile fractions of ginseng from different habitats by HS-SPME-GC-MS coupled with chemometrics. J Anal. methods Adv. methods Appl. 14, 3583–3597. doi:10.1039/d2ay01060g
Gui, X., Li, H., Ma, R., Tian, L., Hou, F., Li, H., et al. (2023). Authenticity and species identification of fritillariae cirrhosae: A data fusion method combining electronic nose, electronic tongue, electronic eye and near infrared spectroscopy. J Front. Chem. 11, 1179039. doi:10.3389/fchem.2023.1179039
Hou, F., Guo, L., Song, J., Zhang, D., Zheng, K., Zheng, Y., et al. (2015). Study on the identification of traits and micro traits of Amomum villosum and its adulterants in Anguo market, Hebei Province. J. Nanjing Univ. Traditional Chin. Med. 35, 214–217.
Htet, T. T. M., Cruz, J., Khongkaew, P., Suwanvecho, C., Suntornsuk, L., Nuchtavorn, N., et al. (2021). PLS-regression-model-assisted Raman spectroscopy for vegetable oil classification and non-destructive analysis of alpha-tocopherol contents of vegetable oils. J. Food Compos. Analysis 103, 104119. doi:10.1016/j.jfca.2021.104119
Huang, G., Wang, Q., Ma, K., and Liu, Y. (2021). Trends in research on the primary active compounds in Amomum villosum. Food Res. Dev. 42, 219–224.
Huang, Q., Duan, Z., Yang, J., Ma, X., Zhan, R., Xu, H., et al. (2017). SNP typing for germplasm identification of Amomum villosum Lour. Based on DNA barcoding markers. J. PLoS ONE 9, e114940. doi:10.1371/journal.pone.0114940
Jiang, S., Ni, C., Chen, G., and Liu, Y. (2021). A novel data fusion strategy based on multiple intelligent sensory technologies and its application in the quality evaluation of Jinhua dry-cured hams. J Sensors Actuators B. Chem. 344, 130324. doi:10.1016/j.snb.2021.130324
Jing, W., Zhao, X., Li, M., Hu, X., Cheng, X., Ma, S., et al. (2022). Application of multiple-source data fusion for the discrimination of two botanical origins of magnolia officinalis cortex based on E-nose measurements, E-tongue measurements, and chemical analysis. Mol. (Basel, Switz. 27, 3892. doi:10.3390/molecules27123892
Lan, Z., Zhang, Y., Sun, Y., Ji, D., Wang, S., Lu, T., et al. (2020). A mid-level data fusion approach for evaluating the internal and external changes determined by FT-NIR, electronic nose and colorimeter in Curcumae Rhizoma processing. J. Pharm. Biomed. Analysis 188, 113387. doi:10.1016/j.jpba.2020.113387
Li, H., Fan, X., Wu, X., Yue, Y., Li, C., Gui, X., et al. (2023). Study on the taste-masking effect and mechanism of Acesulfame K on berberine hydrochloride. Drug Dev. Industrial Pharm. 49, 92–102. doi:10.1080/03639045.2023.2183713
Li, S., Zeng, B., Ye, Q., Ao, H., Li, H., Wang, L. J., et al. (2015). Systematic qualitative and quantitative assessment of fatty acids in the seeds of 60 tree peony (Paeonia section Moutan DC) cultivars by GC-MS. Chin. J. Exp. Traditional Med. Formulae 21, 133–140. doi:10.1016/j.foodchem.2014.10.017
Liu, R., Zhang, X., Zhang, L., Gao, X., Li, H., Shi, J., et al. (2014). Bitterness intensity prediction of berberine hydrochloride using an electronic tongue and a GA-BP neural network. Exp. Ther. Med. 7, 1696–1702. doi:10.3892/etm.2014.1614
Liu, Y., Li, B., Su, Y., Zhao, R., Song, P., Li, H., et al. (2022). Potential activity of traditional Chinese medicine against ulcerative colitis: A review. J J. Ethnopharmacol. 289, 115084. doi:10.1016/j.jep.2022.115084
Lu, G., Danchun, Z., Xiaoxia, D., Juan, H., Wan, G., Xiaohui, Q., et al. (2021). DNA barcode reference library construction and genetic diversity and structure analysis of Amomum villosum Lour. (Zingiberaceae) populations in Guangdong Province. J. PeerJ 9, e12325. doi:10.7717/peerj.12325
Nie, A., Gao, M., Zhu, C., and Zhang, B. (2018). Discussion and consideration on special decoction method for Chinese materia medica (II): Decoction later. Chin. Traditional Herb. Drugs 49, 3153–3161.
Se, K. W., Ghoshal, S. K., Wahab, R. A., Ibrahim, R. K. R., and Lani, M. N. (2018). A simple approach for rapid detection and quantification of adulterants in stingless bees (Heterotrigona itama) honey. Food Res. Int. 105, 453–460. doi:10.1016/j.foodres.2017.11.012
Suo, S., Lai, Y., Li, M., Song, Q., Cai, J., Zhao, J., et al. (2018). Phytochemicals, pharmacology, clinical application, patents, and products of Amomi fructus. J Food Chem. Toxicol. 119, 31–36. doi:10.1016/j.fct.2018.05.051
Wang, H., Song, W., Tao, W., Zhang, J., Zhang, X., Zhao, J., et al. (2021a). Identification wild and cultivated licorice by multidimensional analysis. Food Chem. 339, 128111. doi:10.1016/j.foodchem.2020.128111
Wang, H., Li, X., Wang, Y., Ren, X., Liu, X., Dong, Y., et al. (2021b). Rapid discrimination and screening of volatile markers for varietal recognition of Curcumae Radix using ATR-FTIR and HS-GC-MS combined with chemometrics. J. Ethnopharmacol. 280, 114422. doi:10.1016/j.jep.2021.114422
Weng, K., Song, L., Bao, Q., Cao, Z., Zhang, Y., Zhang, Y., et al. (2022). Comparative characterization of Key volatile compounds in slow- and fast-growing duck raw meat based on widely targeted metabolomics. Foods 11, 3975. doi:10.3390/foods11243975
Xie, D.-S., Peng, W., Chen, J.-C., Li, L., Zhao, C.-B., Yang, S.-L., et al. (2016). A novel method for the discrimination of Hawthorn and its processed products using an intelligent sensory system and artificial neural networks. J Food Sci. Biotechnol. 25, 1545–1550. doi:10.1007/s10068-016-0239-8
Xu, D., Lin, Y., Bauer, R., Chen, H.-R., Yang, R.-Q., Zou, H.-Q., et al. (2018). Organoleptic evaluation of Amomi fructus and its further background verified via morphological measurement and GC coupled with E-nose. J Evidence-Based Complementary Altern. Med. 2018, 1–9. doi:10.1155/2018/4689767
Xu, M., Wang, J., and Zhu, L. (2019). The qualitative and quantitative assessment of tea quality based on E-nose, E-tongue and E-eye combined with chemometrics. J. Food Chem. 289, 482–489. doi:10.1016/j.foodchem.2019.03.080
Xue, L. (2019). Eat right is tonic, eat wrong is poison, Family Chinese medicine tonic full guidance. Jiangxi: Science and Technology Press.
Yu, Y., and Gao, H. (2017). Chronic disease diet taboo book: Handheld devices. Jiangsu: Science and Technology Press.
Zhang, H., Bai, R., Wu, Y., Zeng, J., Jiang, H., Liu, X., et al. (2022). Multi-wavelength fusion column fingerprint technology combined with chemometric analysis to evaluate the overall quality of the Gardenia jasminoides root. Anal. Methods 14, 2051–2062. doi:10.1039/d2ay00358a
Zhang, Z., Liu, H., Lv, J., Yu, D., and Sun, M. (2020). Systematic review and Meta-analysis of efficacy and safety of Xiangsha Yangwei Pills in treatment of chronic gastritis. China J. Chin. Materia Medica 45, 2668–2676. doi:10.19540/j.cnki.cjcmm.20200102.502
Zhao, K., Li, X., Yang, J., Huang, Z., Li, C., Huang, H., et al. (2022). Protective effect of Amomum Roxb. essential oils in lipopolysaccharide-induced acute lung injury mice and its metabolomics. J J. Ethnopharmacol. 290, 115119. doi:10.1016/j.jep.2022.115119
Keywords: variety and quality evaluation, bionic sensory, volatile components, qualitative and quantitative, predictive model, amomi fructus (AF)
Citation: Hou F, Fan X, Gui X, Li H, Li H, Wang Y, Shi J, Zhang L, Yao J, Li X and Liu R (2023) Development of a variety and quality evaluation method for Amomi fructus using GC, electronic tongue, and electronic nose. Front. Chem. 11:1188219. doi: 10.3389/fchem.2023.1188219
Received: 17 March 2023; Accepted: 07 June 2023;
Published: 15 June 2023.
Edited by:
Alisa Rudnitskaya, University of Aveiro, PortugalReviewed by:
Antonio Riul Jr, State University of Campinas, BrazilKiyoshi Toko, Kyushu University, Japan
Copyright © 2023 Hou, Fan, Gui, Li, Li, Wang, Shi, Zhang, Yao, Li and Liu. This is an open-access article distributed under the terms of the Creative Commons Attribution License (CC BY). The use, distribution or reproduction in other forums is permitted, provided the original author(s) and the copyright owner(s) are credited and that the original publication in this journal is cited, in accordance with accepted academic practice. No use, distribution or reproduction is permitted which does not comply with these terms.
*Correspondence: Ruixin Liu, bGl1cnVpeGluN0AxNjMuY29t; Xuelin Li, eHVlbGlubGk0NTAwMDBAMTYzLmNvbQ==
†These authors have contributed equally to this work and share first authorship